Sustainable Growth with Profitability
43
The forecast data presented herein reflects assumed results based on conditions th Nabtesco Corporation does not make representations as to, or warrant, in whole or in ny of the forecasted presented in this document. Numerical figures presented herein are rounded down to the nearest whole unit for m al place for perc Securities Code Sustainable Growth with Nabtesco Corporation President & CEO Kazuaki KO
Transcript of Sustainable Growth with Profitability

The forecast data presented herein reflects assumed results based on conditions that are subject to change. Nabtesco Corporation does not make representations as to, or warrant, in whole or in part, the attainment or realization of any of the forecasted results presented in this document. Numerical figures presented herein are rounded down to the nearest whole unit for monetary value and rounded off to one decimal place for percentage.
Securities Code: 6268
Sustainable Growth with Profitability
Nabtesco Corporation President & CEO Kazuaki KOTANI

Agenda
1. Results for FY2015/12
2. Forecast for FY2016/12
2
3. Analysis for Midterm Growth

3
1. Results for FY2015/12

Change of the Closing Date
4
(‘TANSHIN’ *Basis) 2015 Jan. Feb. Mar. April May June July August Sep. Oct. Nov. Dec.
Nabtesco and domestic subsidiaries Q1 Q2 Q3
Overseas subsidiaries Q1 Q2 Q3 Q4
2014 2015 Jan. Feb. Mar. April May June July August Sep. Oct. Nov. Dec. Jan. Feb. Mar.
Nabtesco and domestic subsidiaries Q1 Q2 Q3 Q4
Overseas subsidiaries Q1 Q2 Q3 Q4
FY2015/12
Full-year:12-month period for both domestic and overseas companies
FY2015/3
Full-year:
■Changed the closing date from March 31st to December 31st for FY2015/12 onwards
9-month period (April 1, 2015 to December 31, 2015) for domestic companies, 12-month period for overseas companies

FY2015/12 Consolidated Results
5 *Net Profit=Net income attributable to parent company shareholders
(JPY million) 2015/12 Result (A)
Nabtesco and domestic subsidiaries (9M)
Overseas subsidiaries (12M)
2015/12 Full-year initial plan
As of May 2015 (B)
Variation (A-B)
Progress (A/B)
Sales 187,000 200,000 -13,000 93.5%
Operating profit 15,294 17,900 -2,606 85.4%
(O. P. Margin) 8.2% 9.0% -0.8pt - Non-operating profit and loss
1,124 - - -
Ordinary profit 16,418 19,700 -3,282 83.3% Extraordinary profit and loss
-1,060 - - -
Profit before taxes 15,358 - - -
Net profit* 11,059 13,400 -2,341 82.5% Net profit per share (Yen) 88.85 105.88 - -
FOREX rate US$1=¥121.03 RMB1= ¥19.37
US$1=¥115.00 RMB1= ¥18.50
- -
Dividend per share (Yen) 44 (Plan) 44 (Plan) ±0 100%
■Dividend per share remained unchanged while FY2015/12 results were below the initial targets due to the slowdown in Chinese demand
Reference:FY2015/3 Net profit per share ¥140.24

17.9
15.2
14
19
FY2015/12 Result vs. Initial Plan
6
■Sales and O.P. declined due to demand decrease in China both in hydraulic equipment and railroad equipment businesses
200
187
180
190
200
210
-0.9
-4.8
-6.1 -1.0
Sales
FY2015/12 Initial plan
FY2015/12 ResultNots1
Operating Profit
+0.3
-1.3
-2.0
+0.4
(JPY bn.)
FY2015/12 Initial plan
FY2015/12 ResultNots1
PE TE AHE IE PE TE AHE IE
Structural reform of hydraulic equipment business in response to the sluggish construction machinery demand in China ■Integration of Chinese production bases (2 plants into 1 plant) ■Reduction of production capacity in China (by 30%) ■Asset reduction in Chinese production base (Impairment loss:JPY 2.1 billion) Note 1: 9 months for Nabtesco and domestic subsidiaries and 12 months for overseas subsidiaries
(JPY bn.)

23.6
21.3
20
25
FY2015/3 vs. FY2015/12(12 Months for Reference)
7
■Robust demand for industrial robot and M&A effect led to an increase in sales, but slowdown of Chinese market negatively affected O.P.
220
229
210
220
230
+3.7
-0.4 -1.2
+7.1
Sales
FY2015/3 FY2015/12 (Reference)Note2
Operating Profit
+0.6
-1.0
-2.9
+1.0
FY2015/3 FY2015/12 (Reference)Note2
PE: Sales and O.P. increased for precision reduction gears due to robust demand for industrial robots and others TE:O.P. dropped due to product mix and cost increase AHE:Sales and O.P. increased for aircraft equipment due to the currency effect but decreased for hydraulic equipment despite the M&A effect, being influenced by the weak Chinese construction machinery demand IE:Sales and O.P. increased due to the M&A effect for FY2015/3 and accounting method standardization
Note 2: Please note that the estimates for FY2015/12 (Reference) were calculated for the period of 12 months to make comparisons with the plan for FY2016/12 under the same conditions.
PE TE AHE IE PE TE AHE IE
(JPY bn.) (JPY bn.)

BS Statement
8
(JPY Million) 2015/3 (As of March 31, 2015)
2015/12 (As of Dec. 31, 2015)
Variation
Assets 245,992 233,381 -12,611
(Cash and time deposits) 51,157 35,068 -16,088
(Accounts receivable) 57,115 59,750 2,635
(Inventory) 25,165 28,421 3,256
(Tangible fixed assets) 56,877 55,916 -960
Liabilities 87,327 84,456 -2,871
(Interest-bearing debt) 16,659 15,333 -1,326
Net assets 158,664 148,924 -9,739
(Stock acquisition right) 391 379 -11
(Minority interests) 8,410 6,476 -1,934
Equity capital 149,862 142,068 -7,793
※ Equity ratio: 60.9% 60.9%
Remarks: l Share buyback
JPY -9,999 million
Remarks: l Capital surplus
JPY -4,752 million l Translation
adjustment JPY -1,379 million
l Other unrealized gain on securities JPY -1,288 million
■Maintaining healthy BS with proactive investments for future growth and share buyback

9
2. Forecast for FY2016/12

Change of the Closing Date
10
(Reference) 2015 Jan. Feb. Mar. April May June July August Sep. Oct. Nov. Dec.
Nabtesco and domestic subsidiaries Q1 Q2 Q3 Q4
Overseas subsidiaries Q1 Q2 Q3 Q4
2016 Jan. Feb. Mar. April May June July August Sep. Oct. Nov. Dec.
Nabtesco and domestic subsidiaries Q1 Q2 Q3 Q4
Overseas subsidiaries Q1 Q2 Q3 Q4
FY2015/12
Full-year:12-month period for both domestic and overseas companies
FY2016/12
Full-year:
■Adjusted FY2015/12 results to make YoY comparison with forecast for FY2016/12
12-month period for both domestic and overseas companies (with addition of the yellow part)

Forecast for FY2016/12
11
■Target for FY2016/12 : Record high for sales, O.P. and net profit ■Increase dividend per share to 50 yen, up 6 yen relative to FY2015/12
(JPY million) 2015/12 Result
(Reference Note2) (A)
2016/12 Plan (B)
Variation (B-A)
Ratio ((B-A)/A)
2015/12 Result
(‘TANSHIN’ basis)
Sales 228,949 250,000 21,051 9.2% 187,000
O.P. 21,308 25,500 4,192 19.7% 15,294
(O.P. Margin) 9.3% 10.2% 0.9pt - 8.2%
Ordinary profit 22,388 27,000 4,612 20.6% 16,418
Net Profit* 14,796 18,900 4,104 27.7% 11,059
ROA 6.2% 7.6% - - 4.6%
ROE 10.1% 12.5% - - 7.6%
Dividend per share (Yen) 50 yen (plan) 44yen (plan)
Payout Ratio 32.7%(plan) 49.5%Note3(plan)
*Net profit=Net profit attributable to parent company shareholders Please refer to “Notes” for details related to Note 2 and Note 3.

21.3
25.5 7.3 0.8
-0.8 -1.2
-2.1
Consolidated Profit & Loss Forecast (Analysis of Changes in Operating Profit)
12
* Fluctuations in operating profit owing to the increase of sales and SG&A expenses are based on the calculation without FOREX effect. **: FOREX sensitivity in O. P. (This represents the effect to be expected on operating profit if the exchange rate fluctuates by one yen): (US$): 91 million (RMB) 55 million、 (EUR): minimal, (CHF): minimal Please refer to “Notes” for details related to Note2.
2015/12 Result (Reference)Note 2
2016/12 Plan
(JPY bn.)
Remarks: ● Increase in R&D expenses ● Cost increase for subsidiaries ● IT-related expenses
FOREX effect(**)
15/12(Result) US$1=¥121.03 RMB1=¥19.37 EUR1=¥133.69 CHF1=¥125.75 16/12(Forecast) US$1=¥115.00 RMB1=¥18.00 EUR1=¥130.00 CHF1=¥120.00
Increase of sales *
Productivity improvement, etc
Decrease in D&A
Increase in SG&A expenses,etc*)
30
20
10
0

Precision Equipment Segment
13
Results and Plan
3.8 3.5 4.9 5.6 38.9 47.9 50.4 55.3
42.8 51.5 55.3 61.0
0.0
20.0
40.0
60.0
80.0 Precision Reduction Gears Others
Sales (JPY bn.)
Main Change Contributors (16/12 vs 15/12(Reference Note2)) Precision reduction gears:
Full-year Full-year Full-year (Reference Note2) Full-year Plan 2014/3 2015/3 2015/12 2016/12
O.P. (JPY bn.) 6.5 8.3 9.0 8.8 O.P.Margin 14.0% 16.2% 16.3% 14.4%
■Sales will increase driven by robust demand for automation equipment including industrial robots ■Smooth launch of the new Chinese plant for precision reduction gears
Sales will grow, being supported by the high growth rate (6%) of the industrial robot market, which is due to robust automobile production and progress in automation as well as by the expansion of other FA-related businesses. Sales of drive units for wind turbines will decrease.
O.P. will be temporarily compressed due to depreciation increase from capex and costs related to the new Chinese plant, despite sales increase in the precision reduction gear business.
New energy equipment:
Operating profit (segment):
Note 2: Please note that the estimates for FY2015/12 (Reference) were calculated for the period of 12 months to make comparisons with the plan for FY2016/12 under the same conditions.
Transport Equipment Segment
14
Results and Plan
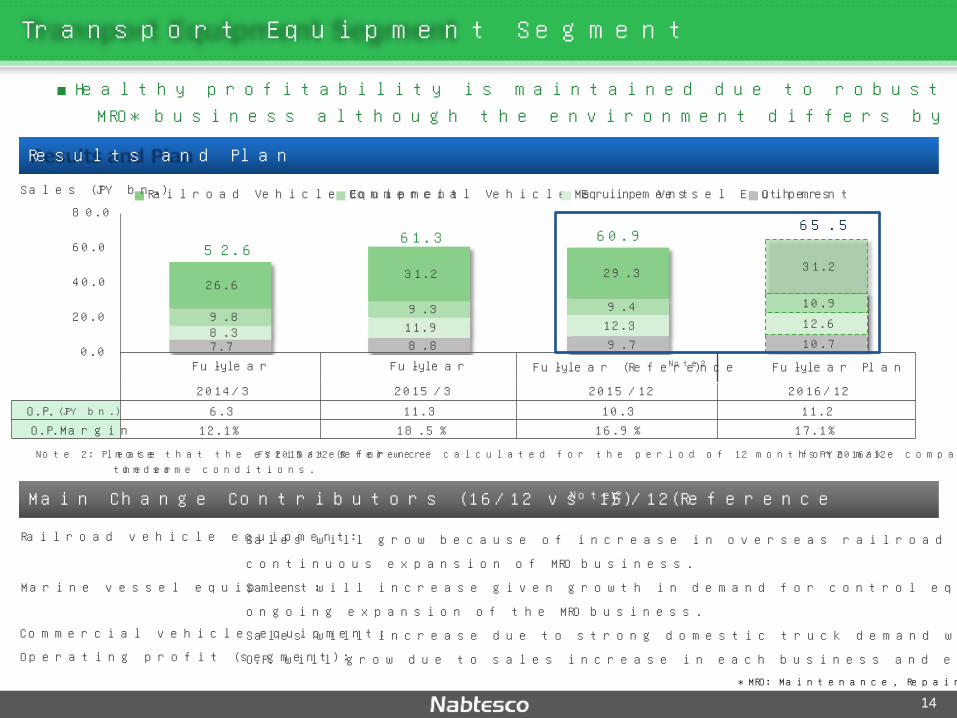
7.7 8.8 9.7 10.7 8.3 11.9 12.3 12.6 9.8 9.3 9.4 10.9 26.6
31.2 29.3 31.2 52.6
61.3 60.9 65.5
0.0
20.0
40.0
60.0
80.0 Railroad Vehicle Equipment Commercial Vehicle Equipment Marine Vessel Equipment Others
Full-year Full-year Full-year (Reference Note2) Full-year Plan 2014/3 2015/3 2015/12 2016/12
O.P. (JPY bn.) 6.3 11.3 10.3 11.2 O.P.Margin 12.1% 18.5% 16.9% 17.1%
Main Change Contributors (16/12 vs 15/12(Reference Note2))
Railroad vehicle equipment:
■Healthy profitability is maintained due to robust demand and expansion of MRO* business although the environment differs by business
Sales will grow because of increase in overseas railroad vehicle demand including China and continuous expansion of MRO business. Sales will increase given growth in demand for control equipment for computerized engines and ongoing expansion of the MRO business. Sales will increase due to strong domestic truck demand while demand in ASEAN countries will remain weak. O.P. will grow due to sales increase in each business and expansion of MRO business.
*MRO: Maintenance, Repair, Overhaul
Marine vessel equipment:
Commercial vehicle equipment: Operating profit (segment):
Note 2: Please note that the estimates for FY2015/12 (Reference) were calculated for the period of 12 months to make comparisons with the plan for FY2016/12 under the same conditions.
Sales (JPY bn.)

Aircraft and Hydraulic Equipment Segment
15
Results and Plan
19.8 20.7 23.3 22.0
32.6 27.1 23.1 25.3
52.5 47.8 46.5 47.4
0.0
20.0
40.0
60.0
80.0 Hydraulic Equipment Aircraft Equipment
Full-year Full-year Full-year (Reference Note2) Full-year Plan
2014/3 2015/3 2015/12 2016/12 O.P. (JPY bn.) 3.8 0.9 -1.9 0.0 O.P.Margin 7.4% 2.1% -4.2% 0.0%
Main Change Contributors (16/12 vs 15/12(Reference Note2))
■Profitability will be improved through structural reform of hydraulic equipment business
Sales will decrease due to off-crop season, which will last until mass production starts under new programmes in the private sector and also because of stronger yen. Sales will increase due to the recovery of actual production demand for construction machines in China and full-year effect of the acquisition of Hyest Corporation. Aims to attain break-even level by sales increase in the hydraulic equipment business and through its structural reform effects.
Aircraft equipment:
Hydraulic equipment:
Operating profit (segment):
Note 2: Please note that the estimates for FY2015/12 (Reference) were calculated for the period of 12 months to make comparisons with the plan for FY2016/12 under the same conditions.
Sales (JPY bn.)
Industrial Equipment Segment
16
Results and Plan
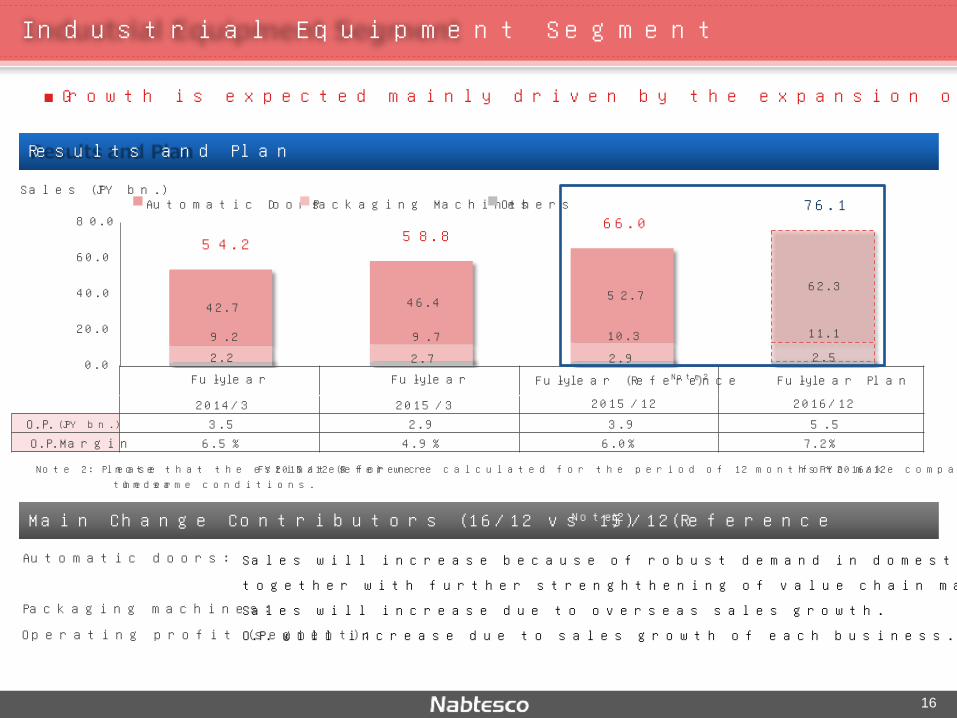
2.2 2.7 2.9 2.5 9.2 9.7 10.3 11.1
42.7 46.4 52.7 62.3
54.2 58.8 66.0
76.1
0.0
20.0
40.0
60.0
80.0 Automatic Doors Packaging Machines Others
Full-year Full-year Full-year (Reference Note2) Full-year Plan
2014/3 2015/3 2015/12 2016/12 O.P. (JPY bn.) 3.5 2.9 3.9 5.5 O.P.Margin 6.5% 4.9% 6.0% 7.2%
Main Change Contributors (16/12 vs 15/12(Reference Note2))
■Growth is expected mainly driven by the expansion of automatic doors business
Sales will increase because of robust demand in domestic and overseas markets, together with further strenghthening of value chain management and M&A effects. Sales will increase due to overseas sales growth. O.P. will increase due to sales growth of each business.
Automatic doors:
Packaging machines:
Operating profit (segment):
Note 2: Please note that the estimates for FY2015/12 (Reference) were calculated for the period of 12 months to make comparisons with the plan for FY2016/12 under the same conditions.
Sales (JPY bn.)

Consolidated Cash Flow
17
14,055 14,892
27,997
15,104 12,952
27,597
19,949
8,746
27,700
-9,329 -6,155 -4,419
-27,464
-13,693
-8,064 -7,880 -4,886
-23,800
4,726 8,737
23,578
-12,359
-741
19,533 12,068
3,859 3,800
-35,000
-25,000
-15,000
-5,000
5,000
15,000
25,000
35,000
2014/3 2015/3 2010/3 2011/3 2012/3 2013/3 2009/3 2015/12 Note 1
(JPY million) Free Cash Flow Investment Cash Flow Operating Cash Flow
2016/12 (Plan)
■ FCF will remain positive due to continuous generation of operating cash flow although large-scale capex projects are planned to be implemented.
Note 1: 9 months for Nabtesco and domestic subsidiaries and 12 months for overseas subsidiaries

18
3. Analysis for Midterm Growth

Final Year of Midterm Management Plan (2017/3) vs. 2016/12 (Plan)
19
■Businesses mainly fostered in developed countries are expected to grow as initially planned, while the growth of the businesses which are more focusing on developing countries tends to slow down
280.0
250.0
-5.0
-5.5
-18.6 -0.9
Sales
2017/3 (Midterm Plan)*
2016/12 (Plan)
Operating Profit
34.0
25.5
-2.4
+0.5
-5.9 -0.7
(JPY bn.)
Businesses which will grow as planned (2017/3 midterm plan) driven by growth in developed countries Precision reduction gears1, marine vessel equipment2, aircraft equipment3, automatic doors4
Businesses the growth of which may decelerate due to economic flunctuations in China and Southeastern countries Railroad vehicle equipment2, commercial vehicle equipment2 , hydraulic equipment3, packaging machines4
Business which is worse than expected due to the delayed launch of the solar thermal power generation market, the potential new market to explore New energy equipment1
*2017/3 Mitdterm Management Plan was announced in May, 2014.
(JPY bn.)
280.0
260.0
240.0
35.0
30.0
25.0 PE1 TE2 AHE3 IE4 2017/3
(Midterm Plan)* 2016/12 (Plan)
PE1 TE2 AHE3 IE4

2013 2014 2015 2020
Japanese Defense Private
0 100,000 200,000 300,000 400,000
2013 2014 2015 2016 2017 2018
China Others
Main Growth Contributors in the Mid- to Long-term Term
20
Businesses grow with markets
■Precision Reduction Gears
Businesses grow through individual market strategy
■Automatic Doors
(Units) Global: CAGR 15%
Worldwide Annual Shipment of Industrial Robots
China: CAGR 25%
■Aircraft Equipment Expansion of MRO
for the new programs
Sales of Aircraft Equipment Business
New programs received ・2008:MRJ ・2013:B737MAX ・2015:B777X
Sales for private sector will be double (early 2020s)
■Hydraulic Equipment
■Railroad Vehicle Equipment :Grow due to the penetration in the European market
:Grow due to the share increase in North America and Europe
:Grow due to the expansion of product line-up

2014/3 2015/3 2015/12(12m) 2014/3 2015/3 2015/12(12m)
Investment for Future Growth and Share Buyback
21
<Upfront Investment> ・R&D ・Advertisement ・IT related expenses ・Maintenance expense at overseas
<CAPEX> ・Capacity expansion (PE,AHE) ・Higher productivity and environmental efficiency (Investment in factory modernization) <M&A etc.> ・European base for railroad vehicle equipment ・Subsidiary for hydraulic equipment ・Distribution channel for automatic doors
Proactive Investment for Future Growth
8.0 9.0
15.0
■ SG&A ■ Strategic investment
Continuous and Stable Shareholder Return
(JPY Billion)
■Shareholder Return
34yen 34yen 38yen 44yen 44yen 29.1% 32.5% 32.2% 31.4%
49.5%
10%
20%
30%
40%
50%
60%
70%
80%
¥0
¥50
¥100
¥150
¥200
2012/3 2013/3 2014/3 2015/3 2015/12 Plan
(9M)
DPS Payout ratio
・Dividend policy:more than 30% payout ratio and stable dividend ・First-time ¥10bn-scale-share buyback for shareholder return purpose ⇒ Five-year accumulated total shareholder return : approx. 48%
5 year accumulated payout ratio: 34.0%
3.3 3.7
4.2

-300
-150
0
150
300
Operaitng CF
Investing CF
FCF
Financial Strategy
22
■ Pursuing both growth investment and shareholder return through sustainable CF generation and sound balance sheet
Sustainable CF generation ⇒ Five-year average operating CF: Approx. ¥20 billion/year
-Acquisition of European automatic door business -Capacity expansion (PE)
B/S (as of 15/12) -Liquidity on hand: approx. ¥35.0 billion -Shareholders’ equity: approx. ¥140.0 billion -Equity Ratio*: 60.9% ⇒ While maintaining the credit rating “A”, equity ratio could be reduced to 45% level (Debt capacity level: ¥80 billion) ・Without equity finance in principle
-Capacity expansion (PE, AHE)
2011/3 2012/3 2013/3 2014/3 2015/3
Resources for Improving Corporate and Shareholders’ Value
■Cash Flow
■Debt Capacity
2015/12Note1 2016/12
Note 1: 9 months for Nabtesco and domestic subsidiaries and 12 months for overseas subsidiaries
*Equity Ratio: Shareholders’ Equity/Total Asset
(JPY Billion)

Technology Innovation & Market Creation
23
Technology Innovation
l Nabtesco Digital Engineering Center at the Kyoto Research Park l Joint Research with Oversea Universities -Technical University of Denmark, University of Washington and
Edigenossische Technische Hochschule Zurich
■Open innovation for new business creation
■Modernization of production bases : Environmental efficiency and productivity improvement
■Acceleration of overseas expansion l Enhancement of European sales base (will be utilized for the entire Nabtesco Group) l Establishment of the India Liaison Office
l Reduce over 40% of CO2 emission (New factory for precision reduction gears in China) l Double productivity and half CO2 emission (aircraft equipment) l Energy saving, labor saving, automation and shorter lead time through the installment of new facilities
Market Creation
■M&A l Obtaining the sales and production base in Europe (railroad equipment) l Acquisition of distribution channels in North America (automatic doors) l Expanding the product lineup (hydraulic equipment)
(To be achieved in FY2020) The Group’s long-term targets
Reduce per-unit CO2 emissions by 20% (from the 2012 level)

Notes
24
Note 1: 9 months for Nabtesco and domestic subsidiaries and 12 months for overseas subsidiaries
Note 3: The Company has changed the closing date from March 31 to December 31 effective from the fiscal year 2015/12. Accordingly, the consolidated fiscal year ended December 2015 is a transitional period, in which the consolidated operating results cover nine months (April 1, 2015 to December 31, 2015) for companies that close their accounts in March, in contrast to 12 months (January 1, 2015 to December 31, 2015) for companies that close their accounts in December. Payout ratio on a consolidated basis is higher than the payout ratio set in the current dividend policy (30%-40%).
Note 2: Please note that the estimates for FY2015/12 (Reference) were calculated for the period of 12 months to make comparisons with the plan for FY2016/12 under the same conditions.
Abbreviations PE: Precision Equipment Segment TE: Transport Equipment Segment AHE: Aircraft & Hydraulic Equipment Segment IE: Industrial Equipment Segment

Appendix
25

Topics
26
・Announced the establishment of production facilities for precision reduction gears in China and the reorganization of the hydraulic equipment business in the country
・Announced the acquisition of HYEST Corporation. Mar 2015
Feb 2015
・Announced the transformation of the gear machining company in China into a wholly-owned subsidiary, which would serve as a production base for precision reduction gears
・Awarded a contract for Boeing 777X flight control actuation systems
Apr 2015 ・Included in the FTSE4Good Index Series (global index for socially responsible investment) 12 times in a row
・Received an order for passenger doors from Siemens AG for the Rennes line B in France under the Siemens AG’s Neoval Project
Jul 2015 ・Transferred NDEC (Nabtesco Digital Engineering Center) to Kyoto Research Park, to further innovate product development process through utilization of metal 3D printer
Sep 2015 ・Started to enhance production capacity for aircraft equipment business (start of production in FY2016)
Oct 2015 ・Set the Corporate Governance Basic Policy
Dec 2015 ・Conducted acquisition and retirement of treasury stock at the aim of shareholder return for the first time
Jan 2016 ・ Selected for the first time as a member in RobecoSAM AG’s “Sustainability Yearbook 2016”
・Selected for the third time for inclusion in the Dow Jones Sustainability Asia Pacific Index (global benchmark for socially responsible investment)
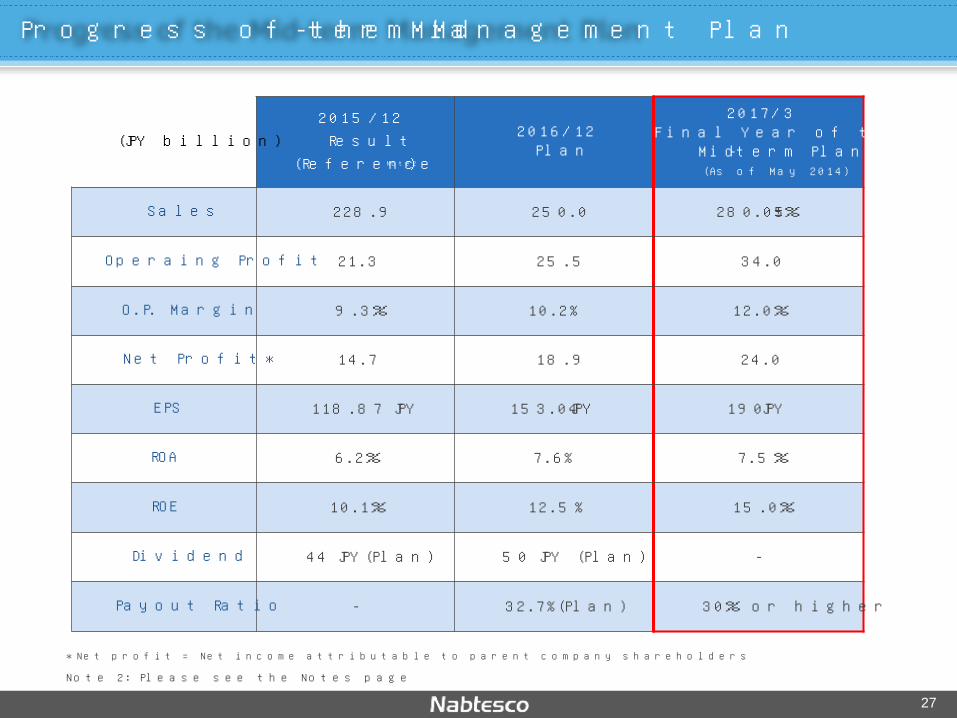
Progress of the Mid-term Management Plan
27
(JPY billion) 2015/12
Result (ReferenceNote2)
2016/12 Plan
2017/3 Final Year of the Current
Mid-term Plan (As of May 2014)
Sales 228.9 250.0 280.0±5%
Operaing Profit 21.3 25.5 34.0
O.P. Margin 9.3% 10.2% 12.0%
Net Profit* 14.7 18.9 24.0
EPS 118.87 JPY 153.04 JPY 190 JPY
ROA 6.2% 7.6% 7.5%
ROE 10.1% 12.5% 15.0%
Dividend 44 JPY(Plan) 50 JPY (Plan) -
Payout Ratio - 32.7%(Plan) 30% or higher
Note 2: Please see the Notes page *Net profit = Net income attributable to parent company shareholders

CAPEX, R&D and Depreciation
28
(JPY million)
2015/12 Result
(9 months for Nabtesco and domestic subsidiaries,
12 months for overseas subsidiaries)
2015/3 Result
2016/12 Plan
Accumulated Total*
15/3, 15/12(9m),16/12(plan)
Midterm Plan (15/3~17/3 Accumulated
Total) As of May, 2014
CAPEX 8,982 6,918 20,000 35.9 bn. 45.0 bn.
R&D 5,800 6,876 8,200 20.8 bn. 23.0 bn.
Depreciation 6,363 6,258 8,600 21.2 bn. 23.0 bn.
■2015/12: Appropriate CAPEX including the construction of the new Chinese plant for precision reduction gears ■2016/12: Construction of new buildings for the aircraft equipment business and modernization of each plant (planned)
*Accumulated total includes 2015/3 results (12 months), 2015/12 results (9 months) and 2016/12 plan (12 months), 3 months fewer for Nabtesco and domestic subsidiaries relative to the accumulated total plan announced in May, 2014

Breakdown in CAPEX
29
By Segment
6,918 JPY million
2015/3 Result
6,918 JPY million
Productivity Improvement 50%
Production Increase
9%
New Products 13%
Others (Renewal, Safety and Environment)
28%
HQ 19%
Industrial 27%
Aircraft & Hydraulic 17%
Transport 22%
Precision 15%
By Usage
8,982 JPY million
2015/12 Result※Note1
8,982 JPY million
Productivity Improvement 32%
Production Increase
30%
New Products 14%
HQ 10%
Industrial 18%
Aircraft & Hydraulic 18% Transport
14%
Precision 40%
l Modernization of plants incl. facility replacement in Japan and abroad
l Precision reduction gears: - New plant construction in China - Capacity expansion at Tsu Plant
Others (Renewal, Safety and Environment)
24%
l Renewal of company houses l Improvement of IT
infrastructure
2016/12 Plan
20,000 JPY million
20,000 JPY million
Productivity Improvement 36%
Production Increase
36%
New Products 12%
HQ 4%
Transport 20%
Precision 30%
Others (Renewal, Safety and Environment)
16%
Note 1: 9 months for Nabtesco and domestic subsidiaries and 12 months for overseas subsidiaries
l Environment-related investments
l R&D-related investments
Industrial 10%
Aircraft & Hydraulic 36%
l Modernization of plants incl. facility replacement in Japan and abroad
l Precision reduction gears: - Installation of new facilities in the new China plant
l Aircraft equipment: - Capacity expansion at Gifu Plant

Main Customers
nPrecision Reduction Gears Industrial Robots: Fanuc, Yaskawa Electric, KHI, KUKA Roboter (Germany), ABB Robotics (Sweden) Machine Tools: Yamazaki Mazak, Okuma, DMG Mori Seiki
nNew Energy Equipment Solar Tracking Equipment: Cobra Thermosolar Plant (Spain) Drive Units for Wind Turbines: MHI, Hitachi, Ltd., Others
Main Products: Precision Equipment Segment
30
Others Nabtesco 60%
No.1
Others Nabtesco 60%
No.1
Precision Reduction Gears
n Joints of Industrial Robots
n Machine Tool ATCs (ATC = Automatic Tool Changer)
Approx. 60% world market share
Approx. 60% domestic market share
New Energy Equipment
n Solar Tracking Equipment Drive Units for Wind Turbines

Marine Vessel Equipment
Railroad Vehicle Equipment
Commercial Vehicle Equipment
Main Products: Transport Equipment Segment
31
Main Customers
n Railroad Vehicle Equipment JR Companies, Private railway companies, KHI, Bullet train and subway projects in China
n Commercial Vehicle Equipment Hino, Mitsubishi Fuso Truck & Bus, Isuzu, UD Trucks
n Marine Vessel Equipment KHI, Mitsui Engineering & Shipbuilding, MHI, Hitachi Zosen, Makita, Hyundai Heavy Industries (Korea), Doosan Engine (Korea), Hudong Heavy Machinery (China), MAN Diesel (Denmark)
n Brake Systems Others Nabtesco 50% Approx. 50% Domestic Market Share No.1
n Door Operating Systems Others Nabtesco 70% Approx. 70% Domestic Market Share No.1
n Wedge Chambers Others Nabtesco 70% Approx. 70% Domestic Market Share No.1
n Air Dryers Others Nabtesco 85% Approx. 85% Domestic Market Share No.1
n 2ST Main Engine Control Systems Nabtesco 60% No.1 Approx. 60% Domestic Market Share (Approx. 40% World Market Share)
Others

Hydraulic Equipment
n Flight Control Actuation Systems (FCA) l One of the four major world players for FCA systems (major FCA supplier to Boeing Company) l Expanding business into engine accessories
and power supply systems
Main Products: Aircraft & Hydraulic Segment
32
Aircraft Equipment
Main Customers
■Aircraft Equipment Boeing, KHI, MHI, IHI, Japanese Ministry of Defense, Airlines
n Hydraulic Equipment Komatsu, Kobelco Construction Machinery, Kubota, Sumitomo Construction Machinery, Hitachi Construction Machinery, Sany、 Zoomlion、XCMG、 LiuGong
Nabtesco 100% Approx. 100%
market share for domestically-produced aircrafts
No.1
Others Nabtesco 30%
Approx. 30% world market share
No.1
n Traveling Units for Hydraulic Excavators

n Automatic Doors
Main Products: Industrial Equipment Segment
33
Main Customers
n Automatic Doors Automatic Doors for buildings: Major general contractors, sash manufacturers, hospitals, banks, public insititutions, etc. Platform Doors: Subway projects in France and China, others
Others Nabtesco 50% Approx. 50%
market share for building automatic doors (top share in the world)
No.1
n Packaging Machines for Retort Pouch Foods
n Platform Screen Doors Others
Nabtesco 95%
Approx. 95% domestic market share
(accumulated total)
No.1
Others Nabtesco
85% Approx. 85%
domestic market share
No.1
n Packaging Machines Mitsui Sugar, Ajinomoto, Marudai Food Co., Ltd., ARIAKE Japan, KENKO Mayonnaise, P&G, Kao, Lion, beverage companies in North America, food companies in China
Automatic Doors
Packaging Machines

27,589 29,575 41,798 47,956 54,264 58,863 66,050 76,100 41,492
59,106 64,240 45,746
52,533 47,857 46,580 47,400
41,888 48,182
48,289 44,262
52,641 61,388 60,981 65,500
15,278
32,438
44,199 41,578
42,853 51,547 55,336
61,000
126,249
169,303
198,527 179,543
202,292 219,657 228,949
250,000
0
50,000
100,000
150,000
200,000
250,000
300,000
1,902 2,220 2,646 3,608 3,526 2,908 3,936 5,500 1,804 5,609 6,130 1,836 3,862
995
-1,971
0 3,654
5,915 6,068
4,214
6,344 11,355 10,332
11,200
603
6,466 8,013
5,354
6,359 8,356 9,009 8,800
7,964
20,212 22,858
15,013
20,092 23,615 21,308
25,500
6.3%
11.9% 11.5%
8.4% 9.9%
10.8% 9.3%
10.2%
0.0%
5.0%
10.0%
15.0%
20.0%
25.0%
30.0%
-5,000
0
5,000
10,000
15,000
20,000
25,000
30,000
35,000
Result and Forecast for Sales and Operating Profit by Business Segment
34
(JPY Million)
(JPY Million)
Sales
Operating Profit/Margin O.P.
O.P.Margin
2010/3 2011/3 2012/3 2013/3 2014/3 2015/3 2015/12Note2 2016/12 Plan
Precision Transport Aircraft & Hydraulic Industrial
Please refer to ‘Notes’ for details related to Note2.

Results and Forecast for Sales by Business
35
Transport Equipment Segment
2.1 3.8 3.5 3.5 5.6
39.4 38.9 47.9
41.7
55.3
41.5 42.8 51.5
45.3
55.3 61.0
Full-year
Result
Full-year
Result
Full-year
Result
Full-year
Result
(Apr.-Dec.)
Full-year
Result
(Jan.-Dec.)
Full-year Plan
2013/3 2014/3 2015/3 2015/12 2015/12 2016/12
Precision Reduction Gears Others Precision Equipment Segment
(JPY bn.)
6.7 7.7 8.8 7.3 10.7
7.9 8.3 11.9 9.9
12.6 9.0 9.8 9.3
7.2
10.9 20.5
26.6 31.2
22.3
31.2 44.2 52.6
61.3
46.8
60.9 65.5
Full-year
Result
Full-year
Result
Full-year
Result
Full-year
Result
(Apr.-Dec.)
Full-year
Result
(Jan.-Dec.)
Full-year Plan
2013/3 2014/3 2015/3 2015/12 2015/12 2016/12
Railroad Vehicle Equipment Commercial Vehicle Equipment Marine Vessel Equipment Others
50.4
4.9
29.3
9.4
12.3
9.7
(JPY bn.)
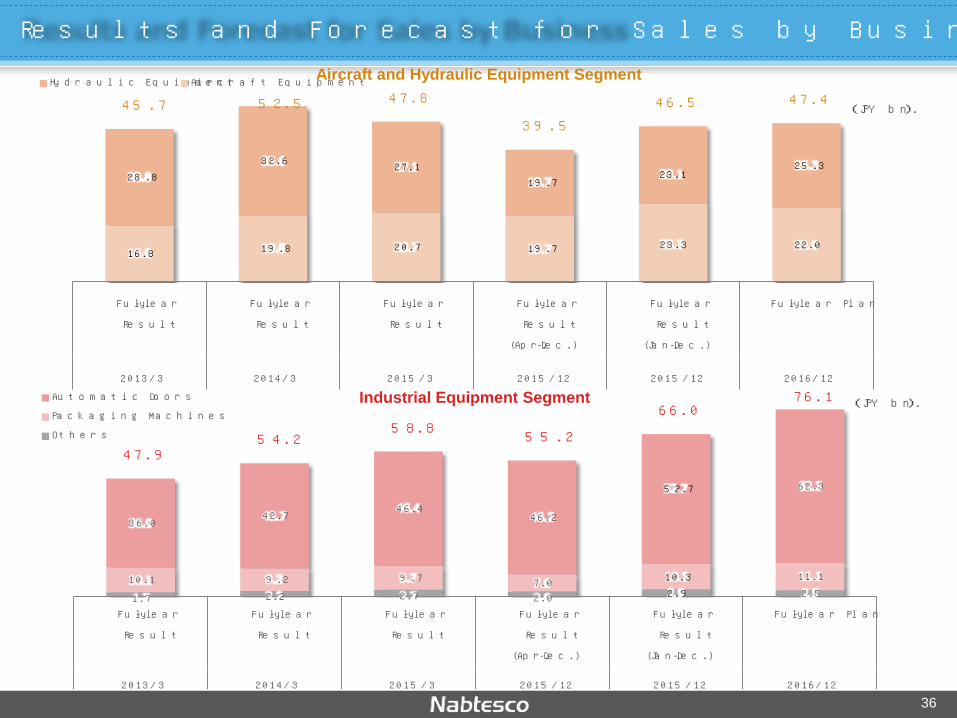
16.8 19.8 20.7 19.7 22.0
28.8 32.6 27.1
19.7 25.3
45.7 52.5 47.8
39.5 46.5 47.4
Full-year
Result
Full-year
Result
Full-year
Result
Full-year
Result
(Apr.-Dec.)
Full-year
Result
(Jan.-Dec.)
Full-year Plan
2013/3 2014/3 2015/3 2015/12 2015/12 2016/12
Hydraulic Equipment Aircraft Equipment
1.7 2.2 2.7 2.0 2.5 10.1 9.2 9.7 7.0 11.1
36.0 42.7 46.4 46.2
62.3
47.9 54.2
58.8 55.2 66.0
76.1
Full-year
Result
Full-year
Result
Full-year
Result
Full-year
Result
(Apr.-Dec.)
Full-year
Result
(Jan.-Dec.)
Full-year Plan
2013/3 2014/3 2015/3 2015/12 2015/12 2016/12
Automatic Doors Packaging Machines Others
Results and Forecast for Sales by Business
36
Aircraft and Hydraulic Equipment Segment
Industrial Equipment Segment
23.1
23.3
52.7
10.3 2.9
(JPY bn.)
(JPY bn.)

14 16 13 9
25 34 34 38
44 44 50
77.00 86.77
34.82 31.70
105.91 116.74 104.57
117.95 140.24
88.85
153.04
18.2% 18.4%
37.3%
28.4% 23.6% 29.1%
32.5% 32.2% 31.4%
49.5%
32.7%
0%
10%
20%
30%
40%
50%
¥0
¥50
¥100
¥150
¥200
2007/3 2008/3 2009/3 2010/3 2011/3 2012/3 2013/3 2014/3 2015/3 2015/12
*Note3
2016/12
(Plan)
DPS EPS Payout Ratio
Result and Forecast for Dividends
37
Please refer to “Notes” for details related to Note 3.
■ Maintaining more than 30% payout ratio while ensuring stable payments

ROA/ROE
38
-20,000
-10,000
0
10,000
20,000
30,000
2005/3 2006/3 2007/3 2008/3 2009/3 2010/3 2011/3 2012/3 2013/3 2014/3 2015/3 2015/12
(9m)
2016/12
(Plan)
FCF
Net profit
0.0%
2.5%
5.0%
7.5%
10.0%
12.5%
15.0%
17.5%
ROE
OPM
ROA
• Cash-out due to acquisition of Gilgen • Capacity expansion at the Tsu Plant for precision reduction gears Financial crisis

Data Book
39

Segment Sales and OP
40
Segment Term 2015/12 Result (A)
Nabtesco and domestic subsidiaries (9M)
Overseas subsidiaries (12M)
2015/12 Plan
As of May 2015(B)
Variation (A-B)
PE
Sales 45,327 46,300 -973
OP (OPM)
6,824 (15.1%)
6,500 (14.0%)
324 (1.1 pt)
TE
Sales 46,848 51,700 -4,852
OP (OPM)
7,890 (16.8%)
9,200 (17.8%)
-1,310 (-1.0pt)
AHE
Sales 39,524 45,700 -6,176
OP (OPM)
-2,029 (-5.1%)
0 (0.0%)
-2,029 (-5.1pt)
IE
Sales 55,299 56,300 -1,001
OP (OPM)
2,610 (4.7%)
2,200 (3.9%)
410 (0.8%)
(JPY million)
The Company changes the closing date from March 31 to December 31. Accordingly, the year-on-year results are not indicated for the consolidated results for FY2015/12, which is a transitional period.

FOREX
41
Item Currency
2015/12 Result (A) Nabtesco and domestic
subsidiaries (9M) Overseas subsidiaries
(12M)
2015/12 Plan
As of May 2015(B)
2016/12 Plan
2015/3 Result
Currency
USD 121.03 115.00 115.00 106.46
RMB 19.37 18.50 18.00 17.30
EUR 133.69 124.00 130.00 140.35
CHF 125.75 118.00 120.00 115.70
FOREX sensitivity
in O.P.* (JPY million)
USD 57 92 91 91
RMB -32 Minimal 55 Minimal
EUR Minimal Minimal Minimal Minimal
CHF Minimal Minimal Minimal Minimal
*This represents the effect to be given to operating profit if the exchange rate fluctuates by one yen
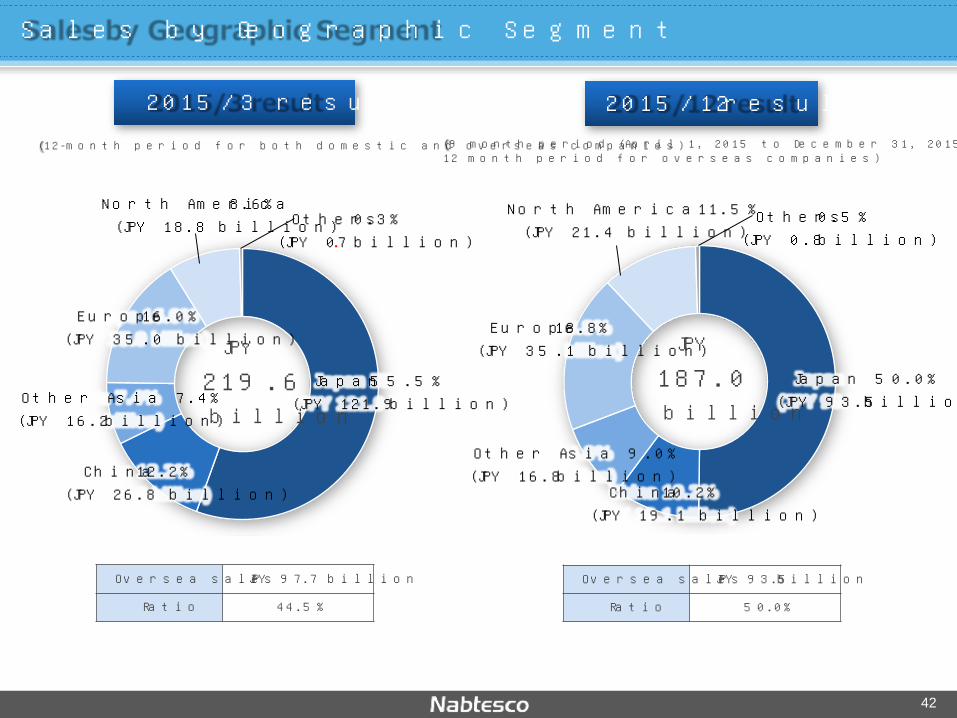
Sales by Geographic Segment
North America11.5% (JPY 21.4 billion)
Japan 50.0% (JPY 93.5 billion)
Europe 18.8% (JPY 35.1 billion)
Other Asia 9.0% (JPY 16.8 billion)
Others 0.5% (JPY 0.8 billion)
JPY 187.0 billion
China 10.2% (JPY 19.1 billion)
2015/12 result
42
Oversea sales JPY 93.5 billion
Ratio 50.0%
North America 8.6% (JPY 18.8 billion)
Japan 55.5% (JPY 121.9 billion)
Europe 16.0% (JPY 35.0 billion)
Other Asia 7.4% (JPY 16.2 billion)
Others 0.3% (JPY 0.7 billion)
JPY 219.6 billion
China 12.2% (JPY 26.8 billion)
2015/3 result
Oversea sales JPY 97.7 billion
Ratio 44.5%
(12-month period for both domestic and overseas companies) (9 month period (April 1, 2015 to December 31, 2015) for domestic companies, 12 month period for overseas companies)

43