Sustainable Energy for All Forum 4 – 6 June, 2014 SE4ALL ... Energy for All Forum 4 – 6 June,...
14
Sustainable Energy for All Forum 4 – 6 June, 2014 SE4ALL Multi-Stakeholder Partnerships Day Sharing Knowledge & Experiences, Developing Capacity – Asia-Pacific Initiatives on SE4ALL 4 June, 2014, Executive Conference Room C United Nations, New York
Transcript of Sustainable Energy for All Forum 4 – 6 June, 2014 SE4ALL ... Energy for All Forum 4 – 6 June,...

Sustainable Energy for All Forum
4 – 6 June, 2014
SE4ALL Multi-Stakeholder Partnerships Day
Sharing Knowledge & Experiences, Developing Capacity – Asia-Pacific
Initiatives on SE4ALL
4 June, 2014, Executive Conference Room C
United Nations, New York

ESCAP: Overview
� 53 members of ESCAP
� 9 associated members
� Rapid economic growth
� High population density
� 40% of the world’s land area territory
� 60% of the world’s poor population
� ESCAP fosters regional cooperation to address development challenges and towards achieving SD with focus on three dimensions

Energy Outlook
• Half of global growth in energy demand will come from India and China
• By 2030, China will overtake the EU as the world’s largest oil importing region
• Russia remains the largest net exporter of energy
• 628 million people lack access to electricity
• 1.8 billion people still using traditional biomass for heating and cooking
• 1.3 million people are estimated to die each year from indoor air pollution
• Steady progress in reducing the energy intensity of its economies. However, greater potential in efficiency exists

THE REGION DRIVING GLOBAL CLEAN ENERGY DEVELOPMENT
• Global clean energy investment fell for a second year in a row, investment in the region continued to grow steadily in 2013, increasing 10% to $102 billion
• On a regional basis, 2013 clean energy installations dropped across the Americas, Europe, the Middle East and Africa. In contrast, this region increased by 64% with more than 50.1 GW of capacity installed
• More than a third of Asia’s gains in capacity were in the solar sectors in China and Japan
• China is the leading market for clean energy finance, attracting $54.2 billion in 2013 and ranking 6th globally for clean energy investment intensity (clean energy investment/dollar GDP), above Germany and the US
• Japan became the fastest-growing clean energy market in the world, jumping 80% in 2014

- 20 40 60 80 100
Singapore
China
Brunei Darussalam
Malaysia
Vietnam
Iran, IR
Thailand
Sri Lanka
Philippines
Nepal
Mongolia
India
Indonesia
Pakistan
Lao PDR
Bangladesh
Myanmar
Afghanistan
Timor-Leste
Cambodia
Korea, DPR
Rural and Urban Electrification
Rates, 2010
Rural electrification rate %
Urban electrification rate %
0.3
0.4
0.5
0.6
0.7
0.8
0.9
1.0
20 30 40 50 60 70 80 90 100
Hu
ma
n D
ev
elo
pm
en
t In
de
x 2
01
0
Access to Electricity (% of Population)
Access to Electricity and Human Development, 2010
y = 0.24 + 0.04x R2 = 0.71

Solid fuel use and gender inequality
% populations use solid fuels, 2010
Data sources: UNDP, UN Data

Coal
33%
Oil
30%
Gas
16%
Nuclear
3%
Hydro
2%
Renewables
16%
1990
Coal
43%
Oil
24%
Gas
16%
Nuclear
4%
Hydro
2%
Renewables
11%
2010
Coal
38%
Oil
22%
Gas
18%
Nuclear
6%
Hydro
3%
Renewables
13%
2035
3098 Mtoe
5534 Mtoe
8643 Mtoe
Asia-Pacific* Total Primary Energy Demand Outlook, New Policies Scenario
*Data excludes the following ESCAP member States:
Armenia, Azerbaijan, Bhutan, Georgia, Iran IR,
Kazakhstan, Kyrgyzstan, Marshall Islands,
Micronesia, Nauru, Palau, Tajikistan, Turkey,
Turkmenistan, Tuvalu, Uzbekistan0
500
1,000
1,500
2,000
2,500
3,000
3,500
1990 2010 2035
Mto
e
Coal
Oil
Gas
Nuclear
Hydro
Renewables

0
1
2
3
4
5
6
2000 2005 2010
Mil
lio
n
kto
e
Asia-Pacific Electricity Production by
Resource, 2000-2010
Coal
Natural Gas
Hydro
Nuclear
Oil
Renewables
0
100
200
300
400
500
600
700
800
900
1,000
g C
O2
eq
/kW
h
Median Lifecycle Greenhouse Gas
Emissions from Electricity Generation
Technologies
2035 Outlook: Nearly all (87%) of the
global growth in coal demand comes
from just two countries, China and India,
which will jointly account for 64% of
total demand in 2035 .

0
50
100
150
200
250
300
350
400
450
1990 1995 2000 2005 2010
Kg
of
oil
eq
uiv
ale
nt
pe
r 1
,00
0 d
oll
ars
GD
P (
20
05
PP
P)
Global Regional Primary Energy
Intensity
Asia-Pacific
Asia-Pacific developing economies
Asia-Pacific developed economies
Africa
Latin America and Carib.
North America
0
100
200
300
400
500
600
700
800
900
1999 2000 2001 2002 2003 2004 2005 2006 2007 2008 2009
Gra
ms
pe
r 1
do
lla
r G
DP
(2
00
5 P
PP
)
Global Regional Carbon
Intensity
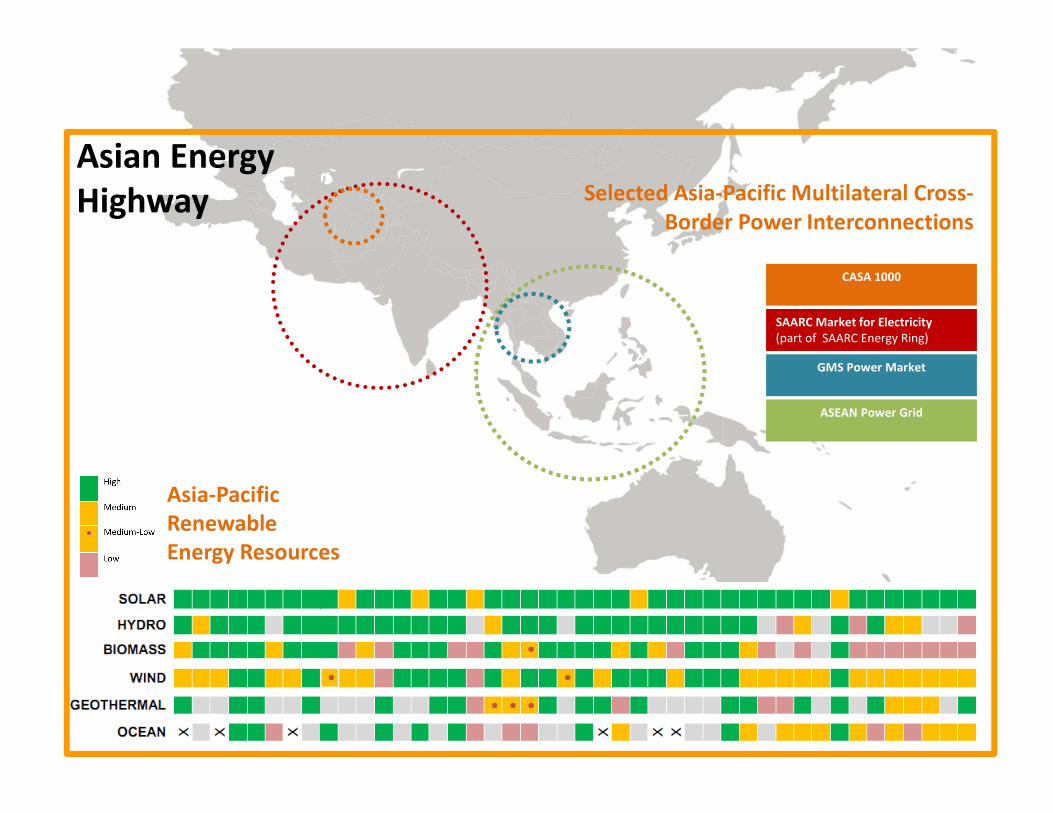
Selected Asia-Pacific Multilateral Cross-
Border Power Interconnections
SAARC Market for Electricity
(part of SAARC Energy Ring)
CASA 1000
GMS Power Market
ASEAN Power Grid
Asia-Pacific
Renewable
Energy Resources
Asian Energy
Highway

High
Medium
• Medium-Low
Low
Unknown
X Not applicable
Note: The information on resources should be taken as an indication only. It refers to a general trend of available
resources, and does not pre-judge the feasibility of individual projects. The thresholds are indicative, and do not
refer to any technological choice. The IRENA analysis is based on literature.
ESCAP member State Renewable Energy Resource Availability, by Subregion
South and
South-West Asia
South-East Asia
East and
North-East
Asia
North and
Central
AsiaPacific

The Asian Energy Highway
Source: GRENATEC
Strengthening & building upon subregional initiatives for energy connectivity to deliver a regionally integrated energy marketplace

Programme for the Session
• Panel discussion
1. Honourable Akauola, Advisor, Tonga Energy Road
Map Implementation Unit, Ministry of Foreign
Affairs, Nuku' alofa
2. Mr. Harry Verhaar, Head of Global Public &
Government Affairs, Philips Lighting
3. Ms. Soma Dutta, Regional Network Coordinator,
ENERGIA International Network

Proposed questions for discussion
• What is the pivotal role of governments and national policy for fostering sustainable energy development in the countries of the region, including for balancing short term priorities and lone term development goals?
• How to ensure energy mix with larger share of environmentally sound conventional energy and renewable energy, for increasing energy efficiency, promoting sustainable use of energy and securing consumers’ access to final energy through innovative fiscal policies?
• What kind of enabling environment should be created to engage business sector on SE4ALL?
• How will business sector develop long term plan for practical implementation of international, regional and national initiatives in the sphere of energy, including for development of infrastructure, enhancing cross-border energy trade, connectivity and increasing investment and financing on SE4ALL?
• How gender mainstreaming could be addressed along the process of SE4ALL?
• What kind of inclusive energy initiatives focused on providing universal access to energy should integrate and support these economic activities specifically for women?