Sustainable consumption & production in Myanmar’s garment ...
27
Project funded by the European Union. Co-funded by the German Federal Ministry for Economic Cooperation and Development Sustainable consumption & production in Myanmar’s garment industry Observations from SMART Myanmar
Transcript of Sustainable consumption & production in Myanmar’s garment ...
Project funded by the European Union. Co-funded by the German Federal Ministry for Economic Cooperation and Development
Sustainable consumption & production in Myanmar’s garment industry Observations from SMART Myanmar
Implemented by the SMART Myanmar 2.0 partner consortium:Partners: sequa gGmbH, MGMA, AVE and ADFIAPAssociates: CBI, GIZ, Lindex & H&M
07.01.2016 Seite ‹Nr.›
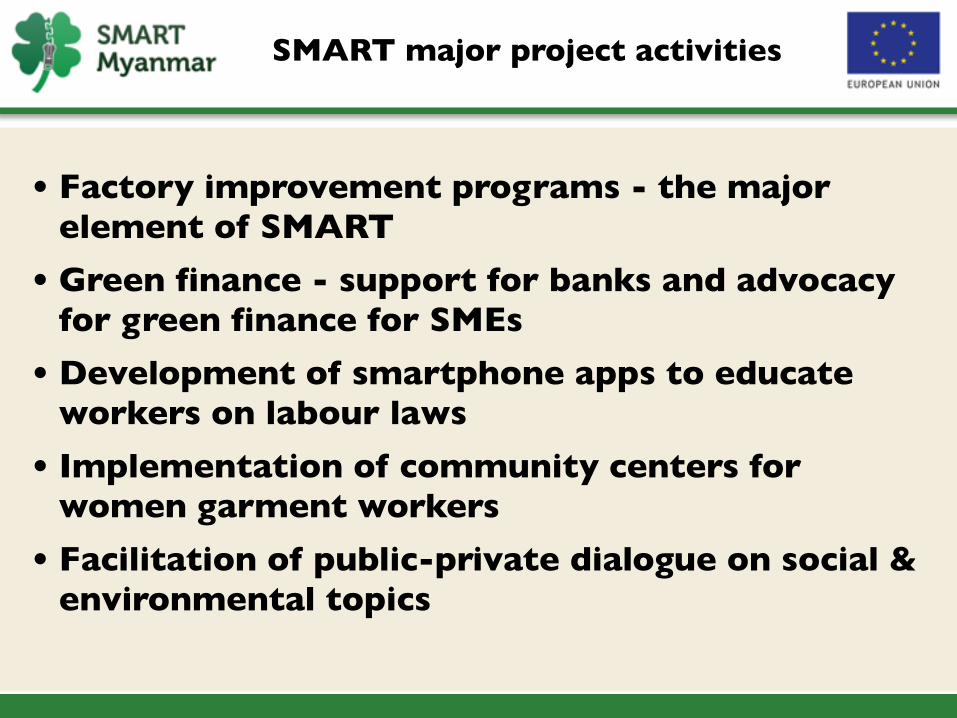
SMART major project activities
• Factory improvement programs - the major element of SMART
• Green finance - support for banks and advocacy for green finance for SMEs
• Development of smartphone apps to educate workers on labour laws
• Implementation of community centers for women garment workers
• Facilitation of public-private dialogue on social & environmental topics
07.01.2016 Seite ‹Nr.›
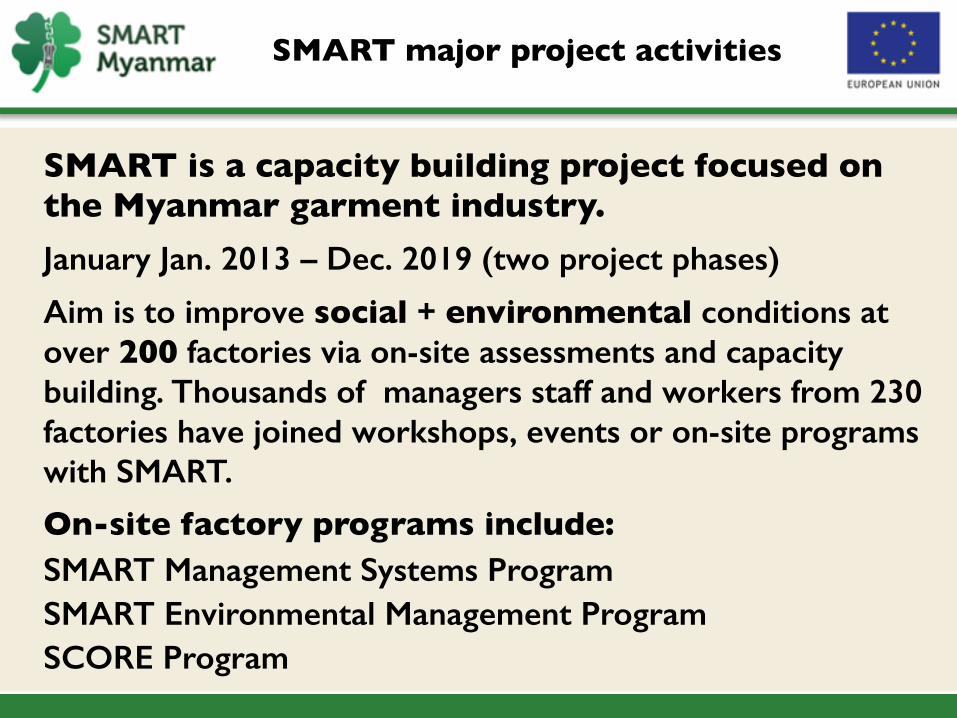
SMART is a capacity building project focused on the Myanmar garment industry. January Jan. 2013 – Dec. 2019 (two project phases)
Aim is to improve social + environmental conditions at over 200 factories via on-site assessments and capacity building. Thousands of managers staff and workers from 230 factories have joined workshops, events or on-site programs with SMART.
On-site factory programs include:SMART Management Systems Program SMART Environmental Management Program SCORE Program
SMART major project activities
07.01.2016 Seite ‹Nr.›
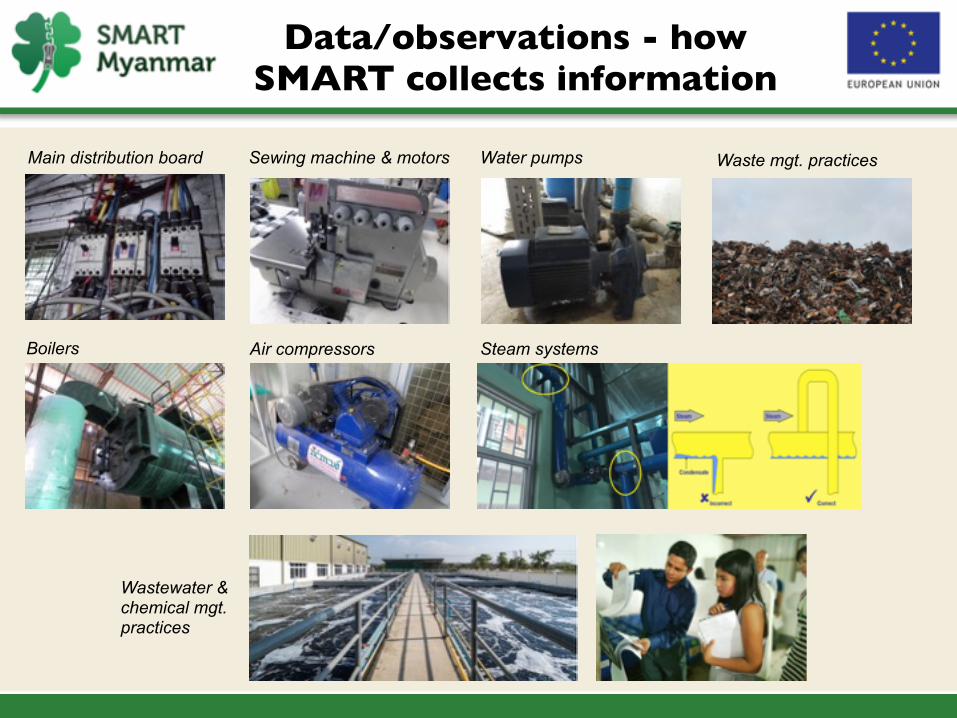
Data/observations - how SMART collects information
Main distribution board Sewing machine & motors Water pumps
Air compressorsBoilers Steam systems
Waste mgt. practices
Wastewater & chemical mgt. practices
07.01.2016 Seite ‹Nr.›
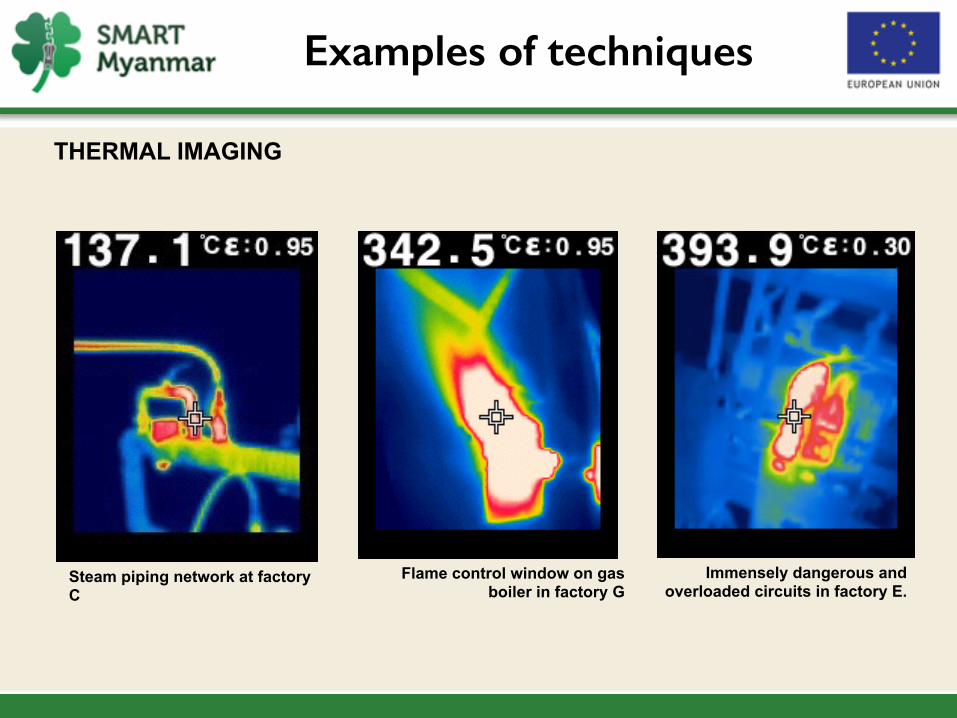
Examples of techniques
THERMAL IMAGING
Steam piping network at factory C
Flame control window on gas boiler in factory G
Immensely dangerous and overloaded circuits in factory E.
07.01.2016 Seite ‹Nr.›
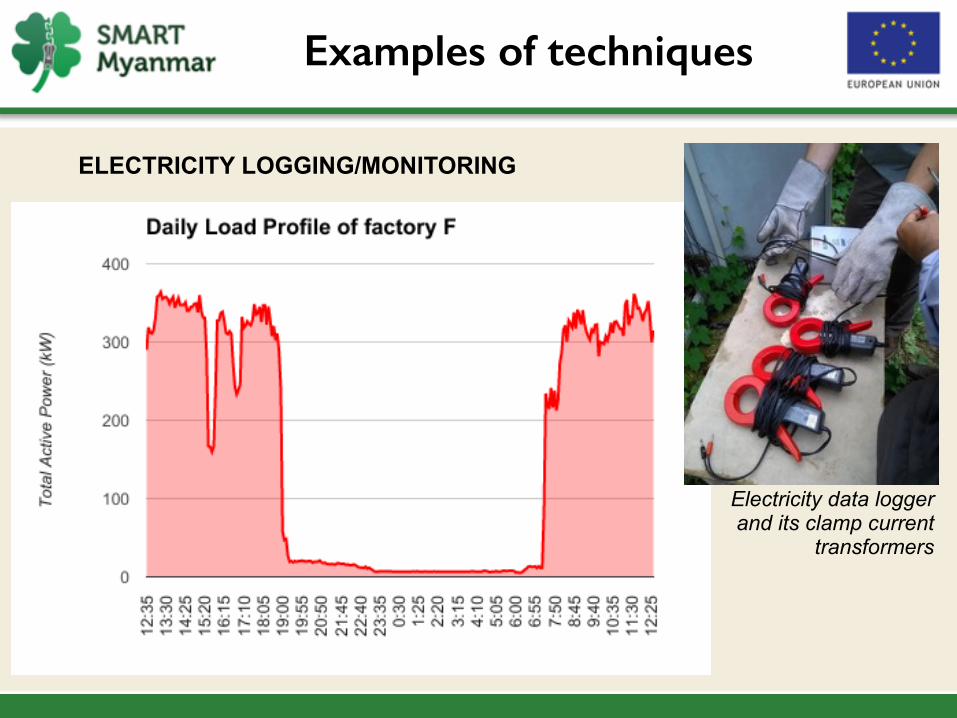
Examples of techniques
ELECTRICITY LOGGING/MONITORING
Electricity data logger and its clamp current
transformers
07.01.2016 Seite ‹Nr.›
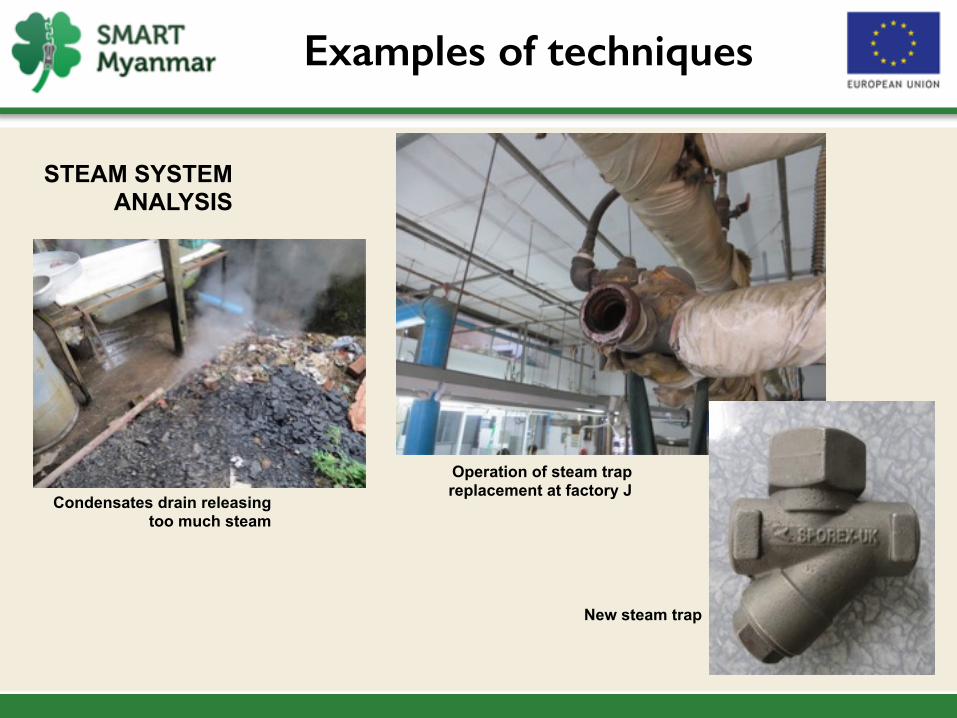
Examples of techniques
STEAM SYSTEM ANALYSIS
Condensates drain releasing too much steam
New steam trap
Operation of steam trap replacement at factory J
07.01.2016 Seite ‹Nr.›
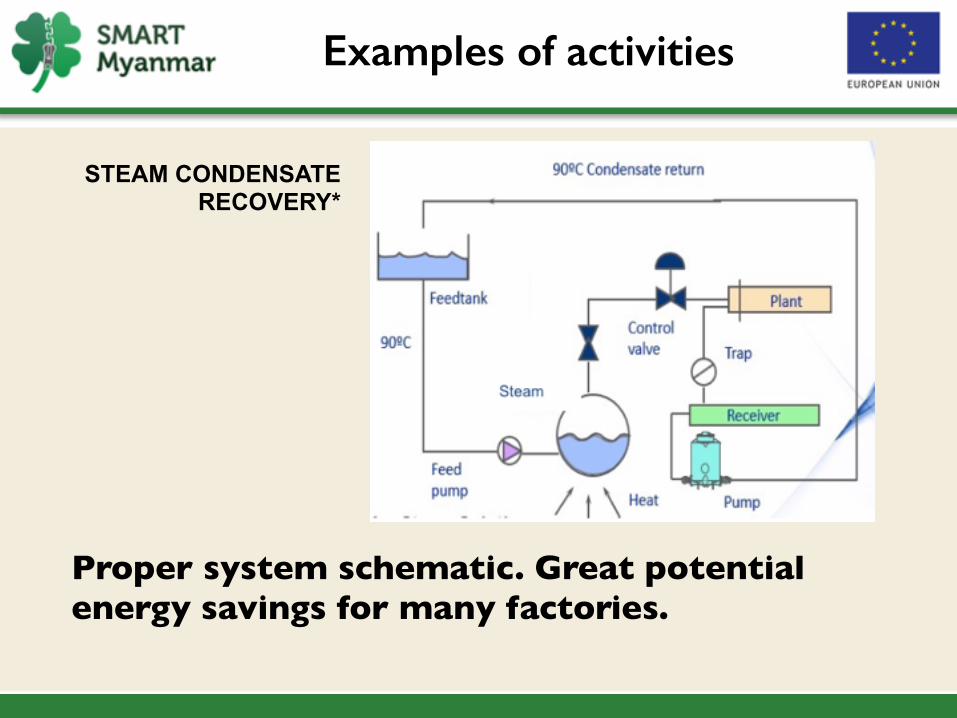
Examples of activities
STEAM CONDENSATE RECOVERY*
Proper system schematic. Great potential energy savings for many factories.
07.01.2016 Seite ‹Nr.›
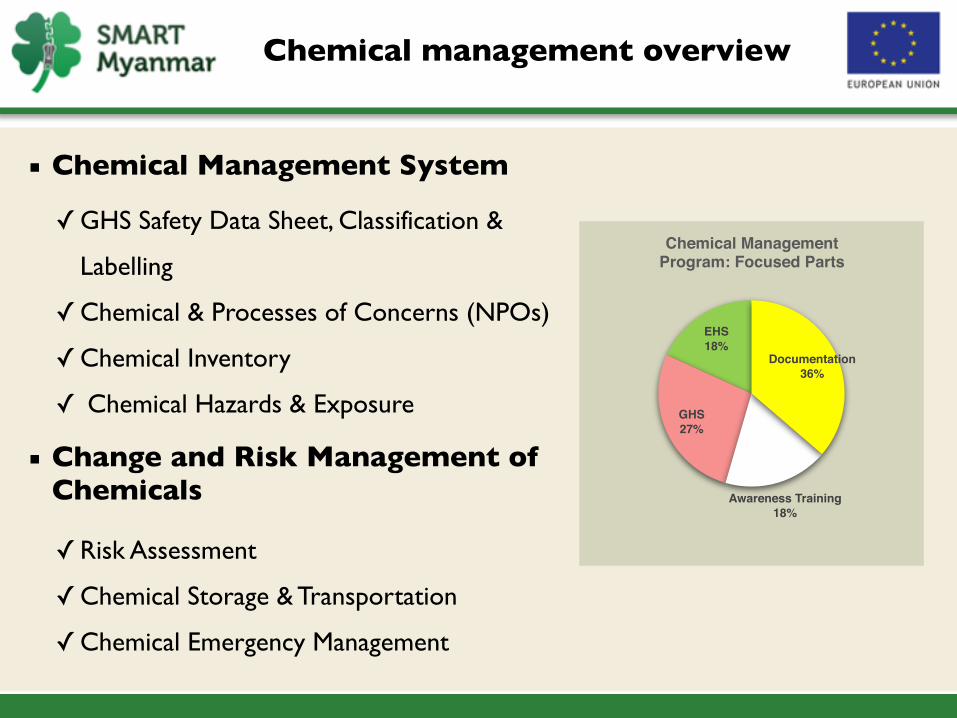
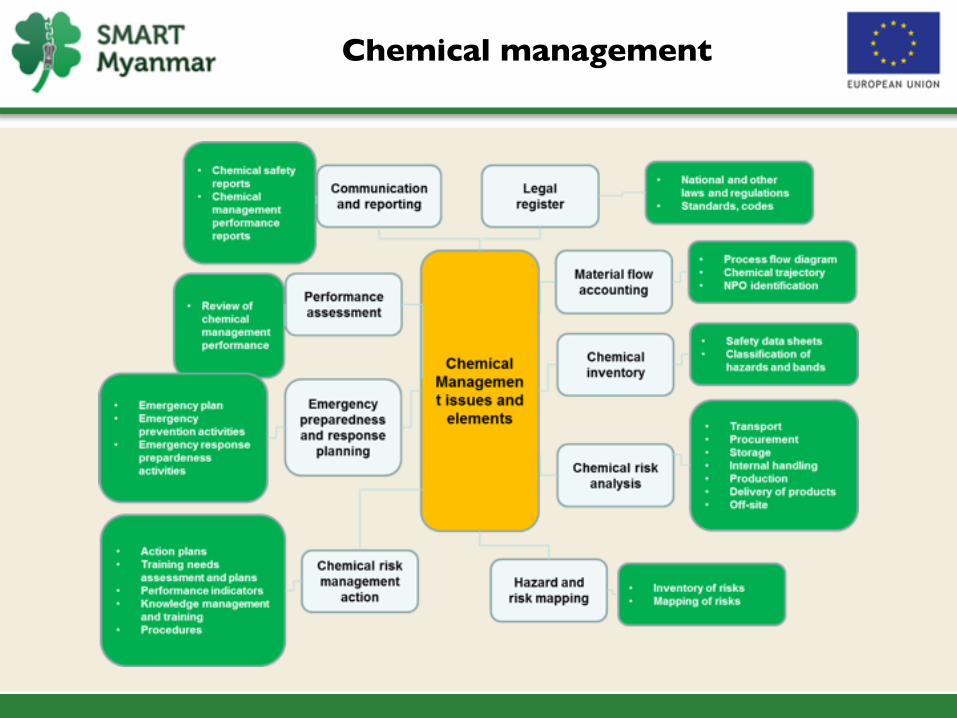
Chemical management overview
▪ Chemical Management System
▪ Change and Risk Management of Chemicals
✓GHS Safety Data Sheet, Classification &
Labelling
✓Chemical & Processes of Concerns (NPOs)
✓Chemical Inventory
✓ Chemical Hazards & Exposure
✓Risk Assessment
✓Chemical Storage & Transportation
✓Chemical Emergency Management
Chemical Management Program: Focused Parts
EHS 18%
GHS27%
Awareness Training 18%
Documentation 36%
07.01.2016 Seite ‹Nr.›
Chemical management
07.01.2016 Seite ‹Nr.›
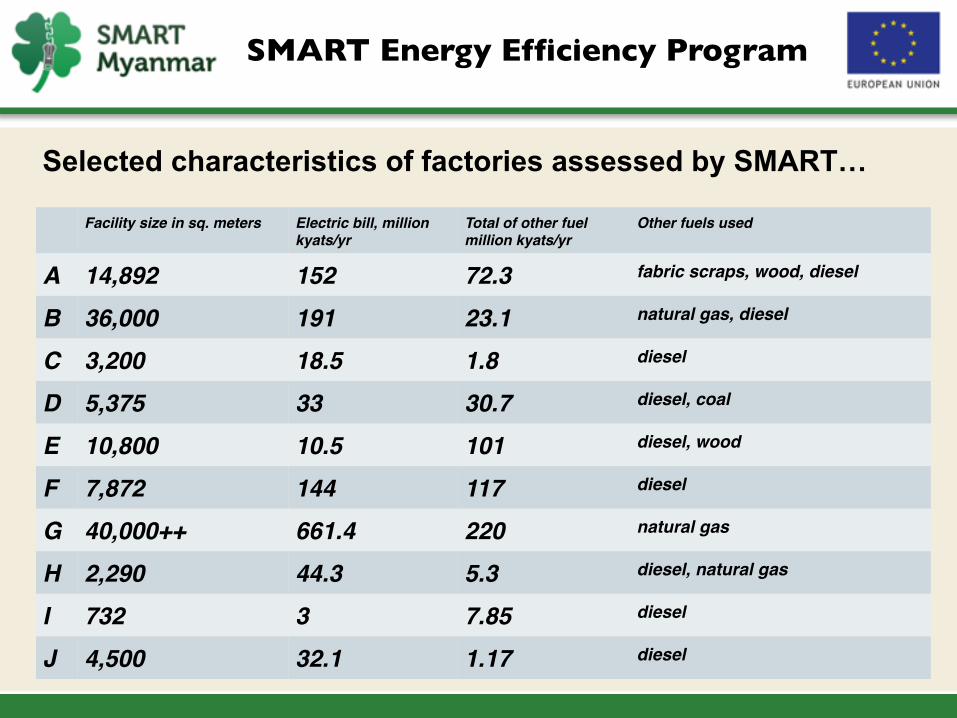
SMART Energy Efficiency Program
Facility size in sq. meters Electric bill, million kyats/yr
Total of other fuel million kyats/yr
Other fuels used
A 14,892 152 72.3 fabric scraps, wood, diesel
B 36,000 191 23.1 natural gas, diesel
C 3,200 18.5 1.8 diesel
D 5,375 33 30.7 diesel, coal
E 10,800 10.5 101 diesel, wood
F 7,872 144 117 diesel
G 40,000++ 661.4 220 natural gas
H 2,290 44.3 5.3 diesel, natural gas
I 732 3 7.85 diesel
J 4,500 32.1 1.17 diesel
Selected characteristics of factories assessed by SMART…
07.01.2016 Seite ‹Nr.›
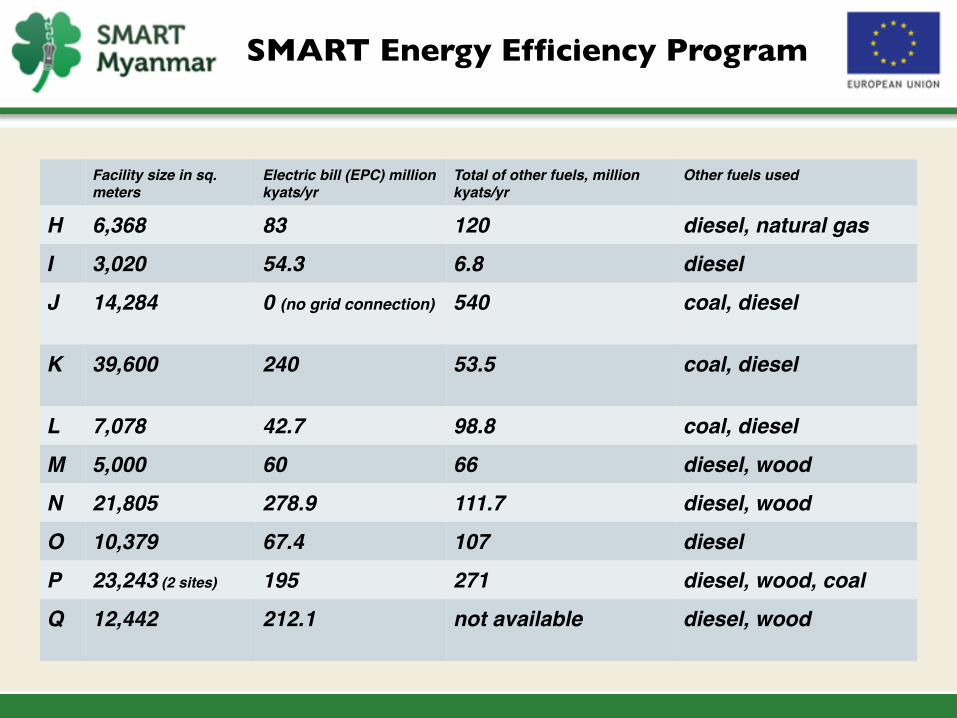
SMART Energy Efficiency Program
Facility size in sq. meters
Electric bill (EPC) million kyats/yr
Total of other fuels, million kyats/yr
Other fuels used
H 6,368 83 120 diesel, natural gas
I 3,020 54.3 6.8 diesel
J 14,284 0 (no grid connection) 540 coal, diesel
K 39,600 240 53.5 coal, diesel
L 7,078 42.7 98.8 coal, diesel
M 5,000 60 66 diesel, wood
N 21,805 278.9 111.7 diesel, wood
O 10,379 67.4 107 diesel
P 23,243 (2 sites) 195 271 diesel, wood, coal
Q 12,442 212.1 not available diesel, wood
07.01.2016 Seite ‹Nr.›
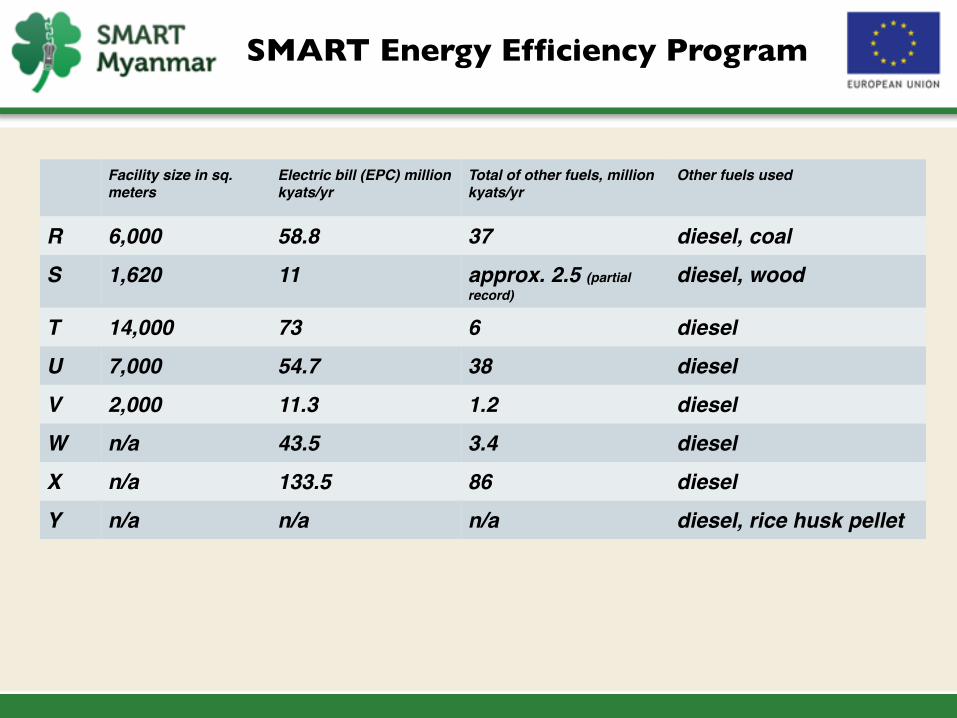
SMART Energy Efficiency Program
Facility size in sq. meters
Electric bill (EPC) million kyats/yr
Total of other fuels, million kyats/yr
Other fuels used
R 6,000 58.8 37 diesel, coal
S 1,620 11 approx. 2.5 (partial record)
diesel, wood
T 14,000 73 6 diesel
U 7,000 54.7 38 diesel
V 2,000 11.3 1.2 diesel
W n/a 43.5 3.4 diesel
X n/a 133.5 86 diesel
Y n/a n/a n/a diesel, rice husk pellet
07.01.2016 Seite ‹Nr.›
Some key concerns observed
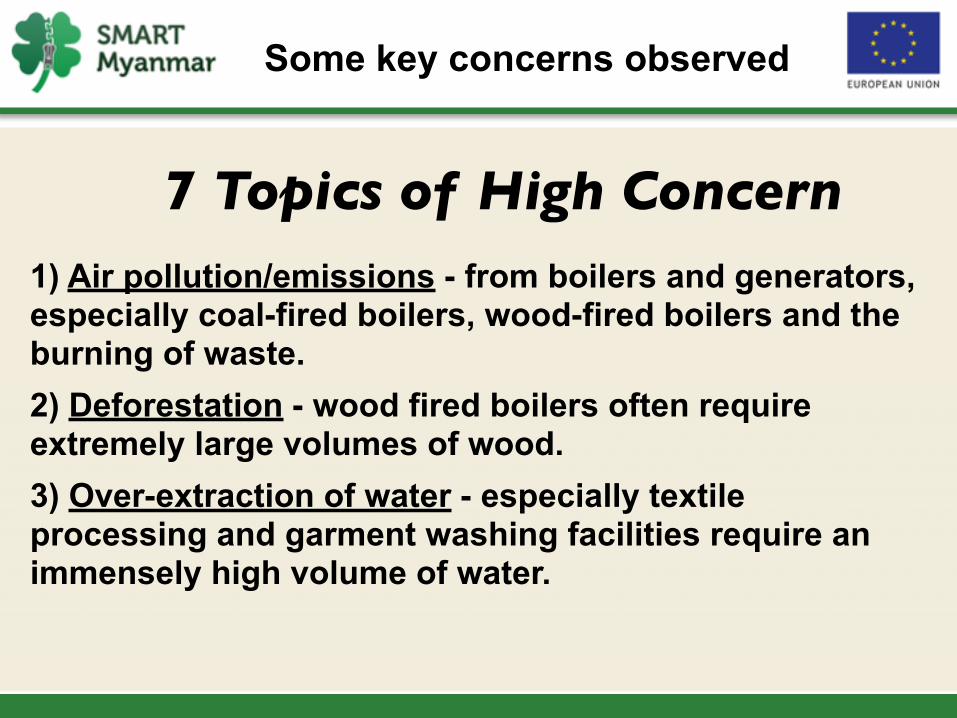
7 Topics of High Concern1) Air pollution/emissions - from boilers and generators, especially coal-fired boilers, wood-fired boilers and the burning of waste. 2) Deforestation - wood fired boilers often require extremely large volumes of wood. 3) Over-extraction of water - especially textile processing and garment washing facilities require an immensely high volume of water.
07.01.2016 Seite ‹Nr.›
Some key environmental concerns
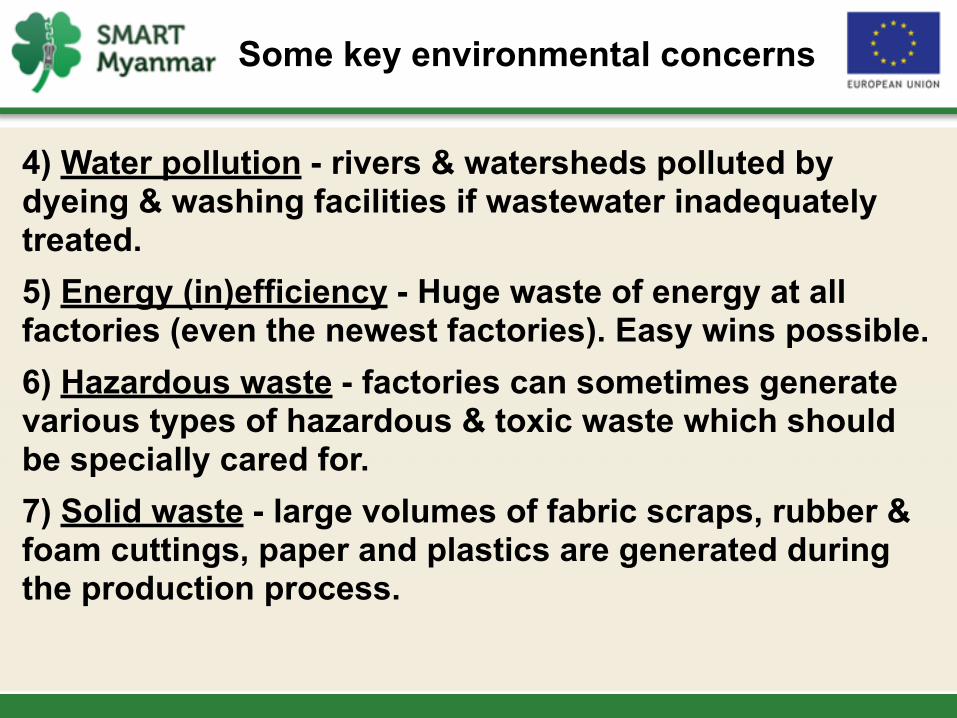
4) Water pollution - rivers & watersheds polluted by dyeing & washing facilities if wastewater inadequately treated. 5) Energy (in)efficiency - Huge waste of energy at all factories (even the newest factories). Easy wins possible. 6) Hazardous waste - factories can sometimes generate various types of hazardous & toxic waste which should be specially cared for. 7) Solid waste - large volumes of fabric scraps, rubber & foam cuttings, paper and plastics are generated during the production process.
07.01.2016 Seite ‹Nr.›
Factory characteristics: energy
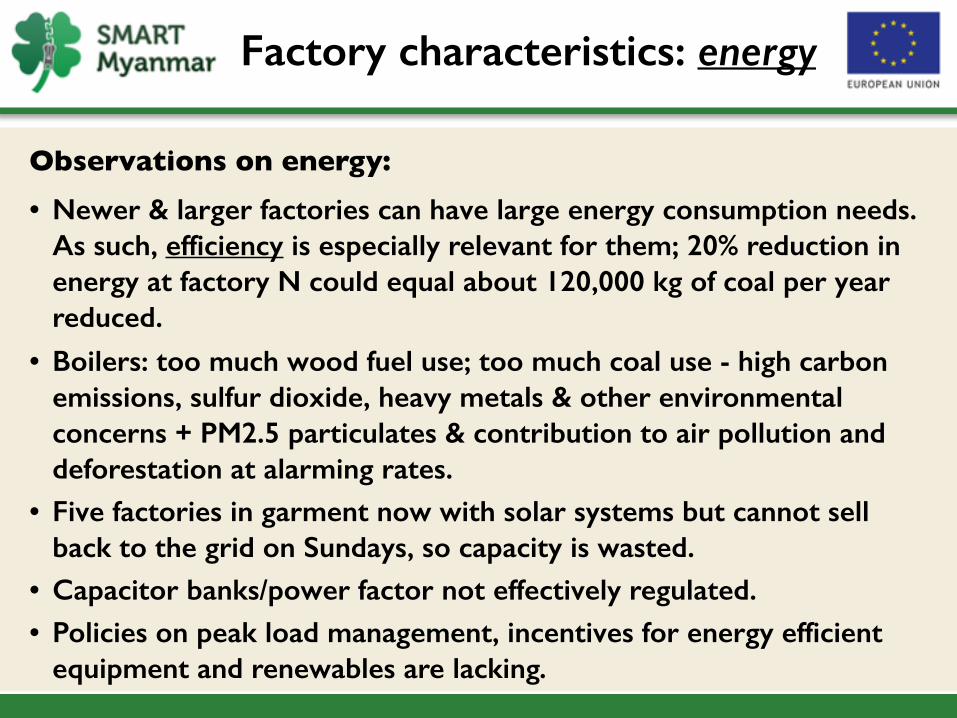
Observations on energy:• Newer & larger factories can have large energy consumption needs.
As such, efficiency is especially relevant for them; 20% reduction in energy at factory N could equal about 120,000 kg of coal per year reduced.
• Boilers: too much wood fuel use; too much coal use - high carbon emissions, sulfur dioxide, heavy metals & other environmental concerns + PM2.5 particulates & contribution to air pollution and deforestation at alarming rates.
• Five factories in garment now with solar systems but cannot sell back to the grid on Sundays, so capacity is wasted.
• Capacitor banks/power factor not effectively regulated. • Policies on peak load management, incentives for energy efficient
equipment and renewables are lacking.
07.01.2016 Seite ‹Nr.›
Skylights…
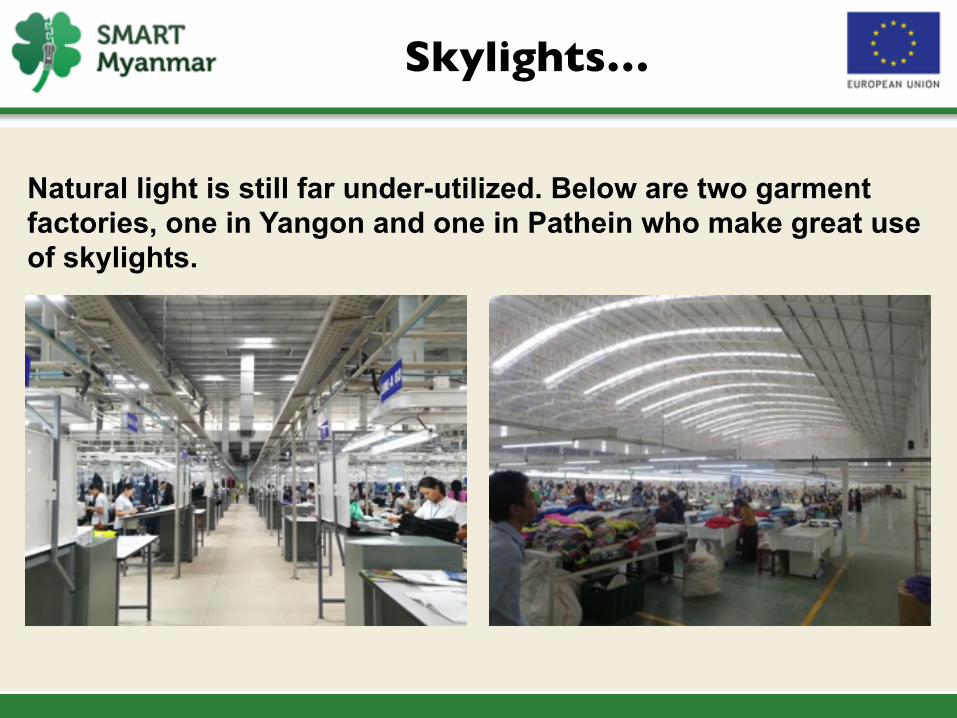
Natural light is still far under-utilized. Below are two garment factories, one in Yangon and one in Pathein who make great use of skylights.
07.01.2016 Seite ‹Nr.›
Solar in Myanmar
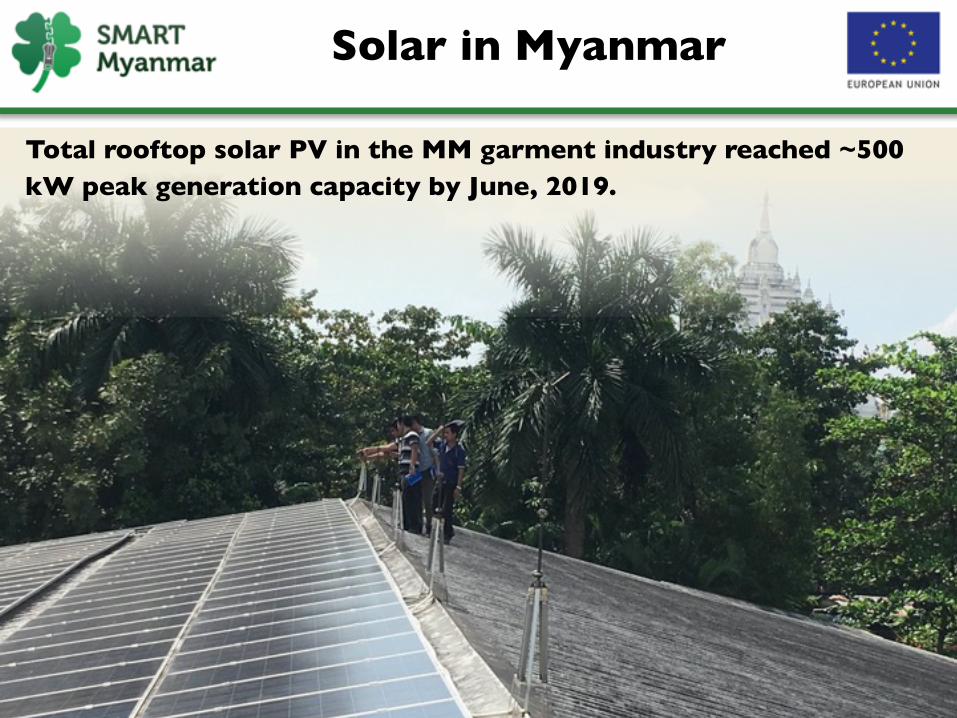
Total rooftop solar PV in the MM garment industry reached ~500 kW peak generation capacity by June, 2019.
07.01.2016 Seite ‹Nr.›
Solar in Myanmar
Why is solar perfect for the MM garment industry?• Myanmar receives an immense amount of sunshine.
• Sunshine peaks during the dry season, when power outages are most frequent due to reduced hydro capacities and increased air conditioning use. So, solar substitutes more often for diesel generator back-up.
• Garment factories can have extremely large roof space.
• Solar panels have been demonstrated to reduce heat gain in steal frame structures (act as insulation where installed)
• If (when) the MM government changes policies on feed-in tariffs, garment factories will be able to sell solar electricity to the grid on off days.
07.01.2016 Seite ‹Nr.›
Power factor sub-optimal in most factories
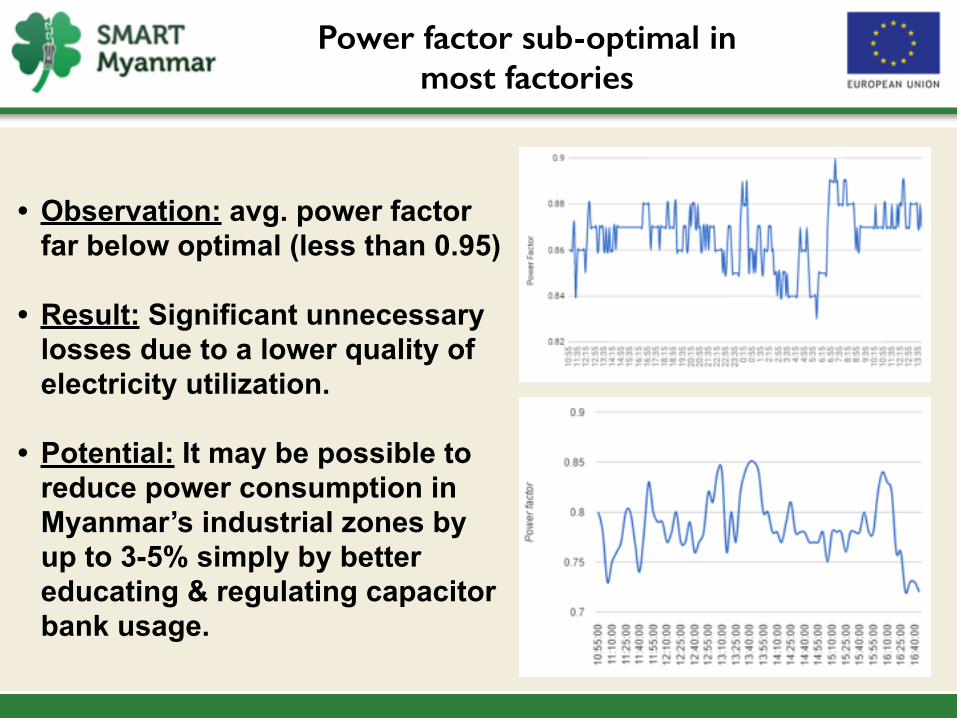
• Observation: avg. power factor far below optimal (less than 0.95)
• Result: Significant unnecessary losses due to a lower quality of electricity utilization.
• Potential: It may be possible to reduce power consumption in Myanmar’s industrial zones by up to 3-5% simply by better educating & regulating capacitor bank usage.
07.01.2016 Seite ‹Nr.›
Factory characteristics: waste
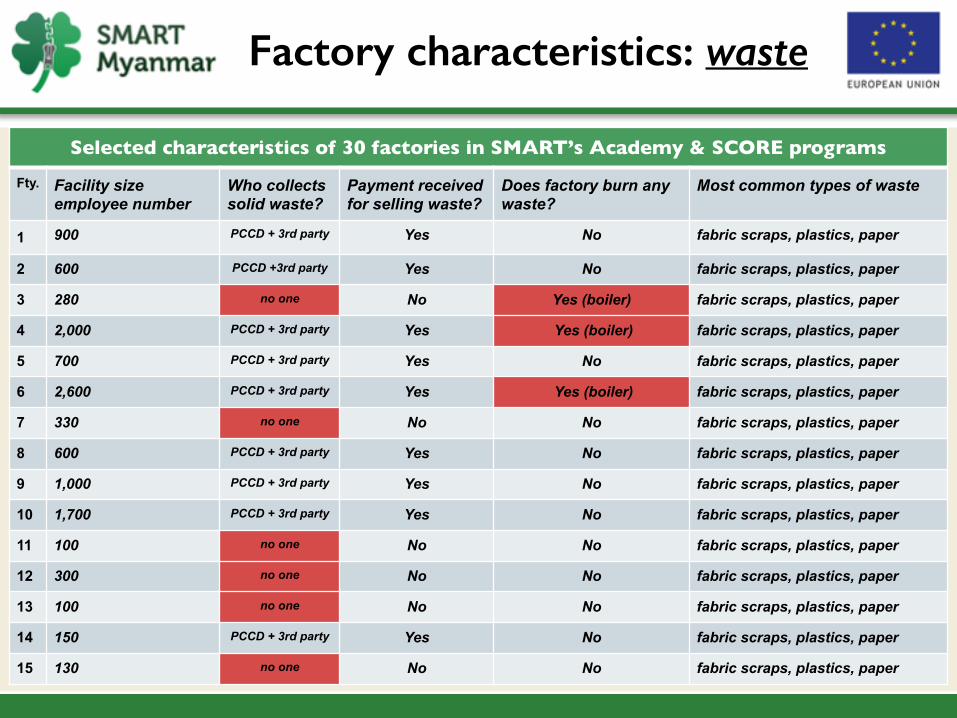
Selected characteristics of 30 factories in SMART’s Academy & SCORE programsFty. Facility size
employee numberWho collects solid waste?
Payment received for selling waste?
Does factory burn any waste?
Most common types of waste
1 900 PCCD + 3rd party Yes No fabric scraps, plastics, paper
2 600 PCCD +3rd party Yes No fabric scraps, plastics, paper
3 280 no one No Yes (boiler) fabric scraps, plastics, paper
4 2,000 PCCD + 3rd party Yes Yes (boiler) fabric scraps, plastics, paper
5 700 PCCD + 3rd party Yes No fabric scraps, plastics, paper
6 2,600 PCCD + 3rd party Yes Yes (boiler) fabric scraps, plastics, paper
7 330 no one No No fabric scraps, plastics, paper
8 600 PCCD + 3rd party Yes No fabric scraps, plastics, paper
9 1,000 PCCD + 3rd party Yes No fabric scraps, plastics, paper
10 1,700 PCCD + 3rd party Yes No fabric scraps, plastics, paper
11 100 no one No No fabric scraps, plastics, paper
12 300 no one No No fabric scraps, plastics, paper
13 100 no one No No fabric scraps, plastics, paper
14 150 PCCD + 3rd party Yes No fabric scraps, plastics, paper
15 130 no one No No fabric scraps, plastics, paper
07.01.2016 Seite ‹Nr.›
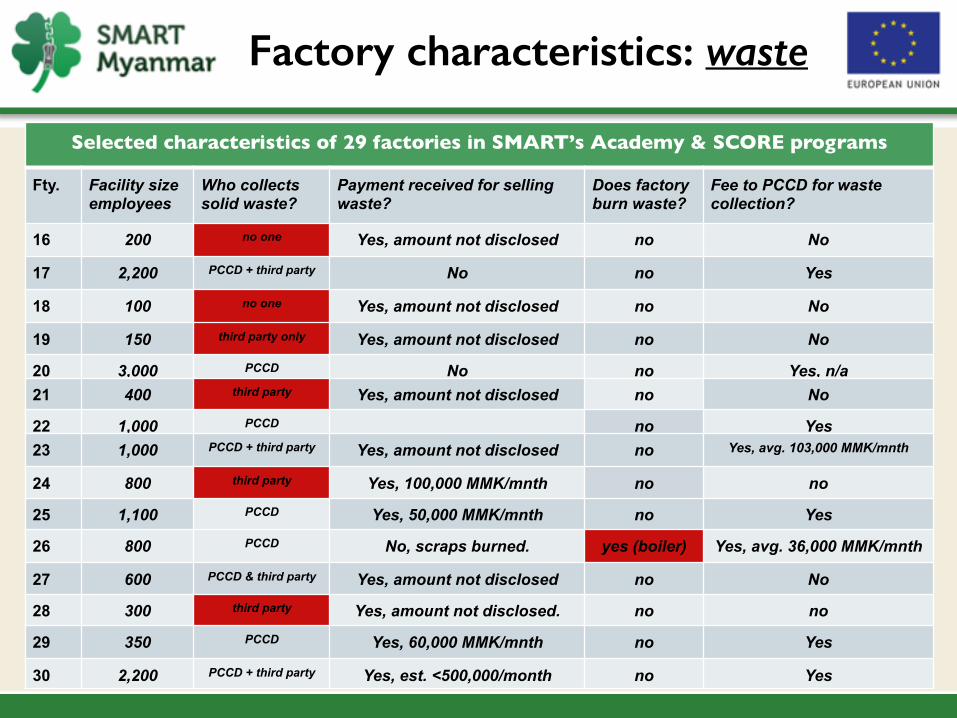
Factory characteristics: waste
Selected characteristics of 29 factories in SMART’s Academy & SCORE programs
Fty. Facility size employees
Who collects solid waste?
Payment received for selling waste?
Does factory burn waste?
Fee to PCCD for waste collection?
16 200 no one Yes, amount not disclosed no No
17 2,200 PCCD + third party No no Yes
18 100 no one Yes, amount not disclosed no No
19 150 third party only Yes, amount not disclosed no No
20 3,000 PCCD No no Yes, n/a21 400 third party Yes, amount not disclosed no No
22 1,000 PCCD no Yes23 1,000 PCCD + third party Yes, amount not disclosed no Yes, avg. 103,000 MMK/mnth
24 800 third party Yes, 100,000 MMK/mnth no no
25 1,100 PCCD Yes, 50,000 MMK/mnth no Yes
26 800 PCCD No, scraps burned. yes (boiler) Yes, avg. 36,000 MMK/mnth
27 600 PCCD & third party Yes, amount not disclosed no No
28 300 third party Yes, amount not disclosed. no no
29 350 PCCD Yes, 60,000 MMK/mnth no Yes
30 2,200 PCCD + third party Yes, est. <500,000/month no Yes
07.01.2016 Seite ‹Nr.›
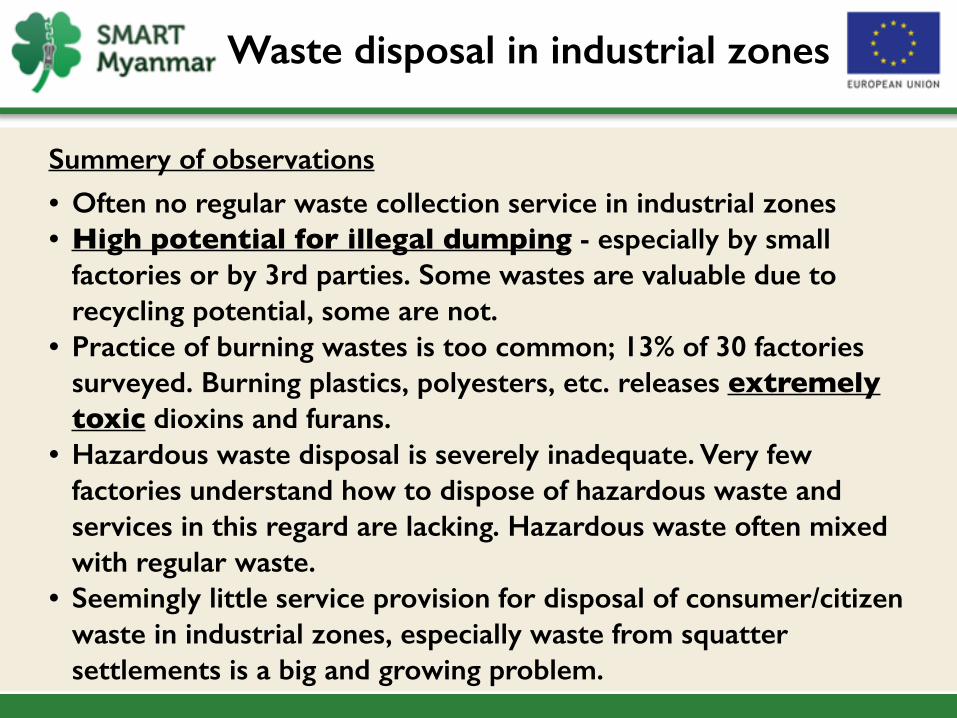
Waste disposal in industrial zones
Summery of observations
• Often no regular waste collection service in industrial zones • High potential for illegal dumping - especially by small
factories or by 3rd parties. Some wastes are valuable due to recycling potential, some are not.
• Practice of burning wastes is too common; 13% of 30 factories surveyed. Burning plastics, polyesters, etc. releases extremely toxic dioxins and furans.
• Hazardous waste disposal is severely inadequate. Very few factories understand how to dispose of hazardous waste and services in this regard are lacking. Hazardous waste often mixed with regular waste.
• Seemingly little service provision for disposal of consumer/citizen waste in industrial zones, especially waste from squatter settlements is a big and growing problem.
07.01.2016 Seite ‹Nr.›
In conclusion…
To sum up the key points:
• Effective measuring and monitoring of electricity, water and waste consumption are critically important.
• Industrial scale is growing rapidly. So, too, pollution problems.
• Good practices (solar, energy efficient boilers, recycling) should be incentivized and rewarded.
07.01.2016 Seite ‹Nr.›
In conclusion…
To sum up the key points…• Considering changes/impacts in the industry,
we ought to consider - - where do environmental management plans (EMPs) fit into the picture? Are these documents guiding factories effectively on KPIs for energy, water and waste reduction? Are they focused on the most important issues? Are they practical and usable documents? Is the purpose of an EMP to reduce environmental impact?

07.01.2016 Seite ‹Nr.›
SMART Myanmar is funded by the European Union and co-funded by the German Federal Ministry for Economic Cooperation and
Development. Learn more at: www.smartmyanmar.org