
Sustainable Computing: Informatics and Systemsweisong/papers/li14-Bugu.pdf · Sustainable...
13
Sustainable Computing: Informatics and Systems 4 (2014) 183–195 Contents lists available at ScienceDirect Sustainable Computing: Informatics and Systems jou rn al hom ep age: www.elsevier.com/locate/suscom Power behavior analysis of mobile applications using Bugu Youhuizi Li ∗ , Hui Chen, Weisong Shi Department of Computer Science, Wayne State University, Detroit, MI, United States a r t i c l e i n f o Article history: Received 30 October 2013 Received in revised form 30 May 2014 Accepted 4 July 2014 Keywords: Application level power Event analyze Power efficiency a b s t r a c t Mobile devices, such as smartphones and tablets, have become an integral part of our daily life. However, the battery drain problem always bothers us. To understand this problem, we design and implement the Bugu service which aims to analyzing power and event information and providing users with detailed energy behaviors of applications. We analyzed 100 popular applications’ power behavior using Bugu on different platforms. The results showed several interesting observations, including radio service and hardware interrupts, that indicate the potential energy optimization for both applications and systems. We further revealed the underlying reason of different power consumption for several applications in case studies. For example, the low efficient usage of system service in iHeartRadio. Finally, lessons learned from software-based power profiling and the ground truth of application level power consumption is discussed. © 2014 Elsevier Inc. All rights reserved. 1. Introduction Nowadays, mobile devices, such as tablets and smartphones, have become an important part of our daily life. According to a statistical report of Cisco [1], by the end of 2014, the number of mobile-connected devices will exceed the number of people on earth, and there will be nearly 1.4 mobile devices per person in the near future. At the same time, the development of mobile devices also stimulates the application market. The number of Android applications increased 50% in last year, which is over 1,200,000 [2]. There is no doubt that these applications make our life more convenient and colorful, but they are also big energy consumers on mobile devices and significantly influence battery lifetime and user experience [3]. As an end user, we want to know “For the same functionality, which application is more energy-friendly?” Except the battery issue, energy efficient applications are more competitive on the market. In a green software awareness survey [4], data shows about 70% people believe that optimizing software is an effective way to save energy and 58% of respondents would select software applications which have energy level labels on them. Application developers often ask the question: “Why do my applications con- sume such amount of power?” especially for mobile devices. System developers focus on the whole system, not just some components or specific applications. Answering the question “How to save and ∗ Corresponding author. Tel.: +1 3134606759. E-mail addresses: [email protected] (Y. Li), [email protected] (H. Chen), [email protected] (W. Shi). effectively control system power?” is the final goal of system deve- lopers. However, the first step to answer these questions is to understand the energy consumption of the system and applica- tions. There are several battery power related mobile applications available at the Google Play store [5–8]. For example, Dr. Power is a tool that presents battery usage for running applications and system [8]. It provides the average power information for sensors, wakelock, data usage and processes in each application. Asides from supporting these data, more detailed component level power information, such as CPU and I/O, will be helpful for developers. Moreover, the average process’s power is not enough, the real time power information needs to be exported so that developers can analyze which action/part costs more power. Mittal et al. [9] proposed an energy emulation tool that allows developers to esti- mate the energy consumption of their apps in a simulator. They considered three components: CPU, network and display in the system, while some useful components are not included (such as DSP and sensors). Trepn Profiler [10] is another power profiling tool which monitors CPU, memory, and network states and sup- ports system battery information. It provides per-rail power usage for latest Snapdragon MDP devices which contain special circuitry. That makes it only suitable for certain types of devices. Besides, all the information is too complicated for normal end users. They pre- fer to know how much power an application consumes so that they can be guided to choose their applications more effectively. We design and implement the Bugu service, which is an appli- cation level power profiler and analyzer. As Fig. 1 illustrates, the Bugu server returns related applications’ power information to http://dx.doi.org/10.1016/j.suscom.2014.07.002 2210-5379/© 2014 Elsevier Inc. All rights reserved.
Transcript of Sustainable Computing: Informatics and Systemsweisong/papers/li14-Bugu.pdf · Sustainable...

P
YD
a
ARRA
KAEP
1
hsmenaa
coufbtawadsdo
w
h2
Sustainable Computing: Informatics and Systems 4 (2014) 183–195
Contents lists available at ScienceDirect
Sustainable Computing: Informatics and Systems
jou rn al hom ep age: www.elsev ier .com/ locate /suscom
ower behavior analysis of mobile applications using Bugu
ouhuizi Li ∗, Hui Chen, Weisong Shiepartment of Computer Science, Wayne State University, Detroit, MI, United States
r t i c l e i n f o
rticle history:eceived 30 October 2013eceived in revised form 30 May 2014ccepted 4 July 2014
eywords:
a b s t r a c t
Mobile devices, such as smartphones and tablets, have become an integral part of our daily life. However,the battery drain problem always bothers us. To understand this problem, we design and implement theBugu service which aims to analyzing power and event information and providing users with detailedenergy behaviors of applications. We analyzed 100 popular applications’ power behavior using Buguon different platforms. The results showed several interesting observations, including radio service and
pplication level powervent analyzeower efficiency
hardware interrupts, that indicate the potential energy optimization for both applications and systems.We further revealed the underlying reason of different power consumption for several applications incase studies. For example, the low efficient usage of system service in iHeartRadio. Finally, lessons learnedfrom software-based power profiling and the ground truth of application level power consumption isdiscussed.
© 2014 Elsevier Inc. All rights reserved.
. Introduction
Nowadays, mobile devices, such as tablets and smartphones,ave become an important part of our daily life. According to atatistical report of Cisco [1], by the end of 2014, the number ofobile-connected devices will exceed the number of people on
arth, and there will be nearly 1.4 mobile devices per person in theear future. At the same time, the development of mobile deviceslso stimulates the application market. The number of Androidpplications increased 50% in last year, which is over 1,200,000 [2].
There is no doubt that these applications make our life moreonvenient and colorful, but they are also big energy consumersn mobile devices and significantly influence battery lifetime andser experience [3]. As an end user, we want to know “For the same
unctionality, which application is more energy-friendly?” Except theattery issue, energy efficient applications are more competitive onhe market. In a green software awareness survey [4], data showsbout 70% people believe that optimizing software is an effectiveay to save energy and 58% of respondents would select software
pplications which have energy level labels on them. Applicationevelopers often ask the question: “Why do my applications con-
ume such amount of power?” especially for mobile devices. Systemevelopers focus on the whole system, not just some componentsr specific applications. Answering the question “How to save and∗ Corresponding author. Tel.: +1 3134606759.E-mail addresses: [email protected] (Y. Li), [email protected] (H. Chen),
[email protected] (W. Shi).
ttp://dx.doi.org/10.1016/j.suscom.2014.07.002210-5379/© 2014 Elsevier Inc. All rights reserved.
effectively control system power?” is the final goal of system deve-lopers. However, the first step to answer these questions is tounderstand the energy consumption of the system and applica-tions.
There are several battery power related mobile applicationsavailable at the Google Play store [5–8]. For example, Dr. Poweris a tool that presents battery usage for running applications andsystem [8]. It provides the average power information for sensors,wakelock, data usage and processes in each application. Asidesfrom supporting these data, more detailed component level powerinformation, such as CPU and I/O, will be helpful for developers.Moreover, the average process’s power is not enough, the realtime power information needs to be exported so that developerscan analyze which action/part costs more power. Mittal et al. [9]proposed an energy emulation tool that allows developers to esti-mate the energy consumption of their apps in a simulator. Theyconsidered three components: CPU, network and display in thesystem, while some useful components are not included (such asDSP and sensors). Trepn Profiler [10] is another power profilingtool which monitors CPU, memory, and network states and sup-ports system battery information. It provides per-rail power usagefor latest Snapdragon MDP devices which contain special circuitry.That makes it only suitable for certain types of devices. Besides, allthe information is too complicated for normal end users. They pre-fer to know how much power an application consumes so that they
can be guided to choose their applications more effectively.We design and implement the Bugu service, which is an appli-cation level power profiler and analyzer. As Fig. 1 illustrates, theBugu server returns related applications’ power information to

184 Y. Li et al. / Sustainable Computing: Inform
eaacavtsatssp
•
•
•
BtrmwScs
2
mnsS
Fig. 1. The overview of Bugu.
nd users and gives them more suggestions when they choosepplications. For application developers, aside from the similarpplications’ power information gathered from the server, the Bugulient also shows the event information of their applications, so thatpplication power problems can be easily distinguished. From theiewpoint of system developers, detailed system power informa-ion provided by the Bugu client is helpful for them to adopt poweraving mechanisms. Leveraging Bugu, we analyzed 100 popularpplications and revealed the root causes of high power consump-ion for some of them in case studies. From the result we observedeveral aspects that can be improved to save both application andystem energy, such as sensors and video module energy efficiency,hone service rild.
In this paper, we mainly have three contributions:
We build the Bugu client which contains profiler, monitor andanalyzer. It provides event information that helps applicationdevelopers optimize their applications and the system-widepower information that assists system developers to analyzebackground processes.With the help of crowdsourcing, the Bugu server provides mostapplications’ power metric for end users. More suggestions arepresented to users, and they can make right choice to get thesame functionality with less energy consumption.We evaluate the Bugu service comprehensively and analyze 100popular mobile applications on different platforms. Several impli-cations are derived based on the observations and the root causesof large power consumption for several typical mobile applica-tions are analyzed.
In the following sections of this paper, we introduce theugu service and the implementation of its components in Sec-ions 2 and 3 respectively. Then, we demonstrate our experimentsesults and propose four critical implications for energy-efficientobile-application and system design in Section 4. Following that,e discuss the challenges of software-based power profiler in
ection 5. The related work of energy saving approaches and appli-ation level energy analyzing is presented in Section 6. Section 7ummarizes the conclusions of our research.
. System design
The Bugu service is mainly designed for system designers,
obile application developers and end users. Thus, the Bugu serviceot only presents the application-level power consumption on aingle device, but also supplies a group of REST (Representationaltate Transfer) [11] style APIs for users to share and compare power
atics and Systems 4 (2014) 183–195
data. It also supplies event information that may help them tounderstand the underlying reasons that cause the power consump-tion.
As Fig. 1 describes, the Bugu service includes two parts: theBugu server and the Bugu client. The Bugu server collects appli-cations’ power information on each device and supports the Buguclient with these data. The Bugu client is used to monitor appli-cation power consumption, monitor events and analyze theseinformation. The results are presented in tables and figures for easyunderstanding and comparison.
2.1. The Bugu server
The Bugu server has two functions: collecting application powerinformation from the Bugu client and supplying these power infor-mation to users. Users can contribute their data to the Bugu serverby uploading their profiling records, which will help future cus-tomers. With the first function, we maintain a large database ofapplication power consumption information on different types ofmobile devices. After ranking these applications, users can getbetter understanding before installing them. The building of thisdatabase requires users’ contribution so that we can cover as muchapplications and devices as possible. It is a huge and continuouswork. At present, we provide power information for most popularapplications on several Android devices that we have.
Based on the type of device and the type of application the userwants to compare, the Bugu server finds the related power infor-mation and delivers it to the Bugu client. Then, end users knowthe comparison results of these applications, they can choose anenergy-friendly one to install. For application developers, they cancompare the power consumption with the application they devel-oped to evaluate their products.
2.2. The Bugu client
The Bugu client has three main functions: estimatingapplication-level power consumption, monitoring system andapplication events and displaying the information to the user in ameaningful way. It is composed by power profiler, event monitor,power and event analyzer and user interface module. The proce-dure is as follows: the power profiler and event monitor recordthe raw data they need; and the analyzer extracts the data andsends application level power and event information to UI modulewhich displays the data including other applications’ informationobtained from the Bugu server to users in a meaningful way.
2.2.1. Power profilerPower profiler is responsible for estimating the system and
application power consumption. It uses a group of energy models,which are listed in Table 1, to estimate energy consumption basedon how much of each hardware resource was utilized by each appli-cation. With the time information, we calculate the average powerconsumption. The power profiler considers the following compo-nents: CPU, Wi-Fi, 3G, GPS, sensors, bluetooth, screen, radio, and soon. We leverage some energy models from our former paper [12],and tune the parameters for mobile platform. For components likesensors, we build the energy models according to their differentpower states. Aside from application’s power, we also record thepower of hardware components in the system. So far, we do notconsider screen power for each application, while it is available onsystem level. The reasons are as follows: from research of Donget al. [13], we know that for OLED screen, different color presented
can affect screen power. While the applications’ user interface ispart of their design style, it will affect user experience if the color ischanged. For LCD display, the screen power is determined by bright-ness level, applications themselves cannot save much on screen
Y. Li et al. / Sustainable Computing: Informatics and Systems 4 (2014) 183–195 185
Table 1The energy models.
Components Energy models
CPU ECPU =∑NumberOfSteps
i=1Timei ∗
(IdlePower + MaxPower ∗ U)U = (�Tsys + �Tuser)/(�T * CoreNumber)
Wi-Fi Ewifi = WifiOnAvgPower * WifiOnTime +WifiActiveAvgPower * WifiActiveTime
Screen EScreen =∑NumOfBrightness
i=1(Timei ∗
(i/NumOfBrightness ∗ ScreenFullPower))Bluetooth Ebluetooth = BtOnAvgPower * BtOnTime +
BtAvgPowerAtCMD * BtPingTime
Radio Eradio =∑NumOfSignalBin
i=1(SignalTimei ∗
SignalAvgPoweri) + RadioScanAvgPower*RadioScanTime + PhoneOn-Time * RadioActiveAvgPower
Table 2Summary of six types of wakelock.
WAKE LOCK CPU Screen Keyboard
PARTIAL WAKE LOCK On Off OffFULL WAKE LOCK On Bright OnSCREEN DIM WAKE LOCK On Dim OffSCREEN BRIGHT WAKE LOCK On Bright Off
ptlii
tapt
2
miaeawuiou
slc
2
rioaticpa
ACQUIRE CAUSES WAKEUP On On/Off On/OffON AFTER RELEASE On On Off
art. The optimization approaches we want to find are from a func-ionality aspect, not appearance. Although we can get applicationevel screen power according to the time that an application isn foreground and pixel information, it is not very suitable and itncreases overhead of Bugu.
The power profiler saves the power information in a format-ed log file, which includes the utilization information of all thective applications on each component. The data is recorded onceer second. With this information, system designers could analyzehe underlying reasons that cause the energy consumption.
.2.2. Event monitorAside from just monitoring the power consumption, Bugu also
onitors the events of system and applications. Those eventsnclude: wakelock, Wi-Fi state change, bluetooth state change,udio and video state change and different sensors on/off state. Forxample, we could know when an application acquired or released
wakelock. In the Android operating system, there are six types ofakelock (showed in Table 2 [14]), which represent the privilege tose several hardware devices. All of them make the processor keep
n active state. Many applications drain battery so quickly becausef misusing the wakelocks. Thus, those events are helpful for us tonderstand how the applications cause the power consumption.
For each event, we log the time, type and related information,uch as the level of brightness, sensor states. The system deve-opers use the information to deeply analyze the system poweronsumption problem.
.2.3. Power and event analyzerThe power and event analyzer is used to process the result
ecorded by the power profiler and the event monitor. The mostmportant function of this module is to calculate the average powerf each application. We write the algorithm to calculate applicationverage power. First, we need to filter the effective data by detectinghe longest active period of each application. We define application
nactive state as its energy consumption does not change in N suc-essive calculation points. The interval between two calculationoints is one second. According to our experiments log, most of thepplications are paused or went to background if we cannot detectFig. 2. The resource file in Android system.
their energy variation after three times. Sometimes, energy kept thesame because of the sampling delay. Hence, in our experiment, Nequals three. Then based on the time period and the logged energyinformation with usage data, we calculate the average power. Theanalyzing process is done off-line in order to lower the overhead ofthe Bugu client.
One of the challenges we faced is that the power monitor cannotaccurately run periodically, that’s because Android is not a realtimeoperating system [15]. Thus, we improve our algorithm that whenwe compute the power during two time intervals, the record will beskipped if the time interval is smaller than the threshold. Otherwise,we may get abnormal power results because there is a delay beforewe obtain the utilization information.
3. Implementation
To implement the Bugu service, we not only developed theserver program and the Android client application, but also mod-ified and compiled the Android system to monitor the events. Inthis section, we describe how we implement the Bugu server, thepower profiler, the event monitor and the Bugu client interfaces.
3.1. The Bugu server
The Bugu server maintains application power information, gath-ers the information from users and provides comparison results toend users and application developers. When users send a request,the Bugu server returns the same category applications list and eachitem describes the application name and its power consumption.There are two ways for users to contribute their data to the Buguserver. They can choose the upload option on their records, or writeresults on the submission page. We use REST [16] to implementour server, the request URI describes the parameters of the typeof device, the type of application and the limit of returned results.The server interprets the request and send back the correspondingresults.
3.2. Power profiler
The power profiler is implemented as a service running in thebackground periodically. It requires the base power of hardware
components and their utilization for each application to estimatethe power. We get the base power information from the PowerPro-file class of Android, which reads power values from a resourcefile (as Fig. 2 presents). For example, we could get the power of the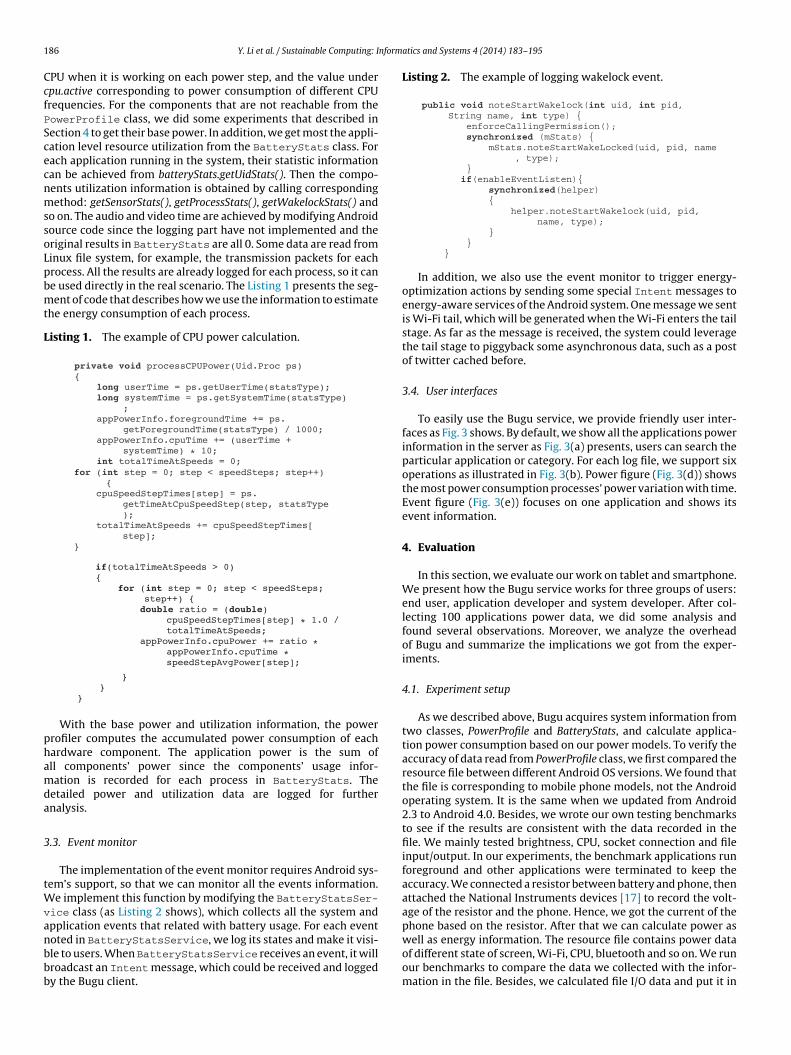
1 nform
CcfPScecnmssoLpbmt
L
phamda
3
tWvanbbb
86 Y. Li et al. / Sustainable Computing: I
PU when it is working on each power step, and the value underpu.active corresponding to power consumption of different CPUrequencies. For the components that are not reachable from theowerProfile class, we did some experiments that described inection 4 to get their base power. In addition, we get most the appli-ation level resource utilization from the BatteryStats class. Forach application running in the system, their statistic informationan be achieved from batteryStats.getUidStats(). Then the compo-ents utilization information is obtained by calling correspondingethod: getSensorStats(), getProcessStats(), getWakelockStats() and
o on. The audio and video time are achieved by modifying Androidource code since the logging part have not implemented and theriginal results in BatteryStats are all 0. Some data are read frominux file system, for example, the transmission packets for eachrocess. All the results are already logged for each process, so it cane used directly in the real scenario. The Listing 1 presents the seg-ent of code that describes how we use the information to estimate
he energy consumption of each process.
isting 1. The example of CPU power calculation.
for (int step = 0 ; step < speedSteps; step++){
cpuSpeedStepTimes[step] = ps .getTimeAtCpuSpeedStep(step, statsType);
totalTimeAtSpeeds += cpuSpeedStepTimes[step];
}
private void processCPUPower(Uid.Proc ps){
long userTime = ps.getUserTime(statsType);long systemTime = ps.getSystemTime(statsType )
;appPowerInfo.foregroundTime + = ps.
getForegroundTime(statsType) / 1000;appPowerInfo.cpuTime += (userTime +
systemTime) * 10;int totalTimeAtSpeeds = 0 ;
if(totalTimeAtSpeeds > 0){
for (int step = 0; step < speedSteps;step++) {double ratio = (double)
cpuSpeedStepTimes[step ] * 1.0 /totalTimeAtSpeeds;
appPowerInfo.cpuPower += ratio *appPowerInfo.cpuTime *speedStepAvgPower[step];
}}
}
With the base power and utilization information, the powerrofiler computes the accumulated power consumption of eachardware component. The application power is the sum ofll components’ power since the components’ usage infor-ation is recorded for each process in BatteryStats. The
etailed power and utilization data are logged for furthernalysis.
.3. Event monitor
The implementation of the event monitor requires Android sys-em’s support, so that we can monitor all the events information.
e implement this function by modifying the BatteryStatsSer-ice class (as Listing 2 shows), which collects all the system and
pplication events that related with battery usage. For each eventoted in BatteryStatsService, we log its states and make it visi-le to users. When BatteryStatsService receives an event, it willroadcast an Intent message, which could be received and loggedy the Bugu client.atics and Systems 4 (2014) 183–195
Listing 2. The example of logging wakelock event.
public void noteStartWakelock(int uid, int pid,String name, int type ) {
enforceCallingPermission();synchronized (mStats) {
mStats.noteStartWakeLocked(uid, pid , name, type);
}if(enableEventListen){
synchronized(helper){
helper.noteStartWakelock(uid, pid,name, type);
}}
}
In addition, we also use the event monitor to trigger energy-optimization actions by sending some special Intent messages toenergy-aware services of the Android system. One message we sentis Wi-Fi tail, which will be generated when the Wi-Fi enters the tailstage. As far as the message is received, the system could leveragethe tail stage to piggyback some asynchronous data, such as a postof twitter cached before.
3.4. User interfaces
To easily use the Bugu service, we provide friendly user inter-faces as Fig. 3 shows. By default, we show all the applications powerinformation in the server as Fig. 3(a) presents, users can search theparticular application or category. For each log file, we support sixoperations as illustrated in Fig. 3(b). Power figure (Fig. 3(d)) showsthe most power consumption processes’ power variation with time.Event figure (Fig. 3(e)) focuses on one application and shows itsevent information.
4. Evaluation
In this section, we evaluate our work on tablet and smartphone.We present how the Bugu service works for three groups of users:end user, application developer and system developer. After col-lecting 100 applications power data, we did some analysis andfound several observations. Moreover, we analyze the overheadof Bugu and summarize the implications we got from the exper-iments.
4.1. Experiment setup
As we described above, Bugu acquires system information fromtwo classes, PowerProfile and BatteryStats, and calculate applica-tion power consumption based on our power models. To verify theaccuracy of data read from PowerProfile class, we first compared theresource file between different Android OS versions. We found thatthe file is corresponding to mobile phone models, not the Androidoperating system. It is the same when we updated from Android2.3 to Android 4.0. Besides, we wrote our own testing benchmarksto see if the results are consistent with the data recorded in thefile. We mainly tested brightness, CPU, socket connection and fileinput/output. In our experiments, the benchmark applications runforeground and other applications were terminated to keep theaccuracy. We connected a resistor between battery and phone, thenattached the National Instruments devices [17] to record the volt-age of the resistor and the phone. Hence, we got the current of thephone based on the resistor. After that we can calculate power as
well as energy information. The resource file contains power dataof different state of screen, Wi-Fi, CPU, bluetooth and so on. We runour benchmarks to compare the data we collected with the infor-mation in the file. Besides, we calculated file I/O data and put it in
Y. Li et al. / Sustainable Computing: Informatics and Systems 4 (2014) 183–195 187
client
ofi
Nsdtreas
4
k
4
qo
TE
can see that Opera consumes less power than Firefox, which makesit more competitive. To figure out the behind reasons, we analyzed
Fig. 3. The Bugu
ur power calculating system, which is not supplied in the resourcele.
The mobile devices we used for these experiments are Googleexus S and Motorola Xoom. Their hardware parameters are pre-
ented in Table 3 that includes sensors information. Both of theseevices use Android 4.0.4 OS. According to AndroLib’s statistics [18],here are 640,000 android applications in the market. To ensureepresentative results, the applications we choose cover most cat-gories. They have over one million installs and ranked in Top-100s claimed by Google Play. Table 4 lists the information and repre-entative applications.
.2. Bugu case studies
We introduce three case studies here to illustrate how differentinds of users can take advantage of the Bugu service.
.2.1. End user scenarioAn end user usually wants battery work longer without fre-
uently charging. Aside from saving energy by operating systemr shutting down unused devices, this goal can also be achieved
able 3xperiment platforms.
Hardware components Nexus S Xoom
CPU ARMv7 Processor rev 2 ARMv7 Processor rev 0Frequency (MHz) 100–1000, 5 steps 216–1000, 8 stepsRAM (MB) 335 718Sensor KR3DM Accelerometer KXTF9 Accelerometer
GP2A Light Ambient LightSensor SensorAK8973 Magnetic AK8975 MagneticSensor Sensor
user interfaces.
through installing energy-friendly applications. The Bugu servermaintains a lot of applications’ power data with the hardware plat-form information. End users can request these information andsearch the category of the application they want to install, thedata returned is ranked by the power consumption of applications.Except the application’s characteristics, such as UI and special func-tionality that improve user experience, end users can also takepower consumption into consideration.
Take browser as an example, assume users want to install Operaon their device. They can simply send the type of device andapplication name Opera to the Bugu server. Table 5 lists severalapplications’ data stored in the server, and the browser part willbe returned to the users. Noted that the power data is calculatedunder the general usage situation. In this experiment, we chosensix popular websites including cnn, espn, amazon, opened them oneby one and each time scrolled down to see all the information. We
the event information and raw power log data of Opera and Firefox,
Table 4Summary of selected applications.
Category Applications
Business Documents To Go, UPS Mobile, Pocket Cloud Remote,etc.
Game Fruit Ninja, Temple Run 2, Talking Tom Cat, etc.Finance Google Finance, Expense Manager, TurboTax SnapTax,
etc.Health and Fitness Instant Heart Rate, Workout Trainer, Lose It, etc.Media and Video YouTube, RealPlayer, Movies by Flixster, etc.Music and Audio iHeartRadio, Amazon MP3, Google Play Music, etc.Education Kids Animal Piano Free, How to Draw, Aldiko Book
Reader, etc.Tools PicsArt, Barcode Scanner, Tiny Flashlight, etc.

188 Y. Li et al. / Sustainable Computing: Informatics and Systems 4 (2014) 183–195
(a) Event informationof YouTube runningon Ne xus S. (b) The power variation informationon Nexus S.
(c) Event information of YouTube running on MotorolaXoom.
(d) The power variation informationon Motorola Xoom.
Fig. 4. The comparison of YouTube event and power information.
Table 5The comparison of applications power consumptions.
Browser Application power (mW) Game Application power (mW)
Opera 123.42 NinJump 141.73Dolphin 162.15 Temple Run 142.75Firefox 304.63 Cut the Rope 149.12
Health Application power (mW) Reading Application power (mW)
tmeS
4
phwasd
sipTfoiiFsiXpii
system did for starting new activity. So if the developers want tooptimize YouTube, they should focus more on handling user inputsefficiently and balancing data downloaded.
Instant heart rate 65.96
Lose It 83.55
Cardiograph 92.26
he results show that their CPU power has big difference. Firefoxay do more processing and calculation to improve user experi-
nce, further analysis about their power behavior can be found inection 4.3.3.
.2.2. Application developer scenarioOn one hand, the Bugu server provides related applications’
ower data for application developers to compare. On the otherand, developers can get event information from the Bugu client,hich gives the optimization direction from power consumption
spect. In this section, we use video application as an example tohow how Bugu works. In our experiment, the new applicationeveloped is YouTube.
To include the influence that application may bring to theystem, the Bugu server not only provides each applications’nformation, but also gives other four most power consumptionrocesses of each application and compares the union of them.hus, there are six processes compared in Fig. 5. The data is collectedrom Nexus S, and we can see that system processes which supportur applications consume much more power than the applicationtself. For instances, systemui is responsible for drawing the usernterface, mediaserver provides sound and other support for media.rom the perspective of the target application, YouTube is in a goodituation, its power is lower than others. Fig. 4 presents the eventnformation and power variation of YouTube on both Nexus S and
oom. These information helps developers deeply understand theower issue. For event information, the x-axis is time; the y-axiss the processes that generate these events. The recorded eventsnclude wakelock, sensor, screen, etc. We only found wakelock
Kindle 86.34Daily Bible 131.23Audible 158.95
information in this scenario, the mediaserver process appeared inboth devices, and rild, surfaceflinger occupy wakelock on Nexus Swhile systemui on Xoom side. YouTube also occupies the wakelockfor a long time as showed in Fig. 4(a) and (c), developers can analyzetheir code to improve the wakelock utilization, for instance, releasewakelock in app pause state. Fig. 4(b) and (d) demonstrate powervariation of processes which occupy the event or has high powerconsumption, YouTube consumes high power when we start theapplication, while mediaserver periodically reached the high point.After analyzed the resource usage information in the beginning ofYouTube, we found it transmitted network packets and dealt withuser inputs (e.g. touch, click). No other abnormal data detected.Another reason for such high power consumption is the preparation
Fig. 5. The power comparison of seven video applications.

Y. Li et al. / Sustainable Computing: Informatics and Systems 4 (2014) 183–195 189
4
cBspmcWJeSac
mtItnofrc
Fa
(a)
(b)
Fig. 6. The power comparison of seven games..2.3. System developer scenarioSystem developers care more about the whole system power
onsumption, not a particular application or hardware component.ugu provides power information of all processes running in theystem, which exactly helps them to know the whole picture. Fromrevious experiments, we observed that system processes consumeuch more power than target application itself. To show it is a
ommon issue, we did another experiment on game applications.e evaluated 7 popular games: Angry Birds, Cut The Rope, Nin-
ump and so forth. Fig. 6 demonstrates the power consumption ofach game and several corresponding system processes on Nexus. We can see that system processes, such as irq/308-mxt224, medi-server and zygote, consumed much power, they were not negligibleomparing with our target applications.
Except active applications, background applications are also aain concern for system designers. We did several experiments
o show how applications and the system behave in sleep mode.n the experiments, we first tested the situation that only sys-em processes exist and no applications opened. From Fig. 7 weotice that surfaceflinger occupied the wakelock almost all the time
n Xoom, while systemui and rild dominated on the Nexus S. sur-aceflinger and systemui work on the user interface drawing andendering part, rild is responsible for the phone service. These pro-esses acquired and released wakelock continuously, which make(a)
(b)
ig. 7. The comparison of devices event information under “sleep” mode with nopplication running.
Fig. 8. The comparison of devices power information under “sleep” mode withbackground applications.
the processor can hardly get the chance to work in C states. Compar-ing with Nexus S, Xoom can last much more longer after one fullycharge. To present the real case when users use these devices, wedid the experiments with applications running in the background.The most common situation it represents is when users go to sleep,their mobile devices are in sleep state without exiting all openedapplications. Fig. 8 shows the power variation of top three powerconsuming processes of Nexus S and Xoom under “sleep” modewith unclosed applications. Before we put the devices into “sleep”mode, we opened facebook, twitter, youtube, angrybird and pandora,and played with each of them for a few minutes. From the fig-ure we know that most applications’ power are low, while systemprocesses still consume a lot. Hence, system developers shouldfocus more on optimizing these background processes and services.
4.3. Applications power information analysis
In this section, we analyze mobile applications’ power datain both foreground and background situation. For each case, wedescribe applications’ total power and distribution among mainhardware components.
4.3.1. Apps run in foregroundWe first introduce foreground scenario. In the experiments of
100 applications, their power ranges from 20 mW to over 700 mW.10% of them consumes less than 50 mW, 50% is less than 200 mW.The average power is 227 mW, and 20% is greater than 335 mWin our dataset. It is reasonable that the power varies so much. Pdfreader will run longer than Angry Bird with the same battery capac-ity. Intuitively, the power consumption of applications in the samecategory should be in the same level. To further prove the state-ment, aside from video and game applications presented above,we also took the Education, Health and Fitness applications’ datainto consideration. In these four categories, Education apps con-sume less power than the other three categories; only the powerof NYTimes greater than 200 mW. Most of Media and Health appspower are within 300 mW and 200 mW respectively. In a specific
category, the applications’ power also varies. The power differencebetween Temple Run 2 and Speed Skater is as high as 300 mW.For applications produced by the same company, the difference is
190 Y. Li et al. / Sustainable Computing: Informatics and Systems 4 (2014) 183–195
ckgro
s3
phscaboAacarcpAtcHv
4
erpad
mdag1Tgt2tlp
fsrsts
nd
variation is mainly caused by the target application.In the Music and Audio category, the most popular applica-
tions are Pandora and iHeartRadio. Figs. 11 and 12 demonstratetheir CPU and system power variation when listen to music. By
Fig. 9. The comparison of applications ba
maller as “Talking” series (Talking Angela 320 mW, Talking Ben50 mW, Talking Tom Cat 410 mW) suggest.
To figure out where the power goes, we analyzed the detailedower information logged by the Bugu client which contains mainardware components’ power dissipation for each application. Weummarize two metrics which are important factors to reflectomponent power information: NumberofAppearance, it is defineds number of applications use the component over total num-er of applications, and PowerRatio, which equals the percentagef the component consumed power over total application power.ccording to our experiment results, CPU is used in all applicationsnd its average PowerRatio is the highest in the components weonsidered. This means most of the time the CPU dominates thepplications’ power. 13% and 20% applications use GPS and Audioespectively, and they contribute nearly 20% power to the appli-ations. Although there are only 14% applications in our datasetlay with Video module, the average PowerRatio is as high as 61%.fter focusing on high video power ration application, we found
hat video power is much higher than CPU power except two appli-ations that their video power and CPU power are almost equal.ence, when applications play video, its main power dissipationery likely transfers from CPU to Video.
.3.2. Apps run in backgroundFor background applications, we classify them as two cat-
gories: idle background and active background. The formerepresents the applications that will stop working and enter sus-end status when in background. Active background means thepplications that still have activities even in background, such asownload applications and music applications.
Idle Background: The idle background situation is common forost applications, especially for media apps and games. Fig. 9
emonstrates background power and foreground power of 21pplications in our dataset. 60% of the applications, their back-round power is less than 50 mW, and two of them are over00 mW. The background power varies from 1.5 mW to 190 mW.he applications are listed by their category. Similar with the fore-round case, the background power of applications which are inhe same category also varies; Office Suite background power is0 mW while Olive Office Premium reaches 80 mW. For applica-ions with high ratio of background power to foreground power,ike Expense Manager, we found their power is dominated by CPUower consumption.
When applications go to idle background state, users move theirocus to the new foreground application. Except maintaining thetatus in case they will run again in a short time, they should occupyesources as less as possible. Hence, an energy efficient applicationhould reduce their background power consumption and maintainhe ratio of background power to foreground power in a relatively
mall range.Active Background: Some applications still active and functionormally when they are in background. For example, we open Pan-ora to listen to music and at the same time we check emails or read
und and foreground power consumption.
news in foreground. In that situation, we claim that Pandora is inActiveBackground state. For this kind of applications, they completemost of their work in active background situation.
In the experiments, we choose five popular applications fromMusic and Audio category: Pandora, iHeart Radio, Amazon MP3,TuneIn Radio and Spotify, and four download applications: Down-load Manager, tTorrent Lite, uTorrent and aTorrent. Amazon MP3randomly played local songs and radio applications played severalstations, four download applications downloaded a 325 M videofile. Fig. 10 describes their power dissipation in foreground, activebackground and idle background situations. When the applicationsenter active background situation, their power dissipation is lessthan foreground case and most of them only decrease a little. Thepower consumption of uTorrent in the two cases are almost thesame, Pandora’s power reduce 20 mW which is about 5% of totalpower. For idle background situation, six of their power are lessthan 5 mW, aTorrent’s idle background power is also less than 6% oftotal foreground case power. Spotify and aTorrent decrease aroundhalf of the power when enter active background case, the user expe-rience of the two applications did not change, there was no visibledelay to play music and download the video. The possible explana-tion may relate to other functionality suspended in background.
4.3.3. Real Apps case studiesWe analyzed several applications’ power information, which
includes: Pandora, iHeartRadio, Facebook, Firefox, by trackingresource usage information through Bugu. With the considerationof system processes and the comparison of similar applications’data, we revealed some underlying reasons of high power situ-ations. In the experiments, we installed target applications in aclean OS and the logged power is the whole system power. Sincewe only run the target application in foreground and suspend allbackground processes (e.g. Google Services), any system power
Fig. 10. The comparison of applications power consumption in foreground, activebackground and idle background.

Y. Li et al. / Sustainable Computing: Informatics and Systems 4 (2014) 183–195 191
ctmtardaatc(ohmswidmpfsi
F
Fig. 11. The system and CPU power information of Pandora.
omparing the two applications’ system power, we noticed thathe power of iHeartRadio was higher than Pandora’s when playing
usic. The CPU power in the two applications was reasonable ashe high power situations were caused by handling user input, suchs changing channel/song, and network transmission. To find theoot cause that lead to high system power of iHeartRadio, we firstetailed compared the resource usage information which includesudio, video, wakelock, CPU time and network packets of the twopplications. Fig. 13 shows their audio and wakelock time, the audioime of iHeartRadio was all 0. Hence, when we calculate the appli-ation power, the result of iHeartRadio was less than Pandora’sshowed in Section 4.3.2) as the audio power and wakelock powerf iHeartRadio were almost 0. However, it did not illustrate theigh system power of iHeartRadio. Next, we analyzed the infor-ation of all processes running in the system. Aside from Bugu,
ystem (uid:1000) and the target application, the active processas mediaserver (uid:1013) in both cases. Because the audio time
s logged in MediaPlayer.java in Android OS, we think iHeartRa-io did not use build-in player program to communicate withediaserver, which causes high system power consumption when
laying music. The resource usage information of Douban Artistsurther proved the statement since the trend of audio time andystem power were similar with Pandora’s. The wakelock data ofHeartRadio and Douban Artists was almost the same, and the high
Fig. 12. The system and CPU power information of iHeartRadio.
ig. 13. The information of wakelock and audio time for Pandora and iHeartRadio.
Fig. 14. The system and CPU power variation of Facebook.
wakelock usage in Pandora was mainly the result of frequent adver-tising. Social network application becomes the main platform thatkeeps people in touch in today’s society. In our experiments, wechecked the latest news of friends and posted the status with andwithout photo. The power variation of Facebook and resource usageinformation are demonstrated in Figs. 14 and 15 respectively. At thestarting of the application and dealing with the user inputs, CPUpower dominated the whole system power. There is a high powerperiod from 81s to 115s, and it is caused by taking a photo as shownin Fig. 15 (Facebook Full Wakelock and Facebook Accelerometer over-lapped). When we prepared to post status, the location processbecame active for several seconds and it used Particial Wakelockand GPS. Users may share their location in the posted status. As theresult, the corresponding system power was increased a little bit.The same situation can be also found in Twitter, the location pro-cess appeared and the system power increased. When we posteda status with photo, Twitter delegated the job to Android defaultapplication Gallery while Facebook handled by itself. On the aspectof the system power, the two approaches are similar although thewakelock and accelerometer were used by different processes.
For browser applications, we analyzed Firefox and comparedits data with Opera’s as the high power consumption of Firefoxdemonstrated in the previous section. We opened several popularwebpages. On the perspective of system processes, the situations ofthe two applications were similar. The particial wakelock’s time ofmediaserver and location process occasionally increased, they werenot actually in active state. The wakelock time of Google Search Boxalso increased, which was more frequent than in other applications,such as YouTube and TempleRun. For application itself, CPU powerdominated the whole power. Aside from user inputs, network activ-ity also causes high CPU usage. Fig. 16 illustrates the system powerand packets information when Firefox was in foreground. The peakpoints of high packets transmission correspond to high power con-
sumption. There are a lot of times that packets were over 10,000,while the situation happened much less in Opera’s case. Hence,we think it is the main reason for high power consumption ofFig. 15. The part of the system resource usage information when playing with Face-book.
192 Y. Li et al. / Sustainable Computing: Inform
Fhica
4
lwmct3wtgttp5
4
fiumoataifp
Fig. 16. The system power and packets information of Firefox browser.
irefox. For download applications, high packets transmission mayelp save energy since the system can go to sleep state after the job
s done. However, it is not hold for frequent user interactive appli-ations as the interval time between two tasks (user inputs) is notlways longer enough for system to switch to the sleep state.
.4. Bugu accuracy
As discussed in Section 5, there is no ground truth for applicationevel power consumption. Hence, to analyze the accuracy of Bugu,
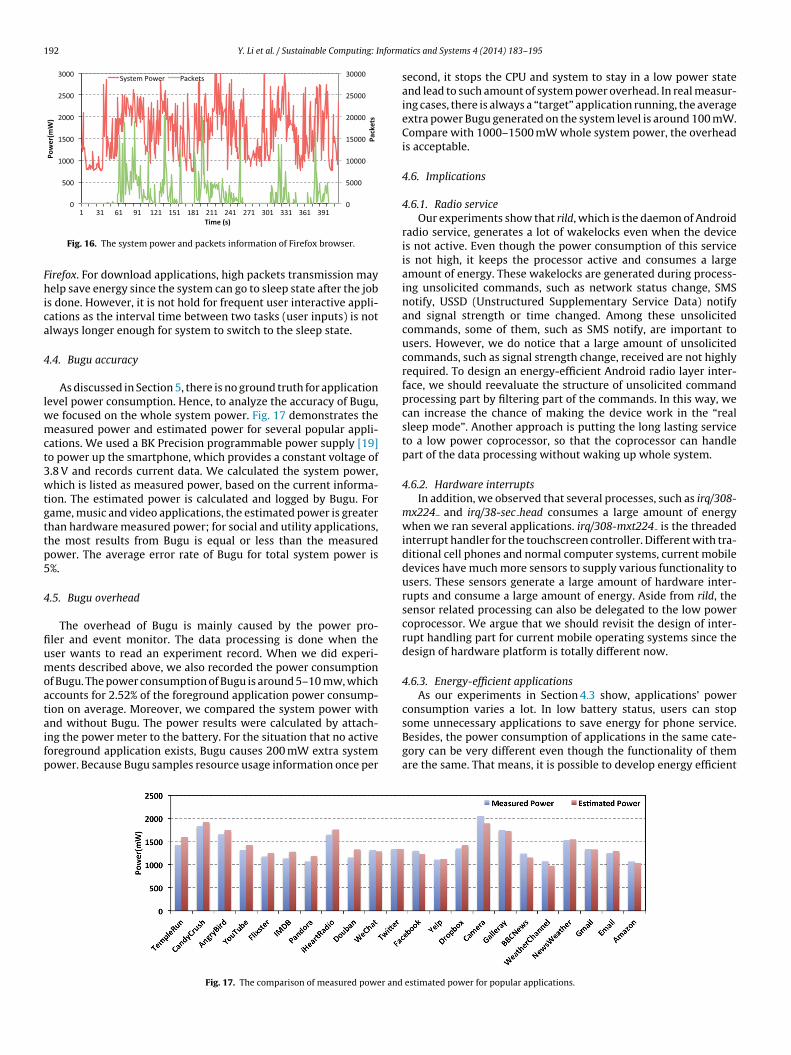
e focused on the whole system power. Fig. 17 demonstrates theeasured power and estimated power for several popular appli-
ations. We used a BK Precision programmable power supply [19]o power up the smartphone, which provides a constant voltage of.8 V and records current data. We calculated the system power,hich is listed as measured power, based on the current informa-
ion. The estimated power is calculated and logged by Bugu. Forame, music and video applications, the estimated power is greaterhan hardware measured power; for social and utility applications,he most results from Bugu is equal or less than the measuredower. The average error rate of Bugu for total system power is%.
.5. Bugu overhead
The overhead of Bugu is mainly caused by the power pro-ler and event monitor. The data processing is done when theser wants to read an experiment record. When we did experi-ents described above, we also recorded the power consumption
f Bugu. The power consumption of Bugu is around 5–10 mw, whichccounts for 2.52% of the foreground application power consump-ion on average. Moreover, we compared the system power with
nd without Bugu. The power results were calculated by attach-ng the power meter to the battery. For the situation that no activeoreground application exists, Bugu causes 200 mW extra systemower. Because Bugu samples resource usage information once perFig. 17. The comparison of measured power and
atics and Systems 4 (2014) 183–195
second, it stops the CPU and system to stay in a low power stateand lead to such amount of system power overhead. In real measur-ing cases, there is always a “target” application running, the averageextra power Bugu generated on the system level is around 100 mW.Compare with 1000–1500 mW whole system power, the overheadis acceptable.
4.6. Implications
4.6.1. Radio serviceOur experiments show that rild, which is the daemon of Android
radio service, generates a lot of wakelocks even when the deviceis not active. Even though the power consumption of this serviceis not high, it keeps the processor active and consumes a largeamount of energy. These wakelocks are generated during process-ing unsolicited commands, such as network status change, SMSnotify, USSD (Unstructured Supplementary Service Data) notifyand signal strength or time changed. Among these unsolicitedcommands, some of them, such as SMS notify, are important tousers. However, we do notice that a large amount of unsolicitedcommands, such as signal strength change, received are not highlyrequired. To design an energy-efficient Android radio layer inter-face, we should reevaluate the structure of unsolicited commandprocessing part by filtering part of the commands. In this way, wecan increase the chance of making the device work in the “realsleep mode”. Another approach is putting the long lasting serviceto a low power coprocessor, so that the coprocessor can handlepart of the data processing without waking up whole system.
4.6.2. Hardware interruptsIn addition, we observed that several processes, such as irq/308-
mx224 and irq/38-sec head consumes a large amount of energywhen we ran several applications. irq/308-mxt224 is the threadedinterrupt handler for the touchscreen controller. Different with tra-ditional cell phones and normal computer systems, current mobiledevices have much more sensors to supply various functionality tousers. These sensors generate a large amount of hardware inter-rupts and consume a large amount of energy. Aside from rild, thesensor related processing can also be delegated to the low powercoprocessor. We argue that we should revisit the design of inter-rupt handling part for current mobile operating systems since thedesign of hardware platform is totally different now.
4.6.3. Energy-efficient applicationsAs our experiments in Section 4.3 show, applications’ power
consumption varies a lot. In low battery status, users can stop
some unnecessary applications to save energy for phone service.Besides, the power consumption of applications in the same cate-gory can be very different even though the functionality of themare the same. That means, it is possible to develop energy efficientestimated power for popular applications.

nformatics and Systems 4 (2014) 183–195 193
aahnampsbitesc
4
tmcs
aAwepwraoseet
5
tnm
ammawfiSdweatooiamTcaos
Y. Li et al. / Sustainable Computing: I
pplications without influencing user experience. In detail, therere two directions that we can look into. Aside from the mainardware components, other parts such as DSP, sensors are alsoeeded to be used in an energy-efficient way. For example, videopplications may use video module more than CPU since videoodule power consumption dominates the whole application’s
ower. Another direction is to improve applications’ backgroundituation. From the experiment results, some applications in theackground are not really suspended. Considering the user behav-
or that they usually put applications in background rather than killhem, these applications may generate big influence on the systemnergy. Hence, when the developers implement applications, theyhould reevaluate the background case and decrease the poweronsumption as much as possible.
.6.4. System power management designOne important goal that we design operating system is to protect
he hardware from misuse by applications. However, some poweranagement APIs, like wakelock, are not used efficiently and they
an cause big energy issue. We think the APIs for application designhould be reevaluated from energy saving angle.
The energy consumption of screen, processor, radio and Wi-Ficcounts for about 95% of the whole system energy consumption.mong these devices, it is hard to decrease the power of screen,hich accounts for about 50%, through many kinds of system level
nergy-efficient strategies. In addition, the space to decrease theower of radio and Wi-Fi is low if the users need to use them. Even ife could filter some of the unsolicited commands, we cannot make
adio work in low power mode. Thus, it is nearly inevitable to designn energy-efficient strategy that can drop the energy consumptionf the system significantly. So, we claim that there is no chance toolve the power problem for mobile devices with a single energy-fficient strategy. The mobile operating system needs a group ofnergy-efficient design strategies to work together to accomplishhis goal.
. Discussions
Throughout the performance evaluation of Bugu, we noticedhat there are two fundamental issues about power profiling thateed to be answered, i.e. Accuracy of software based power measure-ent tool and Ground truth for power measurement.
Is software based power measurement tool a good choice? Therere two basic approaches to measure power/energy: hardwareeasurement using power meters and software based measure-ent tool leveraging power models. Different power models are
pplied in the software measurement tools. For instances, hard-are components utilization power model in PowerTutor [20] andnite state machine of components’ states transition in Eprof [21].ince the software approach is easier to use and no additionalevice is required, more and more people prefer to choose soft-are tools to measure power/energy consumption. However, in our
xperiments, we found the software-based results are not stablet least for some applications. In Fig. 18, we listed two applica-ions’ power information measured by Bugu and PowerTutor. Inur experiments, each application ran 5 times and each time theperations we did are identical. In order to eliminate applicationnterference, only the target application and the measurement toolre opened. We normalized the power consumption to the mini-um value in the total 5 results to emphasize the power variation.
he data shows that the variation can be as large as 20%, in that
ase, what result should we use? It is hard to tell the correct valuend it is possible that if we continue measure, there will be moreptions come out. The situation may be caused by the operatingystem process, the communication between application and OSFig. 18. The comparison of different power results.
and the complicated hardware/software interactions. Hence, thesoftware-based result is reasonable after repeated experiments anda single experiment data is not very useful. In other words, theresults measured by the software-based tools are accurate at someextent.
Ground truth? How to evaluate the accuracy of a power mea-surement tool? The common approach is comparing the calculatedresults with the ground truth. However, the ground truth for appli-cation level power is not easy to get. As we described above,comparing with other software-based tools is not a good choice.From the hardware measurement point of view, a simple approachis using power meter to get the whole system data. If we want to geteach component’s power information, the measurement should bedid on the testbed where the circuit information is provided. Whilethe two approaches are for system power, they cannot give an accu-rate power information for each application if there are multipleapplication running in the system. So, most researchers only runone application to match the results in training stage. The big chal-lenge is how to get the ground true of allocating system power toeach application and considering the application interference.
6. Related work
Nowadays energy becomes more and more important. There aremany researchers working on the energy saving issue. As early as2002, energy has been treated as a first-class resource in ECOSys-tem [22] which contains a currentcy model and allocate the energyto different tasks according to user preferences to extend batterylifetime. Besides, Koala [23] predicts the performance and energyconsumption and dynamically control frequency to save energy.Since mobile devices become more and more popular, researchersare also interested in saving energy in mobile field [24,25]. Forexample, Cinder [26] also leverage the idea and treat energy asa resource, but it allocates energy directly to each processes anduses hierarchical structure to control the resource, which avoid-ing the competing between parent and child processes. Roy et al.[27] implemented Cinder and showed the good performance evenwith malicious applications. However, all these researches arefrom system viewpoint and they need to change original operat-ing system, which is not easy to implement and spread. The Buguservice can benefit three groups of people, for system developers,it is a tool to analyze existing problems and then modify systemaccordingly.
To save power, we first need to measure the power. The easiestway is using multimeters to read data and calculate power directly,so we need extra device to calculate power in the early stage. The
prototype version of PowerScope [28] uses a digital multimeter tosample the current drawn of the profiling computer and recordssystem activity at the same time. As a result, it generates an energyprofile for later analysis. PowerPack [29] also uses digital meter
1 nform
tdtpem[eZeflAtetc
m[eecpcdcge[asceaatwHtta
7
iawacesaeco
A
eio2
[
[
[
[
[
[
[
[
[
[[
[
[
[
[
[
[
94 Y. Li et al. / Sustainable Computing: I
o measure, while it focuses on each hardware components (CPU,isk, memory, etc.). For convenience, researchers use power modelo calculate power consumption. Dempsey [30] extracts powerarameters to model the disk drive power consumption. Bertrant al. [31] took advantage of performance counters to build powerodel and provided per component power consumption. Quanto
32] system addresses network communication power model inmbedded system, the key parameter is network event. Dong andhong [33] provided a self-constructive approach to build systemnergy model for mobile systems by using the smart battery inter-ace to get enough information. Bugu system provides applicationevel energy information by monitoring hardware status. AlthoughppScope [34] also applies that approach, they get time informa-
ion by monitoring kernel events. Besides, their goal is to measurenergy and build energy metering. Our work pays more attentiono analyzing the results we get and use them to bring benefits forlients.
Speaking of saving energy for mobile devices, researchers payore attention to specific components. For instances, EnTracked
35] uses dynamically changing context to schedule GPS so that it isnergy-efficient as well as keep the performance. MAUI [36]savesnergy through fine-grained code offload after evaluating energyonsumption under connectivity constrains. Duan and Bi [37] pro-osed a hybrid approach which leverages mobile RAM and phasehange memory to achieve memory energy optimization. Our workoes not care particular part of mobile devices or specific appli-ation. We focus on general applications running in the system,ive users application-level energy information and help them savenergy from both application and system aspects. Pathak et al.21] presented an energy accounting approach on application levelnd proposed saving energy by optimizing I/O bundle. The Buguervice illustrates the event information and application poweronsumption, and gives the whole system power picture. It ben-fits both application developer and system developer. Carat [38]lso compares application’s power consumption by collecting from
community of mobile devices. They provide hog report describeshe energy hungry applications among all clients and bug reporthich shows the energy hungry applications only on your machine.owever, without information of applications in the same category,
hey cannot detect if the hog application has an energy bug. Besides,hey cannot provide more analysis for developers to optimize theirpplications.
. Conclusions
In this paper, we analyzed mobile applications’ power behav-or using Bugu which is an application level power profiler andnalyzer for mobile phones. Bugu is composed of a server sidehich provides power information of different applications, and
client side that analyzes power and event information for spe-ific applications. We implemented Bugu on Android platform andvaluated its accuracy (95%) and overhead. We showed the casetudies of finding the root causes of large power consumption. Thenalysis of 100 applications’ power information is useful for manynergy/power related researches on mobile devices, and the impli-ations derived from the observation point out several potentialptimization directions.
cknowledgements
The authors would like to thank the anonymous review-
rs for their comments and kindly suggestions. This work isn part supported by NSF grant CNS-1205338, the Introductionf Innovative R&D team program of Guangdong Province (No.01001D0104726115), and Wayne State University Office of Vice[
atics and Systems 4 (2014) 183–195
President for Research. This material is based upon work supportingwhile serving at the National Science Foundation.
References
[1] Global mobile data traffic forecast update, http://www.cisco.com/c/en/us/solutions/collateral/service-provider/visual-networking-index-vni/whitepaper c11-520862.html
[2] Number of android applications, http://www.appbrain.com/stats/number-of-android-apps
[3] A. Pathak, Y.C. Hu, M. Zhang, Bootstrapping energy debugging on smartphones:a first look at energy bugs in mobile devices, in: Proceedings of the 10th ACMWorkshop on Hot Topics in Networks, ser. HotNets-X, New York, NY, USA, ACM,2011, pp. 5:1–5:6.
[4] Green software awareness survey, http://www.sig.eu/blobs/Nieuws/2011/Results%20Survey-201109.pdf
[5] Battery doctor, https://play.google.com/store/apps/details?id=com.ijinshan.kbatterydoctor en
[6] Juicedefender, https://play.google.com/store/apps/details?id=com.latedroid.juicedefender
[7] Battery stats plus, https://play.google.com/store/apps/details?id=com.rootuninstaller.bstats
[8] Dr.power, http://tawkon.com/blog/en/dr power[9] R. Mittal, A. Kansal, R. Chandra, Empowering developers to estimate app
energy consumption, in: Proceedings of the 18th Annual International Con-ference on Mobile Computing and Networking, ser. Mobicom’12, New York,NY, USA, ACM, 2012, pp. 317–328, http://dx.doi.org/10.1145/2348543.2348583(Online), Available from:.
10] Trepn profiler, qualcomm Developer Network, https://developer.qualcomm.com/mobile-development/increase-app-performance/trepn-profiler
11] R.T. Fielding, Architectural styles and the design of network-based softwarearchitectures (Ph.D. dissertation), 2000.
12] H. Chen, Y. Li, W. Shi, Fine-grained power management using process-levelprofiling, in: Sustainable Computing: Informatics and Systems, ser. SUSCOM,January, 2012.
13] M. Dong, L. Zhong, Power modeling and optimization for OLED displays, IEEETrans. Mobile Comput. 11 (2012) 1587–1599.
14] Google, Wakelock, android power management, http://developer.android.com/reference/android/os/Pow-erManager.html
15] C. Maia, L.M. Nogueira, L.M. Pinho, Evaluating android OS for embeddedreal-time systems, in: Operating Systems Platforms for Embedded Real-TimeApplications, ser. OSPERT 10, July, 2010.
16] S. Tilkov, A brief introduction to rest, 2007, December http://www.infoq.com/articles/rest-introduction
17] Pxi platform, Industry leading, pc-based platform for test, measurement, andcontrol, National Instruments, http://www.ni.com/pxi/
18] Accumulated number of application and games in the android market,http://www.androlib.com/appstats.aspx
19] BP Precision, b&K Precision Corp. Model 1785B, http://www.bkprecision.com/20] M. Gordon, L. Zhang, B. Tiwana, R. Dick, Z.M. Mao, L. Yang, PowerTutor: a power
monitor for android-based mobile platforms, http://ziyang.eecs.umich.edu/projects/powertutor/
21] A. Pathak, Y. Hu, M. Zhang, Where is the energy spent inside my app?: finegrained energy accounting on smartphones with Eprof, in: Proceedings of the7th ACM European Conference on Computer Systems, ser. EuroSys’12, NewYork, NY, USA, ACM, 2012, pp. 29–42.
22] H. Zeng, C.S. Ellis, A.R. Lebeck, A. Vahdat, Ecosystem: managing energy as afirst class operating system resource, in: Proceedings of the 10th InternationalConference on Architectural Support for Programming Languages and Oper-ating Systems, ser. ASPLOS-X, New York, NY, USA, ACM, 2002, pp. 123–132,http://dx.doi.org/10.1145/605397.605411 (Online), Available from:.
23] D.C. Snowdon, E. Le Sueur, S.M. Petters, G. Heiser, Koala: a platform forOS-level power management, in: Proceedings of the 4th ACM European Con-ference on Computer Systems, ser. EuroSys’09, New York, NY, USA, ACM, 2009,pp. 289–302, http://dx.doi.org/10.1145/1519065.1519097 (Online), Availablefrom:.
24] J. Flinn, M. Satyanarayanan, Energy-aware adaptation for mobile applica-tions, in: Proceedings of the Seventeenth ACM Symposium on OperatingSystems Principles, ser. SOSP’99, New York, NY, USA, ACM, 1999, pp. 48–63,http://dx.doi.org/10.1145/319151.319155 (Online), Available from:.
25] N. Vallina-Rodriguez, J. Crowcroft, ErdOS: achieving energy savings inmobile OS, in: Proceedings of the Sixth International Workshop onMobiArch, ser. MobiArch’11, New York, NY, USA, ACM, 2011, pp. 37–42,http://dx.doi.org/10.1145/1999916.199926 (Online), Available from:.
26] S.M. Rumble, R. Stutsman, P. Levis, D. Mazières, N. Zeldovich, Appre-hending joule thieves with cinder, in: Proceedings of the 1st ACMWorkshop on Networking, Systems, and Applications for Mobile Hand-helds, ser. MobiHeld’09, New York, NY, USA, ACM, 2009, pp. 49–54,http://dx.doi.org/10.1145/1592606.192618 (Online), Available from:.
27] A. Roy, S.M. Rumble, R. Stutsman, P. Levis, D. Mazières, N. Zeldovich,Energy management in mobile devices with the cinder operatingsystem, in: Proceedings of the Sixth Conference on Computer Sys-tems, ser. EuroSys’11, New York, NY, USA, ACM, 2011, pp. 139–152,http://dx.doi.org/10.1145/1966445.1966459 (Online), Available from:.
nform
[
[
[
[
[
[
[
[
[
[
[
eral international conferences. He is a recipient of the NSF
Y. Li et al. / Sustainable Computing: I
28] J. Flinn, M. Satyanarayanan, PowerScope: a tool for profiling the energy usage ofmobile applications, in: Second IEEE Workshop on Mobile Computing Systemsand Applications, WMCSA’99, February, 1999, pp. 2–10.
29] R. Ge, X. Feng, S. Song, H.-C. Chang, D. Li, K.W. Cameron, PowerPack: energy pro-filing and analysis of high-performance systems and applications, IEEE Trans.Parallel Distrib. Syst. 21 (5) (2010) 658–671.
30] J. Zedlewski, S. Sobti, N. Garg, F. Zheng, A. Krishnamurthy, R. Wang, Modelinghard-disk power consumption, in: Proceedings of the 2nd USENIX Conferenceon File and Storage Technologies, FAST’03, Berkeley, CA, USA, USENIX Associa-tion, 2003, pp. 217–230.
31] R. Bertran, M. Gonzalez, X. Martorell, N. Navarro, E. Ayguade, Decomposableand responsive power models for multicore processors using performancecounters, in: Proceedings of the 24th ACM International Conference on Super-computing, ACM Press, 2010, pp. 147–158.
32] R. Fonseca, P. Dutta, P. Levis, I. Stoica, Quanto: tracking energy in net-worked embedded systems, in: Proceedings of the 8th USENIX Conferenceon Operating Systems Design and Implementation, ser. OSDI’08, Berkeley,CA, USA, USENIX Association, 2008, pp. 323–338 (Online), Available from:http://dl.acm.org/citation.cfm?id=1855741.1855764
33] M. Dong, L. Zhong, Self-constructive high-rate system energy modelingfor battery-powered mobile systems, in: Proceedings of the 9th Inter-national Conference on Mobile Systems, Applications, and Services, ser.MobiSys’11, New York, NY, USA, ACM, 2011, pp. 335–348, http://dx.doi.org/10.1145/1999995.2000027 (Online), Available from:.
34] C. Yoon, D. Kim, W. Jung, C. Kang, H. Cha, AppScope: application energy meter-ing framework for android smartphone using kernel activity monitoring, in:USENIX Annual Technical Conference, ser. USENIX ATC’12, Boston, MA, USA,June, 2012.
35] M.B. Kjaergaard, J. Langdal, T. Godsk, T. Toftkjaer, Demonstrating entrackeda system for energy-efficient position tracking for mobile devices, in:Proceedings of the 12th ACM International Conference Adjunct Papers on Ubiq-uitous Computing, ser. Ubicomp’10 Adjunct, New York, NY, USA, ACM, 2010,pp. 367–368, http://dx.doi.org/10.1145/1864431.1864439 (Online), Availablefrom:.
36] E. Cuervo, A. Balasubramanian, D. ki Cho, A. Wolman, S. Saroiu, R. Chandra, P.Bahl, MAUI: making smartphones last longer with code offload, in: Proceedingsof the 8th International Conference on Mobile Systems, Applications, and Ser-vices, ser. MobiSys’10, New York, NY, USA, ACM, 2010, pp. 49–62.
37] R. Duan, M. Bi, C. Gniady, Exploring memory energy optimizations in smart-phones, in: 2011 International Green Computing Conference and Workshops(IGCC), July, 2011, pp. 1–8.
38] A. Oliner, A. Iyer, E. Lagerspetz, S. Tarkoma, I. Stoica, Carat: collaborative energydebugging, https://www.wattsupmeters.com
atics and Systems 4 (2014) 183–195 195
Youhuizi Li is currently a Ph.D. candidate at WayneState University. She received her B.S. degree from XidianUniversity in 2010, and M.S. degree from Wayne State Uni-versity in 2013, both in Computer Science. Her researchinterests include sustainable computing, mobile systempower management, energy-friendly software design andoptimization. She has co-authored a couple of journals andinternational conference papers.
Hui Chen is a Ph.D. candidate in computer science atWayne State University. His major research interestsinclude computer systems and sustainable computing.Currently, he is working on user-centric power manage-ment for mobile operating systems. He received his B.S.degree in school of Mechano-electronic engineering fromXidian University in 2004, and M.S. degree in computerscience and engineering from Beijing Institute of Technol-ogy in 2008.
Weisong Shi is a professor of computer science at WayneState University. He received his B.S. from Xidian Univer-sity in 1995, and Ph.D. degree from the Chinese Academyof Sciences in 2000, both in Computer Engineering. Hiscurrent research focuses on computer systems, sustain-able computing, mobile and cloud computing, smarthealth. Dr. Shi has published more than 140 peer reviewedjournal and conference papers. He has served the programchairs and technical program committee members of sev-
CAREER award, one of 100 outstanding Ph.D. disserta-tions (China) in 2002, Career Development Chair Awardof Wayne State University in 2009, and the “Best Paper
Award” of ICWE’04, IPDPS’05, HPCChina’12 and IISWC’12.


![Computing Informatics[1]](https://static.fdocuments.in/doc/165x107/55cf96d1550346d0338dfa93/computing-informatics1.jpg)


![Computing Informatics L 10 16[1]](https://static.fdocuments.in/doc/165x107/577cd0831a28ab9e789274e1/computing-informatics-l-10-161.jpg)


