Sustainable Community Strategy 2011 2014 - Coventry Community Strategy ... 30,000 net increase in...
16
Sustainable Community Strategy 2011–2014 2012/13 Half Year Performance Report Carol Dear ([email protected]), Si Chun Lam ([email protected]), Bev McLean ([email protected]) Policy, Research, Partnership and Performance Division Chief Executive’s Directorate Coventry City Council Half Year 2012/13
Transcript of Sustainable Community Strategy 2011 2014 - Coventry Community Strategy ... 30,000 net increase in...

Sustainable Community Strategy 2011–2014
2012/13 Half Year Performance Report
Carol Dear ([email protected]), Si Chun Lam ([email protected]), Bev McLean ([email protected])
Policy, Research, Partnership and Performance Division Chief Executive’s Directorate
Coventry City Council
Half Year 2012/13

_ _ _ _ _ _
Sustainable Community Strategy 2011 – 2014 The Coventry Partnership is the Local Strategic Partnership (LSP) for Coventry and represents partners from the public, private, community and voluntary sectors. The Sustainable Community Strategy (SCS) identifies what more needs to be done to continue to improve the general quality of life for everyone in the city with a partnership approach. The current version of the SCS was reviewed and approved by the Coventry Partnership Board in June 2011, and the responsibility for its performance management sits with the Coventry Local Public Service Board (CLPSB). Find out more at www.coventrypartnership.com/scs.
Key A number of symbols are used in the report to illustrate the progress made, and the performance towards the targets set against each of the headline indicators. The symbols and their meaning are set out below.
Symbol Progress Target
Indicator progressing in the right direction (towards target) On-target
Indicator moving in the wrong direction (away from target) Off-target
Indicator progress is similar or unchanged
Not available
Find out more This report is a high-level summary of the Coventry Partnership’s performance at half year 2012/13 and March 2013. It forms part of the Partnership’s performance reporting arrangements. Further information, including detailed report cards setting out trend data, a directory of performance reports and the Council’s policies and strategies, is made available on the Coventry Partnership website:
www.coventrypartnership.com/scs
Vision and Objectives
Coventry proud to be a city that works …
…to create growth, jobs and enterprise particularly through advanced manufacturing and green technologies
… make the city more vibrant
…to reduce health inequalities
…to improve children and young people’s education and opportunities
The way we work
We will work together to deliver positive change within the city through the delivery of the Sustainable Community Strategy by…
…remaining focused on our key objectives …reviewing and improving services …using our combined resources, energy and creativity …supporting partners
December 2012 & March 2013
December 2012

www.coventry.gov.uk/performance/1
March 2013
Coventry, proud to be a city that works to…
Create growth, jobs and enterprise particularly through advanced manufacturing and green technologies
Executive summary
Since the recession in 2008/09, the UK economy has remained flat, and recovery remains slow. The latest gross domestic product (GDP) estimate suggests that the economy grew by 0.2% in 2012 overall. This is due to a growth of 1% in Q3, mostly attributed to a boost from the Olympic and Paralympic Games; in contrast to the contractions of -0.1%, -0.4% and -0.3% seen in Q1, Q2 and Q4 respectively.i The Bank of England commented that the recovery in output since the 2008/09 recession "has been notably weaker than previous UK recoveries and recent international experience"ii. The Office for Budget Responsibility view is that many of the difficulties are due to "external inflation shocks, deteriorating export markets, and financial sector and eurozone difficulties" – but noted that the Government's "fiscal consolidation measures" also had a role in dampening the economy, estimating that spending cuts reduced GDP in 2011/12 by around 1.4%.iii Recent figures suggest more optimism for 2013: The members of the Bank of England's Monetary Policy Committee (MPC)'s best collective judgement is that "the economy is likely to see a slow but sustained recovery over the next three years"ii; while the unexpectedly higher growth in the services sector in February 2013, as measured by the Purchasing Managers' Index (PMI), suggests that the UK is likely to grow in Q1 2013, thus avoiding a triple-dip recession.iv Locally, findings from the Coventry and Warwickshire Chamber of Commerce’s Quarterly Economic Survey (Q4, 2012) show a dramatic improvement in business confidence: 66% of firms in the manufacturing sector and 71% in the service sector expect turnover to grow in the next twelve months – up from 32% and 49% respectively in Q3.v
Raising our G-AME Coventry & Warwickshire City Deal
25% of firms* to
invest in R&D *advanced manufacturing enterprises
5,000 new engineers in two years
30,000 net increase in jobs in the area by
2020
20% in advanced manufacturing investment + support
In Coventry, the agenda for growth, jobs and enterprise is driven by a number of partners, including the Coventry Partnership's Economy, Learning, Skills and Employment Group – with representatives across the public, private and voluntary sectors; and the Coventry & Warwickshire Local Enterprise Partnership (LEP) – with a strategy focusing on five core enablers: strategic infrastructure; education and skills; inward investment; funding/access to finance; and low carbon. Recent achievements include initial Government approval for the City Deal bid, Re-engineering Engineering: Raising our G-AME, which was designed to build on the area’s strength in engineering and manufacturing to improve skills, innovation, productivity and jobsvi; and the progress towards the refreshed August 2012 Jobs Strategy for Coventry to secure job opportunities through investment, support people to get jobs and help people improve their skills.vii

Coventry, proud to be a city that works to… Create growth, jobs and enterprise
6.2% 10%
England Coventry
Real wages have declined (2008 to 2012) Rising prices, stagnant wages Between 2008 and 2012, food prices have risen by 19.1%; transport costs by 21%; and costs of running a home by 16.3%. After taking price increases into account, people on average earn less than they did in 2008 – around 6.2% less in Coventry, and around 10% less nationally.
Support people to develop skills needed to access jobs and progress to higher skilled jobs
Employment and unemployment levels Although the economy remains flat since the recession, unemployment has declined from the October 2009 peak, showing a decline in labour productivity. Jobseeker's Allowance The Jobseeker's Allowance (JSA) is an out-of-work benefit paid to people available for and actively seeking full-time work. In January 2013, the JSA claimant count was 9,680 claimants in Coventry and 7,974 in Warwickshire, down from 10,512 and 9,054 respectively in January 2012. The seasonally-adjusted claimant rate in January 2013 is 4.6% in Coventry and 2.2% in Warwickshire – both figures down 0.1% from half-year (September 2012). For comparison, the JSA claimant rate is 6.3% in the Metropolitan Area; 4.5% in the Region and 3.8% in England. Employment rate The average employment rate is the percentage of people aged 16-64 who are in employment. The October 2011 to September 2012 rate was 64.9% in Coventry and 74.5% in Warwickshire; giving a rate of 70.8% in the sub region. This compares to 64.8%, 75.1% and 69.9% respectively at half-year (July 2011-June 2012). Income and wages Coventry's median gross annual pay in 2012 has risen by 0.5% to £21,300. This is a slower rate of growth than other areas: Warwickshire (up 2.3% to £22,823); West Midlands Metropolitan Area (up 0.7% to £19,673); Region (up 1.3% to £19,944); and England (up 1.6% to £21,794). Looking at longer-term trends, the gap between the average Coventry income and the average England income has narrowed since 2008, but Coventry residents still earn less than the national average. This may reflect Coventry's lower living costs.
Indicator Coventry
Warwick-
shire
West Midlands Region
Progress& Target
Jobseeker's Allowance claimant count January 2013, seasonally adjusted
4.6%
2.2%
4.5%
Average employment rate July 2011 to June 2012
64.9%
74.5%
70.8%
Median gross annual pay 2012
£21,300
£22,823
£19,944
Jobseeker's Allowance claimant counts have been seasonally adjusted – national / regional data adjusted by the Office for National Statistics; sub regional data formula-adjusted by the Corporate Research Team. Median gross annual pay is for all job types, by place of residence by local authority area (Table 8.7a) from the provisional 2012 Annual Survey of Hours and Earnings using the new 2010 Standard Occupational Classifications (SOC), published by the Office for National Statistics (ONS) on 22 November 2012. The Annual Survey of Hours and Earnings (ASHE) is based on a 1% sample of employee jobs drawn from HM Revenue and Customs Pay As You Earn (PAYE) records.
Supporting people into work The Coventry Partnership is helping residents secure jobs despite these difficult challenges. The revised Jobs Strategy sets out targets to support 8,080 people who are currently unemployed, and to help 2,610 people into a job; including 2,000 and 700 respectively in 2012/13. In April to September 2012, the Council supported 2,527 people who are currently unemployed, and helped 605 people into a job. Data for year-end will be available in May 2013. A key part of delivering this strategy is through the Job Shop. Jointly operated by the Council, CSWP and JobCentre Plus, the Job Shop has seen over 8,000 visitors, and 1,800 have signed up as members of the Work Club to apply for jobs. In January, it relocated to larger premises at Bull Yard, offering seven zones: welcome; job search; specialist advice; one-to-one; Rathbone learning; youth; and employability. In the first seven weeks, the Shop has seen 3,285 people.
Sustainable Community Strategy 2011-2014
Training to improve skills levels of residents The 2011 skills estimates show 66.9% of men aged 19-64 and women aged 19-59 are qualified to NVQ Level 2 or above; 48.9% to Level 3+ and 28.8% to Level 4+. This is down from 69.9%, 51.9% and 31.4% respectively in 2010 – but this is not a statistically significant change. Coventry's rates are similar to the Region; but lag behind those of Warwickshire. The Skills and Employability Group of the LEP and the Economy, Learning, Skills and Employment Group of the Coventry Partnership is working to develop local strategies that will ensure the provision of specific skills that are and will be required to support job creation and future economic growth and also develop strategies to help fill current vacancies in the job market.
For instance, the Jobs Strategy aims to help people improve their skills by the Council working at a strategic level, with universities, colleges and businesses to equip people with the skills that investors need, and at a delivery level, through apprenticeships to address specific areas.
Indicator Coventry
Warwick-
shire
West Midlands Region
Progress& Target
People aged 19-59/64 qualified to… 2011
NVQ Level 2+ 66.9% 71.5% 69.1%
NVQ Level 3+ 48.9% 51.8% 47.8%
NVQ Level 4+ 28.8% 34.3% 28.3%Annual Population Survey regional and sub regional estimates of education attainment provided by The Data Service, for males aged 19-64 and females aged 19-59, 14 November 2012.
Create the conditions for growth and enterprise in the city's economy
The Coventry Partnership is working to create the conditions for growth and enterprise in the local economy. The LEP is focussing resources on four sectors: advanced engineering, low carbon vehicles, intelligent transport systems and digital technology – by removing specific barriers to growth through five core enablers. The four sectors currently provide 13% of local jobs, and this is expected to grow to 45% over the next 30 years. New businesses The new business VAT registration rate is a proxy for the birth of new enterprises. The latest data is for 2011, where there were 1,125 new VAT-registered businesses in Coventry and 2,525 in Warwickshire – giving a rate of 44.3 and 56.3 per 10,000 people aged 16+. This is a notable increase from 965 and 2,330 respectively in 2010. This compares to 44.9 in the West Midlands Region; 39.9 in All English Metropolitan Boroughs; and 60.6 in England. A lot of the growth and enterprise in the city's economy also come from small/medium enterprises, including those that are below the VAT registration threshold, and as such, is not captured by the above indicator. A series of case studies is published on the Coventry and Warwickshire Chamber of Commerce website, at www.cw-chamber.co.uk, setting out the wide range of small businesses operating in the sub-region.
Indicator Coventry
Warwick-
shire
West Midlands Region
Progress& Target
New business VAT registrations rate per 10,000 people aged 16+ 2011
44.3 1,125 firms
56.3 2,525 firms
44.9 19,555 firms
Levels of investment The Council's revised Jobs Strategy investment target is to attract £397m into the city and the sub-region in 2011-2014, with a target of £85m for 2012/13. In six months, £28m of investment was recorded, 32.9% of the target. This is on target, given the profile of potential investment.
Low carbon industry Heatline is a project to harness energy from the Waste to Energy plant to heat public buildings in the city centre. In October, Cofely District Energy was appointed as the commercial partner to build and operate the scheme for 25 years. The scheme is part-funded by a £2.2m grant from the Homes and Communities Agency. In January, construction began, including laying down pipes from the plant to the city centre, with completion expected in September. Upon completion, it will, initially, lower carbon emissions by 2,000 tonnes. Wider benefits include making the city centre a more attractive place to invest by reducing costs to developers of meeting future zero carbon requirements, helping to attract carbon-conscious tenants; and attracting investment and jobs from firms which increasingly recognises low carbon as being good for business.
£28 million secured by September
£85 million target in 2012/13
Coventry, proud to be a city that works to… Create growth, jobs and enterprise
Create a diverse range of businesses, jobs and apprenticeships to meet the aspirations and potential of all Coventry's residents
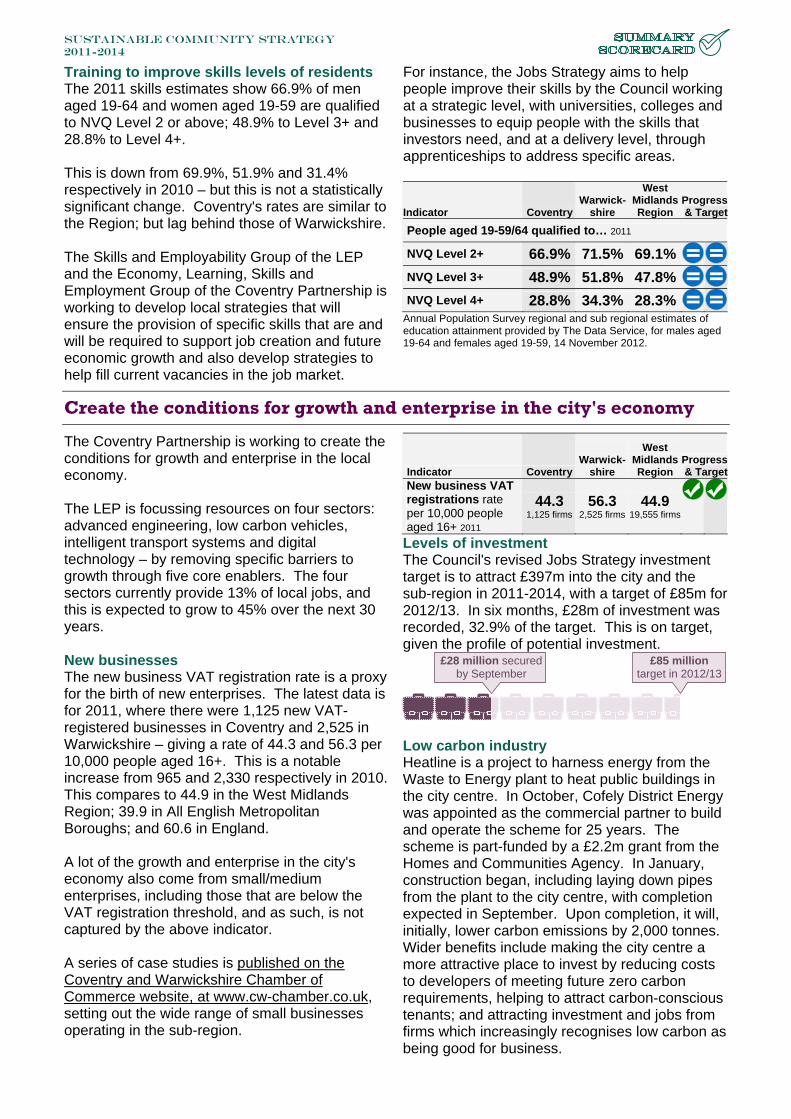
Number of jobs in the city The Council's own jobs target is to create 6,000 jobs in the city and across the sub region in three years with direct or indirect Council involvement. 770 jobs were created in six months (38.5%). As there are time lags involved, it is understood that the Council is on target to create 2,000 jobs for 2012/13. Full year data will be available in June.
Young people not in education, employment and training The Coventry Partnership is working to reduce the number of young people 16-24 not in education, employment or training (NEETs) by 1,050 by 2014, against the 2010 baseline; with 25% (i.e. 263 young people) to come from reducing 16-18 year olds NEET; and 75% (i.e. 787 young people) to come from reducing 18-24 year olds in receipt of Jobseekers Allowance (JSA).viii 16-18 year olds CSWP, the Careers Guidance Company, tracks the destinations of 16-18 year olds. In December 2012, there were 540 NEETs (5.2%) in Coventry, down from 680 (6.0%) in December 2011 and the baseline figure of 610 (5.8%). While the number of NEETs is down, the Coventry Partnership is very unlikely to reach the target of reducing the number of 16-18 year old NEETs by 263 young people in 2014 – that would mean a rate of 4.2% NEETs (435 young people) by December 2012. This, however, must be seen in the context of spending cuts which have affected services offered to support young people into employment.
Indicator Coventry
Warwick-
shire
West Midlands Region
Progress& Target
% of 16-18 year olds NEETs 2012,
5.2%
annual 540 2012
N/A N/A
% of 18-24 year olds claiming JSA December 2012, monthly
5.7% 2,405
4.3% 1,970
8.1%43,335
18-24 year olds JSA claimants are the closest proxy for NEETs for those aged 18-24. In December 2012, 2,405 (5.7%) young people 18-24 were claiming JSA in Coventry, and 1,970 (4.3%) in Warwickshire. This compares favourably to the region (8.1%). JSA claimants aged 18-24 are decreasing, but at a slower rate than for all age groups. This compares to 2,895 (6.8%) for Coventry and 2,340 (5.2%) for Warwickshire in December 2011; and 2,670 (6.1%) and 2,395 (5.5%) respectively for the baseline, December 2010.
770 jobs created by September
2,000 jobs target in 2012/13
The Coventry Partnership has undertaken a range of programmes to support young people into employment, including "100 apprentices in 100 days" challenge, the Rural Economy Grant to support growing rural enterprises; working with employers; tackling family poverty by supporting workless households; addressing barriers for young people in rural areas; a Youth Zone in the new Job Shop; and a range of JobCentre Plus Flexible Fund projects such as the Boot Camp; projects at the Belgrade Theatre; and the Foleshill Project. Unfortunately, despite these measures, the Coventry Partnership is very unlikely to reach the target of reducing the number of 18-24 year olds who are in receipt of JSA by 787 young people by 2014 – that would mean a rate of 5.1% JSA (2,141 claimants) by December 2012. This, however, must be seen in the context of a struggling economy which has made it difficult for firms take on new staff.
Si Chun Lam, Corporate Performance Team [email protected] revised 15 March 2013
i Office for National Statistics (ONS), Second Estimate of GDP, Q4 2012, 27 Feb 2013 ii Bank of England, Inflation Report February 2013 iii Office for Budget Responsibility, Letter from Robert Chote, Chairman, to David Cameron, Prime Minister, 8 Mar 2013 iv Markit/CIPS Purchasing Managers' Index, Business activity increases for 2nd successive month, 5 Mar 2013 v Coventry and Warwickshire Chamber of Commerce, Quarterly Economic Survey Q4 2012, 20 Dec 2012 vi Coventry and Warwickshire Local Enterprise Partnership, City Deal announcement "great news", 19 Feb 2013 vii Coventry City Council, A Jobs Strategy for Coventry Refresh 2012/13, August 2012 viii Coventry Partnership, Economy, Learning, Skills and Employability (ELSE) meeting notes, 26 Oct 2011

www.coventry.gov.uk/performance/1
Sustainable Community Strategy 2012/13 half year performance summary
Coventry, proud to be a city that works to…
Create growth, jobs and enterprise particularly through advanced manufacturing and green technologies Executive summary
This Summary Scorecard sets out the Coventry Partnership's performance on a range of headline indicators for April to September 2012.
In the first half of 2012/13, the UK economy saw a contraction in gross domestic product (GDP) of 0.4% between April and June, followed by 1.0% growth between July and September – marking a recovery after three consecutive quarters of negative growth, according to the Office for National Statistics. However, the overall picture appears to be a flat economy – with the HM Treasury comparison of 30 new independent forecasts made in October 2012 suggesting an overall GDP growth of -0.3% for the UK in 2012. Locally, findings from the Coventry and Warwickshire Chamber of Commerce’s Quarterly Economic Survey show that 32% of firms in the manufacturing sector and 49% in the service sector expected turnover to grow in the next year, with "stronger increase in sales on the international front compared with the domestic market". In August 2012, the refreshed Jobs Strategy for Coventry was launched. This aims to secure job opportunities through investment, support people to get jobs and help people improve their skills between now and 2014. Going forward, Coventry and Warwickshire is one of the twenty cities and wider areas invited by the Government to bid for the second wave of City Deals. The Government is seeking city regions that can identify and prioritise a specific local challenge that needs to be addressed, and to come up with a tailored plan to deal with it. The Council is working with the neighbouring local authorities and the Coventry and Warwickshire Local Enterprise Partnership to pull together an expression of interest for submission in January 2013. The City Deal will help Coventry and Warwickshire unlock growth, create and safeguard jobs and enhance local infrastructure.
4.7% Jobseeker's Allowance claimant count September 2012
Flash Facts
64.8% average employment rate July 2011 to June 2012
965 new business VAT registrations 2010
21,300 median gross annual pay 2012
£

Coventry, proud to be a city that works to… Create growth, jobs and enterprise
2
Support people to develop skills needed to access jobs and progress to higher skilled jobs
Employment and unemployment levels Jobseeker's Allowance The Jobseeker's Allowance (JSA) is an out-of-work benefit paid to people available for and actively seeking full-time work. In September, the JSA claimant count reduced to 4.7% in Coventry and 2.3% in Warwickshire; giving a rate of 3.2% across the Local Enterprise Partnership (LEP). For comparison the rate was 6.6% in the Metropolitan Area; 4.7% in the Region and 3.8% in England. There has been a reduction in JSA claimants from March to September, suggesting that unemployment has reduced. Employment rate The average employment rate is the percentage of people aged 16-64 who are in employment. The July 2011 to June 2012 rate was 64.8% in Coventry and 75.1% in Warwickshire; an overall rate of 71.2% in the sub region. This marks an improvement from the figures reported at the end of year (October 2010 to September 2011), when the rates were 64.3% in Coventry, 73.4% in Warwickshire and 69.9% in the sub region. Income and wages Coventry's median gross annual pay in 2012 has risen by 0.5% to £21,300. This is a slower rate of growth than other areas: Warwickshire (up 2.3% to £22,823); West Midlands Metropolitan Area (up 0.7% to £19,673); Region (up 1.3% to £19,944); and England (up 1.6% to £21,794). Looking at longer-term trends, the gap between the average Coventry income and the average England income has narrowed since 2008, but Coventry residents still earn less than the national average. This may reflect Coventry's lower living costs.
Indicator Coventry
Warwick-
shire
West Midlands Region
Progress& Target
Jobseeker's Allowance claimant count September 2012, seasonally adjusted
4.7% 2.3% 4.7%
Average employment rate July 2011 to June 2012
64.8% 75.1% 67.6%
Median gross annual pay 2012
£21,300 £22,823 £19,944
Jobseeker's Allowance claimant counts have been seasonally adjusted – national / regional data adjusted by the Office for National Statistics; sub regional data formula-adjusted by the Corporate Research Team. Median gross annual pay is for all job types, by place of residence by local authority area (Table 8.7a) from the provisional 2012 Annual Survey of Hours and Earnings using the new 2010 Standard Occupational Classifications (SOC), published by the Office for National Statistics (ONS) on 22 November 2012. The Annual Survey of Hours and Earnings (ASHE) is based on a 1% sample of employee jobs drawn from HM Revenue and Customs Pay As You Earn (PAYE) records.
Supporting people into work The Coventry Partnership is helping residents secure jobs despite these difficult challenges. The revised Council's Jobs Strategy sets out targets to support 8,080 people who are currently unemployed, and to help 2,610 people into a job; including 2,000 and 700 respectively in 2012/13. In April to September, the Council supported 2,527 people who are currently unemployed, and helped 605 people into a job. As a key part of delivering the objectives of the Jobs Strategy, In March 2012 the Council, CSWP and JobCentre Plus opened a Job Shop on Hertford Street to help local people secure work. The Job Shop has seen over 8,000 visitors, and 1,800 have signed up as members of the Work Club to apply for jobs. The Job Shop will relocate to new, larger premises at 1 Bull Yard in January 2013, in partnership with CSWP and Jobcentre Plus.
Rising prices, stagnant wages Between 2008 and 2012, food prices have risen by 19.1%; transport costs by 21%; and costs of running a home by 16.3%. After taking price increases into account, people on average earn less than they did in 2008 – around 6.2% less in Coventry, and around 10% less nationally.
6.2% 10%
England Coventry
Real wages have declined (2008 to 2012)

Sustainable Community Strategy 2012/13 half year performance summary
3
Training to improve skills levels of residents The 2011 skills estimates show 66.9% of men aged 19-64 and women aged 19-59 are qualified to NVQ Level 2 or above; 48.9% to Level 3+ and 28.8% to Level 4+. This is down from 69.9%, 51.9% and 31.4% respectively in 2010 – but this is not a statistically significant change. Coventry's rates are similar to the Region; but lag behind those of Warwickshire. The Skills and Employability Group of the LEP and the Economy, Learning, Skills and Employment Group of the Coventry Partnership is working to develop local strategies that will ensure the provision of specific skills that are and will be required to support job creation and future economic growth and also develop strategies to help fill current vacancies in the job market.
For instance, the Jobs Strategy aims to help people improve their skills by the Council working at a strategic level, with universities, colleges and businesses to equip people with the skills that investors need, and at a delivery level, through apprenticeships to address specific areas.
Indicator Coventry
Warwick-
shire
West Midlands Region
Progress& Target
People aged 19-56/64 qualified to… 2011
NVQ Level 2+ 66.9% 71.5% 69.1%
NVQ Level 3+ 48.9% 51.8% 47.8%
NVQ Level 4+ 28.8% 34.3% 28.3%Annual Population Survey regional and sub regional estimates of education attainment provided by The Data Service, for males aged 19-64 and females aged 19-59, published 14 November 2012.
Create the conditions for growth and enterprise in the city's economy
The Partnership is ensuring that businesses continue to recognise Coventry as the right place to invest and grow. The LEP is focussing resources on four sectors: advanced engineering, low carbon vehicles, intelligent transport systems and digital technology. The sectors currently provide 13% of local jobs, and this is expected to grow to 45% over the next 30 years. New businesses The new business VAT registration rate is a proxy for the birth of new enterprises. The latest figures are for 2010, as previously published. 2011 data will be available in December 2012. In Coventry, the rate increased from 33.8 in 2009 (855 firms) to 37.8 (965) in 2010; and in Warwickshire, the rate increased from 50.2 to 53.2. This is an improvement at a time when registrations decreased in the West Midlands Met. Area (41.1 to 38.4), the Region (41.7 to 40.5), All Mets (39.3 to 37.3) and England (49.6 to 48.9). Levels of investment The Council's revised Jobs Strategy investment target is to attract £397m into the city and the sub region in 2011-2014, with a target of £85m for 2012/13. In six months, £28m of investment was recorded, 32.9% of the target. This is on target, given the profile of potential investment.
Indicator Coventry
Warwick-
shire
West Midlands Region
Progress& Target
New business VAT registrations rate per 10,000 people aged 16+ 2010
37.8 965 firms
53.2 2,330 firms
40.5 17,805 firms
Low carbon industry The Partnership is working to develop four key sectors, all of which reflects the city's strengths, expertise and potential for future innovation and growth. Heatline, the district heating scheme, took a major step forward with the appointment of a commercial partner, Cofely District Energy Ltd, to build and operate the scheme for 25 years. The scheme, funded by a £2.2m grant from the Homes and Communities Agency, will heat city centre buildings using heat generated from the energy from waste plant. Upon completion in September 2013, it will, initially, reduce the city's carbon emissions by 2,000 tonnes. Wider benefits include making the city centre a more attractive place to invest by reducing costs to developers of meeting future zero carbon requirements, helping to attract carbon-conscious tenants; and attracting investment and jobs from a private sector which increasingly recognises low carbon as being good for business.
£28 million secured so far
£85 million target in 2012/13

Coventry, proud to be a city that works to… Create growth, jobs and enterprise
4
Create a diverse range of businesses, jobs and apprenticeships to meet the aspirations and potential of all Coventry's residents
Number of jobs in the city The Council's own jobs target is to create 6,000 jobs in the city and across the sub region in three years with direct or indirect Council involvement. 770 jobs were created in six months (38.5%). As there are time lags involved, it is understood that the Council is on target to create 2,000 jobs for 2012/13.
Young people not in education, employment and training The Coventry Partnership is working to reduce the number of young people 16-24 not in education, employment or training (NEETs) by 1,050 by 2014, against the 2010 baseline. 16-18 year olds The annual survey of young people 16-18 conducted by CSWP, the Careers Guidance Company, in December 2010 suggests that there were 680 NEETs (6.0%) in Coventry and 830 in Warwickshire (4.5%); a total of 1,510 NEETs (5.1%) in the sub region. Although this is favourable compared to the Region (6.2%) and England (6.1%), the Coventry rate has worsened from the baseline of 610 (5.8%). Young people are more likely to be NEET at age 18 than at age 16 as they transition out of education. It is estimated that 3.3% of Coventry's 16 year olds are NEET, rising to 5.8% at age 17, and 9.4% at age 18. In Warwickshire, the rates are 3.0%, 4.3% and 7.3% respectively.
Indicator Coventry
Warwick-
shire
West Midlands Region
Progress& Target
% of 16-18 year olds NEETs 2011, annual
6.0% 680
4.5% 830
6.2%12,170
% of 18-24 year olds claiming JSA September 2012, monthly
6.3% 2,745
5.3% 2,295
9.3%48,905
18-24 year olds JSA claimants are the closest proxy for NEETs for those aged 18-24. In September 2,745 (6.3%) young people 18-24 were claiming JSA in Coventry, and 2,295 (5.3%) in Warwickshire; a total of 5,035 (5.8%) in the sub region. This compares favourably to the Region (9.3%) and England (7.3%). The number of JSA claimants aged 18-24 has decreased from the March 2012 figures reported in the 2011/12 end of year report, but remains higher than the baseline. A growing concern is the length of time young people remain on JSA. In Coventry, 18-24 year olds claiming for 12+ months doubled from 135 in December 2010 to 285 in December 2011, and have since risen to 455 in September 2012. In the same period, those claiming JSA for 6 to 12 months has more than doubled from 270 (Dec 2010), to 595 (Dec 2011); and in September stands at 545. This problem, however, is not unique to Coventry – similar trends can be found regionally and nationally. JSA claimants aged 18-24 over time (NomisWeb)
Place Dec '10
Dec '11 Mar '12
Sep '12
Coventry 6.1% 6.7% 7.2% 6.3% Warwickshire 5.5% 5.4% 6.2% 5.3% Cov & Warks 5.8% 6.0% 6.7% 5.8% WM Region 8.5% 9.8% 10.2% 9.3% England 6.5% 7.7% 8.1% 7.3%
Your Future, Your Choice On 27 November, the Coventry Partnership brought together 35 businesses across the Midlands with 1,200 Year 8 and Year 9 pupils from six secondary schools in Coventry. The ‘Your Future, Your Choice’ careers event, held in partnership with Business in the Community, gave young people an insight into the world of work as they made their options for GCSE study. Young people got the opportunity to perform industry related tasks at interactive displays and the chance to speak to real people about real careers and their journeys into the world of work.
770 jobs created in half a year
2,000 jobs target in 2012/13

www.coventry.gov.uk/performance/1
Sustainable Community Strategy 2012/13 half year performance summary
Coventry, proud to be a city that works to…
Improve children and young people's education and opportunities Executive summary
This Summary Scorecard sets out the Coventry Partnership's performance on a range of headline indicators for April to September 2012.
Educational attainment Coventry's children and young people celebrated record GCSE and A-Level results in 2012. Coventry's 16 year olds have achieved the best ever GCSE results this year, and for the first time ever, exceeded the England average which has gone down slightly. Meanwhile, a higher percentage of A-Level students have achieved the higher (A* to B) grades. Results by under-achieving and vulnerable groups will be published when available.
School inspections The Council expects every school in Coventry to be judged good or outstanding by Ofsted. To improve primary school inspection outcomes the Council has worked in partnership with schools to revise its education & learning, school intervention and underperformance policies. Since August, the percentage of primary schools graded good or outstanding has improved from 42.2% to 47%.
Compared to six years ago… The line graph below shows the improvement in examination results for Coventry's children and young people (2006 = 100).
including English & Maths.
149
112
156
182
101
113
100
110
120
130
140
150
160
170
180
190 2006 2007 2008 2009 2010 2011 2012
Nearly twice as many pupils achieve five good GCSEs in any subject.
Over 50% more pupils now
achieve five good GCSEs (A*-C) inc. English & Maths. Nearly 50% more pupils reached a good level of overall achievement in their early years.
Over 10% more pupils obtain high A-Level grades
Over 10% more pupilsreach the expected level when they finish Year 6
The pass rate at A-Level remains steady.
Since 2006

Coventry, proud to be a city that works to… Improve children and young people's education and opportunities
2
Improve children and young people's level of achievement, educational progress and aspirations Provisional results for 2012 show: Early Years Foundation Stage: 61.7% reached a good level of overall achievement, an increase of 2.5% over last year's 59.2%. Year 6 (Key Stage 2): 75% achieved level 4+ in both English and Maths, up from 71% last year. This is the city's best ever result, but falls short of the city's own target of 77% and remains 4% behind the England average of 79%. GCSEs (Key Stage 4): 59% achieved five good GCSEs including English and Maths, up from 54.7% last year. This is the first time the results exceed the England average, currently 58.4%; but falls short of the city's own target of 59.2%. A-Levels (Key Stage 5): 97.7% passed at A*-E, up from 97.4% last year, but 0.3% less than the England average of 98%. 41.7% received the top grades of A*-B, up from last year's 40.9%; but 10.9% less than England (52.6%). The Council expects every school in Coventry to be judged good or outstanding by Ofsted. To improve primary school inspection outcomes the Council has worked in partnership with schools to revise its education & learning, school intervention and underperformance policies. Schools are being supported to work more closely together in a self-improving school system.
Indicator Coventry Statistical
Neighbours EnglandProgress& Target
90%English 89%
English % making expected progress from Key Stage 1 to 2 2012
87%Maths 87%
Maths Level 4+ in both English & Maths at Key Stage 2 2012
75% 77% 79%
5+ GCSEs A*-C including English and Maths 2012
59.0% 56.8% 58.4%
5+ GCSEs A*-C in any subject 2012
87.1% 84.3% 82.7%
69.0% English
68.7% English
71.8% English
% making expected progress from Key Stage 2 to 4 2011
62.8% Maths
61.8% Maths
64.8% Maths
A-Level pass rate (A* to E)
2012 97.7% 98%
% judged good/outstanding by Ofsted: 31 Aug 2012
Nursery and primary 2012
42.2% 35 / 83
62% 69%
Secondary schools 2012
83.3% 15 / 18
61% 66%
Post-16 provision 2012
68.8% 11 / 16
Special schools & Pupil Referral Units 2012
75.0% 6 / 8
82% 81%
All results for 2012 are provisional. The Council set individual targets for schools; these are combined to form an overall city target.
The Council continues to provide robust challenge and support to schools. Since 1st September, under a more rigorous inspection regime, 19 primary schools have been inspected. Nine of these moved from satisfactory to good and one from satisfactory to outstanding. 47% of primary schools are now judged good or outstanding by Ofsted.

Sustainable Community Strategy 2012/13 half year performance summary
3
Improve children and young people's health and wellbeing by encouraging positive lifestyle choices and tackling health inequalities
Child poverty Under the Child Poverty Act, the Council has a duty to assess the needs of local children and families who are living in poverty. In August 2010, an estimated 16,845 children (27%) were living in relative poverty. This has gone down from 17,360 (28%) in 2009; and 16,770 (27.8%) in 2008; but masks huge variations in Coventry's 18 wards, with 4.8% of children in relative poverty in Wainbody, compared with 42.9% in St Michael's. Across the 7,600+ wards in England, relative child poverty in 2010 ranges from 0.8% to 60.3%. Coventry's diversity means that the city has wards in some of England's poorest 20%, as well as wards in some of the country's richest 20%. Official data for 2011 is expected by the end of 2012. Unofficial data published by the End Child Poverty campaign suggests that, while the percentage of children living in relative poverty in Coventry has declined in 2011 to 26.7%, the gap between the richest and poorest has widened to 4.5% in Wainbody and 45.1% in St Michael's.
Indicator Coventry
West Midlands Region England
Progress& Target
Children in relative poverty August 2010
27.0% 16,845
23.8% 254,720
21.1%2,066,320
HMRC Personal Tax Credits Child Poverty Statistics: revised local child poverty measure – children living in families in receipt of out of work benefits / tax credits where their reported income is <60% of median on 31st August each year. Previous scorecards used the local child poverty proxy measure.
Immunisations From April 2011 to March 2012, 95.6% of babies were immunised against Measles, Mumps and Rubella (MMR) by age 2, up from 95.1% last year; and 98.2% was immunised against Diphtheria, Tetanus, Polio, Pertussis and Hib (DTaP/IPV/Hib), comparable to 98.5% last year. Data for April to June 2012 suggests continued improvement for 2012/13: 98.3% for MMR and 99.3% for DTaP/IPV/Hib. Comparisons with the West Midlands and England are not yet available because the release of Immunisation Statistics for England has been delayed until 27 November. Breastfeeding Breastfeeding has positive health benefits for both mother and baby. The number of mothers who breastfeed their babies 6-8 weeks after birth in Coventry at Quarter 1 2012/13 is 42.2%. This is higher than the rate in the West Midlands, but lower than in England. Coventry has seen an increase in its breastfeeding rates, from 39.2% at 2011/12 Q3 to 40.4% at 2011/12 Q4; however, this is not a statistically significant increase.
Indicator Coventry
West Midlands Region England
Progress& Target
% immunised against MMR by their 2nd birthday April 2011 to March 2012
95.6% n=4,244
% immunised against DTaP/IPV/Hib by their 2nd birthday April 2011 to March 2012
98.2% n=4,403
Breastfeeding prevalence at 6-8 weeks April to June 2012
42.2% 40.8% 46.9%
Conceptions to girls aged under 18 (rate per 1,000 15-17 year olds) April to June 2011
52.9 38.5 34.7
Obese children at Reception 2010/11 school year
10.7% 10.1% 9.4%
Obese children at Year 6 2010/11 school year
20.2% 20.5% 19.0%
Wainbody Earlsdon Bablake
Whoberley Wyken
Woodlands Sherbourne
Cheylesmore Westwood
Lower Stoke Holbrook
Upper Stoke Radford
Longford Binley & Willenhall
Henley Foleshill
St Michael's 1 in 4 children in Coventry are living in relative poverty. This, however, masks huge variations between the richest and poorest areas of the city.
Ten wards in Coventry are in the bottom 20% of all wards in England, which means they have some of the highest rates of children living in relative poverty.
Two wards are in the top 20%.

Coventry, proud to be a city that works to… Improve children and young people's education and opportunities
4
Teenage pregnancy In April to June 2011, there were 72 conceptions to girls aged under 18, a rate of 52.9 per thousand girls aged 15-17. This compares with:
• 81 conceptions in April to June 2010; and • 101 in April to June 2009.
In 2010, there were a total of 273 conceptions, with 149 occurring in the first half of the year. In the first half of 2011, there were a total of 154 conceptions, slightly more than in the first half of 2010. In May, the Council and the NHS launched Aspires, a service that works to identify young people at risk of poor sexual health, coercive relationships and substance misuse and support the young people to adopt safer behaviours. The focus over the next six months will be to increase referrals and evaluate the outcomes. A Teenage Parent Training Day package is being developed, and is expected to be launched in January 2013. This will support professionals working with teenage parents to help them achieve the best outcomes, and set out guidelines and associated referral pathways.
Childhood obesity The latest data available for childhood obesity is for the 2010/11 school year, which showed that childhood obesity in Coventry was 10.7% at Reception and 20.2% at Year 6; broadly similar to the West Midlands, but higher than the England average. Data for the 2011/12 school year will be published by the National Obesity Observatory in December 2012.
Reception Earlsdon
23 / 394
5.8%
ReceptionFoleshill
140 / 1,021
13.7%Year 6
Earlsdon
46 / 407
11.3%
Year 6Longford
155 / 643
24.1%
Variations in the level of childhood obesity reflects the health inequalities in Coventry
Obesity prevalence by school year and electoral ward of child residence from the National Child Measurement Programme 2008/09 to 2010/11, published by the National Obesity Observatory, May 2012.
Best
Worst
Key

Sustainable Community Strategy 2012/13 half year performance summary
5
507 with a Child Protection
Plan 30 September 2012
71.9 per 10,000 under 18s compared to 64.5
last year; & 38.6 in England
596 Looked After Children
30 September 2012
84.5 per 10,000 under 18s compared to 84.7
last year; & 59.0 in England
Target is to safely reduce the number to 544 by 31 March 2013.
21.3%repeat referrals April to September 2012
Fewer repeat referrals would suggest that referrals
are handled satisfactorily the first time, reducing inappropriate referrals and failure demand. Current
performance is similar to 2011/12 (21.4%).
68.9%stable 2+ year placements
April to September 2012
While planned placement changes can be in the
child’s best interests, stable, long-lasting placements are generally associated with better outcomes.
Current performance is better than 2011/12 (62.8%).
2,361 social care referrals
April to September 2012
At current trends, this will equate to 669.2 per 10,000 under 18s
compared to 562.8 last year; & 556.8 in England
Minimise the risk of harm to children and young people through early interventions and prevention with families, strengthening, safeguarding and improving outcomes for vulnerable children
Early Support As part of the abc transformation programme, the Council has invested into early intervention services. These services help keep families together in challenging circumstances and also represent better value for money for taxpayers. The Council offers a range of free support and practical parenting advice to parents through the www.coventryparent.co.uk website and parenting programmes. In the year to September 2012, 1,574 referrals were made to Positive Parenting Programme (Triple-P) courses. Of these, 1,159 parents were offered a place on the course, 982 attended, and 806 completed the course. In the more intensive courses, the outcomes of the courses are measured through the Being a Parent scale. Based on 158 pairs of responses, the average change is an increase of 8.37 points. The Common Assessment Framework (CAF) is a single assessment shared between social care, education and health. It helps ensure that children receive co-ordinated support from different services. As of 1 October, there are currently 1,296 live CAFs, up from 1,231 on 1 April. Note: previous scorecards reported on the total number of CAFs completed – as some CAFs are no longer needed and are made inactive, reporting on the number of live CAFs was a more accurate measure of performance.
Indicator CoventryProgress& Target
Number of Common Assessment Framework forms currently live
1,2961 Oct 2012
Difference in point scores on the Being a Parent scale following completion of parenting course year to September 2012
+8.372012
No. of parents completing a parenting course year to September 2012
806 2012
Indicator Coventry England*Progress& Target
No. of Looked After Children per 10,000 population
84.5
596
30/09/2012
59.0 2010/11
No. of children subject to a Child Protection Plan per 10,000 population
71.9
507
30/09/2012
38.6 2010/11
Social care referrals per 10,000 under-18 population (using the mid-2011 population estimates i.e. 70,561)
669.2 Apr-Sep
2012
556.82010/11
Repeat referrals to social care
21.3% Apr-Sep
2012
25.6%2010/11
Stability of Looked After placements (lasting 2+ years)
68.9% Apr-Sep
2012
68.6%2010/11
Young people aged 10-17 receiving their first reprimand, warning or conviction per 100,000 population aged 10-17
195 Apr-Sep
2012
* England data is for 2010/11; 2011/12 data expected in December.
There has been a steady increase in the number of Coventry families completing a Positive Parenting Programme.
2012 2011 2010 0
200
400
600
800
259
587
806