Sustainable City Plan - Santa Monica sustainability, and to develop new ... The Santa Monica...
30
City of Santa Monica Sustainable City Plan Adopted September 20, 1994 Updated February 11, 2003 Revised October 24, 2006 Updated January 14, 2014 Using the power of community to enhance our resources, prevent harm to the natural environment and human health, and benefit the social and economic well-being of the community for the sake of current and future generations.
Transcript of Sustainable City Plan - Santa Monica sustainability, and to develop new ... The Santa Monica...

1
City of Santa MonicaSustainable City Plan
Adopted September 20, 1994
Updated February 11, 2003
Revised October 24, 2006
Updated January 14, 2014
Using the power of community to enhance our resources, prevent harm to the natural environment and human health,
and benefit the social and economic well-being of the community for the sake of current and future generations.

2
IntroductionWe live in a time in which increased population growth, high levels of consumption and the desire to feed growing economies have created escalating demands on our resources - natural, human and social - on a local, regional, and global scale.
We live in a time in which increased population growth, high levels of consumption and the desire to feed growing economies have created escalating demands on our resources - natural, human and social - on a local, regional, and global scale. These demands negatively impact the natural environment, our communities and the quality of our lives. In the face of these challenges, people worldwide have developed a growing concern for the environment and a desire to live sustainably.
In 1994, the Santa Monica City Council took steps to address these pressures locally by adopting the Santa Monica Sustainable City Program. The Sustainable City Program was initially proposed in 1992 by the City’s Task Force on the Environment to ensure that Santa Monica can continue to meet its current needs – environmental, economic and social - without compromising the ability of future generations to do the same. It is designed to help us as a community begin to think, plan and act more sustainably – to help us address the root causes of problems rather than the symptoms of those problems, and to provide criteria for evaluating the long-term rather than the short-term impacts of our decisions – in short, to help us think about the future when we are making decisions about the present.
The program includes goals and strategies, for the City government and all sectors of the community, to conserve and enhance our local resources, safeguard human health and the environment, maintain a healthy and diverse economy, and improve the livability and quality of life for all community members in Santa Monica. To check our progress toward meeting these goals, numerical indicators were developed and specific targets were set for the city to achieve by the year 2000 in four goal areas – 1) Resource Conservation, 2) Transportation, 3) Pollution Prevention and Public Health Protection, and 4) Community and Economic Development.
In reviewing the progress made since the 1994 adoption of the program, the Task Force on the Environment recognized the need to update and expand the Sustainable City goals and indicators to provide a more complete picture of community sustainability, and to develop new indicator targets for 2010. The Task Force felt that a compre hensive update would allow Santa Monica to build on its initial success and to better address the challenges to sustainability that remain.

3
The update process began in July 2001 with the formation of the Sustainable City Working Group - a large group of community stakeholders that included elected and appointed officials, city staff, and representatives of neighborhood organizations, schools, the business community and other community groups. The Working Group met numerous times over the course of 15 months to discuss the myriad issues related to the sustainability of the community. They evaluated the long-term sustainability of Santa Monica using a framework comprised of three forms of community capital, that need to be managed with care, in order to ensure that the community does not deteriorate. These include natural capital – the natural environment and natural resources of the community; human and social capital – the connectedness among peo ple in the community and the education, skills and health of the population; and financial and built capital – manufactured goods, buildings, infrastructure, information resources, credit and debt.
The group proposed significant changes to the initial Sustainable City Program goals and indicators, and assisted with the creation of new indicator targets. Early drafts of the proposed update were revised based on a large amount of public input received during the summer of 2002.
The result of this process was the updated, Santa Monica Sustainable City Plan, which represents the community’s vision of Santa Monica as a sustainable city. The change in name from Sustainable City Program to Sustainable City Plan was made to better reflect the long-term comprehensive nature of Santa Monica’s vision and the community’s efforts to become a sustainable city.
Since its inception, the Santa Monica Sustainable City Program has achieved much success. Many of the initial targets have been met or exceeded and Santa Monica is now recognized worldwide as a role model for sustainability. However, we are not “there” yet. While we have made progress in the right direction, Santa Monica’s economy and the activities of its residents, businesses, institutions and visitors continue to negatively impact human health and the environment. And our community does not yet provide for the basic needs of all its members. Many challenges remain before Santa Monica can truly call itself a Sustainable City. The Sustainable City Program is a call to action for all of us to work together as a community and create change that will realize a Sustainable Santa Monica.
“I think any goal this community sets for itself, and is willing to work to accomplish, will be accomplished... whether in my time or another time. That’s the beauty of this city.”
Ken Edwards, 1941-1985
City Council Member and Mayor

4
The City’s Task Force on the Environment (ETF) assumed the initial leadership role on behalf of the community for the Sustainable City Plan (SCP).
With the update and expansion of the SCP into new and more diverse goal areas, the ETF recommended the creation of a Sustainable City Task Force (SCTF) that includes broad representation from community stakeholders with expertise in all of the SCP goal areas The SCTF was created in 2003 to provide leadership and guidance for implementation of the SCP. In 2009, the SCTF sunset and this role was again assumed by the ETF.
At the city staff level, an interdepartmental Sustainability Advisory Team (SAT) was created to coordinate existing city activities so they are consistent with the Sustainable City goals and facilitate the future implementation of innovative programs and policies to achieve the goals. Members of this group serve as Sustainable City liaisons to their respective departments.
Together, these groups are responsible for developing a comprehensive implementation plan, both interdepartmentally, and between the City and community stakeholder groups.
Leadership, Guidance and Implementation of the Sustainable City Plan
ReportingThe city developed two reporting tools. The tools are intended to provide useful information to City Council, City staff, and community members on progress being made toward meeting goals and targets of the Plan, and will provide a basis for decision-making about policies and actions that influence the City’s ability to meet the goals and targets. The first tool is the Sustainable City Progress Report. The second tool is the Sustainable City Report Card.
• The Sustainable City Progress Report is a web based tool that provides current, detailed analysis of the data for each indicator in the Santa Monica Sustainable City Plan. Visit www.sustainablesm.org/scpr
• The Sustainable City Report Card is a summary document that provides an overview of our progress toward, and challenges to, becoming a sustainable community. The Report Card presents goal area summaries and grades based on the specific indicator data.
Together, these two tools are the definitive resource for community decision makers. In order to become a sustainable community all community members must be educated and empowered to achieve our sustainability goals.

5
GOALS:Within each Goal Area are specific goals which comprise the core of the community vision and represent what Santa Monica must achieve in order become a sustainable city.
INDICATORS:For each goal area specific indicators have been developed to measure progress toward meeting the goals. Indicators are tools that help to determine the condition of a system, or the impact of a program, policy or action. When tracked over time indicators tell us if we are moving toward sustainability and provide us with useful information to assist with decision-making. Two types of indicators are tracked as part of the Sustainable City Plan: 1) System level indicators measure the state, condition or pressures on a community-wide basis for each respective goal area. 2) Program level indicators measure the performance or effectiveness of specific programs, policies or actions taken by the city government or other stakeholders in the community.
Specific Targets have been created for many of the indicators. The targets represent aggressive yet achievable milestones for the community. Unless otherwise noted, the targets are for the year 2020 using 2010 as a baseline. For some indicators no specific numerical targets have been assigned. This was done where develop-ment of a numerical target was determined to be not feasible or where limits on data type and availability made it difficult to set a numerical target. In many of these cases a trend direction was substituted for a numerical target.
Terms throughout this document that may be unfamiliar to the general reader are defined in the Glossary.
The Santa Monica Sustainable City Plan is organized into nine Goal Areas:
Sustainable City Plan Structure
Housing
Community Education and Civic Participation
Human Dignity
Arts and Culture
Resource Conservation
Environmental and Public Health
Transportation
Sustainable Local Economy
Open Space and Land Use
Goal Areas

6
Guiding Principles
The Concept of Sustainability Guides City PolicySanta Monica is committed to meeting its existing needs without compromising the ability of future generations to meet their own needs. The long-term impacts of policy choices will be considered to ensure a sustainable legacy.
Protection, Preservation, and Restoration of the Natural Environment is a High Priority of the CitySanta Monica is committed to protecting, preserving and restoring the natural environment. City decision-making will be guided by a mandate to maximize environmental benefits and reduce or eliminate negative environmental impacts. The City will lead by example and encourage other community stakeholders to make a similar commitment to the environment.
Environmental Quality, Economic Health and Social Equity are Mutually DependentSustainability requires that our collective decisions as a city allow our economy and community members to continue to thrive without destroying the natural environment upon which we all depend. A healthy environment is integral to the city’s long-term economic and societal interests. In achieving a healthy environment, we must ensure that inequitable burdens are not placed on any one geographic or socioeconomic sector of the population and that the benefits of a sustainable community are accessible to all members of the community.
All Decisions Have Implications to the Long-term Sustainability of Santa MonicaThe City will ensure that each of its policy decisions and programs are interconnected through the common bond of sustainability as expressed in these guiding principles. The policy and decision-making processes of the City will reflect our sustainability objectives. The City will lead by example and encourage other community stakeholders to use sustainability principles to guide their decisions and actions.
Community Awareness, Responsibility, Participation and Education are Key Elements of a Sustainable CommunityAll community members, including individual citizens, community-based groups, businesses, schools and other institutions must be aware of their impacts on the environmental, economic and social health of Santa Monica, must take responsibility for reducing or eliminating those impacts, and must take an active part in community efforts to address sustainability concerns. The City will therefore be a leader in the creation and sponsorship of education opportunities to support community awareness, responsibility and participation in cooperation with schools, colleges and other organizations in the community.
12
3
4
5
The Santa Monica Sustainable City Plan is founded on eleven Guiding Principles that provide the basis from which effective and sustainable decisions can be made. These Guiding Principles have been revised and updated from the versions initially adopted in 1994.

7
Santa Monica Recognizes Its Linkage with the Regional, National, and Global CommunityLocal environmental, economic and social issues cannot be separated from their broader context. This relationship between local issues and regional, national and global issues will be recognized and acted upon in the City’s programs and policies. The City’s programs and policies should therefore be developed as models that can be emulated by other communities. The City will also act as a strong advocate for the development and implementation of model programs and innovative approaches by regional, state and federal government that embody the goals of sustainability.
Those Sustainability Issues Most Important to the Community Will be Addressed First, and the Most Cost-Effective Programs and Policies Will be SelectedThe financial and human resources which are available to the City are limited. The City and the community will reevaluate its priorities and its programs and policies annually to ensure that the best possible investments in the future are being made. The evaluation of a program’s cost-effectiveness will be based on a complete analysis of the associated costs and benefits, including environmental and social costs and benefits.
The City is Committed to Procurement Decisions which Minimize Negative Environmental and Social ImpactsThe procurement of products and services by the City, and Santa Monica residents, businesses and institutions results in environmental, social and economic impacts both in this country and in other areas of the world. The City will develop and abide by an environmentally and socially responsible procurement policy that emphasizes long-term values and will become a model for other public as well as private organizations. The City will advocate for and assist other local agencies, businesses and residents in adopting sustainable purchasing practices.
Cross-sector Partnerships Are Necessary to Achieve Sustainable GoalsThreats to the long-term sustainability of Santa Monica are multi-sector in their causes and require multi-sector solutions. Partnerships among the City government, businesses, residents and all community stakeholders are necessary to achieve a sustainable community.
The Precautionary Principle Provides a Complimentary Framework to Help Guide City Decision-Makers in the Pursuit of Sustainability The precautionary principle requires a thorough exploration and careful analysis of a wide range of alternatives, and a full cost accounting beyond short-term and monetary transaction costs. Based on the best available science, the precautionary principle requires the selection of alternatives that present the least potential threat to human health and the City’s natural systems. Where threats of serious or irreversible damage to people or nature exist, lack of full scientific certainty about cause and effect shall not be viewed as sufficient reason for the City to not adopt mitigating measures to prevent the degradation of the environment or protect the health of its citizens. Public participation and an open and transparent decision making process are critical to finding and selecting alternatives.
Santa Monica is Committed to Sustainable Rights for its Residents, Natural Communities and Ecosystems The Sustainability Bill of Rights codifies the commitments made in the Sustainable City Plan and asserts the fundamental rights of all Santa Monica residents regarding sustainability. It establishes the rights of natural communities and ecosystems to exist and flourish in Santa Monica and asserts the rights of residents to enforce those rights on behalf of the environment.
7
8
910
6
11

8
1. Significantly decrease overall community consumption, specifically the consumption of non-local, non-renewable, non-recyclable and non-recycled materials, water, and energy and fuels.
2. The City should take a leadership role in encouraging sustainable procurement, extended producer responsibility and should model innovative strategies to become a zero waste city.
3. Within renewable limits, encourage the use of local, non-polluting, renewable and recycled resources (water, energy, and material resources).
Goals
Indicators – System Level Targets
Solid Waste• Generation• Landfilled• Diversion
Solid Waste • Do not exceed year 2000 levels• Reduce per capita generation to 2.4 lbs/person/day• Achieve 85% diversion rate
Water Use• Total citywide use (Self Sufficiency)• Total citywide use (Per Capita)• Percent local vs. imported• Potable vs. non-potable
Water Use• Reduce water demand by 1,300,000 gallons per day (GPD) • Reduce per capita use to 123 gallons per capita per day (GPCD) (500,000 GPD)• Increase to 100% local• Upward trend in non-potable use
Energy Use• Total municipal use• Total citywide use• Efficiency• Efficiency
Energy Use• Reduce use 10% • Reduce use 10% • Demonstrate incremental progress towards achieving reduction in energy use intensity• Increase efficiency in existing buildings to achieve reductions of 1 million kWh annually
Indicators Targets for 2020
Resource Conservation
9
Indicators – System Level Targets
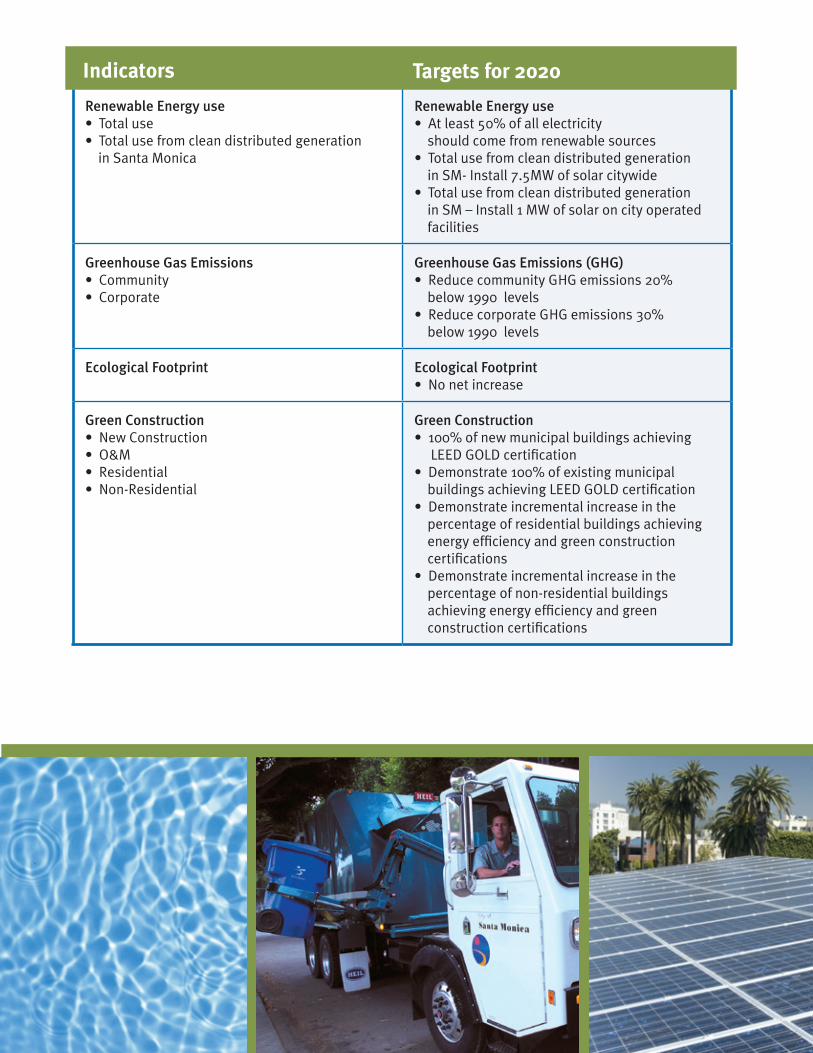
Renewable Energy use• Total use• Total use from clean distributed generation in Santa Monica
Renewable Energy use• At least 50% of all electricity should come from renewable sources• Total use from clean distributed generation in SM- Install 7.5MW of solar citywide • Total use from clean distributed generation in SM – Install 1 MW of solar on city operated facilities
Greenhouse Gas Emissions • Community• Corporate
Greenhouse Gas Emissions (GHG) • Reduce community GHG emissions 20% below 1990 levels• Reduce corporate GHG emissions 30% below 1990 levels
Ecological Footprint Ecological Footprint • No net increase
Green Construction • New Construction• O&M• Residential• Non-Residential
Green Construction • 100% of new municipal buildings achieving LEED GOLD certification• Demonstrate 100% of existing municipal buildings achieving LEED GOLD certification• Demonstrate incremental increase in the percentage of residential buildings achieving energy efficiency and green construction certifications• Demonstrate incremental increase in the percentage of non-residential buildings achieving energy efficiency and green construction certifications
Indicators Targets for 2020

10
1. Protect and enhance environmental health and public health by minimizing and where possible eliminating: a. The use of hazardous or toxic materials by residents, businesses and city operations; b. The levels of pollutants entering the air, soil and water; and c. The risks that environmental problems pose to human and ecological health.
2. Ensure that no one geographic or socioeconomic group in the city is being unfairly impacted by environmental pollution.
3. Increase consumption of fresh, locally produced, organic produce to promote public health and to minimize resource consumption and negative environmental impacts.
Indicators – System Level Targets
Santa Monica Bay • Wet weather: No rain• Wet weather: Rain event• Dry weather
Santa Monica Bay • No rain - 3 days• Rain event - 17 days• Zero days
Marine Debris • Trash: Presence of cigarettes, plastic packaging, single-use bags, lids and straws
Marine Debris • Zero trash (cigarettes, plastic packaging, single-use bags, lids and straws)
Air Quality• # Days ambient air quality standards exceeded
Air Quality• Zero days ambient air quality standards exceeded
Residential Household Hazardous Waste• Total volume collected• Number and percent of households participating• Cumulative number of participants
Residential Household Hazardous Waste• No target• Number and percent of households participating- Upward trend• Cumulative number of participants - 50% cumulative participation
City Purchase of Sustainable Products • Proportion of procurement budget spent on sustainable products annually
City Purchase of Sustainable Products • Upward trend
Indicators Targets for 2020
Environmental and Public Health
Goals

11
Indicators – Program Level Targets
Urban Runoff Reduction • Effective impervious area• Total acreage treated• Gallons polluted runoff treated
Urban Runoff Reduction • Annual reduction• Annual increase• Annual increase
Fresh, Local, Organic Produce • Percent of fresh, local, organic produce served at city facilities• Percent fresh, local, organic produce served at community institutions: (SMMUSD, SMC, Hospitals)• Sustainable food commitment
Fresh, Local, Organic Produce • 15% of total • 15% of total• 100% of City food purchases comply with Santa Monica Sustainable Food Commitment
Farmers Markets• Total sales• Percent organic• Percent low chemical• Percent conventional
Farmers Markets• Annual increase• Annual increase• Annual increase• No target
Food Choices• Residential reduction in meat and dairy consumption
Food Choices• 15% reduction
Community Gardens • Number of people participating• Average wait time for plot• Number of gardens connected
Community Gardens • Tracking number of people • Annual decrease• Annual increase
Indicators Targets for 2020

12
1. Create a multi-modal transportation system that minimizes and, where possible, eliminates pollution and motor vehicle congestion while ensuring safe mobility and access for all without compromising our ability to protect public health and safety.
2. Facilitate a reduction in automobile dependency in favor of affordable alternative, sustainable modes of travel.
Indicators – System Level Targets
Modal Split • Number of trips by type, citywide• Average vehicle ridership (AVR) of Santa Monica businesses with more than 50 employees• Pedestrian travel volumes• Bike traffic volumes
Modal Split • An upward trend in the use of sustainable (bus, bike, pedestrian, rail) modes of transportation - Drive alone max: 60%, Bike + Walk + Transit minimum: 25%, Bike + Walk: 15%• 2 for Santa Monica businesses with more than 50 employees• Annual increase• Annual increase
Vehicle Miles Traveled • Total • Total per capita
Vehicle Miles Traveled • Downward trend• Downward trend
Residential Use of Sustainable Transportation• Percent of residents who have intentionally not used their car but have instead used a sustainable mode of transportation in the past month
Residential Use of Sustainable Transportation• Upward trend
Sufficiency of Transportation Options• Percent of households with high quality transit service within ½ and ¼ mile
Sufficiency of Transportation Options• 100% of households within ½ mile
Pedestrian Facilities • Complete sidewalks• Public/private pathways• Crosswalk enhancements• Signal Timing enhancements
Pedestrian Facilities • Annual increase
Indicators Targets for 2020
Transportation
Goals

13
Indicators – Targets
Bike Facilities • Percent of bike network completed• Total miles of bike lanes and paths installed
or upgraded• Total Bikeshare usage• Number of bikes parked by bike valet
Bike Facilities • 100%• Annual increase• Annual increase• Annual increase
Vehicle Use • Total number of automobiles maintained per person• Percent of total automobiles that are qualified ZEV/PZEV or better• Total Carshare usage
Vehicle Use • 10% reduction• Annual percentage increase• Annual increase
Transit Service• Annual ridership on Santa Monica Big Blue Bus (BBB)• Percent of residents who have ridden the BBB in the past year• Annual ridership on MTA routes originating in Santa Monica• Annual Expo light rail ridership
Transit Service• Annual increase• Annual increase• Annual increase• Annual increase
Alternative Fueled Vehicles• Percent of the city fleet vehicles using alternative fuels
Alternative Fueled Vehicles• 80% of fleet
Travel Volumes • Auto corridor travel times• Peak Hour Trips• Signal Timing• Bus travel time
Travel Volumes • No increase• No net new PM trips• 100% completion• No increase
Street Safety • Number of collisions
o Vehicle-Vehicleo Vehicle-Pedestriano Vehicle-Bicyclisto Bicyclist-Pedestriano Bicyclist-Bicyclist
Street Safety • Downward trend
Traffic Impacts to Emergency Response Average emergency response times for public safety vehicles• Police• Fire
Traffic Impacts to Emergency Response • No increase• No increase
Indicators Targets for 2020
14
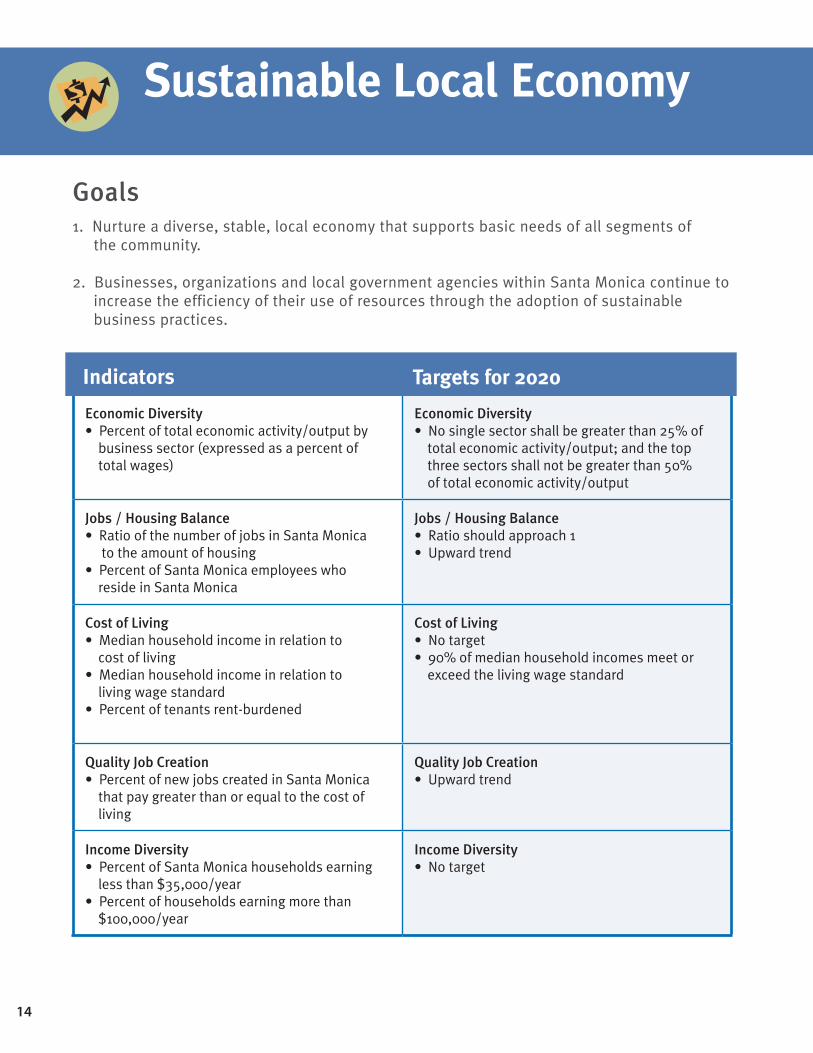
1. Nurture a diverse, stable, local economy that supports basic needs of all segments ofthe community.
2. Businesses, organizations and local government agencies within Santa Monica continue toincrease the efficiency of their use of resources through the adoption of sustainablebusiness practices.
Indicators – System Level Targets
Economic Diversity • Percent of total economic activity/output by business sector (expressed as a percent of total wages)
Economic Diversity • No single sector shall be greater than 25% of total economic activity/output; and the top three sectors shall not be greater than 50% of total economic activity/output
Jobs / Housing Balance• Ratio of the number of jobs in Santa Monica to the amount of housing• Percent of Santa Monica employees who reside in Santa Monica
Jobs / Housing Balance• Ratio should approach 1• Upward trend
Cost of Living• Median household income in relation to cost of living• Median household income in relation to living wage standard• Percent of tenants rent-burdened
Cost of Living• No target• 90% of median household incomes meet or
exceed the living wage standard
Quality Job Creation• Percent of new jobs created in Santa Monica that pay greater than or equal to the cost of living
Quality Job Creation• Upward trend
Income Diversity • Percent of Santa Monica households earning less than $35,000/year• Percent of households earning more than $100,000/year
Income Diversity • No target
Indicators Targets for 2020
Sustainable Local Economy
Goals

15
Indicators – System Level Targets
Economic Health • Number of businesses• Number of employees• Annual payroll
Economic Health • No net loss• No net loss• Increasing trend
Resource Efficiency of Local Business • Ratio of energy use to total economic activity by business sector• Ratio of total water use to total economic activity by business sector
Resource Efficiency of Local Business • Downward trend• Downward trend
Local Employment of City Staff • Percent of city employees who live in SM• Distance city employees travel to work
Local Employment of City Staff • No target
Sustainable Business Community • Number of Certified Green Businesses• Number of Business Greening Program
participants• Number of Buy Local business participants• Number of Sustainable Quality Award
winning businesses• Number of Santa Monica Alliance events
Sustainable Business Community • 200 total• 200 total• 10% annual increase• No target• 5 % annual increase
Indicators Targets for 2020

16
1. Develop and maintain a sufficient open space system so that it is diverse in uses andopportunities and includes natural function/wildlife habitat as well as passive and activerecreation with an equitable distribution of parks, trees and pathways throughout thecommunity.
2. Implement land use and transportation planning and policies to create compact, mixed-useprojects, forming urban villages designed to maximize affordable housing and encouragewalking, bicycling and the use of existing and future public transit systems.
3. Residents recognize that they share the local ecosystem with other living things thatwarrant respect and responsible stewardship.
Indicators – System Level Targets
Open Space • Number of acres of public open space by type (including beaches, parks, public gathering places, gardens, and other public lands utilized as open space)• Percent of open space that is permeable
Open Space • Upward trend• Upward trend
Trees • Total trees planted• Net tree gain• Percent of tree canopy coverage by
neighborhood
Trees • 2,000 total trees• 750 total trees• Upward trend
Parks Accessibility• Percent of households and population within ¼ and ½ mile of a park by neighborhood
Parks Accessibility• Percent of residents within ½ mile - 95% of residents• Percent of residents within ¼ mile- 90% of residents
Land Use and Development• Percent of residential, mixed-use projects that are within ¼ mile of transit nodes and are otherwise consistent with Sustainable City Plan goals
Land Use and Development• Upward trend
Regionally Appropriate Vegetation• Percent of new or replaced, non-turf, public landscaped area and non-recreational turf area planted with regionally appropriate plants
Regionally Appropriate Vegetation• 80 percent of new or replaced, non-turf, public landscaped area and non-recreational turf area
Indic ators Targets for 2020
Open Space and Land Use
Goals

17
1. Achieve and maintain a mix of affordable, livable and green housing types throughoutthe city for people of all socioeconomic/cultural/household groups (including seniors,families, singles, and disabled).
Indicators – System Level Targets
Production of Affordable Housing • Number of new housing units produced in Santa Monica affordable to:
o Very low income householdso Low income householdso Moderateo Market rate
Production of Affordable Housing • Number of new housing units produced in Santa Monica affordable to:
o At least 428o At least 263o At least 283o At least 700
Availability of Affordable Housing • Percent of existing housing in Santa Monica affordable to:
o Very low income householdso Low income householdso Moderate income householdso Upper income households
Availability of Affordable Housing • No target
Distribution of Affordable Housing • Distribution of low income housing by neighborhood
Distribution of Affordable Housing • No target
Affordable Housing for Special Needs • Number of new or rehabilitated affordable housing units for families, seniors, the disabled and other special needs groups as a percentage of all new or rehabilitated affordable housing development
Affordable Housing for Special Needs • Upward trend
Production of “Livable” Housing • Percent of new units within ¼ mile of:
o Transit stopo Open spaceo Grocery store
Production of “Livable” Housing• Upward trend
Production of Green Housing • Percent of new and substantially-rehabilitated housing that achieves LEED certification at LEED Silver or higher
Production of Green Housing• Upward trend
Indicators Targets for 2020
Housing
Goal

18
1. Community members of all ages participate actively and effectively in civic affairs andcommunity improvement efforts.
2. Community members of all ages understand the basic principles of sustainability and usethem to guide their decisions and actions - both personal and collective.
Indicators – System Level Targets
Voter Participation • Percent of registered Santa Monica voters who vote in scheduled elections
Voter Participation • Increase to 68% in off year elections
Participation in Civic Affairs • Attendance at a city-sponsored meeting of any kind in the past year, including City Council meetings, city commission meetings, or special-topic workshops
Participation in Civic Affairs • Upward trend
Empowerment • Percent of Santa Monica residents who feel they have the opportunity to voice their concerns in the city on major community decisions that affect their lives
Empowerment • Upward trend
Resident Satisfaction• Percent of Santa Monica residents who are positive about the city as a place to live
Resident Satisfaction• 95% of residents surveyed
Participation in Neighborhood Organizations • Percent of Santa Monica residents that are represented by an active neighborhood organizations
Participation in Neighborhood Organizations • Upward trend
Sustainable Community Involvement • Number of residents who participate in Residential Greening Program• Number of Santa Monica College students who participate in Student Greening Program• Number of residents who participate in Community Sustainability Programs
Sustainable Community Involvement • 1,500 residents• 3,000 students• 1,000 residents
Indicators Targets for 2020
Community Education and Civic Participation
Goals

19
Community Education andCivic Participation
20
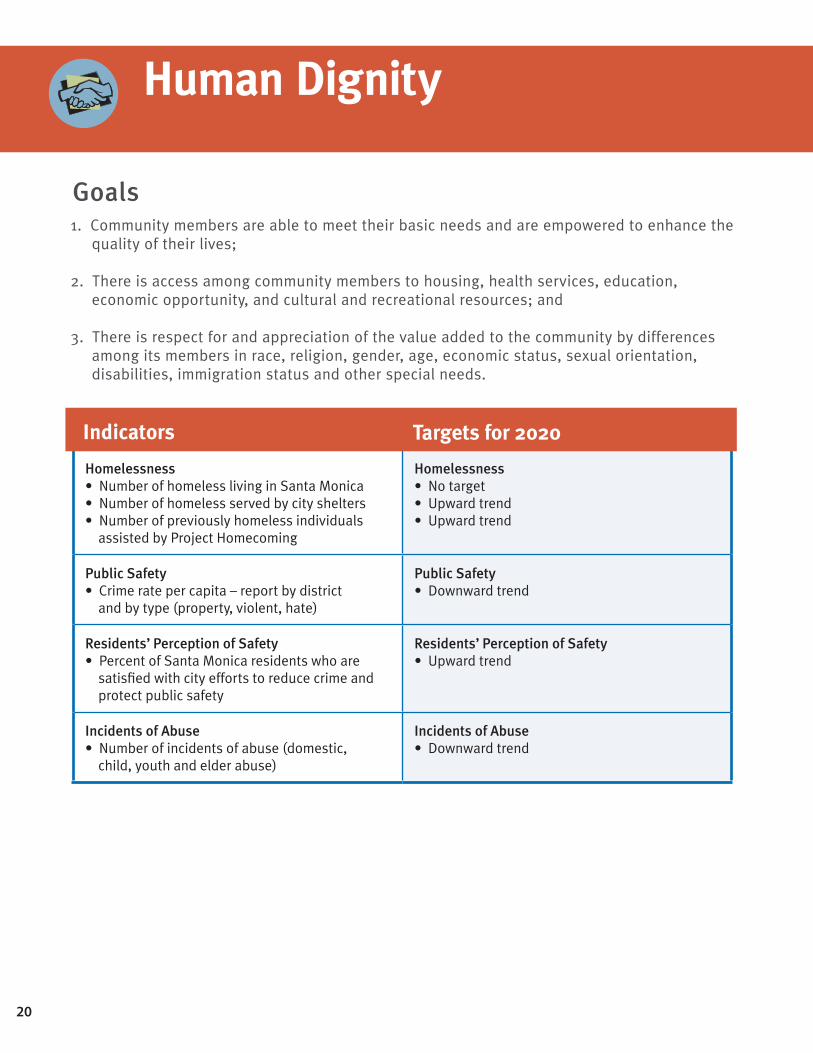
1. Community members are able to meet their basic needs and are empowered to enhance thequality of their lives;
2. There is access among community members to housing, health services, education,economic opportunity, and cultural and recreational resources; and
3. There is respect for and appreciation of the value added to the community by differencesamong its members in race, religion, gender, age, economic status, sexual orientation,disabilities, immigration status and other special needs.
Indicators – System Level Targets
Homelessness • Number of homeless living in Santa Monica• Number of homeless served by city shelters• Number of previously homeless individuals
assisted by Project Homecoming
Homelessness • No target• Upward trend• Upward trend
Public Safety • Crime rate per capita – report by district and by type (property, violent, hate)
Public Safety • Downward trend
Residents’ Perception of Safety• Percent of Santa Monica residents who are satisfied with city efforts to reduce crime and protect public safety
Residents’ Perception of Safety• Upward trend
Incidents of Abuse • Number of incidents of abuse (domestic, child, youth and elder abuse)
Incidents of Abuse • Downward trend
Indicators Targets for 2020
Human Dignity
Goals

21
Indicators – System Level Targets
Youth Education• Grade 3 students proficient in language arts• SMMUSD student graduation rate• SMMUSD student suspension rates• Percent of SMMUSD students who attend
school daily• Percent of SMMUSD students who feel safe
at school• Percent of SMMUSD students that complete
college admission requirements• Percent of SMMUSD students that receive
environmental education consistent with theEducation and the Environment Initiative
Youth Education• At least 85%• At least 91%• Not to exceed 4.4%• At least 87%• At least 67%• At least 77%• At least 50%, per grade
Empowerment• Women, minorities and people with disabilities in leadership positions
Empowerment• Upward trend
Ability to Meet Basic Needs• Percent of Santa Monica Residents who are satisfied with services for:
o Emergency serviceso Affordable housingo Services for seniorso Services for youtho Public transportationo Mobility
Ability to Meet Basic Needs• Percent of Santa Monica Residents who are satisfied with services for:
o Upward trendo Upward trendo Upward trendo Upward trendo Upward trendo Upward trend
Indicators Targets for 2020

22
1. Retain and nurture Santa Monica’s arts community and resources.
2. Increase cultural participation and provide greater access to a diversity of culturalprograms for all ages.
3. Enhance the long-term sustainability of the Santa Monica creative sector.
Indicators – System Level Targets
Presence of artists Presence of artists No net loss
Creative Sector Activity • People employed in the creative sector• Number of businesses• Revenue produced
Creative Sector Activity • Annual Increase• No net loss• No net loss
Presence of Opportunities for Cultural Participation• Number of non-profit cultural organizations• Number of retail arts venues• Classes for life-long learning in the arts
Presence of Opportunities for Cultural Participation• Annual Increase (blended)
Support for the Arts • Financial support for city arts grants• Charitable giving in the arts• Square footage of city property leased
for cultural uses at below market rates
Support for the Arts • Annual Increase (blended)
Attendance and Participation • Number of families in SM who subscribe, buy tickets, etc. to cultural events (LA Stage Alliance data/study) • Participation at city or city-funded cultural events• Participation at non city-funded cultural events
Attendance and Participation • At least 50% of adults attend a live performance annually and at least 30% attend a museum annually• Annual increase• Annual increase
Indicators Targets for 2020
Arts and Culture
Goals

23

24
active recreation: recreational opportunities including sports and other activities that typically require playing fields, facilities or equipment.
affordable housing: any housing that is deed restricted for, and occupied by, households earning less than 120% of the Los Angeles County median family income.
alternative fuel vehicles: vehicles that operate on fuels other than gasoline or diesel in order to reduce greenhouse gas emissions and pollution. Alternative fuel vehicles include those that operate using compressed natural gas (CNG), liquid natural gas (LNG), propane, electricity, hybrid of gasoline and electricity, and hydrogen.
alternative (and/or sustainable) modes of transportation: transportation by public transit (bus or rail), bicycle or walking.
average vehicle ridership (AVR): a measurement of vehicle occupancy indicating the average number of persons traveling in a measured number of vehicles. AVR is an indicator of the effectiveness of and participation in ridesharing programs.
bike lane/path/route/sharrow: As defined in the City’s Bike Action Plan, a bike lane is a signed and striped lane along a roadway for use by bicycles. Other types of bicycle ways in the city are bike paths and bike routes. A bike path is a dedicated bicycle way that completely separates bicycles from motor vehicles. Bike routes are signed routes which bicyclists share with motor vehicles. Bike routes differ from bike lanes in that routes do not include any striping on the roadway - they are only desig-nated by signage. Sharrows are a pavement mark-ing consisting of a directional arrow or “chevron,” and a bicycle symbol similar to those seen in bicycle lanes. Sharrows demonstrate that bicyclists should “take the lane” by directing them into safe, shared-lane positioning.
Sustainable City Plan Glossary
business greening: program that involves consul-tation and implementation of measures to reduce energy and water use and waste, purchase envi-ronmentally preferable products, and educate staff and customers.
community: for the purpose of this document, whenever the term community is used it is meant to include the following groups: individuals of all ages, races and abilities; organizations; government agencies; businesses; employers; employees; residents; property owners; renters; visitors; schools; students; public and private service agencies; faith communities; and local media.
clean distributed generation: distributed generation refers to generation of electricity at or near the location where that electricity will be used. This differs from traditional electricity gener-ation, which occurs at centralized power plants and is distributed over hundreds of miles to millions of customers through the electricity “grid”. For the purpose of this document, clean distributed gener-ation (in order of preferred technology type) refers to: 1) renewable distributed generation, including electricity generated by solar photovoltaic systems, fuel cells (powered by hydrogen generated from solar, wind, or other non-fossil fuel, renewable energy technologies), and small wind generators; 2) electricity generated by high efficiency (i.e.,meeting or exceeding efficiency of large natural gas power plants) natural gas generators and fuel cells using hydrogen generated through a natural gas catalyst; and 3) medium scale, high-efficiency co-generation systems (powered by natural gas) serving many properties located within close proximity of each other. Clean distributed generation does not include electricity generated by gasoline or diesel powered generators.
diversion: in reference to solid waste, diversion refers to all waste that is kept out of a landfill through recycling, beneficial reuse, composting, or other means.

25
ecological footprint: The ecological footprint is a tool to help measure human impacts on local and global ecosystems. The ecological footprint of a given population (household, community, country) is the total area of ecologically produc-tive land and water used exclusively to produce all the resources (including food, fuel, and fiber) consumed and to assimilate all the wastes gen-erated by that population. Since we use resourc-es from all over the world and affect faraway places with our wastes, the footprint is a sum of these ecological areas — wherever that land and water may be on the planet. Thus the ecological foot¬print of Santa Monica is that area of pro-ductive land inside and outside its borders that is appropriated for its resource consumption or waste assimilation. There is a finite area of eco-logically productive land and water on the Earth, which must be shared among 7 billion people as well as all of the planet’s other species. The amount of ecologically productive land available globally at today’s current population is approxi-mately 5 acres per person. The ecological foot-print of the average American is approximately 25 acres, far exceeding the “fair earthshare”. The ecological footprint is an excellent tool for illustrating the magnitude of the change neces-sary for our world to become sustainable. It is also useful for evaluating and comparing the total environmental impact of specific activities and in this way, helpful for decision-making.
environmentally preferable: a product, service, activity or process that has a lesser or reduced effect on human health and the environment when compared to other products, services, activities or processes that serve the same purpose.
extended producer responsibility: responsibility of producers or manufacturers across the entire life cycle of their products, particularly to the post-consumer stage (after products are discard-ed and become waste). Typically once a product is sold to a consumer, the responsibility of disposing of that product becomes the respon-sibility of the consumer. Extended producer responsibility requires that the producer of the product maintain responsibility for recycling or proper disposal of the product once it has surpassed its useful life.
green: for the purpose of this document, green is used as shorthand to refer to any environmentally preferable product, activity, service or process.
(certified) green business: Santa Monica businesses that have met a higher standard of environmental performance, verified by SustainableWorks and the City of Santa Monica. Businesses must complete mandatory and additional measures in areas concerning staff education, waste reduction, energy efficiency, water efficiency, pollution prevention, sustainable procurement and transportation.
green housing: housing that meets or exceeds the requirements of the City’s Green Building Standards Code.
greenhouse gas (GHG): greenhouse gases are natural and man-made gases in the earth’s atmosphere that allow incoming solar radiation to pass through the atmosphere and warm the earth but trap radiant heat given off by the earth. The radiant heat absorbed by these gases heats the atmosphere. This is a natural process known as the “greenhouse effect” that keeps the earth habitable. The four primary greenhouse gases are carbon dioxide (CO2), methane (CH4), nitrous oxide (N2O) and chlorofluorocarbons (CFCs). Since the industrial period, human activities have led to sharp increases in the levels of GHGs in the atmosphere, enhancing the greenhouse effect and contributing to rising global temperatures.
hazardous material: a material that, because of its quantity, concentration, or physical or chemical characteristics, poses a significant present or potential hazard to human health and safety or to the environment if released into the workplace or the environment.
hazardous waste: a waste or combination of wastes which, because of its quantity, concentration, or physical, chemical or infectious characteristics, may cause or significantly contribute to an increase in serious, irreversible, or incapacitating reversible illness or pose a substan-tial present or potential hazard to human health, safety, welfare or to the environment when improp-erly treated, stored, transported, used or disposed of, or otherwise managed.

26
household hazardous waste (HHW): hazardous waste that is generated by residents through the use of hazardous or potentially hazardous products in the home. Typical household hazardous wastes include spent batteries, cleaning products, pesticides, paints and solvents.
HHW programs: refers to City operated programs to reduce use of hazardous materials and safely collect and dispose of community-generated HHW. These programs include the HHW Center, which was permanently closed in 2013, home collection services, used oil collection, pharmaceutical disposal, sharps collection and establishment of local drop-off sites.
income levels: With respect to the indicators of housing affordability the following are definitions of the income levels mentioned in this document:
Very low income: annual earnings between 0 and 50% of the Los Angeles County Median Family income (MFI)
Low income: annual earnings between 51 and 80% MFI
Moderate income: annual earnings between 81 and 120% MFI
Upper income: annual earnings above 120% MFI
LEEDTM certification (Leadership in Energy & Environmental Design): A rating system developed by the United States Green Building Council (USGBC) that sets definitive standards for what constitutes a green or environmentally preferable building. The certification system is self-assessing and is designed for rating new and existing commercial, institutional, and high-rise residential buildings. It evaluates environmental performance of the entire building over the building’s life cycle. LEED certifications are awarded at various levels (certified, silver, gold, and platinum) according to a point-based scoring system.
livable housing: housing that is within close proximity to neighborhood serving commercial areas, transit stops and community resources such as parks and open space.
local: the term local has different definitions depending upon the context in which it is used in this document. These are described below:
1) Where local is used in reference to the economy(“local economy” or “local businesses”) it refers to Santa Monica’s economy or businesses located within Santa Monica.
2) Local government agencies refer to any agenciesor departments of the Santa Monica city government.
3) Where local refers to food production (“locallyproduced”) it refers to food grown in the southern half of the state of California.
4) Where local refers to resources, it refers toresources obtained or impacted within a 500-mile radius of Santa Monica.
mixed-use projects: developments which incorporate both residential and commercial uses.
modal split: the split in use of various transportation modes including: single passenger vehicles; carpools of more than one passenger; bus; rail; bicycle; and pedestrian modes.
multi-modal transportation system: a transportation system that includes affordable, alternative modes of transportation such as public transit, and infrastructure and access for alternative fueled vehicles, bicycles and pedestrians, in addition to standard vehicular transportation.
native species: plant or animal species native to the Southern California bioregion.

27
natural function/wildlife habitat: geographic areas that provide life-supportive functions associated with atmospheric, biological, biochemical and hydrological processes that keep our air and water clean, process waste, and support survival and reproduction of plant and animal life.
non-renewable resources: natural resources that have a finite availability worldwide. Examples include coal, oil and other petroleum products.
open space: for the purpose of this document open space refers to all land uses defined as open space in the Open Space Element of the City of Santa Monica’s General Plan. These include beaches, parks, public gathering places, usable green open space in street medians, scenic highway corridors, gardens, and other publicly accessible land.
passive recreation: recreational opportuni-ties that occur in a natural setting which require minimal development or facilities, and the importance of the environment or setting for the activities is greater than in developed or active recreation settings.
PBTs (persistent bioaccumulative toxics): chemicals that are toxic, persist in the environment and bioaccumulate in food chains and, thus, pose risks to human health and the environment. The term PBT is used primarily by the US Environmental Protection Agency (EPA), as part of its preparation of a list of such chemicals that will receive special regulatory emphasis in the United States.
POPs (persistent organic pollutants): Organic chemical substances that persist in the environment and bioaccumulate in food chains and pose a risk of causing adverse effects to human health and the environment. The term POPs is commonly used in the context of the United Nations Environment Program (UNEP) and are subject to international negotiations aiming toward their global elimination.
Note: The primary difference between PBTs and POPs is that the list of PBTs includes non-organic toxins that are not included on the list of POPs.
potable: suitable for drinking.
qualified low emission / alternative fuel vehicles: Vehicles recognized by the State of California as being low emission and/or alternative fuel vehicles. These vehicles exceed the basic standards all new vehicles must meet to be sold in California and include low emission vehicles (LEVs), ultra low emission vehicles (ULEVs), super ultra low emission vehicles (SULEVs) and zero emission vehicles (ZEVs).
rainy day: for the purpose of this document, a rainy day is any day with recorded precipitation greater than .1” in 24 hours.
regionally appropriate vegetation: plant and tree species that are environmentally appropriate for the Southern California region and that do not negatively impact native plants or animals.
rehabilitated housing: rehabilitation that increases by 25% or more the after-rehab value of the property; or a rehabilitation in which at least fifty percent of exterior walls have been removed or relocated for any duration of time.
renewable limits: harvesting resources within renew-able limits refers to harvesting a renewable resource at a rate that is lower than the rate the resource can replace itself (e.g. catching fish at a rate that will allow the fish population to be maintained over time. If too many fish are caught, exceeding renewable lim-its, the fish population will decline). The terms renew-able limits and sustainable limits are synonymous.
renewable resources: natural resources that have an unlimited supply (such as solar radiation) or that can be renewed indefinitely if ecosystem health is main-tained (e.g. fisheries or forests).
rent-burdened: households that spend more than 30 percent of gross income on rent.

28
routine: for the purpose of this document, routine, when describing generation of hazardous waste by City government operations, refers to regular and consistent operational practices such as vehicle maintenance, regular cleaning procedures, etc. Non-routine refers to hazardous waste generated during unanticipated events such as chemical spills or leaks.
significant emissions source: sources of toxic air contaminants and other air emissions that pose a threat to human health and the environment.
SMMUSD: Santa Monica-Malibu Unified School District.
special needs groups: with respect to affordable housing, special needs groups refers to the elderly, disabled persons, large families, female-headed families, and the homeless.
sustainable: sustainable can mean slightly different things depending on the context in which it is used. For the purpose of this document, the following definitions are used:sustainable (in reference to resource use): a method of harvesting or using a resource so that resource is not depleted or permanently damaged.
sustainable business: for the purpose of this document, sustainable business refers to a business that provides goods and services, and/or has incorporated into its daily operations practices that result in cleaner air and water, less waste and pollution, conservation of energy and natural resources, less traffic, improved quality of life for residents and workers, and contribute to a strong and viable local economy.
sustainable community/city: a community or city that meets its present needs without sacrificing the ability of future generations to meet their own needs. More specifically, a sustainable community is one that improves and enhances its natural, social and economic resources in ways that allow current and future members of the community to lead healthy, productive and satisfying lives.
sustainable modes of transportation/travel: same as alternative modes of transportation above.
sustainable procurement: procurement of environmentally preferable goods and services in a way that also takes into consideration social responsibility and sustainable economic development issues in the manufacture, transportation, sale and use of those goods and services.
Sustainable Quality Awards (SQAs): The SQA is an annual event that promotes the efforts of local businesses that have made significant achievements in the areas of sustainable economic development, social responsibility, and stewardship of the natural environment. By recognizing these achievements, this awards program educates and inspires other businesses to adopt their own sustainable practices, thus helping Santa Monica become a model sustainable community, providing its residents and visitors with a healthy economy and environment.
toxic material: a substance that causes illness, injury or death by chemical means. A poison.
toxic air contaminants (TACs): air pollutants which may cause or contribute to an increase in mortality or serious illness, or which may pose a present or potential hazard to human health.
transit node: a station for public transportation along a regional transit corridor (usually rail or rapid bus) with access routes for buses, taxis, automobiles, bicycles and pedestrians.
urban villages: mixed-use developments in walkable, livable and transit-oriented districts that balance the need for sufficient density to support convenient, high-frequency transit service within the scale of the adjacent community.

29
vehicle miles traveled (VMT): one vehicle traveling one mile constitutes a vehicle mile. VMT is primarily an indicator of automobile use. Increasing VMT typically corresponds with increases in traffic and vehicle-related pollution.
zero emissions vehicle (ZEV): motor vehicle that produces neither tailpipe nor evaporative pollutant emissions.
zero waste: recycling or reusing over 90% of all natural and man-made materials back into nature or the marketplace rather than sending those materials to landfills or similar disposal options.

30
On September 20, 1994 Santa Monica’s City Council adopted the city’s first Sustainable City Program to ensure that Santa Monica can continue to meet its current environmental, economic and social needs without compromising the ability of future generations to do the same. The program has evolved since its adoption and has been responsible for many positive changes in the community. In 2003, City Council adopted an expanded version of the program called the Sustainable City Plan (SCP), which was developed by a diverse group of community stakeholders and lays out far reaching sustainability goals for the community. Visit www.sustainablesm.org for more details.
For more information please visit sustainablesm.org
Measuring Sustainability
Background
Photographs provided by Greg Peterson, David Cowan, Amy Williams and City Staff
Sustainable City Report Card: The Report Card, which is issued bi-annually, summarizes and grades our progress in meeting the Sustainable City Plan goals. The summaries are very helpful in providing a snapshot of the community’s efforts to date, and the grades are a tough-minded and fair assessment of how far we have come and what challenges lay ahead.
Sustainable City Progress Report: The Progress Report is a comprehensive, web-based repository of all the data available to date on indicators used to measure our progress toward sustainability. The Progress Report website is the definitive resource for community decision makers and residents.
In order to reach our goals, community members must be informed, empowered and motivated. Informing the public is our primary job, and two tools were developed for accomplishing this task: the Sustainable City Report Card and the Sustainable City Progress Report.