
Sustainable Building Material Index Manufacture in … · Sustainable Building Material Index...
33
Sustainable Building Material Index Assessment and Recommendations for Informal Brick Manufacture in Aliwall North, Eastern Cape For Swisscontact Date: 8 September 2014 Version: C
Transcript of Sustainable Building Material Index Manufacture in … · Sustainable Building Material Index...

Sustainable Building Material Index Assessment and Recommendations for Informal Brick Manufacture in Aliwall North, Eastern Cape For Swisscontact Date: 8 September 2014 Version: C

Sustainable Building Materials Index Assessment Gauge
08.09.2014 Page 1
Developed for Swisscontact Attention of Luca de Giovanetti Email: [email protected]
Developed by Gauge P.O. Box 14738 Hatfield 0028 Queries with regard to this document should be directed to: Jeremy Gibberd Mobile: +27 (0)82 857 1318 Email: [email protected] Version Control Version Comments Date Checked by
A Draft data issued for review by Pieter du Toit, Luca de Giovanetti, John Volsteedt.
3.09.2014 JG
B Draft presentation issued for review by Pieter du Toit, Luca de Giovanetti, John Volsteedt.
4.09.2014 JG
C Draft report issued to Luca de Giovanetti. 8.09.2014 JG © Gauge 2014 This document has been developed for use on the Swisscontact project only. Gauge retains all intellectual property contained in the document and this may only be copied or used elsewhere with Gauge’s written consent. Where material contained in this report is referred to the following reference should be provided. Gibberd, J., 2014, Sustainable Building Material Index Assessment and Recommendations for Informal Brick Manufacture in Alliwal North, Eastern Cape, Gauge, Pretoria, South Africa.

Sustainable Building Materials Index Assessment Gauge
08.09.2014 Page 2
Sustainable Building Material Index Assessment and Recommendations for Informal Brick Manufacture in Aliwall North, Eastern Cape CONTENTS
1. Executive Summary ..................................................................................................................... 3
2. Definitions ..................................................................................................................................... 6
3. Introduction ................................................................................................................................... 7
4. The Sustainable Building Material Index ................................................................................... 8
5. Site Description .......................................................................................................................... 11
6. Site Data and SBMI Functional Units ....................................................................................... 13
7. Resource Consumption ............................................................................................................. 15
8. Carbon Emissions ...................................................................................................................... 16
9. Water Consumption ................................................................................................................... 17
10. Land use .................................................................................................................................. 18
11. Waste ....................................................................................................................................... 19
12. Pollution ................................................................................................................................... 20
13. Employment ............................................................................................................................ 21
14. Enterprises .............................................................................................................................. 22
16. Training .................................................................................................................................... 23
17. Mentoring ................................................................................................................................. 24
18. Health and Safety .................................................................................................................... 25
19. Abseenteeism.......................................................................................................................... 26
20. Recommendations ................................................................................................................. 27
21. Conclusions and Wider Implications of the Study .............................................................. 28
22. SBMI Existing .......................................................................................................................... 29
23. SBMI Proposed ....................................................................................................................... 30
24. References ............................................................................................................................... 31

Sustainable Building Materials Index Assessment Gauge
08.09.2014 Page 3
Sustainable Building Material Index Assessment and Recommendations for Informal Brick Manufacture in Aliwall North, Eastern Cape
1. EXECUTIVE SUMMARY
1.1. Introduction
This report provides a Sustainable Building Materials Index (SBMI) assessment of bricks made at a brick making site in Dukathole, near Alliwal North, in the Eastern Cape. It provides an assessment of the sustainability impacts of the brick products and makes recommendations for improvement. The assessment was based on the Sustainable Building Materials Index methodology.
1.2. The Sustainable Building Material Index
The Sustainable Building Material Index (SBMI) is a methodology for understanding the nature and scale of sustainability impacts of a building material or product. It provides a simple way of capturing, presenting and comparing key social, economic and environmental sustainability effects associated with the production of a material or product.
1.3. The site
The site assessed is one of about 100 small informal clay brick manufacturing sites located in Dukathole. It is estimated that only about 30 of these are currently active, although around 69 were active before a building slump in 2012. The area of the brick making site assessed is approximately 3,000m2 and consists of brick forming, drying, firing and storage areas, a water tank and a dwelling with equipment stores. Three permanent and seven casual staff are employed and production is 300,000 bricks a year. Of this production, 200,000 bricks are regarded as compliant with required standards for strength.
1.4. Main findings
Records No written records were available on site. All data used for SBMI assessment is therefore estimated (E) and was obtained through interviews, field measurements and observation. Further detail on SBMI assessments and estimated (E) and record-based (R) data is detailed in the SBMI section of the report. SBMI Existing The ‘SBMI Existing’ section of this report provides an overall indication of sustainability impact of current practices on site. This indicates that there was no formal training or mentoring on site. It also indicates that there were no formal procedures for promoting health and safety or recording incidents on site. Thus even though the site may have mentoring, training or health and safety procedures, because these were informal and there were no records, for the purposes of the assessment, these are reflected as a “0”. On average, employees worked 17 days a week, and the site was open for only 10 months a year, resulting in an absenteeism rate of above 20%. Environmental performance in terms of resource consumption, carbon emissions, water consumption and land use were assessed as a ‘2’, indicating that improvement was possible. Assessment of existing production also indicated that a large proportion of products (100,000) from the site were regarded as non-compliant. This indicates that if products could become compliant, significant improvements could be achieved for environmental impacts. This however may result in increased wastage as more products are ‘condemned’. Wastage in existing practice is indicated as 5% and all waste is recycled in new production. Pollution figures for both existing and proposed assessment are indicated as zero as no adequate data on this exists. SBMI Proposed The ‘SBMI Proposed’ section of this report provides an overall indication of sustainability impact if proposed practices were implemented on site. Proposed practices are indicated within the ‘Recommendations’ section of the study and are summarised in a section below.

Sustainable Building Materials Index Assessment Gauge
08.09.2014 Page 4
In ‘SBMI Proposed’ improvements as a result in processes, training and quality control result in products being produced on site being compliant (300,000 bricks per year). This will result in increased wastage as products are condemned, however as this waste is recycled, no overall increase in waste (ie waste directed to landfill) is reflected. This improvement leads to improved consumption, carbon emissions, water consumption and land use figures. Formal training in production and quality control as well as life-skills and mentoring programmes result in improvements in training, mentoring and absenteeism per functional unit. The establishment of health and safety systems and recording is reflected as improved score; however this is likely to remain low in the short term due to the nature of site processes and casual labour. Improvements in enterprise employment performance are achieved through increased engagement with external organisations / individuals who provide training and marketing to the site.
1.5. Recommendations
The following recommendations are made.
A. Production processes and quality control: Practical training, technical manuals and quality control procedures should be provided to increase the production of high quality compliant products. This will ensure that 300,000 of the 300,000 annual brick production are compliant instead of this being only 200,000 bricks. As compliant bricks achieve 10% higher prices, income for the site can also be improved. This recommendation has significant environmental impacts, as can been seen from the ‘SBMI Proposed’ graph and report provided in the study.
B. Training and quality assurance enterprise: It is recommended that a training and quality control enterprise is linked to the site. This organisation should be closely associated with the site and may be paid on a retainer or as a % fee of sales. In ‘SBMI Proposed’ this support is estimated at one days support a month. A key target for this enterprise should be to increase the number of compliant products produced by the site (see Recommendation A).
C. Marketing: It is recommended that an appropriate marketing and business development enterprise is linked to the site. This organisation should be closely associated with the site and may be paid on retainer or as a % fee of sales. In the ‘SBMI Proposed’ this support is estimated at one days support a month. A key target for this enterprise should be to increase sales and revenue for the site (see Recommendations A, H and I).
D. Health and safety: Health and safety procedures should be put in place. This should include training and a monitoring system.
E. Absenteeism: Life skill training and incentives to reduce absenteeism and increase productivity should be implemented.
F. Training and mentoring: Funding for training and mentoring programmes should be sought from SETAs. This can be used to fund appropriate local training and quality assurance training (see Recommendations A, B, D and E) and Recognition of Prior Learning (RPL) processes that are implemented as part of formal mentoring programmes. A key target for the training should be to increase the number of compliant products produced by the site (see Recommendation A).
G. Rainwater harvesting: Rain water harvesting of runoff to offsite dams and onsite tanks should be investigated. This can help reduce carbon emissions and costs associated with pumping. In ‘SBMI Proposed’ this intervention leads to a reduction in pumping by 50%.
H. Local procurement: Local and provincial governments should be targeted to ensure that they include local products in their specifications and procurement policies as this supports local economic development and aligns with government’s localisation objective.
I. Awareness: A publicity campaign should be developed to ensure that developers, architects, home builders are aware of the site’s products and their positive impacts on the local economy.
1.6. Conclusions and wider implications of the study
The study indicates that improved sustainability performance, in terms of the impacts defined by the Sustainable Building Material Index methodology, can be achieved on this site. This improvement will be achieved by implementing some, or all, of the recommendations provided.
Sustainable Building Materials Index Assessment Gauge
08.09.2014 Page 5
The study can also be used to outline the type of support government, and other interested parties, could play a role in supporting improved sustainability performance of informal brick making sites in the Eastern Cape. This is outlined below.
A. High quality local production and service: Targeted production training and quality assurance procedures could be implemented within the informal sector in order to improve efficiency and quality and enable products to access a wider market.
B. Marketing and training franchise models: Marketing and training franchise models could be developed. These would have a direct interest in promoting local products and in ensuring that these were of high quality. Innovative financial models for this service could be used to ensure that this service was sustainable. This could include payment in the form of retainer or as a % fee of sales.
C. Life skills training and information: Practical life skills training which included financial management and health awareness could be provided to improve worker financial management and health. This could support productivity, entrepreneurship and reduce the burden on government health services.
D. Productivity campaign: A campaign to increase worker productivity could be developed with relevant business associations and other bodies. This could include incentives such as a ‘five for five’ incentive, where a 5% wage bonus is paid for achieving under 5% absenteeism.
E. Production clubs: Production associations or clubs could be explored to achieve benefits for members in the form of reduced costs associated with bulk purchases and coordinated transportation services.
F. Training and mentoring funding: Formalised training and mentoring programmes could be developed using SETA funding. This could be developed by municipal economic development departments in partnership with local trainers such as TVET colleges.
G. Small Enterprise Local Product (SLEP) label: A local production label could be developed and supported by a ‘local is lekker’ awareness campaign. This aligns and support government’s localisation objective (Department of Trade and Industry, 2013).
H. Government procurement: Provincial and municipal procurement policy and specifications could be developed to integrate requirement for SLEP products in government construction projects.

Sustainable Building Materials Index Assessment Gauge
08.09.2014 Page 6
2. DEFINITIONS
Localisation: Promoting the growth and diversification of South Africa’s manufacturing sector through designations for local procurement and increasing acceptance and implementation of localisation targets within state procurement regimes (Department of Trade and Industry, 2013). Procurement: The act of obtaining or buying goods and services. The process includes preparation and processing of a demand as well as the end receipt and approval of payment. SBMI: Sustainable Building Material Index. SETA: Sector Education Training Authourity. TVET: Technical Vocational Education and Training.

Sustainable Building Materials Index Assessment Gauge
08.09.2014 Page 7
3. INTRODUCTION
3.1. Introduction
This report provides a Sustainable Building Materials Index assessment of bricks made at a brick making site in Dukathole, near Alliwal North, in the Eastern Cape. It provides an assessment of the sustainability impacts of the brick products and makes recommendations for improvement.
3.2. Terms of reference
The terms of reference for the project are outlined below: Swisscontact wishes to pilot the use of the Sustainable Building Material Index (SBMI) developed by Gauge on a clay brick manufacturing site in the Eastern Cape. The SBMI should be used to:
A. Assess and report on existing performance at sites (Existing SBMI performance) B. Develop recommendations for improved performance (Proposed) C. Assess and report on post proposed intervention performance (Proposed SBMI performance)
Findings from the pilot should be summarised in a brief report for the selected site and the exercise as a whole. Broader implications and recommendations for the sector should also be provided. (Gauge 24.06.2014)
3.3. Limitations
As the timeframes and the cost of this project is limited, the following will not carried out:
A. Detailed modelling B. Extensive calculations C. Extensive onsite measurements D. Wide scale surveys E. Detailed design proposals F. Detailed costings G. Detailed environmental impact analysis
Where appropriate, the report may recommend that some of these are carried out at a later stage.
3.4. Structure of the report
The report has the following structure.
Executive summary: This section summaries the study and provides the main findings and recommendations.
The Sustainable Building Material Index: This section describes the SBMI methodology followed in the study.
Site description: This introduces the site and indicates key characteristics. Site data and SBMI functional units: This provides a summary of the production data and
functional units referred to in the assessment. SBMI criteria assessments: Assessment of each of the SBMI criteria are detailed in these
sections. SBMI reports: ‘Existing SBMI’ and ‘Proposed SBMI’ reports indicate performance of the
existing site and of the site after implementing proposed recommendations. Recommendations: A summary of recommendations from the study is provided. Conclusions and wider implications of the study: Conclusions from the study and the
wider implications of the work are outlined. References: This section lists references used within the study. Appendix A: This includes a presentation in the Eastern Cape to key stakeholders on 8
September 2014.

Sustainable Building Materials Index Assessment Gauge
08.09.2014 Page 8
4. THE SUSTAINABLE BUILDING MATERIAL INDEX
4.1. Introduction
The Sustainable Building Material Index (SBMI) is a methodology for understanding the nature and scale of sustainability impacts of a building material or product. It provides a simple way of capturing, presenting and comparing key social, economic and environmental sustainability effects associated with the production of a material or product. SBMI assessment criteria have been defined through an analysis of building manufacturing systems with associated inputs, outputs and social, environmental and economic impacts. Criteria defined through this process include resource consumption, carbon emissions, water consumption, land use, waste production, employment, small and medium enterprise support, training and mentoring and health and safety. Data used for assessments is sourced directly from building material and product manufacturers. The SBMI approach and tool is unique as it has been designed to be quick and easy to apply and captures social and economic impacts, as well environmental aspects. While aspects of the tool are aligned with environmental and social life cycle assessments (LCA), it provides a valuable alternative to these methodologies as the simpler standardised assessment process enables comparisons between materials and does not require the same level of investment.
4.2. Methodology
SBMI assessments are carried out through a structured data gathering process. Data is obtained from building material and product manufacturers in a standardised format and entered into the SBMI. A visit to the site is also undertaken to capture and verify data.Raw data is then analysed and normalised to ensure that it is in the required SBMI format. Where data does not exist, or is poor, a conservative approach is taken and a ‘worse case’ scenario is reflected in the assessment. This avoids over optimistic assessments and encourages manufacturers to develop improved systems for capturing data. Where data is estimated, an ‘E’ is placed in from the respective figure, where data is based on records that have been provided to the Assessor an ‘R’ is placed in from of the respective figure. The structured assessment process captures a range of data to enable some cross checking and verification. In addition actual records, such as municipal bills, are used as far as possible, as the basis for data gathering and detailed photographic records are taken of site visits.
4.3. Basis and limitations of assessments
While the SBMI provides a rapid and robust assessment of sustainability impact of building materials and productions, it is important to note the basis and limitations of this methodology. These are:
Data: The SBMI assessment process is only as accurate as the data provided to the Assessor and should be seen in this light, rather than as a detailed audit or verification process.
Timeframes: SBMI assessments are based on data from one full year of production and therefore represent a performance for a specific timeframe. Production and processes change from year to year, so performance cannot necessarily be extrapolated. Therefore assessments taken more than 5 years ago are likely to unrepresentative.
Field measurements and calculations: SBMI assessments do not include detailed field measurements, for instance of CO2 emissions. These are calculated based on the best available data and the basis of these calculations provided. For instance, CO2 emission factors for trucks per km will be obtained from relevant databases and using kilometres travelled, total emissions calculated.
Indexing: Data is normalised and compared to tables to obtain an index score from ‘0’ to ‘5’. This indexing is still in development as the SBMI has not been used for a wide range of building products. Therefore the indexing used in this assessment will be relevant to other walling products, but may not be applicable to, for instance, roofing products.
Sustainable Building Materials Index Assessment Gauge
08.09.2014 Page 9
4.4. Use and interpretation of assessments
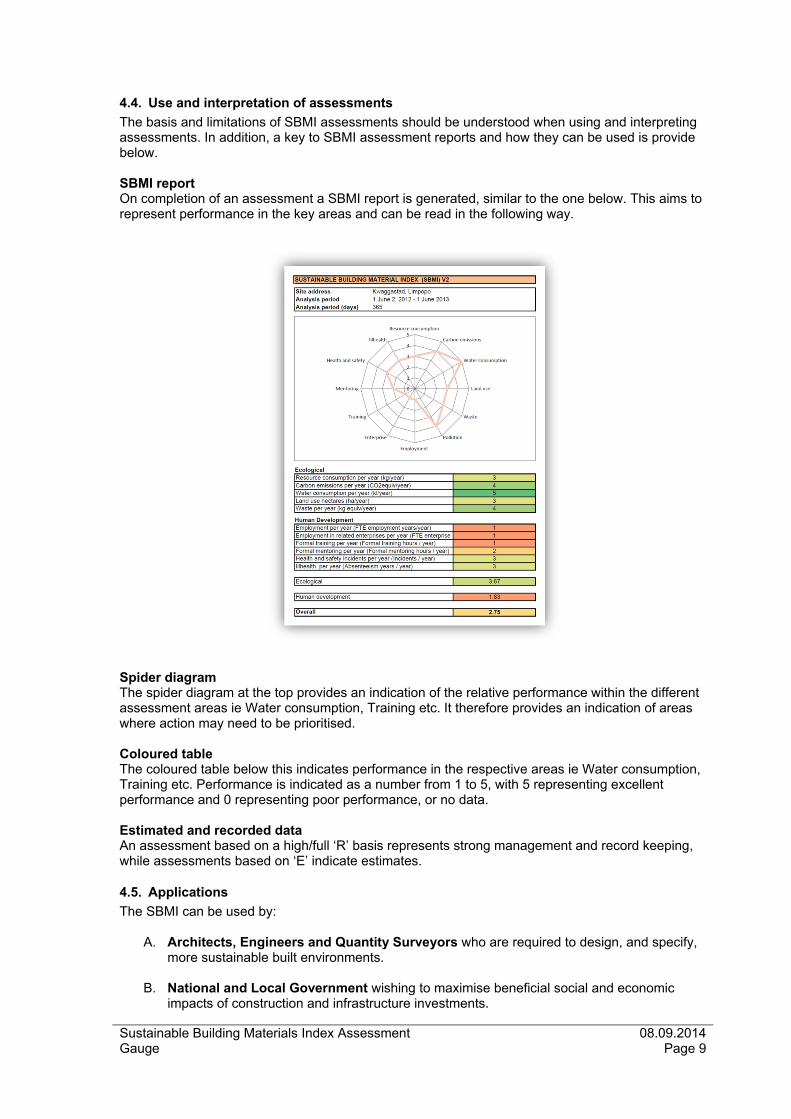
The basis and limitations of SBMI assessments should be understood when using and interpreting assessments. In addition, a key to SBMI assessment reports and how they can be used is provide below. SBMI report On completion of an assessment a SBMI report is generated, similar to the one below. This aims to represent performance in the key areas and can be read in the following way.
Spider diagram The spider diagram at the top provides an indication of the relative performance within the different assessment areas ie Water consumption, Training etc. It therefore provides an indication of areas where action may need to be prioritised. Coloured table The coloured table below this indicates performance in the respective areas ie Water consumption, Training etc. Performance is indicated as a number from 1 to 5, with 5 representing excellent performance and 0 representing poor performance, or no data. Estimated and recorded data An assessment based on a high/full ‘R’ basis represents strong management and record keeping, while assessments based on ‘E’ indicate estimates.
4.5. Applications
The SBMI can be used by:
A. Architects, Engineers and Quantity Surveyors who are required to design, and specify, more sustainable built environments.
B. National and Local Government wishing to maximise beneficial social and economic
impacts of construction and infrastructure investments.

Sustainable Building Materials Index Assessment Gauge
08.09.2014 Page 10
C. Building Product Manufacturers interested in understanding, and improving, the
sustainability impacts of their products.
4.6. Further information Further information on the SBMI can be found at:
www.sustainablebuildingmaterialindex.blogspot.com

Sustainable Building Materials Index Assessment Gauge
08.09.2014 Page 11
5. SITE DESCRIPTION
5.1. Introduction
The site is one of about 100 small informal clay brick manufacturing sites located in the township of Dukathole near Alliwal North. There are currently 31 sites active, having dropped from a peak of about 69 in 2012.
5.2. Site location
The site is located in the township of Dukathole, off the Burgersdorp road, near Alliwal North in the Eastern Cape. The site is sandwiched between an informal settlement, the river, an RDP housing development and a grave yard. Access is good and there are paved roads along one edge of the site.
Figure 1: Site location
5.3. Site description
The site is one of about 100 small informal clay brick manufacturing sites located within the area. It is estimated that only about 30 of these are currently active, although around 69 were active before a building slump in 2012. A number of sites are used on a sporadic basis by households wishing to manufacture their own bricks for dwellings. Some sites have dwellings and livestock such as pigs, goats and horses are kept. There are numerous pits where clay has been excavated as well as range of tracks, drainage channels and active and disused brick manufacturing sites. Water is available from a spring in the middle of the site and a small stream runs from here to the river.
5.4. Thabisile Site
The site selected for assessment is worked by Thabisile, and therefore the site is referred to as the Thabisile site. The site is about 3000m2 (50 x 60m) and contains brick forming areas, a brick drying area, a brick firing area, finished brick storage stacks, a subsurface water tank, a dwelling and equipment stores. A picture of the site taken from the entrance road is provided below.

Sustainable Building Materials Index Assessment Gauge
08.09.2014 Page 12
Figure 2: The site
5.5. Linked activities
The following activities are linked to brick making on this site:
A. Ash is transported from Burgersdorp power station, 58 km away. The power station is now defunct but ash is available from dumps.
B. Coal is obtained from the Coop in Alliwal North C. Water is pumped from a spring near site.
5.6. Occupancy
A. There are three full time permanent employees and seven casual employees. The full time time employees form bricks in the moulds and the casuals supply them with materials and stack bricks. Full time employees are paid weekly, casuals are paid on a daily basis. Work in both cases are linked to production ie 1000 bricks formed, or moved etc.
B. Normal working hours are: 7.30 - 8.00AM to 4:30 – 5.00 PM for casuals and slightly longer for permanent employees from Monday to Friday. Mondays are often not worked.
C. Sites are operated about 10 months of the year. Usually there is not a much activity during winter because of frost damage
5.7. Key contact details
Contact person Victor Tlale Cell No: 084 580 1447
water supply
brick forming
bricks for sale
drying brickshomestead
ash
claywaste bricks

Sustainable Building Materials Index Assessment Gauge
08.09.2014 Page 13
6. SITE DATA AND SBMI FUNCTIONAL UNITS
6.1. Existing performance
6.2. Notes
A. 200,000 bricks of the 300,000 brick annual production are regarded as compliant. B. All data is estimated (E) and was obtained through interviews, field measurements and
observation, as no written records are available.
6.3. Options
A. Improve production processes and quality control to ensure all current production results in compliant products.
6.4. Potential impacts
A. Compliant output rises from 200,000 bricks to 300,000 bricks. B. Increased efficiency results in improved environmental and human development impacts per
product.
6.5. Proposed performance
Improving the production of compliant bricks from 200,000 to 300,000 has a range of positive impacts. These are reflected in assessment of the SBMI criteria that follow.
SUSTAINABLE BUILDING MATERIAL INDEX INPUTS (SBMI) V2INPUT Version in development, please email [email protected] with comments
Date of input 29-Aug-14By Jeremy Gibberd
CONSTRUCTION PRODUCT MANUFACTURE SITESite address Thabiso, Dukathole, Alliwall North, E CapeAnalysis period July 31 2013 August 1 - 2014
Analysis period (days) 1 year (must be at least 1 year)
PRODUCT TYPEProduct type clay bricks ie bricksProduct name clay bricks ie Burnt clay brickProducts per year 200 000 ie 30,000
FUNCTIONAL UNITFunctional unit 1m2 ie compliant m2 of wallingProducts/functional unit 80Loss during construction 10Total product/functional unit 88
PRODUCTION ProductsBricks Type of product Number Units Conversion factor Equivalents
Red 100 000 brick 100 000Blue 200 000 brick 200 000
Total 300 000Compliant Total 200 000
ie number of products required for 1 m2ie 10 percent during transportation and construction
List all construction products completed during analysis period

Sustainable Building Materials Index Assessment Gauge
08.09.2014 Page 14
SUSTAINABLE BUILDING MATERIAL INDEX INPUTS (SBMI) V2INPUT Version in development, please email [email protected] with comments
Date of input 29-Aug-14By Jeremy Gibberd
CONSTRUCTION PRODUCT MANUFACTURE SITESite address Thabiso, Dukathole, Alliwall North, E CapeAnalysis period July 31 2013 August 1 - 2014
Analysis period (days) 1 year (must be at least 1 year)
PRODUCT TYPEProduct type clay bricks ie bricksProduct name clay bricks ie Burnt clay brickProducts per year 300 000 ie 30,000
FUNCTIONAL UNITFunctional unit 1m2 ie compliant m2 of wallingProducts/functional unit 80Loss during construction 10Total product/functional unit 88
ie number of products required for 1 m2ie 10 percent during transportation and construction

Sustainable Building Materials Index Assessment Gauge
08.09.2014 Page 15
7. RESOURCE CONSUMPTION
7.1. Existing performance
7.2. Notes
A. Ash has been allocated a conversion of zero, as this is a waste that is being used by the brick making process.
B. All data is estimated (E) and was obtained through interviews, field measurements and observation, as no written records are available.
7.3. Options
A. Improve production and quality control processes to achieve 300,000 compliant products instead of 200,000 compliant products per year.
7.4. Potential impacts
A. Increased efficiency resulting in improved environmental and human development impacts per product.
7.5. Proposed performance
SBMI rating changes from 2 to 3 as result of the improved efficiency.
Resource consumption Type of material Source Amount Units Conversion factor EquivalentsClay Onsite / 200m 176 000 kg 1 176 000Coal Alliwall North 2 400 kg 1 2 400Ash Burgersdorp 72 000 kg 0
Total 178 400178 400
0.89782
Resource consumption per unit of production
List all materials used to produce construction products during analysis period
Resource consumption per year (kg/year)
Resource consumption per functional unitSBMI rating
Resource consumption Type of material Source Amount Units Conversion factor EquivalentsClay Onsite / 200m 176 000 kg 1 176 000Coal Alliwall North (5km) 2 400 kg 1 2 400Ash Burgersdorp (56km) 72 000 kg 0
Total 178 400178 400
0.59523
Resource consumption per year (kg/year)
Resource consumption per functional unitSBMI rating
List all materials used to produce construction products during analysis period
Resource consumption per unit of production

Sustainable Building Materials Index Assessment Gauge
08.09.2014 Page 16
8. CARBON EMISSIONS
8.1. Existing performance
8.2. Notes
A. Water is pumped from a spring area to a sump / tank on site. B. Carbon emissions from ash are not known. C. All data is estimated (E) and was obtained through interviews, field measurements and
observation, as no written records are available.
8.3. Options
A. Avoid water pumping through gravity supply from rainwater harvesting storage above site. There is the potential to locate a small dam where water could be captured for the site.
B. Improve production and quality control processes to achieve 300,000 compliant products instead of 200,000 products per year.
C. Alternative fuels; biogas firing?
8.4. Potential impacts
A. Reduced carbon emissions and costs associated with pumping water. B. Increased efficiency resulting in improved environmental and human development impacts
per product.
8.5. Proposed performance
SBMI rating changes from 2 to 3 as result of the improved efficiency.
Carbon emissionsUse Source Amount per year Units Conversion factor EquivalentsFiring Coal 2 400 kg 3107.056683 7456936
Firing Ash UnknownTransport of ash 7 tonne truck 1 276 km 0.747118 953
Transport of clay Backactor 1 500 km equiv 0.268817 403Water transportation Honda pump 2 700 km equiv 0.08773 237Transport of coal 1 tonne pick up 60 km 0.153464 9
745853937
32822
Carbon emissions per functional unitSBMI rating
Carbon emissions per unit of production
List all carbon emissions emitted to produce construction products during analysis period
Carbon emissions per year (kgCO2equiv/year)
Carbon emissionsUse Source Amount per year Units Conversion factor EquivalentsFiring Coal 2 400 kg 3107.056683 7456936
Firing Ash UnknownTransport of ash 7 tonne truck 1 276 km 0.747118 953
Transport of clay Backactor 1 500 km equiv 0.268817 403Water transportation Honda pump 1 350 km equiv 0.08773 118Transport of coal 1 tonne pick up 60 km 0.153464 9Firing
745842025
21883
Carbon emissions per unit of production
List all carbon emissions emitted to produce construction products during analysis period
Carbon emissions per year (kgCO2equiv/year)
Carbon emissions per functional unitSBMI rating

Sustainable Building Materials Index Assessment Gauge
08.09.2014 Page 17
9. WATER CONSUMPTION
9.1. Existing performance
9.2. Notes
A. Water is pumped from a spring area to a sump / tank on site. B. Most sites have rudimentary channels directing runoff into underground tanks and sumps. C. All data is estimated (E) and was obtained through interviews, field measurements and
observation, as no written records are available.
9.3. Options
A. Improve rainwater harvesting on site. B. Improve rainwater harvesting for overall area using a dam above the site. C. Improve production and quality control processes to achieve 300,000 compliant products
instead of 200,000 products per year.
9.4. Potential impacts
A. Reduced water consumption. B. Reduced carbon emissions and costs associated with pumping water (Carbon Emissions). D. Increased efficiency resulting in improved environmental and human development impacts
per product.
9.5. Proposed performance
SBMI rating changes from 2 to 3 as result of the improved efficiency.
Water Use Source Amount Units Conversion factor EquivalentsMixing Spring 86 000 l 1 86 000.00
86 000.000.43
37.842.00
Water consumption per year (l/year)Water consumption per unit of production Water consumption per functional unitSBMI rating
List all water consumption used to produce construction products during analysis period
Water Use Source Amount Units Conversion factor EquivalentsMixing Spring 86 000 l 1 86 000.00
86 000.000.29
25.233.00
List all water consumption used to produce construction products during analysis period
Water consumption per year (l/year)Water consumption per unit of production Water consumption per functional unitSBMI rating
Sustainable Building Materials Index Assessment Gauge
08.09.2014 Page 18
10. LAND USE
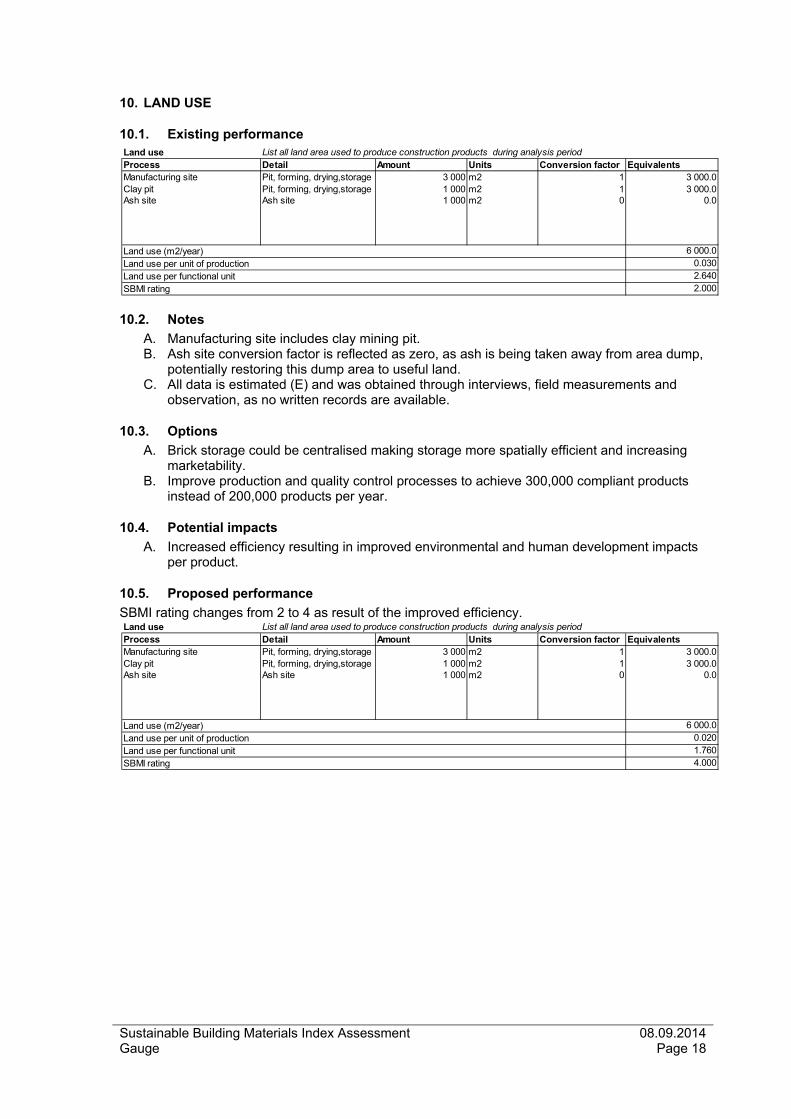
10.1. Existing performance
10.2. Notes
A. Manufacturing site includes clay mining pit. B. Ash site conversion factor is reflected as zero, as ash is being taken away from area dump,
potentially restoring this dump area to useful land. C. All data is estimated (E) and was obtained through interviews, field measurements and
observation, as no written records are available.
10.3. Options
A. Brick storage could be centralised making storage more spatially efficient and increasing marketability.
B. Improve production and quality control processes to achieve 300,000 compliant products instead of 200,000 products per year.
10.4. Potential impacts
A. Increased efficiency resulting in improved environmental and human development impacts per product.
10.5. Proposed performance
SBMI rating changes from 2 to 4 as result of the improved efficiency.
Land useProcess Detail Amount Units Conversion factor EquivalentsManufacturing site Pit, forming, drying,storage 3 000 m2 1 3 000.0Clay pit Pit, forming, drying,storage 1 000 m2 1 3 000.0Ash site Ash site 1 000 m2 0 0.0
6 000.00.0302.6402.000
Land use (m2/year)
List all land area used to produce construction products during analysis period
Land use per unit of production Land use per functional unitSBMI rating
Land useProcess Detail Amount Units Conversion factor EquivalentsManufacturing site Pit, forming, drying,storage 3 000 m2 1 3 000.0Clay pit Pit, forming, drying,storage 1 000 m2 1 3 000.0Ash site Ash site 1 000 m2 0 0.0
6 000.00.0201.7604.000
Land use (m2/year)
List all land area used to produce construction products during analysis period
Land use per unit of production Land use per functional unitSBMI rating

Sustainable Building Materials Index Assessment Gauge
08.09.2014 Page 19
11. WASTE
11.1. Existing performance
11.2. Notes
A. Between 5 and 10 % of the bricks produced are regarded as waste. All of this material is reused. However a large number of products (100,000 bricks) while not regarded as waste are not regarded as compliant products.
B. Stones from ash sifting are used on the site to terrace and level the site. C. No waste goes off site to landfill or other sites. D. All data is estimated (E) and was obtained through interviews, field measurements and
observation, as no written records are available.
11.3. Options
A. Improve production and quality control processes to achieve 300,000 compliant products instead of 200,000 products per year.
11.4. Potential impacts
A. Increased efficiency resulting in improved environmental and human development impacts per product.
11.5. Proposed performance
Waste is likely increases as a result of more stringent quality control processes, but this is not reflected as a reduced SBMI rating, as it is assumed that increased waste is recycled on site (conversion factor 0) as is current practice.
Waste Process Type Amount Units Conversion factor EquivalentsFiring broken bricks 15 000 bricks 0 0
00.0000
05
Waste per unit of production Waste per functional unitSBMI rating
List all waste products resulting from construction products during analysis period
Waste per year (kg equiv/year)
Waste Process Type Amount Units Conversion factor EquivalentsFiring broken bricks 30 000 bricks 0 0
00.0000
05
Waste per year (kg equiv/year)
List all waste products resulting from construction products during analysis period
Waste per unit of production Waste per functional unitSBMI rating

Sustainable Building Materials Index Assessment Gauge
08.09.2014 Page 20
12. POLLUTION
12.1. Existing performance
12.2. Notes
A. Data available on pollution as CO2 equiv. This has been included in Carbon emission data B. Limited data on other pollutants associated with firing. C. All data is estimated (E) and was obtained through interviews, field measurements and
observation, as no written records are available.
12.3. Options
A. Improve production and quality control processes to achieve 300,000 compliant products instead of 200,000 products per year.
12.4. Potential impacts
A. Increased efficiency resulting in improved environmental and human development impacts per product.
12.5. Proposed performance
As a result of improved efficiency, levels of pollution per functional unit are likely to decrease. However the magnitude of this decrease cannot be estimated without better data.
PollutionProcess Major Primary Pollutants Amount Units Conversion factor CO2 Equivalents
Sulpher oxideNitrogen oxideCarbon monoxideVolatile organic compoundsParticulatesChloroflourocarbons
0.00000.00000.00000.0000
Pollution per unit of production
List all pollution resulting from construction products listed above during analysis period
Pollution per year (kg equiv/year)
SBMI ratingPollution per functional unit

Sustainable Building Materials Index Assessment Gauge
08.09.2014 Page 21
13. EMPLOYMENT
13.1. Existing performance
13.2. Notes
A. Employment is reflected as 17 days employment per month as employees tend not to work on Mondays. This may be a result of illness following activities at weekend after wages are paid.
B. All data is estimated (E) and was obtained through interviews, field measurements and observation, as no written records are available.
13.3. Options
A. Life skills training. B. Improve production and quality control processes to achieve 300,000 compliant products
instead of 200,000 compliant products per year. C. Incentives for low absenteeism, such as 5% of wages bonus for under 5% absenteeism.
13.4. Potential impacts
A. Full week employment, which would increase employment days by approxmately 20%. B. Increased efficiency resulting in improved environmental and human development impacts
per product.
13.5. Proposed performance
Employment days reduce significantly per functional unit as a result of efficiency improvements. However this has not resulted in a change in the SBMI rating.
Employment
Type of workNumber of people employed
Person days per month
Person days per year Conversion factor Equivalents
Permanent 3 17 510 510Casuals 7 17 1 190 1 190
Total 1700.001700.00
0.0174.805.00
Employment per 100 functional unitsSBMI rating
List all employment used to produce construction products during analysis period
Employment per year (days/year)Employment per unit of production
Employment
Type of workNumber of people employed
Person days per month
Person days per year Conversion factor Equivalents
Permanent 3 20 600 600Casuals 7 20 1 400 1 400
Total 2000.002000.00
0.0158.675.00
Employment per 100 functional unitsSBMI rating
List all employment used to produce construction products during analysis period
Employment per year (days/year)Employment per unit of production

Sustainable Building Materials Index Assessment Gauge
08.09.2014 Page 22
14. ENTERPRISES
14.1. Existing performance
14.2. Notes
A. Ash manually loaded on to trucks for transporation to brick making site at the site of defunct power station by casual staff.
B. All other enterprises are all transport or earth moving related.
14.3. Options
A. Improve production and quality control processes to achieve 300,000 compliant products instead of 200,000 compliant products per year.
B. Develop/engage a marketing and business development enterprise to develop market for products.
C. Develop/engage a training and quality control enterprise to improve number of compliant products produced by the site.
14.4. Potential impacts
A. Site supports an additional 1 person day within a marketing enterprise and 1 person day within a training enterprise.
B. Increased efficiency resulting in improved environmental and human development impacts per product.
14.5. Proposed performance
Enterprise employment is reduced as a result of improved efficiency but does not lead to a change in SBMI rating.
Enterprises
Service provided, companyNumber of people employed
Person hours per trip
Total person days per year Conversion factor Equivalents
Ash transportation 1 5 6.9 1 6.88Ash loading 3 9 12.4 1 12.38Clay transportation 1 4 5.0 1 5.00Coal transport 1 2 1.5 1 1.50
25.750.00013
11.335.00
List all employment in directly related enterprises used to produce construction products during analysis period
Employment in related enterprises per year (Person days/year)Enterprise employment per unit of production Enterprise employment per 1000 functional unitsSBMI rating
Enterprises
Service provided, companyNumber of people employed
Person hours per service
Total person days per year Conversion factor Equivalents
Ash transportation 1 5 6.9 1 6.88Ash loading 3 9 12.4 1 12.38Clay transportation 1 4 5.0 1 5.00Coal transport 1 2 1.5 1 1.50Training 1 4 5.0 5.00Quality control 1 4 5 5.00
35.750.00012
10.495.00
Enterprise employment per unit of production Enterprise employment per 1000 functional unitsSBMI rating
List all employment in directly related enterprises used to produce construction products during analysis period
Employment in related enterprises per year (Person days/year)

Sustainable Building Materials Index Assessment Gauge
08.09.2014 Page 23
16. TRAINING
16.1. Existing performance
16.2. Notes
A. No training currently takes place. B. The last training related to brick making was run by Cermalab over 5 years ago.
16.3. Options
A. Practical training, technical manuals and quality control procedures is provided to increase the production of high quality compliant products.
B. Health and safety training provided. C. Life skill training provided. D. Recognise learning through Recognition of Prior Learning (RPL) assessments. E. Access skills training funding from SETA.
16.4. Potential impacts
A. Improve production and quality control processes to achieve 300,000 compliant products instead of 200,000 compliant products per year.
B. Reduced health and safety incidences. C. Reduced absenteeism.
16.5. Proposed performance
Provision of training results in SBMI moving from 0 to 4.
Training
Course Hours attended Number of people Person days Actual days worked Equivalents0 0 0 1 700 0.00
0.000.000.000.00
List all formal training undertaken during analysis period
Formal training, percentage of time worked
SBMI rating
Formal training, percentage of time workedFormal training, percentage of time worked
Training
Course Hours attended Number of people Person days Actual days worked EquivalentsProduction, quality, lifeskills 8 10 100 2 000 5.00
5.005.005.005.00
List all formal training undertaken during analysis period
Formal training, percentage of time worked
SBMI rating
Formal training, percentage of time workedFormal training, percentage of time worked
Sustainable Building Materials Index Assessment Gauge
08.09.2014 Page 24
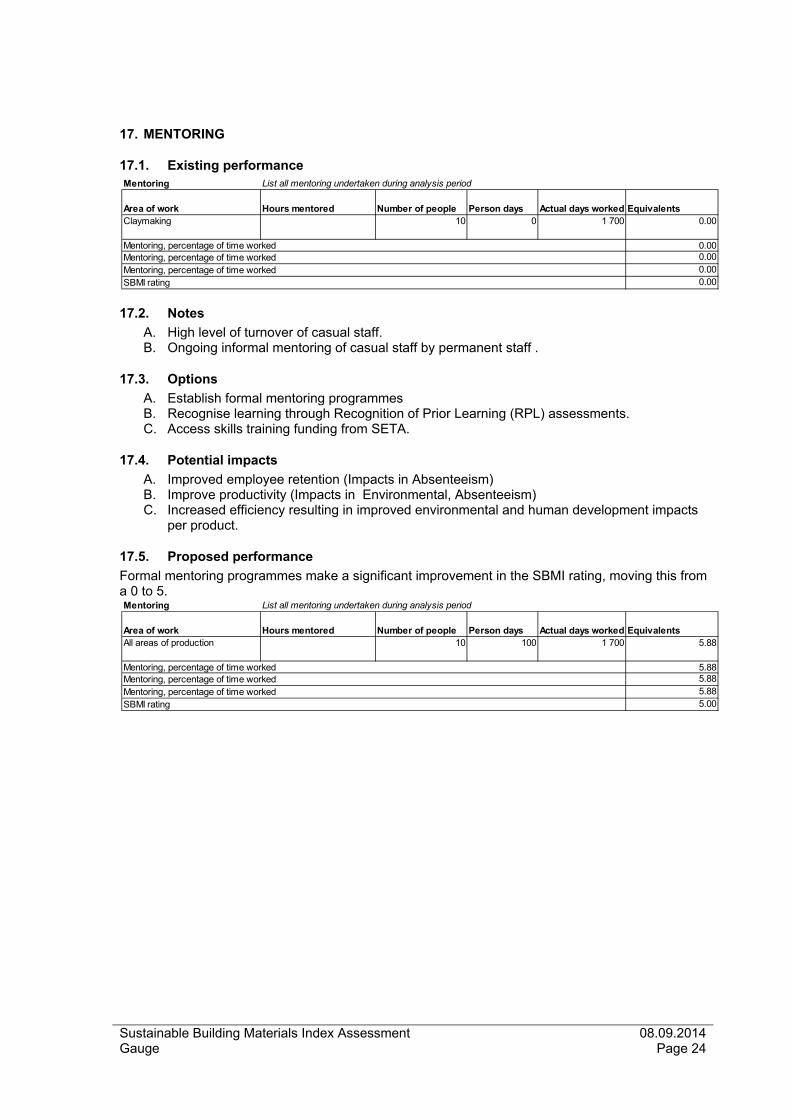
17. MENTORING
17.1. Existing performance
17.2. Notes
A. High level of turnover of casual staff. B. Ongoing informal mentoring of casual staff by permanent staff .
17.3. Options
A. Establish formal mentoring programmes B. Recognise learning through Recognition of Prior Learning (RPL) assessments. C. Access skills training funding from SETA.
17.4. Potential impacts
A. Improved employee retention (Impacts in Absenteeism) B. Improve productivity (Impacts in Environmental, Absenteeism) C. Increased efficiency resulting in improved environmental and human development impacts
per product.
17.5. Proposed performance
Formal mentoring programmes make a significant improvement in the SBMI rating, moving this from a 0 to 5.
Mentoring
Area of work Hours mentored Number of people Person days Actual days worked EquivalentsClaymaking 10 0 1 700 0.00
0.000.000.000.00
List all mentoring undertaken during analysis period
Mentoring, percentage of time workedMentoring, percentage of time workedMentoring, percentage of time workedSBMI rating
Mentoring
Area of work Hours mentored Number of people Person days Actual days worked EquivalentsAll areas of production 10 100 1 700 5.88
5.885.885.885.00
Mentoring, percentage of time workedMentoring, percentage of time workedSBMI rating
List all mentoring undertaken during analysis period
Mentoring, percentage of time worked

Sustainable Building Materials Index Assessment Gauge
08.09.2014 Page 25
18. HEALTH AND SAFETY
18.1. Existing performance
18.2. Notes
A. No record of health and safety incidents kept. B. High level of turnover of casual staff. C. Evidence of brick stacks having collapsed after high winds on the day of the visit.
18.3. Options
A. Introduce health and safety monitoring systems. B. Health and safety training.
18.4. Potential impacts
A. Improved record keeping and understanding of the causes of health and safety incidents. B. Reduced health and safety incidents. C. Improved productivity (Impacts in Environmental, Absenteeism)
18.5. Proposed performance
Implementing effective health and safety monitoring and training systems will enable records to be kept and an SBMI assessment to be made. In ‘SBMI Proposed’ health and safety incidents are estimated at 0.1. This is based on the fact that the industry is relatively dangerous and 70% of the labour on site is casual labour, who despite training, may not follow required health and safety procedures.
Health and safety
Type of injury
Reportable injury and injury requiring 3 days off
Number of employees
Equiv incidents per 100,000 employees Conversion factor Equivalents
0 10 0 1 0
0000
List all health and safety incidents incurred during analysis period
Health and safety incidents per 100,000 employees per year
SBMI rating
Health and safety incidents per 100,000 employees per yearHealth and safety incidents per 100,000 employees per year
Health and safety
Type of injury
Reportable injury and injury requiring 3 days off
Number of employees
Equiv incidents per 100,000 employees Conversion factor Equivalents
0.10 10 1 000 1 1 000
1 0001 0001 000
2
Health and safety incidents per 100,000 employees per yearHealth and safety incidents per 100,000 employees per yearSBMI rating
List all health and safety incidents incurred during analysis period
Health and safety incidents per 100,000 employees per year

Sustainable Building Materials Index Assessment Gauge
08.09.2014 Page 26
19. ABSEENTEEISM
19.1. Existing performance
19.2. Notes
A. High level of turnover of casual staff B. Employees work, on average 17 days a month. Usually workers do not turn up to work on the
Monday after they have been paid. C. The site is open, on average, 10 months a year. For 2 months of the year it is considered too
cold to work.
19.3. Options
A. Incentives to avoid absenteeism, including training and bonus. B. Improving the work environment including training, health and safety procedures. C. Improved health and safety procedures. D. Provision of alternative work during months considered too cold to produce bricks. This could
include stockpiling brick making inputs such as clay and marketing bricks. It could also include construction of buildings or the production of other building products such as door and window frames and lintels.
19.4. Potential impacts
A. Improved employee retention B. Reduced absenteeism.
19.5. Proposed performance
While absenteeism is improved in ‘SBMI Proposed’, the resulting absenteeism resulting from closing the site 2 months of the year, still results in a rate of 8%, which is considered high. This could be improved, if it was possible to provide alternative work during the months considered too cold for brick making (see option D under Options). This however is not reflected as the feasibility of this possibility is unknown.
Employee absenteeism
Type of absenteeism Normal days worked Actual days worked Days absent Level EquivalentsSick leave 240 170 70 1 0.29
0.290.29
29.170.00
List all employee absenteeism experienced during analysis period
Percentage absenteeism per year Percentage absenteeism per year SBMI rating
Percentage absenteeism per year
Employee absenteeism
Type of absenteeism Normal days worked Actual days worked Days absent Level EquivalentsSick leave 240 220 20 1 0.08
0.080.088.331.00SBMI rating
Percentage absenteeism per year Percentage absenteeism per year Percentage absenteeism per year
List all employee absenteeism experienced during analysis period
Sustainable Building Materials Index Assessment Gauge
08.09.2014 Page 27
20. RECOMMENDATIONS
The following recommendations are made.
A. Production processes and quality control: Practical training, technical manuals and quality control procedures should be provided to increase the production of high quality compliant products. This will ensure that 300,000 of the 300,000 annual brick production are compliant instead of this being only 200,000 bricks. As compliant bricks achieve 10% higher prices, income for the site can also be improved. This recommendation has significant environmental impacts, as can been seen from the ‘SBMI Proposed’ graph and report provided in the study.
B. Training and quality assurance enterprise: It is recommended that a training and quality control enterprise is linked to the site. This organisation should be closely associated with the site and may be paid on a retainer or as a % fee of sales. In ‘SBMI Proposed’ this support is estimated at one days support a month. A key target for this enterprise should be to increase the number of compliant products produced by the site (see Recommendation A).
C. Marketing: It is recommended that an appropriate marketing and business development enterprise is linked to the site. This organisation should be closely associated with the site and may be paid on retainer or as a % fee of sales. In the ‘SBMI Proposed’ this support is estimated at one days support a month.
D. Health and safety: Health and safety procedures should be put in place. This should include training and a monitoring system.
E. Absenteeism: Life skill training and incentives to reduce absenteeism and increase productivity should be implemented.
F. Training and mentoring: Funding for training and mentoring programmes should be sought from SETAs. This can be used to fund appropriate local training and quality assurance training (see above) and Recognition of Prior Learning (RPL) processes that are implemented as part of formal mentoring programmes. A key target for the training should be to increase the number of compliant products produced by the site (see Recommendation A).
G. Rainwater harvesting: Rain water harvesting of runoff to onsite tanks or to offsite dams should be investigated. This can help reduce carbon emissions and costs associated with pumping. In ‘SBMI Proposed’ this intervention leads to a reduction in pumping by 50%.
H. Local procurement: Local and provincial governments should be targeted to ensure that they include local products in their specifications and procurement policies as this supports local economic development and aligns with government’s localisation objective.
I. Awareness: A publicity campaign should be developed to ensure that developers, architects, home builders are aware of the products and their positive impacts on the local economy.

Sustainable Building Materials Index Assessment Gauge
08.09.2014 Page 28
21. CONCLUSIONS AND WIDER IMPLICATIONS OF THE STUDY
The study indicates that improved sustainability performance, in terms of the impacts defined by the Sustainable Building Material Index methodology, can be achieved on this site. This improvement will be achieved by implementing some, or all, of the recommendations provided. The study can also be used to outline the type of support government, and other interested parties, could play a role in supporting improved sustainability performance of informal brick making sites in the Eastern Cape. This is outlined below.
I. High quality local production and service: Targeted production training and quality assurance procedures could be implemented within the informal sector in order to improve efficiency and quality and enable products to access a wider market.
J. Marketing and training franchise models: Marketing and training franchise models could be developed. These would have a direct interest in promoting local products and in ensuring that these were of high quality. Innovative financial models for this service could be used to ensure that this service was sustainable. This could include payment in the form of retainer or as a % fee of sales.
K. Life skills training and information: Practical life skills training which included financial management and health awareness could be provided to improve worker financial management and health. This could support productivity, entrepreneurship and reduce the burden on government health services.
L. Productivity campaign: A campaign to increase worker productivity could be developed with relevant business associations and other bodies. This could include incentives such as a ‘five for five’ incentive, where a 5% wage bonus is paid for achieving under 5% absenteeism.
M. Production clubs: Production associations or clubs could be explored to achieve benefits for members in the form of reduced costs associated with bulk purchases and coordinated transportation services.
N. Training and mentoring funding: Formalised training and mentoring programmes could be developed using SETA funding. This could be developed by municipal economic development departments in partnership with local trainers such as TVET colleges.
O. Small Enterprise Local Product (SLEP) label: A local production label could be developed and supported by a ‘local is lekker’ awareness campaign. This aligns and support government’s localisation objective (Department of Trade and Industry, 2013).
P. Government procurement: Provincial and municipal procurement policy and specifications could be developed to integrate requirement for SLEP products in government construction projects.

Sustainable Building Materials Index Assessment Gauge
08.09.2014 Page 29
22. SBMI EXISTING
SUSTAINABLE BUILDING MATERIAL INDEX (SBMI) V2
Site address Thabisile site, Dukathole, Alliwall NorthAnalysis period 31 July 2014 - 1 August 2014Analysis period (days) 365
Overall 1.92
Ecological
Pollution
Human Development
Employee absenteeism
222
250
43
Employment Enterprise employmentTraining
Resource consumption Carbon emissions Water consumption
Land useWaste
Human development
Ecological
0000
2.17
1.67
MentoringHealth and safety
0
1
2
3
4
5Resource consumption
Carbon emissions
Water consumption
Land use
Waste
Pollution
Employment
Enterprise
Training
Mentoring
Health and safety
Absenteeism

Sustainable Building Materials Index Assessment Gauge
08.09.2014 Page 30
23. SBMI PROPOSED
SUSTAINABLE BUILDING MATERIAL INDEX (SBMI) V2
Site address Thabisile site, Dukathole, Alliwall NorthAnalysis period 31 July 2014 - 1 August 2014Analysis period (days) 365
Overall
Human development
Ecological
5521
3.00
3.83
MentoringHealth and safety
Resource consumption Carbon emissions Water consumption
Land useWaste
3.42
Ecological
Pollution
Human Development
Employee absenteeism
333
450
43
Employment Enterprise employmentTraining
0
1
2
3
4
5Resource consumption
Carbon emissions
Water consumption
Land use
Waste
Pollution
Employment
Enterprise
Training
Mentoring
Health and safety
Absenteeism

Sustainable Building Materials Index Assessment Gauge
08.09.2014 Page 31
24. REFERENCES
Department of Trade and Industry, 2013, Industrial Policy Action Plan Economic Sectors and Employment Cluster IPAP 2013/14 – 2015/16 Gauge 2014, Proposal to Swisscontact 24.06.2014 (Communication) Google, 2014. http://maps.google.co.za/maps

Sustainable Building Materials Index Assessment Gauge
08.09.2014 Page 32
25. APPENDIX A: E CAPE SBMI PRESENTATION


