Sustainable Brand Perception vs. Performance: Reducing the Gap - Katie Cox
14
Sustainable Brands London Conference Sustainable Brand Perception vs. Performance: Reducing the Gap Kate Cox, Head of Strategy, MPG Media Contacts, Havas Media
-
Upload
sustainable-brands -
Category
Documents
-
view
161 -
download
0
Transcript of Sustainable Brand Perception vs. Performance: Reducing the Gap - Katie Cox

Sustainable Brands London Conference
Sustainable Brand Perception vs. Performance: Reducing the Gap ¡ Kate Cox, Head of Strategy, MPG Media Contacts,
Havas Media

Sustainable Brand Perception versus Performance: Reducing the Gap 27th November 2012
Havas Media: Meaningful Brands for a Sustainable Future
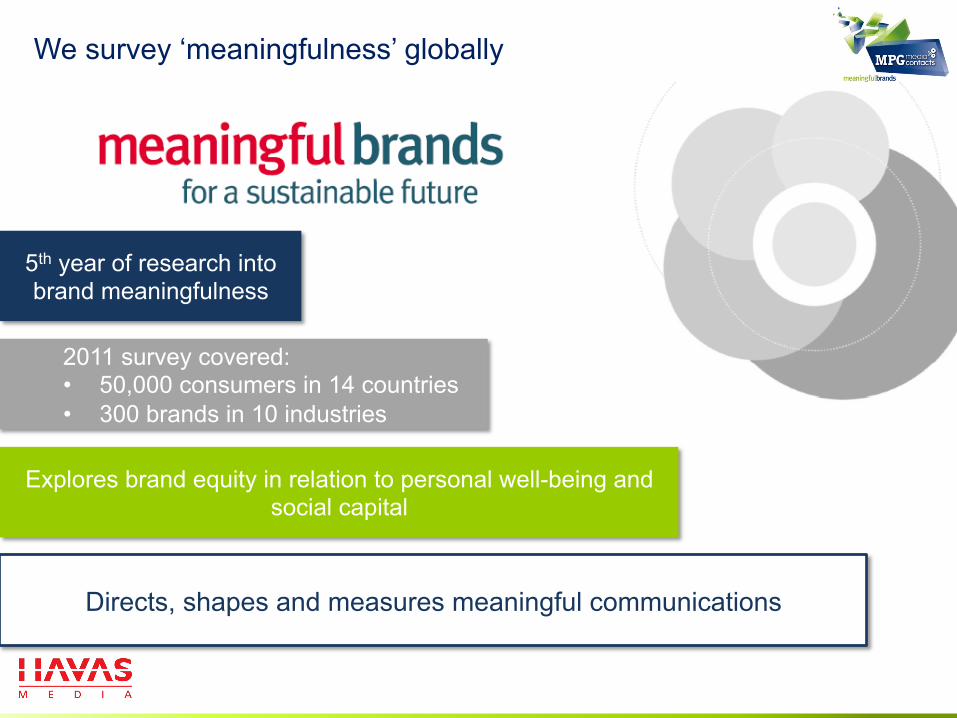
5th year of research into brand meaningfulness
2011 survey covered: • 50,000 consumers in 14 countries • 300 brands in 10 industries
Explores brand equity in relation to personal well-being and social capital
Directs, shapes and measures meaningful communications
We survey ‘meaningfulness’ globally

“WOULD YOU CARE IF THIS BRAND CEASED TO EXIST?”
“DOES THIS BRAND IMPROVE YOUR QUALITY OF LIFE?”
CAN WE MEASURE ‘MEANINGFULNESS’?

Meaningful Brand Index
Consumer Perception of ‘Being a Better Business’ and ‘Personal Value’ combined into one metric
Personal Outcomes Collective Outcomes
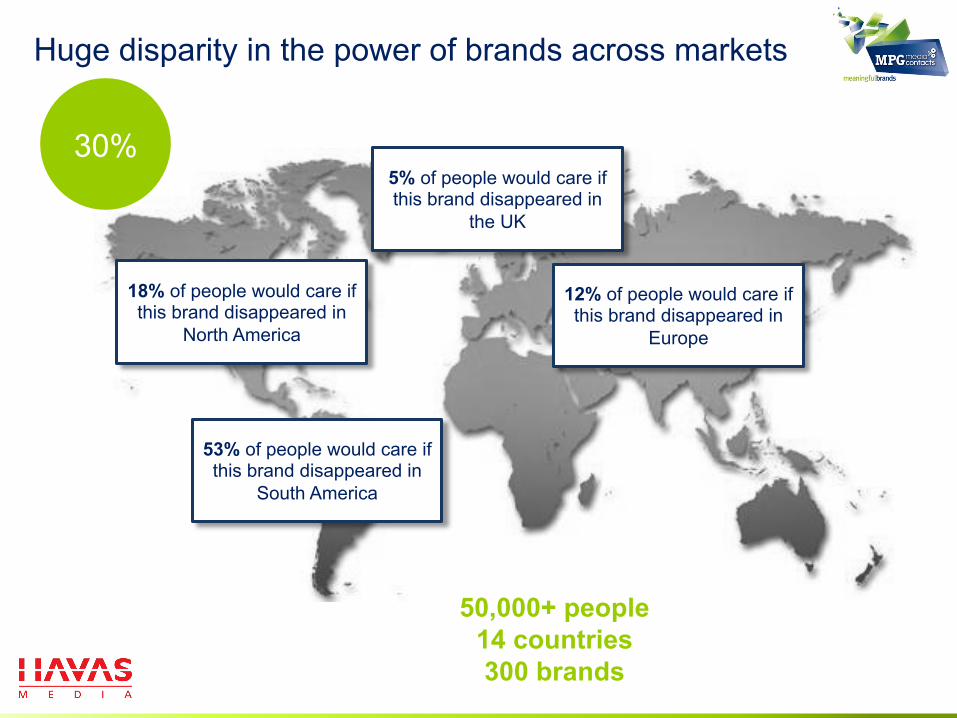
Huge disparity in the power of brands across markets
53% of people would care if this brand disappeared in
South America
18% of people would care if this brand disappeared in
North America
12% of people would care if this brand disappeared in
Europe
5% of people would care if this brand disappeared in
the UK
30%
50,000+ people 14 countries 300 brands

Always + Often
2011 2010
55% 47%
72% -
72% 68%
71% 69%
69% 45%
68% 69%
67% -
66% -
59% 63%
49% 46%
43% 43%
36% 34%
36% 35%
28% 28%
Developing and Developed Markets
Increase/decrease of at least 3% since 2010 Q5t. How often do you consider environmental, social or ethical aspects when making purchase decisions / when you go shopping?
12
21 17 17 18
23 13
19 13 9
5 5 4 3
43
51 55 54 51 45
54 47
46 40
38 31 32
25
32
23 25
24 25 27
26 26
32 36
39 39 43
43
10
5 3
4 5 4 6 7 7
13 15
19 17
23
2
1
1 1
1 1 1 2 3
6 4
6
Global
Chile China
Mexico Colombia
India Italy
Argentina Brazil Spain
France USA
Germany UK
Always Often
All Countries, 2010–2011

Why Responsible Products/Services not Chosen More Frequently?
All countries, Top Three Reasons Given, Total Mentions, 2011
Subsample: those answering “Often,” “Sometimes,” “Rarely,” or “Never” at Q5 Q6t. Why do you not choose socially/environmentally responsible products or services more frequently? Please choose up to three reasons.
Informa(on: “From the informa/on available, it is difficult to understand if a par/cular product is more responsible than another” Expense: “They are more expensive” Availability: “In my area they are not broadly available” Impact: “I think that my individual effort does/will not have a big impact” Credibility: “I do not believe what the company/product says about its environmental and social responsibility” Interest: “I am not interested in socially/environmentally responsible products”

Marketing saturation driving corporate cynicism?
Global average
Chile China
Mexico Colombia
India
Italy
Argentina
Brazil
Spain France
USA
Germany
UK
0.0%
0.2%
0.4%
0.6%
0.8%
1.0%
1.2%
20 30 40 50 60 70 80
Adv
ertis
ing
spen
d as
a p
ropo
rtio
n of
GD
P
% of people who always/often consider Environmental/Social/Ethical aspects when making purchasing decisions
Correlation = -0.51
Developed economies Developing economies
Source: MBI & Z Global Forecasts

And economic growth concerns in developed markets?
Global average Chile
China
Mexico
Colombia
India
Italy
Argentina
Brazil
Spain
France
USA
Germany
UK
-2%
0%
2%
4%
6%
8%
10%
12%
14%
16%
18%
20 30 40 50 60 70 80
GD
P gr
owth
% of people who always/often consider Environmental/Social/Ethical aspects when making purchasing decisions
Correlation = 0.59
Developed economies
Developing economies
Source: MBI & Z Global Forecasts

Insight + Implications for developed markets
People’s start point for corporate communications in the developed markets is cynicism. If the company’s motivation is not clear, the message will be treated with suspicion.
Transparency is key – there is a specific need in developed markets to put the short term business reason for commencing any marketing activity around Sustainability at the forefront of the messaging to combat cynicism
Implication
Insight
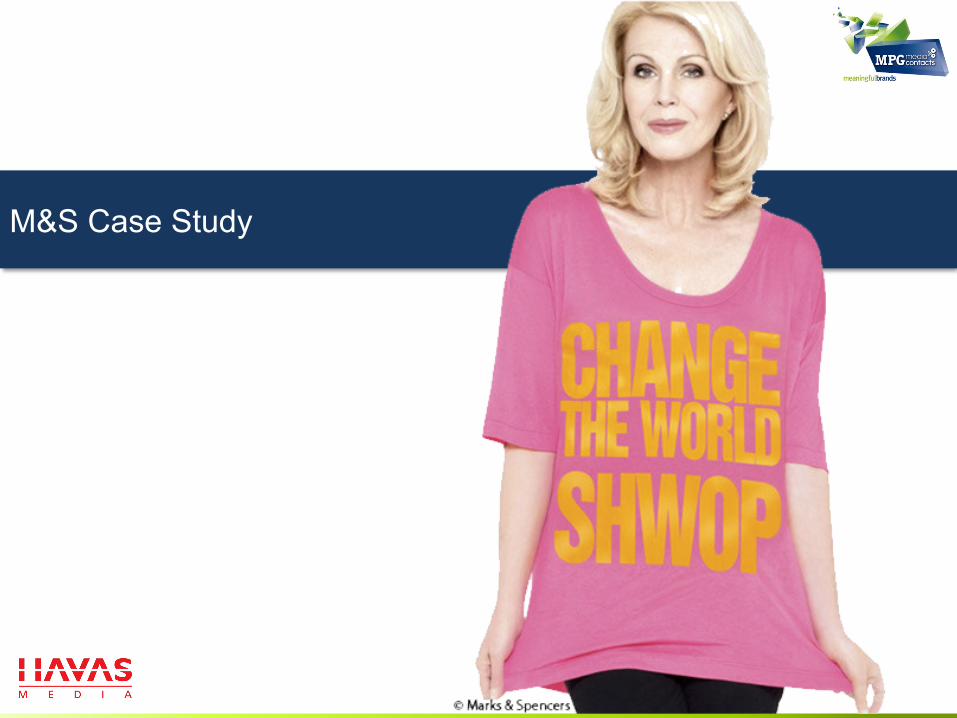
M&S Case Study

Thank you!