Sustainable Bio-resources for Global Welfare
159
i PROCEEDING 3rd GEN Network and 4th Rispescia International Seminar Sustainable Bio-resources for Global Welfare Joinly Organized by: Universitas Gadjah Mada, INDONESIA and Ehime University, JAPAN and RISPESCIA Indonesia Supply Chain Research and Development
Transcript of Sustainable Bio-resources for Global Welfare

i
PROCEEDING 3rd GEN Network and 4th Rispescia International Seminar
Sustainable Bio-resources for Global Welfare
Joinly Organized by: Universitas Gadjah Mada, INDONESIA and Ehime University, JAPAN and RISPESCIA Indonesia Supply Chain Research and Development

ii
PROCEEDING 3rd GEN Network and 4th Rispescia International Seminar
Sustainable Bio-resources for Global Welfare
Editors : Prof. NINOMIYA Ikuo (Ehime University, Japan) Prof. SUGAHARA Tatsuo (Ehime University, Japan) Prof. HIROKI Oue (Ehime University, Japan) Prof. NAKAYASU Akira (Ehime University, Japan) Prof. HARADA Ueno (Ehime University, Japan) Prof. Sri Rahardjo (Universitas Gadjah Mada, Indonesia) Dr. Adi Djoko Guritno (Universitas Gadjah Mada, Indonesia) Prof. Suwido Limin (Universitas Palangkaraya, Indonesia)
First published in 2012 by: Department of Agroindustrial Technology Faculty of Agricultural Technology Universitas Gadjah Mada INDONESIA Cover design and layout : Galih Kusuma Aji

iii
Preface Entering its third year, Gadjah Mada – Ehime Universities Network (GEN
Network) and collaboration with RISPESCIA held annual seminar entitled BIO-RESOURCES SUSTAINABLE FOR GLOBAL WELFARE in August 2010, Bali, Indonesia. While it w as a large task, editing the P roceedings of 3rd GEN and 4th RISPESICA Seminar has been a privilege for us.
Many people have been involved in the production of these Proceedings,
started in December 2009 with the launching of GEN Seminar web to provide a portal for paper submission. This was prepared in accordance with some related topics covered as parallel discussion classes which was organized by an eligible moderator who conducted also as a reviewer. Those topics including (1) Forest Carbon Budgeting for REDD; (2) Functinal Food; (3) Molecular Genetic of Topical Rain Forest; (4) Plant Factory; (5) Biodiversity and Natural History Museum; (6) Hydrilogical Issues Under Global Warming; (7) Zeolite Chemistry and Its Industrial Application; (8) Supply Chain in Practices; (9) General Topics.
The seminar theme : BIO-RESOURCES SUSTAINABLE FOR GLOBAL WELFARE has interest and appeal to some people with different fields such as forestry, chemistry, hydrology, operations management, and in collaboration with some industrial practitioners who willing to share in opening season. These participants represent 7 c ountries form all parts of the world and from a variety of academic backgrounds and interests. We are proud to have been the vehicle for this seminar to run succesfully.
We hope that the papers contained in these Proceedings will prove helpful toward those concerned in relevant topics.
Yogyakarta, Januari 2012
Head of Programme and Proceeding

iv
Content
COVER .......................................................................................................................... i
PREFACE ...................................................................................................................... iii
CONTENT ..................................................................................................................... iv
THE LIST OF SPECIES OF THE FAMILY HYDROPHILIDAE AND ITS RELATED FAMILIES IN INDONESIA Ahmad Taufiq Arminudin ........................................................................................... 1 EL NINO AND LA NINA CLIMATE ANOMALY IMPACT ON M AIZE PRODUCTION AND SUPPLY IN JAVA Arini Wahyu Utami ..................................................................................................... 17 THE CAPABILITIES OF Fusarium sp. F092 ON C HRYSENE AND C RUDE OIL DEGRADATION UNDER SALINE CONDITION Asep Hidayat ............................................................................................................... 24 SILVICULTURE OF COMMUNITY FOREST FOR ADAPTATION OF GLOBAL-ENVIRONMENT ISSUES: BETWEEN PRODUCTIVITY, CONSERVATION AND PEOPLE PROSPERITY Budiadi ....................................................................................................................... 30 DESIGN OF A S USTAINABLE GREENHOUSE STRUCTURE FOR THE TROPICAL REGIONS: APPLYING COMPUTATIONAL FLUID DYNAMICS METHODS Erizal ........................................................................................................................... 38
THERMAL DECOMPOSITION OF VOCs CATALYZED BY OXIDES-ZEOLITES NANOCOMPOSITES SYNTHESIZED FROM INDUSTRIAL BY-PRODUCTS Erni Johan ................................................................................................................... 44 MOLECULAR VARIATION OF SOME ENDANGERED SPECIES IN INDONESIA Henti Hendalastuti Rachmat ......................................................................................... 51 THE ROLE OF KENYA FORESTRY RESEARCH INSTITUTE IN REDD+ PROJECTS Kigomo J.N................................................................................................................... 57
THE INFLUENCE OF IMPLEMENTING TOTAL QUALITY MANAGEMENT TOWARDS INNOVATION PERFORMANCE Meirani Harsasi. ........................................................................................................... 62

v
A FRAMEWORK OF PERFORMANCE MEASUREMENT SYSTEM TO MEASURE THE SUSTAINABILITY OF FURNITURE PRODUCTION IN SMALL-MEDIUM ENTERPRISES (SMEs) Muh. Hisjam . ............................................................................................................... 72 THE UTILIZATION OF RARE SUGARS (8 KINDS OF KETOHEXOSES) TO CHICKEN SAUSAGE MAKING Mulyana Hadipernata . ................................................................................................. 79 ABSTRACT SUCCUS BASE PRODUCT IN COUGH MEDICINE COMPETITION Francis Wanandi .......................................................................................................... 86 SUSTAINABLE MINING OPERATIONS AT PT TIMAH (PERSERO) TBK INDONESIA: A HARMONIZATION AMONG STAKEHOLDERS Wachid Usman ............................................................................................................ 87 MICROEMULSION AS DELIVERY SYSTEM FOR ANTIOXIDANT AND OTHER FUNCTIONAL COMPONENT OF FOOD Sri Raharjo ................................................................................................................... 88 INTENSIFIED TREE PLANTING ON THE LOGGED-OVER FORESTS IN KALIMANTAN TO PROVIDE MEANS FOR REDD+ IMPLEMENTATON: LESONS-LEARNED AND ROADMAP OF SILIN PROGRAM Muhammad Naiem ..................................................................................................... 89 BIO-CONSERVATION OF FLORA AND FAUNA AT FIRST FOREST FLOOR AS SECOND SEED DISPERSER IN PAHMUNGAN VILLAGE, KRUI, WEST LAMPUNG Bainah Sari Dewi ......................................................................................................... 90 Forest Carbon Budgeting for REDD
FOREST CARBON BUDGETING FOR REDD TO COUNTER CLIMATE CHANGE T. Sweda ...................................................................................................................... 92 ISSUES IN AND SOLUTIONS FOR FOREST CARBON BUDGETING IN LAOS .... Vichith Bounpheng ....................................................................................................... 93 TOWARD GOOD PEATLAND GOVERNANCE: CHALLENGES IN ACCOUNTING OF CARBON IN TROPICAL PEATLAND Oka Karyanto................................................................................................................ 94
ISSUES AND CHALLENGES IN IMPLEMENTING REDD SCHEME IN PARAGUAY H. Silva Imas . .............................................................................................................. 95
vi
PROCESS FOR ESTABLISHING REDD BASELINES IN VIETNAM Truong Tat Do. ............................................................................................................. 96 ESTIMATION OF BELOWGROUND BIOMASS AND CARBON STOCK IN SECONDARY FORESTS AND RUBBER AGROFORESTS IN JAMBI, CENTRAL SUMATRA S. Hardiwinoto. ............................................................................................................. 97 COULD WE EXPAND FORESTS AREAS IN INDONESIA ?: LESSONS LEARNED FROM C OMMUNITY FORESTS DYNAMICS IN AC ROSS JAVA WITHIN THE LAST 20 YEARS AS REVEALED BY SATELLITE IMAGERIES Wahyu Wardhana ......................................................................................................... 98 STAND STRUCTURE AND S PECIES COMPOSITION IN RELATION TO CARBON BUDGETING MAU FOREST, KENYA Awino Chrispine Ochieng ............................................................................................ 99 LAND-COVER CLASSIFICATION OF DEGRADED PEAT SWAMP FOREST USING AIRBORNE LASER PROFILING Yoshiko Maeda ............................................................................................................. 100 ESTABLISHMENT OF NATONAL FOREST DATABASE FOR REDD IN VIETNAM Msc. Pham Duc Cuong ............................................................................................... 101 PRESENT STATUS OF REDD-RELATED PROJECTS IN PNG Bruno. Kuroh .............................................................................................................. 102
PROCESS FOR ESTABLISHING REDD BASELINE IN LAOS Khamdy Linthong ......................................................................................................... 103 Functional Food EVALUATION OF FOOD FUNCTIONS BY ANIMAL CEL CULTURE AND EXPERIMENTAL ANIMALS Takuya Sugahara .......................................................................................................... 105 ALLERGY SUPPRESSION ACTIVITY OF GREEN CRAB EXTRACTS Kota Kanda. .................................................................................................................. 106
IMMUNOGLOBULIN PRODUCTION STIMULATING FACTORS IN CITRUS PEEL Ayako Muranaka. ......................................................................................................... 107
PREBIOTIC EFFECT OF ARROWROOT AND SWEET POTATO Eni Harmayani . ............................................................................................................ 108

vii
IMMUNOMODULATORY EFFECT OF INDIGENOUS PROBIOTIC : IN VITRO AND IN VIVO STUDIES Lily Arsanti Lestari....................................................................................................... 109 THE EFFECT OF ARROWROOT (Maranta arundinacea) ON IMMUNOSTIMULATION RESPON in vitro, SCFA AND PHYSICO-CHEMICAL PROPERTIES OF RATS COLON Ika Dyah Kumalasari .................................................................................................... 110 Molecular Genetics of Tropical Rain Forest CHLOROPLAST DNA POLYMORPHSIM IN THE LOCAL POPULATIONS SERAYA (Shorea curtisii Dyer) Ko Harada ..................................................................................................................... 112 ANTIOXIDANT POTENTIAL OF INDONESIAN MEDICINAL PLANTS GROWING IN EAST KALIMANTAN Irawan Wijaya Kusuma ............................................................................................... 113 SHOREA PROJECT: A COLLABORATIVE RESEARCH ON GE NETIC VARIATION OF SHOREA SPP IN INDONESIA I.Z. Siregar, ................................................................................................................. 114
CHLOROPLAST DNA VARIATION OF Shorea leprosula, MIQ IN BORNEO DETECTED BY MICROSATELLITE MARKERS Zulfahmi ...................................................................................................................... 115 Plant Factory EARLY DETECTION OF DROUGHT STRESS IN TOMATO PLANTS WITH CHLOROPHYLL FLUORESCENCE IMAGING SYSTEM IN GREENHOUSE Kotaro Takayama ........................................................................................................ 117 UNFAVORABLE EFFECTS OF TROPICAL ENVIRONMENTS ON M ELON (Cucumis melo) FRUIT QUALITY IN THE SIMPLE GREENHOUSE Mohammad Affan Fajar Falah. .................................................................................... 118
A CONCEPT OF CUSTOMIZABLE AGRICULTURAL PRODUCT: KANSEI ENGINEERING APPROACH TO PLANT FACTORY Mirwan Ushada . .......................................................................................................... 119
SIMULATION STUDY OF TROPICAL GREENHOUSE ENVIRONMENTS UNDER SEVERAL SCENARIOS Yayu Romdhonah. ........................................................................................................ 120
viii
THE SUPERVISED MULTI-AGENT SYSTEMS F OR A LARGE SCALE GREENHOUSE-BASED CROP INDUSTRY Kudang B. Seminar. ..................................................................................................... 121 ESTIMATION OF FIRMNESS, SOLUBLE SOLIDS CONTENT, AND ACIDITY OF DRAGON FRUIT (Hylocereus undatus) BASED ON FRUIT COLOR Nafis Khuriyati ............................................................................................................. 122 MASS TRANSFER DURING DRYING OF PADDY US ING DIRECT SUN DRYING Hanim Z. Amanah ........................................................................................................ 123 INTERMITTEN IRRIGATION WITH AUTOMATIC FUZZY TIMER CONTROL Satyanto K.Saptomo ..................................................................................................... 124 Biodiversity and Natural History Museum BIODIVERSITY AND INSECT COLLECTIONS IN FOUR INSTITUTES Hiroyuki Yoshitomi .................................................................................................... 126 ALTITUDINAL GRADIENTS IN TROPICAL ICHNEUMONID SPECIES-RICHNESS IN NORTHERN SULAWESI, INDONESIA Keizo TAKASUKA ..................................................................................................... 127 Hydrological Issues under Global Warming
AVERAGE AREA RAINFALL CALCULATION IN KUROSE DAM CATCHMENT AREA Sanz Grifrio Limin ....................................................................................................... 129 A STUDY ON THE MECHANISM OF CATASTROPIC EARTH DAM FAILURE USING HIDRO-GEOTECHNICAL APPROACH Teuku Faisal Fathani ................................................................................................... 130 EVALUATIONS THE ACCURACY OF CMORPH OUTPUT FOR RAINFALL DATA INTERPOLATION IN INDONESIA Diva Oktavariani. ......................................................................................................... 131
RELATIONSHIP OF MICROCLIMATE, SOIL ORGANIC CARBON AND C O2 EMMISIONS FROM SOIL SURFACE AT DIFFERENT CANOPY COVER IN PALU, CENTRAL SULAWESI, INDONESIA Ade Irawan. .................................................................................................................. 132
ANALYSIS OF LANDUSE CHANGE TO SURFACE RUN OFF AND WATER DEMAND AT CIMANUK WATERSHED Sisi Febriyanti Muin . ................................................................................................... 133 AGRO-ECOLOGICAL FACTORS THAT INFLUENCE THE JATROPHA GROWTH M. Nurcholis . ............................................................................................................... 134

ix
PHENOMENON OF THE INCREASING SEA LEVELS AS INDICATION OF GLOBAL WARMING Nia Trikusuma Ningrum............................................................................................... 135 General Topics LAND USE CONVERSION OF AGRICULTURE AND EFFECTS ON MEAT SELF SUFFICIENCY PROGRAM IMPLEMENTATION IN INDONESIA Siti Andarwati ............................................................................................................... 137 CANOPY STRUCTURE AND FORAGE QUALITY OF THE DWARF AND NORMAL NAPIERGRASSES FOLLOWING TWO YEARS AFTER ESTABLISHMENT Muhammad Mukhtar ................................................................................................... 138 THE CONTRIBUTION OF EHIME UNIVERSITY IN THE INDONESIAN’S BIODIVERSITY HOTSPOT: WALLACEA REGION Atus Syahbudin .......................................................................................................... 139 Supply Chain in Practices BARRIERS OF SUSTAINABILITY OF EMERGING MANGOSTEEN SUPPLY CHAIN Retno Astuti ................................................................................................................ 141
INFLUENCE OF PARTNERS’ TRUST LEVEL, PARTNERING SUCCESS LEVEL WITH BENEFITS OF PARTNERSHIP ON CONSTRUCTION PROJECTS IN THE PROVINCE MALUKU Fransiska Natalia Ralahallo ......................................................................................... 142 INFORMATION TECHNOLOGY, RELATIONSHIP COMMITMENT AND CONFLICT ON REVERSE LOGISTICS Arstiani Yulianti .......................................................................................................... 143 REALITY CHALLENGES SUPPLY CHAINS’ DYNAMIC IN SUPPORTING SALES STRATEGY Titiek Sri Hendarti . ...................................................................................................... 144
THE MECHANISM OF VEGETABLES TRADING BETWEEN PRODUCER AND SUPERMARKET THAT CAPABLE TO COORDINATE THE SUPPLY CHAIN Henry Yuliando ........................................................................................................... . 145 Zeolite Chemistry and Its Industrial Application
IMPROVEMENT OF PLANT PRODUCTION AND S OIL QUALITY BY RECYCLING BIOLOGICAL WASTES IN LOCAL AREA FOR SUSTAINABLE AGRICULTURE Hideto UENO . ............................................................................................................. 147

x
UTILIZATION OF NATURAL ZEOLITE AS BIOFERTILIZER CARRIER AND ITS EFFECT ON RICE GROWTH Eko Hanudin. ................................................................................................................ 148 DYNAMIC SIMULATION OF THE EFFECT OF GLOBAL CLIMATE CHANGE ON THE NATIONAL FOOD STOCK Agus Supriatna Somantri ............................................................................................. 149
THE LIST OF SPECIES OF THE FAMILY HYDROPHILIDAE AND ITS RELATED FAMILIES IN INDONESIA
Ahmad Taufiq Arminudin*
Faculty of Agriculture and Animal Science, State Islamic University of Sultan Syarif Kasim, Riau, Indonesia
Jl. H.R. Soebratas KM 15 Simpang Baru Panam Pekanbaru Riau Indonesia 28293 *E-mail: [email protected], [email protected]
and
Hiroyuki Yoshitomi
Entomological Laboratory, Faculty of Agriculture, Ehime University, Matsuyama, Japan Tarumi 3-5-7, Matsuyama, 790-8566 JAPAN
ABSTRACT
The species of the family Hydrophilidae and its related families (Hydrochidae,
Georissidae and Spherchidae) in Indonesia are listed on t he basis of the bibliographical recearch. Up to the present 263 s pecies including subspecies under 4 f amilies, 3 subfamilies, 10 t ribes, 48 genera are recorded from Indonesia Archipelago. The highest number of the species lives in both of Sumatra and West Papua. Keywords: Hydrophilidae, Hydrochidae, Georissidae, Spherchidae, List, Distribution, Indonesia
INTRODUCTION
Hydrophilidae including its related families (= Hydrophiloidea, sensu Hansen 1991) are mainly aquatic, except for subfamily Sphaeridiinae which is secondary evoluted to terrestrial (Bernhard et al. 2006).
There is no c omprehensive study and Indonesian recearcher about Indonesian hydrophilid species, moreover, how many species live in Indonesia Archipelago have no updated today.
In the present paper, we list up the Indonesian hydrophilid species on t he basis of the world catalogue (Hansen 1999) and its supplementary lists and recent studies (Short & Hebauer 2006, Short 2007, Hebauer 2007a, b, Komarek & Beutel 2007).
LIST
Family Hydrophilidae Latreille, 1802
Subfamily Horelophopsinae Hansen, 1997 Genus Horelophopsis Hansen, 1997
3rd GEN Network and 4th Rispescia International Seminar Sustainable Bio-resources for Global Welfare
1
H. avita Hansen, 1997 Distribution: Indonesia (West Papua).
Subfamily Hydrophilinae Latreille, 1802
Tribe Berosini Mulsant, 1844 Genus Berosus Leach, 1817
Subgenus B. (Enoplurus) Hope, 1838 B. (E.) elongatulus Jordan, 1894
Distribution: Indonesia (Ambon, Bali, Borneo, Java, Lombok, Nias, Siberut, Sulawesi, Sumatra, Timor), Malaysia (Peninsula, Sabah, Sarawak), China (Fujian, Hong Kong), Sri Lanka, Taiwan, Thailand, Vietnam, Afghanistan, Japan , B enin, Chad, Gambia, Ghana, Guinea, Bissau, Senegal.
B. (E.) fairmairei Zaitzev, 1908 Distribution: Indonesia (Java, Nias, Siberut, Sumatra, Sumba), Andaman Is., Bangladesh, Myanmar, China (Fujian, Guangdong, Hainan, Hong Kong, Yunnan, Henan, Tianjin), India (Delhi, Kerala, Rajasthan), Malaysia (Sabah), Nepal, Philippines, Thailand, Vietnam, Pakistan, Japan.
B. (E.) incretus d’Orchymont, 1937 Distribution: Indonesia (Sulawesi, Sumatra), Myanmar, China (Hong Kong, Macao, Yunnan), India (Maharashtra, Uttar Pradesh), Laos, Malaysia (Peninsula), Nepal, Philippines, Taiwan, Thailand, Vietnam, Japan.
Subgenus B. (s. str.) Leach, 1817
B. (s. str.) nigropictus Regimbart, 1903
Distribution: Indonesia (Java), Myanmar, Laos, Malaysia (Peninsula), Vietnam.
B. (s. str.) pulchellus Macleay, 1825 Distribution: Indonesia (Bali, Borneo, Java, Lombok, Nias, Seram, Sulawesi, Sumba, Sumbawa, Sumatra), China (Fujian, Guangdong, Hainan, Hong Kong, Yunnan, Zhejiang, Hubei, Jiangsu), Iran, Japan, Saudi Arabia (south), Andaman Is., Bangladesh, Myanmar, India (Haryana, Karnata, Kerala, Maharashtra, Punjab, Rajasthan, Tamil Nadu, Uttar Pradesh, West Bengal), Laos, Malaysia (Sabah), Nepal, Philippines, Sri Lanka, Taiwan, Thailand, Vietnam, Australia (Queensland).
Genus Regimbartia Zaitzev, 1908
R. attenuata (Fabricius, 1801) Distribution: Indonesia (Java, Sumatra, Sumbawa, Sunda), Myanmar, Cambodia, China (Fujian, Guangdong, Yunnan, Jiangsu), India, Malaysia, Philippines, Sri Lanka, Taiwan, Thailand, Vietnam, Australia (New South Wales, Northern Territory, Queensland, South Australia, Western Australia), New Guinea, Afghanistan, Japan, “Kurdistan”, Pakistan, South Korea, Oman, Yemen.
R. sumatrensis d’Orchymont, 1941 Distribution: Indonesia (Sumatra).
Genus Allocotocerus Kraatz, 1883
A. muelleri (Kirsch, 1875)
3rd GEN Network and 4th Rispescia International Seminar Sustainable Bio-resources for Global Welfare
2
Distribution: Indonesia (Sumatra), Malaysia (Peninsula).
Tribe Chaetarthriini Bedel, 1881
Genus Chaetarthria Stephens, 1835 C. almorana Knisch, 1924
Distribution: Indonesia (Sumatra), Myanmar, India (Uttar Pradesh), Malaysia (Peninsula, Sarawak), Thailand, Vietnam.
C. indica d’Orchymont, 1920 Distribution: Indonesia (Borneo, Java, Sumatra), China (Guangxi, Hong Kong), India, Malaysia (Peninsula, Sarawak), Nepal, Philippines, Thailand.
C. malickyi Hebauer, 1995 Distribution: Indonesia (Bali, Sumatra), Malaysia (Peninsula), Thailand.
C. saundersi d’Orchymont, 1923 Distribution: Indonesia (Borneo, Sumatra), Malaysia (Peninsula), Bangladesh, Nepal, Singapore, Thailand, Vietnam.
Genus Amphiops Erichson, 1843
A. coomani d’Orchymont, 1926 Distribution: Indonesia (Java, Sumatra), Vietnam.
A. mater ssp. pedestris Sharp, 1890 Distribution: Indonesia (Sumatra), China (Guangdong), India (Tamil Nadu), Sri Lanka.
A. mater ssp. sumatrensis Regimbart, 1903
Distribution: Indonesia (Sumatra), Malaysia (Peninsula).
A. mirabilis Sharp, 1890 Distribution: Indonesia (Java), Myanmar, Sri Lanka, China (Shandong).
Tribe Anacaenini Hansen, 1991
Genus Paracymus Thomson, 1867 P. blandus Wooldridge, 1976
Distribution: Indonesia (West Papua). P. generosus Wooldridge, 1977
Distribution: Indonesia (Bali). P. orientalis d’Orchymont, 1925
Distribution: Indonesia (Bali), China (Fujian), Philippines, Vietnam, Japan.
P. pacatus Wooldridge, 1976 Distribution: Indonesia (West Papua).
P. simulatus Wooldridge, 1976 Distribution: Indonesia (Sulawesi), New Guinea.
Genus Anacaena Thomson, 1859
A. balkei (Gentili, 1993) Distribution: Indonesia (West Papua).
A. colorata (Gentili, 1996) Distribution: Indonesia (West Papua).
A. conexa (Gentili, 1996) Distribution: Indonesia (West Papua).
A. lineata (Gentili, 1996) Distribution: Indonesia (West Papua).
A. lucida (Gentili, 1996) Distribution: Indonesia (West Papua).
A. mista d’Orchymont, 1932 Distribution: Indonesia (Java, Sumatra).
A. modesta d’Orchymont, 1932 Distribution: Indonesia (Java).
A. obscura (Gentili, 1996) Distribution: Indonesia (West Papua).
3rd GEN Network and 4th Rispescia International Seminar Sustainable Bio-resources for Global Welfare
3
A. personata (Gentili, 1996) Distribution: Indonesia (West Papua).
A. pilosa (Gentili, 1996) Distribution: Indonesia (West Papua).
A. striata (Gentili, 2002) Distribution: Indonesia (West Papua).
A. sucinacia (Gentili, 2002) Distribution: Indonesia (West Papua).
A. testacea (Gentili, 1996) Distribution: Indonesia (West Papua).
Tribe Laccobiini Bertrand, 1954
Genus Pelthydrus d’Orchymont, 1919 Subgenus P. (Globipelthydrus)
Schönmann, 1994 P. (G.) acutus Schönmann, 1994
Distribution: Indonesia (Sumatra). P. (G.) balinensis Schönmann, 1994
Distribution: Indonesia (Bali, Lombok).
P. (G.) brouni d’Orchymont, 1919 Distribution: Indonesia (Sumatra).
P. (G.) corporaali d’Orchymont, 1923 Distribution: Indonesia (Borneo, Siberut, Sulawesi, Sumatra).
P. (G.) feuerborni d’Orchymont, 1932 Distribution: Indonesia (Bali, Lombok).
P. (G.) schoedli Schönmann, 1994 Distribution: Indonesia (Java, Siberut, Sumatra).
P. (G.) thienemanni d’Orchymont, 1932 Distribution: Indonesia (Java).
Subgenus P. (s. str.) d’Orchymont, 1919
P. (s. str.) iniquus Schönmann, 1995 Distribution: Indonesia (Sumatra).
P. (s. str.) minutus d’Orchymont, 1919
Distribution: Indonesia (Bali, Java, Sumatra), China (Guangxi, Hong Kong), India (Kerala, Uttar Pradesh), Malaysia (Peninsula), Nepal, Philippines, Taiwan, Thailand, Vietnam.
P. (s. str.) ovalis d’Orchymont, 1932 Distribution: Indonesia (Sumatra).
P. (s. str.) truncatus d’Orchymont, 1932 Distribution: Indonesia (Sumatra).
Genus Laccobius Erichson, 1837
Subgenus L. (Cyclolaccobius) Gentili, 1991
L. (C.) tibialis d’Orchymont, 1932 Distribution: Indonesia (Sumatra).
Subgenus L. (Notoberosus) Blackburn, 1895
L. (N.) acceptus Gentili, 1996 Distribution: Indonesia (West Papua).
L. (N.) alius Gentili, 1988 Distribution: Indonesia (West Papua).
L. (N.) ambonicus Gentili, 1991 Distribution: Indonesia (Ambon, Seram).
L. (N.) balkei Gentili, 1996 Distribution: Indonesia (West Papua).
L. (N.) centralis Gentili, 1996 Distribution: Indonesia (West Papua).
L. (N.) discitarsus Gentili, 1997 Distribution: Indonesia (West Papua).
L. (N.) ebeneus Gentili, 1997 Distribution: Indonesia (West Papua).
L. (N.) fikaceki Gentili, 2005 Distribution: Indonesia (West Papua).
L. (N.) hollandiae Gentili, 1980
3rd GEN Network and 4th Rispescia International Seminar Sustainable Bio-resources for Global Welfare
4
Distribution: Indonesia (West Papua), Papua New Guinea.
L. (N.) irianicus Gentili, 1980 Distribution: Indonesia (West Papua).
L. (N.) lucernaris Gentili, 1980 Distribution: Indonesia (West Papua), Papua New Guinea.
L. (N.) photophilus Gentili, 1980 Distribution: Indonesia (West Papua).
L. (N.) virens Gentili, 1981 Distribution: Indonesia (West Papua).
Subgenus L. (Microlaccobius) Gentili, 1974
L. (M.) roseiceps Regimbart, 1903 Distribution: Indonesia (Ambon, Borneo, Sulawesi, West Papua), China (Hong Kong), India (Bihar, Maharashtra, Tamil Nadu, Uttar Pradesh), Malaysia (Sabah), Philippines, Vietnam, Australia (Northern Territory), Papua New Guinea.
L. (M.) roseiceps ssp. melanesiae Gentili, 1980
Distribution: Indonesia (West Papua), New Britain, Papua New Guinea, Solomon Is.
Subgenus Laccobius (subg.?)
L. (subg.?) huijbregtsi Gentili, 1988 Distribution: Indonesia (Sulawesi).
L. (subg.?) jacobsoni Knisch, 1925 Distribution: Indonesia (Sumatra), Thailand, Vietnam.
L. (subg.?) nesiotes Gentili, 1988 Distribution: Indonesia (Sulawesi).
L. (subg.?) sulawesicus Gentili, 1988
Distribution: Indonesia (Sulawesi). Genus Oocyclus Sharp, 1882 (hygropetric) O. sumatrensis d’Orchymont, 1932
Distribution: Indonesia (Java, Sulawesi, Sumatra), China (Hainan), Malaysia (Peninsula).
Tribe Hydrophilini Latreille, 1802
Subtribe Acidocerina Zaitzev, 1908 Genus Agraphydrus Regimbart, 1903 Subgenus A. (s.str.) Regimbart, 1903
A. (s.str.) orientalis (d’Orchymont, 1932) Distribution: Indonesia (Bali, Java, Sumatra), China (Yunnan), Taiwan.
Subgenus A. (Gymnhelochares) d’Orchymont, 1932
A. (G.) geminus (d’Orchymont, 1932) Distribution: Indonesia (Java).
Genus Helochares Mulsant, 1844 Subgenus H. (s.str.) Mulsant, 1844
H. (s.str.) fuliginosus d’Orchymont, 1932
Distribution: Indonesia (Java, Sumatra), Malaysia (Peninsula).
H. (s.str.) pallens (Macleay, 1825) Distribution: Indonesia (Java, Sumatra, Sunda), Benin, Botswana, Chad, Congo, Ethiopia, Ghana, Guinea, Kenya, Madagascar, Namibia, Rwanda, South Africa, Sudan, Tanzania, Yemen, Zambia, China (Hubei, Fujian, Guangdong, Yunnan), Egypt, Israel, Japan, Lebanon, Saudi Arabia (north), Bangladesh, Myanmar, India, Malaysia (Peninsula),
3rd GEN Network and 4th Rispescia International Seminar Sustainable Bio-resources for Global Welfare
5
Philippines, Sri Lanka, Thailand, Papua New Guinea, Vanuatu.
H. (s.str.) papuensis Hebauer, 1995 Distribution: Indonesia (West Papua).
H. (s.str.) taprobanicus Sharp, 1890 Distribution: Indonesia (Borneo, Sumatra), Bangladesh, Cambodia, Malaysia (Peninsula), Sri Lanka, Thailand, Vietnam, New Guinea.
Subgenus H. (Hydrobaticus) MacLeay, 1871
H. (H.) anchoralis Sharp, 1890 Distribution: Indonesia (Sumatra), Bangladesh, Cambodia, China (Fujian, Hainan, Yunnan, Hubei), India, Laos, Philippines, Sri Lanka, Taiwan, Thailand, Japan.
H. (H.) ancoroides Hebauer, 2001 Distribution: Indonesia (West Papua).
H. (H.) compactus Hebauer, 2001 Distribution: Indonesia (West Papua).
H. (H.) denudatus d’Orchymont, 1943 Distribution: Indonesia (Sumatra), Malaysia (Peninsula).
H. (H.) lamprus d’Orchymont, 1940 Distribution: Indonesia (Sumatra).
H. (H.) lentus Sharp, 1890 Distribution: Indonesia (Borneo, Java, Lombok, Sumatra), Bangladesh, Cambodia, India, Malaysia (Peninsula), Sri Lanka, Thailand, Vietnam, China (Tibet).
H. (H.) minusculus d’Orchymont, 1943 Distribution: Indonesia (Sumatra), Myanmar.
H. (H.) nebridius d’Orchymont, 1940
Distribution: Indonesia (Java, Lombok, Sumatra), Singapore.
H. (H.) schwendingeri Hebauer, 1995 Distribution: Indonesia (Bali), Malaysia (Peninsula), Thailand.
Genus Chasmogenus Sharp, 1882
C. abnormalis (Sharp, 1890) Distribution: Indonesia (Borneo, Java, Sulawesi, Sumatra), Cambodia, Sri Lanka, Taiwan, Thailand, Vietnam, Japan.
C. irianus Hebauer, 2001 Distribution: Indonesia (West Papua).
C. rubricollis (Regimbart, 1903) Distribution: Indonesia (Borneo, Sumatra).
Genus Enochrus Thomson, 1859
Subgenus E. (Methydrus) Rey, 1885 E. (M.) baliemus Hebauer, 2001
Distribution: Indonesia (West Papua). E. (M.) balkei Hebauer, 2001
Distribution: Indonesia (West Papua). E. (M.) brunnescens Hebauer, 2001
Distribution: Indonesia (West Papua). E. (M.) cassidiformis Hebauer, 2001
Distribution: Indonesia (West Papua). E. (M.) esuriens (Walker, 1858)
Distribution: Indonesia (Borneo, Java, Sumatra, Sunda), Bangladesh, China (Fujian, Guangdong, Hainan, Jiangxi, Hubei, Jiangsu), India, Malaysia (Peninsula), Nicobar Is., Philippines, Sri Lanka, Thailand, Vietnam, Japan, Saudi Arabia (north), South Korea (record from Egypt dubious), Australia (New South Wales,
3rd GEN Network and 4th Rispescia International Seminar Sustainable Bio-resources for Global Welfare
6

Northern Territory, Queensland, Western Australia), Fiji, New Caledonia, New Guinea, Solomon Is., Vanuatu, Samoa, Society Is.
E. (M.) flavicans (Regimbart, 1903) Distribution: Indonesia (Java).
E. (M.) fretus d’Orchymont, 1932 Distribution: Indonesia (Java), China (Yunnan).
E. (M.) froficuloides Hebauer, 2001 Distribution: Indonesia (West Papua).
E. (M.) gaggermeieri Hebauer, 1995 Distribution: Indonesia (Borneo), Malaysia.
E. (M.) hendrichi Hebauer, 2001 Distribution: Indonesia (West Papua).
E. (M.) marginalis Hebauer, 2001 Distribution: Indonesia (West Papua).
E. (M.) musculus Hebauer, 2001 Distribution: Indonesia (West Papua).
E. (M.) nabiricus Hebauer, 2001 Distribution: Indonesia (West Papua).
E. (M.) neglectus Hebauer, 2001 Distribution: Indonesia (West Papua).
E. (M.) paniaicus Hebauer, 2001 Distribution: Indonesia (West Papua).
E. (M.) ruber Hebauer, 2001 Distribution: Indonesia (West Papua).
E. (M.) rubrocinctus (Regimbart, 1903) Distribution: Indonesia (Buru, Sumatra), Bangladesh, Myanmar, India (Kerala), Philippines, Vietnam.
E. (M.) seriellus Hebauer, 2001 Distribution: Indonesia (West Papua).
E. (M.) yamuranus Hebauer, 2001 Distribution: Indonesia (West Papua).
Subtribe Hydrophilina Latreille, 1802
Genus Sternolophus Solier, 1834 Subgenus S. (Neosternolophus) Zaitzev,
1909 S. (N.) inconspicuous (Nietner, 1856)
Distribution: Indonesia (Java, Sumatra), Philippines Myanmar, Cambodia, China (Fujian, Yunnan), India (Bihar), Sri Lanka, Taiwan, Thailand, Vietnam, Japan.
S. (N.) marginicollis (Hope, 1841) Distribution: Indonesia (Borneo, Buru, Java, Sulawesi, West Papua), Timor, Australia (Australian Capitol Territory, New South Wales, Northern Territory, Queensland, South Australia, Victoria, Western Australia), Fiji, New Caledonia, Papua New Guinea, Vanuatu, India (Kerala). Subgenus S. (s. str.) Solier, 1834
S. (s. str.) rufipes (Fabricius, 1792) Distribution: Indonesia (Java, Sumatra), China (Beijing, Jiangsu, Tibet, Fujian, Guangdong, Hunan, Yunnan, Zhejiang), India (Tamil Nadu), Philippines, Sri Lanka, Taiwan, Thailand, Vietnam, India (Kashmir), Japan, South Korea.
Genus Hydrobiomorpha Blackburn, 1888
Subgenus H. (s. str.) Blackburn, 1888 H. (s. str.) cambodiensis (Regimbart, 1903)
Distribution: Indonesia (Java), Myanmar, Cambodia, Vietnam.
H. (s. str.) malaisica Mouchamps, 1959 Distribution: Indonesia (Sumatra), Cambodia.
3rd GEN Network and 4th Rispescia International Seminar Sustainable Bio-resources for Global Welfare
7

H. (s. str.) rufiventris (Nietner, 1856) Distribution: Indonesia (Sumatra), India (Tamil Nadu), Sri Lanka.
H. (s. str.) simplex Mouchamps, 1959 Distribution: Indonesia (Borneo).
H. (s. str.) spinicollis ssp. oriensis Mouchamps, 1959
Distribution: Indonesia (Java), India, Laos, Vietnam.
H. (s. str.) spinicollis ssp. andromorpha Mouchamps, 1959
Distribution: Indonesia (Sumatra).
Genus Hydrophilus Geoffroy, 1762 Subgenus H. (s. str.) Geoffroy, 1762
H. (s. str.) acuminatus Motschulsky, 1854
Distribution: Indonesia (Sumatra), China (Beijing, Hebei, Nei Mongol, Sichuan, Tibet Guangdong, Hong Kong, Jiangxi, Shanghai, Yunnan, Zhejiang), Japan, Russian Fed. (Far East), South Korea, Myanmar, Taiwan.
H. (s. str.) bilineatus (MacLeay, 1825) Distribution: Indonesia (Ambon, Java, Lombok, Sulawesi), China (Fujian, Hubei, Sichuan), India, Philippines, Australia (Australian Capitol Territory, New South Wales, Northern Territory, Queensland, Western Australia), Fiji.
H. (s. str.) bilineatus ssp. caschmirensis Redtenbacher, 1844
Distribution: Indonesia (Sumatra), Myanmar, Cambodia, China (Jiangxi, Yunnan, Hubei, Sichuan, “Manchuria”), India (“Bengal”),
Malaysia, Sri Lanka, Taiwan, Thailand, Vietnam, India (Kashmir), Japan, South Korea.
H. (s. str.) cavisternum (Bedel, 1891) Distribution: Indonesia (Java), Cambodia, China (Hainan), Laos, Malaysia (Peninsula), Thailand, Vietnam.
H. (s. str.) loriai (Regimbart, 1901) Distribution: Indonesia (West Papua), Papua New Guinea.
Subfamily Sphaeridiinae Latreille, 1802
Tribe Coelostomatini Heyden, 1891 Genus Coelostoma Brulle, 1835
Subgenus C. (s. str.) Brulle, 1835 C. (s. str.) fabricii (Montrouzier, 1860)
Distribution: Indonesia (Borneo, Sumatra, West Papua), China (Fujian), Laos, Vietnam, Australia (Queensland, Southern Australia, Tasmania, Western Australia), New Caledonia, Vanuatu, Hawaiian Is.
C. (s. str.) fallaciosum d’Orchymont, 1936
Distribution: Indonesia (Sumatra), China (Fujian), Malaysia (Sabah), Brunei, Vietnam, Japan.
C. (s. str.) subditum d’Orchymont, 1936 Distribution: Indonesia (Borneo), Malaysia, Brunei.
C. (s. str.) vitalisi d’Orchymont, 1923 Distribution: Indonesia (Borneo, Java, Sumatra), China (Shandong, Yunnan), India (Bihar), Malaysia (Sabah), Brunei, Singapore, Sri Lanka, Vietnam.
C. (s.str.) vividum d’Orchymont, 1936
3rd GEN Network and 4th Rispescia International Seminar Sustainable Bio-resources for Global Welfare
8
Distribution: Indonesia (Borneo, Java, Sumatra), India (West Bengal).
Subgenus C. (Holocoelostoma) Mouchamps, 1958
C. (H.) stultum (Walker, 1858) Distribution: Indonesia (Borneo, Java, Sumatra, Sumbawa), Andaman Is., Myanmar, China, India (Assam), Malaysia (Peninsula), Nicobar Is., Philippines, Sri Lanka, Taiwan, Thailand, Vietnam, Japan, South Korea, Mascarene Is., Oman, Saudi Arabia (south).
C. (H.) thienemanni d’Orchymont, 1932 Distribution: Indonesia (Sumatra). Subgenus C. (Lachnocoelostoma)
Mouchamps, 1958 C. (L.) coomani ssp. diversum d’Orchymont, 1932
Distribution: Indonesia (Sumatra). C. (L.) coomani ssp. javanicum Mouchamps, 1958
Distribution: Indonesia (Java). C. (L.) cooptatum d’Orchymont, 1932
Distribution: Indonesia (Bali, Java, Sumatra).
C. (L.) coortum d’Orchymont, 1932 Distribution: Indonesia (Sumatra).
C. (L.) horni (Regimbart, 1902) Distribution: Indonesia (Sumatra, Sunda), Andaman Is., Bhutan, China (Hong Kong), India, Nicobar Is., Sri Lanka, Vietnam, Mascarene Is., Oman, Saudi Arabia (south), South Africa, Yemen.
C. (L.) irregular Hebauer, 2001
Distribution: Indonesia (West Papua). C. (L.) lazarense d’Orchymont, 1925
Distribution: Indonesia (Sumatra), Malaysia (Peninsula), Philippines.
C. (L.) phallicum d’Orchymont, 1940 Distribution: Indonesia (Borneo, Sulawesi), Cambodia, China (Xinjiang), Malaysia (Peninsula), Laos, Vietnam.
C. (L.) vagum d’Orchymont, 1940 Distribution: Indonesia (Borneo, Java, Sumatra), Cambodia, China (south), Malaysia, Laos, Vietnam.
Genus Dactylostethus d’Orchymont, 1919 D. impunctatus d’Orchymont, 1919
Distribution: Indonesia (Sumatra). Remarks. This genus is endemic to Sumatra (Hebauer, 2007a, b).
Genus Dactylosternum Wollaston, 1854 D. abdominal (Fabricius, 1792)
Distribution: Indonesia (Java, Sumatra), Benin, Cape Verde Is., Comoros, Guinea, Ivory Coast, Madagascar, Mascarene Is., Nigeria, Senegal, Seychelles (incl. Aldabra), South Africa, Togo, Yemen, Zaire, Algeria, Azores, Canary Is., Croatia, Cyprus, Egypt, France, Germany, Greece, Italy, Japan, Madeira, Spain, Syria, Tunisia, Andaman Is., Christmas Is., India, Malaysia (Peninsula), Philippines, Singapore, Sri Lanka, Australia (Australia Capitol Territory, Queensland, South Australia, Victoria, Western Australia), Fiji, New Caledonia, New
3rd GEN Network and 4th Rispescia International Seminar Sustainable Bio-resources for Global Welfare
9
Guinea, New Zealand, Gambier Is., Hawaiian Is., Marquesas Is., Samoa, Society Is., Argentina, Brazil, Cuba, Jamaica (purposely intr.), Lesser Antilles, Mexico, U.S.A. (Alabama, California, Florida, North Carolina, Texas).
D. bormeanum Hebauer, 2001 Distribution: Indonesia (West Papua).
D. corporaali d’Orchymont, 1923 Distribution: Indonesia (Sumatra), Malaysia (Peninsula).
D. cycloides Knisch, 1921 Distribution: Indonesia (Sipura, Sumatra), Malaysia (Peninsula).
D. detersum Hebauer, 2001 Distribution: Indonesia (West Papua), Papua New Guinea.
D. doherty Balfour-Browne, 1942 Distribution: Indonesia (Java), Thailand.
D. dytiscoides (Fabricius, 1775) Distribution: Indonesia (Borneo, Buru, Enggano, Java, Mentawei, Morotai, Nias, Sulawesi, Sumatra), Malaysia (Peninsula), Philippines, Singapore, Sri Lanka, Australia (Queensland), New Britain, Papua New Guinea, Vanuatu, Hawaiian Is.
D. hydrophiloides (MacLeay, 1825) Distribution: Indonesia (Borneo, Buru, Java, Sulawesi), Andaman Is., Bhutan, China (Fujian), India (West Bengal), Malaysia (Peninsula), Singapore, Taiwan, Thailand, Vietnam, South Africa, Australia, Palau Is., Hawaiian Is., Jamaica.
D. ilaganum Hebauer, 2001
Distribution: Indonesia (West Papua). D. illutum Hebauer, 2001
Distribution: Indonesia (West Papua), Papua New Guinea.
D. inaequale Knisch, 1921 Distribution: Indonesia (Sumatra).
D. proxime d’Orchymont, 1923 Distribution: Indonesia (Sumatra).
D. seriatum Knisch, 1921 Distribution: Indonesia (Enggano, Java, Mentawei, Sumatra), Vietnam.
D. subquadratum (Fairmaire, 1849) Distribution: Indonesia (Kep. Tanimbar), Fiji, Papua New Guinea, Vanuatu, Gambier Is., Hawaiian Is., Samoa, Society Is., Tubuai Is.
D. trilobatum Hebauer, 2001 Distribution: Indonesia (West Papua).
D. waigeuense Balfour-Browne, 1942 Distribution: Indonesia (West Papua).
Tribe Protosternini Hansen, 1991
Genus Rhombosternum Balfour-Browne, 1942
R. bameuli Hebauer, 2001 Distribution: Indonesia (West Papua).
R. consobrinum Bameul, 1997 Distribution: Indonesia (Java), Philippines.
R. wagneri (Knisch, 1921) Distribution: Indonesia (Java, Sipura, Sumatra), Malaysia (Sabah).
Genus Protosternum Sharp, 1890
P. abnormal (d’Orchymont, 1913) Distribution: Indonesia (Mentawei, Sumatra), Taiwan.
P. longicarinatum Bameul, 1997
3rd GEN Network and 4th Rispescia International Seminar Sustainable Bio-resources for Global Welfare
10

Distribution: Indonesia (Sulawesi).
Tribe Omicrini Smetana, 1975 Genus Paromicrus Scott, 1913
P. bicarinatus Bameul, 1993 Distribution: Indonesia (Sulawesi)
P. carolinae d’Orchymont, 1919 Distribution: Indonesia (Enggano).
P. flexus Bameul, 1993 Distribution: Indonesia (Sulawesi).
P. punctulatus Bameul, 1993 Distribution: Indonesia (Sulawesi).
P. scotti d’Orchymont, 1919 Distribution: Indonesia (Sumatra, Enggano, Sulawesi)
P. scotti ssp. denseseriatum d’Orchymont, 1925
Distribution: Indonesia (Borneo). P. scutulatus Bameul, 1993
Distribution: Indonesia (Sulawesi). P. wallacei Bameul, 1993
Distribution: Indonesia (Sulawesi).
Genus Aculomicrus Smetana, 1990 A. brendelli Bameul, 1993
Distribution: Indonesia (Sulawesi).
Genus Psalitrus d’Orchymont, 1919 A. fungifer Bameul, 1993
Distribution: Indonesia (Sumatra). A. nigrorufus d’Orchymont, 1932
Distribution: Indonesia (Bali). A. vandenbosscheae d’Orchymont, 1919
Distribution: Indonesia (Sumatra).
Genus Stanmalcolmia Bameul, 1993 S. sulawesiensi Bameul, 1993
Distribution: Indonesia (Sulawesi).
Remarks. This genus is endemic to Sulawesi (Hebauer, 2007a, b).
Genus Omicrogiton d’Orchymont, 1919 O. insularis d’Orchymont, 1919
Distribution: Indonesia (Borneo, Buru, Enggano, Sulawesi, Sumatra), Malaysia (Sarawak), Philippines (Luzon), Sri Lanka, Mascarene Is.
Genus Mircogioton d’Orchymont, 1937
M. irregularis Hebauer, 2006 Distribution: Indonesia (West Papua).
M. seriatus Hebauer, 2006 Distribution: Indonesia (West Papua).
Genus Peratogonus Sharp, 1884
P. corporaali d’Orchymont, 1926 Distribution: Indonesia (Java).
Genus Noteropagus d’Orchymont, 1919
N. obliquus d’Orchymont, 1925 Distribution: Indoensia (Sulawesi), Malaysia (Pinang Is.), Hawaiian Is.
N. obscurus d’Orchymont, 1919 Distribution: Indonesia (Timor), Fiji.
N. occlusus d’Orchymont, 1932 Distribution: Indonesia (Sumatra), Madagascar, Mascarene Is.
N. politus d’Orchymont, 1919 Distribution: Indonesia (Bali, Java, Mentawei, Sumatra), India, Philippines, Samoa.
N. politus ssp. punctatus d’Orchymont, 1925
Distribution: Indonesia (Sumatra), Vietnam.
3rd GEN Network and 4th Rispescia International Seminar Sustainable Bio-resources for Global Welfare
11
Tribe Megasternini Mulsant, 1844 Genus Cycreon d’Orchymont, 1919
C. sculpturatus d’Orchymont, 1919 Distribution: Indonesia (Sumatra).
Genus Armostus Sharp, 1890
A. arcuatus Hebauer, 2001 Distribution: Indonesia (West Papua).
A. crenulatus (Regimbart, 1903) Distribution: Indonesia (Java), India (Kerala, Uttar Pradesh), Malaysia (Pinang Is.), Singapore, Japan.
A. fleutiauxi (d’Orchymont, 1925) Distribution: Indonesia (Java), Vietnam.
A. optatus Sharp, 1890 Distribution: Indonesia (Java), India (Uttar Pradesh), Sri Lanka, Vietnam.
A. schenklingi (d’Orchymont, 1914) Distribution: Indonesia (Borneo, Java, Sumatra, Sumbawa, Sulawesi), Taiwan.
A. taeniatus Hebauer, 2001 Distribution: Indonesia (West Papua).
Genus Australocyon Hansen, 1990
A. antennatus Hansen, 2003 Distribution: Indonesia (Sulawesi).
A. loebli Hansen, 2003 Distribution: Indonesia (Sumatra).
A. nigrorufus Hansen, 2003 Distribution: Indonesia (Sulawesi).
A. puncticollis Hansen, 2003 Distribution: Indonesia (Mentawei), Malaysia (Sabah).
Genus Cetiocyon Hansen, 1990
C. goliathus (Huijbregts, 1984)
Distribution: Indonesia (West Papua).
Genus Platycyon Hansen, 1999 P. bicolor Hebauer, 2001
Distribution: Indonesia (West Papua). P. bisignatus Hebauer, 2000
Distribution: Indonesia (West Papua). P. collaris Hebauer, 2001
Distribution: Indonesia (West Papua). P. confusus Hansen, 1999
Distribution: Indonesia (West Papua). P. guttalis Hebauer, 2000
Distribution: Indonesia (West Papua), Papua New Guinea.
P. latior Hebauer, 2000 Distribution: Indonesia (West Papua).
P. minimus Hebauer, 2001 Distribution: Indonesia (West Papua).
P. minor Hebauer, 2000 Distribution: Indonesia (West Papua).
P. nabirensis Hebauer, 2000 Distribution: Indonesia (West Papua).
P. nigrifrons Hebauer, 2000 Distribution: Indonesia (West Papua).
P. reticulatus Hansen, 1999 Distribution: Indonesia (West Papua), Papua New Guinea.
P. sulcatus Hebauer, 2000 Distribution: Indonesia (West Papua).
Genus Peltocercyon d’Orchymont, 1925
P. coomani d’Orchymont, 1925 Distribution: Indonesia (Sumatra), Vietnam.
P. lunulatus (Gemminger & Harold, 1868)
Distribution: Indonesia (Sumatra), Singapore, Sri Lanka, Vietnam.
3rd GEN Network and 4th Rispescia International Seminar Sustainable Bio-resources for Global Welfare
12

Genus Cercyon Leach, 1817
Subgenus C. (Acycreon) d’Orchymont, 1942
C. (A.) punctiger Knisch, 1921 Distribution: Indonesia (Enggano, Sumatra), India (Tamil Nadu), Singapore, Sri Lanka, Vietnam.
Subgenus C. (Paracycreon) d’Orchymont, 1942
C. (P.) morosus Knisch, 1925 Distribution: Indonesia (Sumatra).
C. (P.) subsolanus Balfour-Browne, 1939 Distribution: Indonesia (Sumatra, Sunda), India, Malaysia (Peninsula), Philippines, Singapore, Sri Lanka, Taiwan, Thailand, Vietnam (as “vicinalis”), Saudi Arabia (north). Subgenus C. (s. str.) Leach, 1817
C. (s. str.) corporaali d’Orchymont, 1925 Distribution: Indonesia (Batu).
C. (s. str.) iquinatus Wollaston, 1854 Distribution: Indonesia (Java), Azores, Canary Is., Croatia, Italy, Japan, Madeira, U.S.A. (Illinos), Brazil, Mascarene Is., New Caledonia.
C. (s. str.) madidus d’Orchymont, 1932 Distribution: Indonesia (Java).
C. (s. str.) toxopeusi d’Orchymont, 1925 Distribution: Indonesia (Buru).
C. (s. str.) tropicus d’Orchymont, 1925 Distribution: Indonesia (Buru).
C. (s. str.) trossulus d’Orchymont, 1932 Distribution: Indonesia (Sumatra).
C. (s. str.) udus d’Orchymont, 1932 Distribution: Indonesia (Bali, Java).
C. (s.str.) vaneeckei Knisch, 1926 Distribution: Indonesia (Java, Sumatra).
Subgenus C. (Paracercyon) Seidlitz, 1888 C. (P.) fulvus Knisch, 1921
Distribution: Indonesia (Mentawei, Sumatra).
C. (P.) vitalis Knisch, 1921 Distribution: Indonesia (Sumatra).
Subgenus C. (Clinocercyon) d’Orchymont,
1942 C. (C.) asperatus Hebauer, 2001
Distribution: Indonesia (West Papua). C. (C.) conjiciens (Walker, 1858)
Distribution: Indonesia (Sumatra), India (Tamil Nadu), Seychelles, Sri Lanka.
C. (C.) flaviventris Hebauer, 2001 Distribution: Indonesia (West Papua).
C. (C.) humeronotus Hebauer, 2001 Distribution: Indonesia (West Papua).
C. (C.) humeropictus Hebauer, 2001 Distribution: Indonesia (West Papua).
C. (C.) javanus d’Orchymont, 1932 Distribution: Indonesia (Java).
C. (C.) lineolatus (Motschulsky, 1863) Distribution: Indonesia (Sumatra), India (Bihar), Philippines, Sri Lanka, Vietnam, Mascarene Is.
C. (C.) xanthaspis Hebauer, 2001 Distribution: Indonesia (West Papua).
Genus Pelosoma Mulsant, 1844
P. orientale d’Orchymont, 1925 Distribution: Indonesia (Buru).
P. sumatrense d’Orchymont, 1932
3rd GEN Network and 4th Rispescia International Seminar Sustainable Bio-resources for Global Welfare
13

Distribution: Indonesia (Sumatra).
Genus Paroosternum Scött, 1913 P. alternans Hebauer, 2001
Distribution: Indonesia (West Papua). P. jayanum Hebauer, 2006
Distribution: Indonesia (West Papua). P. melanesinum Hebauer, 2006
Distribution: Indonesia (West Papua), Papua New Guine.
P. saundersi (d’Orchymont, 1925) Distribution: Indonesia (Java), Singapore, Vietnam, Papua New Guinea.
Genus Bolbonotum Hansen, 1999
B. myophallus Hansen, 1999 Distribution: Indonesia (Batu Is., Nias Is.), Malaysia (Sarawak).
Genus Pachysternum Motschulsky, 1863
P. apicatum Motschulsky, 1863 Distribution: Indonesia (Java, Lombok, Sipura, Sumatra), India, Malaysia (Peninsula), Vietnam.
P. sulawesicum Fikáćek, 2006 Distribution: Indonesia (Sulawesi).
Genus Cryptopleurum Mulsant, 1844
C. bilinguipenis Hebauer, 2001 Distribution: Indonesia (West Papua).
C. corporaali d’Orchymont, 1926 Distribution: Indonesia (Java).
C. ferrugineum Motschulsky, 1863 Distribution: Indonesia (Sumatra), India (”Bengal”), Singapore, Sri Lanka, Vietnam, Saudi Arabia (north).
C. flaviapex Hebauer, 2001
Distribution: Indonesia (West Papua).
Genus Pilocnema Hansen, 1990 P. bicolor Hebauer, 2004
Distribution: Indonesia (West Papua). P. brevisternum Hansen, 2003
Distribution: Indonesia (West Papua). P. clypealis Hansen, 2003
Distribution: Indonesia (West Papua). P. confuse Hansen, 2003
Distribution: Indonesia (West Papua). P. crassipes Hansen, 2003
Distribution: Indonesia (West Papua). P. fusipalpis Hebauer, 2004
Distribution: Indonesia (West Papua). P. gracilipes Hebauer, 2004
Distribution: Indonesia (West Papua). P. grandis Hansen, 2003
Distribution: Indonesia (West Papua). P. obsoleta Hansen, 2003
Distribution: Indonesia (West Papua).
Tribe Sphaeridiini Latreille, 1802 Genus Sphaeridium Fabricius, 1775
S. dimidiatum Gory, 1834 Distribution: Indonesia (Java), India (Bihar, Kerala, Tamil Nadu, Uttar Pradesh, West Bengal), Sri Lanka, Thailand, Japan.
S. flavomaculatum d’Orchymont, 1924 Distribution: Indonesia (West Papua).
S. huijbregtsi Berge Henegouwen, 1986 Distribution: Indonesia (Maluku, West Papua), Papua New Guinea, Solomon Is.
S. quinquemaculatum Fabricius, 1798 Distribution: Indonesia (Java, Sumatra), India, Philippines, Sri
3rd GEN Network and 4th Rispescia International Seminar Sustainable Bio-resources for Global Welfare
14

Lanka, Taiwan, China (Jiangsu), Japan, Saudi Arabia (north).
S. seriatum d’Orchymont, 1913 Distribution: Indonesia (Batu Is., Borneo, Java, Sumatra), India, Philippines, Vietnam.
S. severini d’Orchymont, 1919 Distribution: Indonesia (Sumatra), Cambodia, China (Hong Kong, Yunnan), India (Kerala, Tamil Nadu, West Bengal), Laos, Singapore, Vietnam.
Family Georissidae Castelnau, 1840
Genus Georissus Latreille, 1809 Subgenus G. (Neogeorissus) Satô, 1972
G. (N.) batavianus Delève, 1969 Distribution: Indonesia (Java).
G. (N.) calculus Delève, 1969 Distribution: Indonesia (Sumatra).
G. (N.) emdeni Delève, 1969 Distribution: Indonesia (Sumatra).
G. (N.) overbecki Emden, 1934 Distribution: Indonesia (Java, Sumatra).
Family Hydrochidae Thomson, 18595
Genus Hydrochus Leach, 1817 H. chitaniei Makhan, 1994
Distribution: Indonesia (West Papua). H. gitaraiae Makhan, 1994
Distribution: Indonesia (West Papua) H. inornatus d’Orchymont, 1927
Distribution: Indonesia (Java). H. kiranae Makhan, 1994
Distribution: Indonesia (Sulawesi). H. satishanandi Makhan, 1995
Distribution: Indonesia (Java).
Family Spercheidae Erichson, 1837 Genus Spercheus Kugelann, 1798
S. platycephalus Macleay, 1825 Distribution: Indonesia (Bali, Borneo, Java, Lombok, Sulawesi, Sumatra, Sumbawa), Australia (Queensland), Papua New Guinea, Tonga Is.
S. siamensis Hebauer, 1990 Distribution: Indonesia (Sumatra), Thailand.
Discussion
In the present paper, 263 species
including subspecies under 4 f amilies, 3 subfamilies, 10 tribes, 48 genera are listed from Indonesia archipelago, and this number is 8.76 % of the world Hydrophilidae species. According to Hansen (1991), of these 26 genera are terrestrial, and remaining genera are aquatic/semiaquatic.
Two families related Hydrophilidae, i.e. Helophoridae and Epimetopidae, have not been recorded from Indonesia archipelago, but as Hebauer (2007b) suggested we suppose the family Epimetopidae which distributed in tropical region will be discovered from Indonesia.
The highest number of the species lives in both of Sumatra and West Papua. Hebauer (2007a) reported two genera as island endemics in Indonesia, there are Dactylostethus d’Orchymont recorded from Sumatra and Stanmalcolmia Bameul from Sulawesi.
3rd GEN Network and 4th Rispescia International Seminar Sustainable Bio-resources for Global Welfare
15
Acknowledgements
We wish to express our sincere gratitude to Gadjah Mada-Ehime Network (GEN) program, especially to Prof. Tatsuo Sweda and Prof. Kazuo Hayashi (Ehime Univ. Japan), and Dr. Adi Joko and Dr. Henry Yuliando (Gadjah Mada Univ. Indonesia). We also thank to Dr. Nugroho Susetya Putra (Gadjah Mada Univ.) and Dr. Masahiro Sakai (Ehime University Museum) for their usual support. This study is funded by GEN and the JSPS Exchange Program for East Asian Young Researchers (EPEAYR) “Formation of Indonesian University Consortium for Sustainable Primary Production (coordinator: Dr. Sweda)”.
References Bernhard, D., C. Schmidt, A. Korte, G.
Fritzsch, & R.G. Beutel, (2006) From terrestrial to aquatic habitats and back again – molecular insights into the evolution and phylogeny of Hydrophiloidea (Coleoptera) using multigene analyses. Zoologica Scripta 35: 597-606.
Hansen, M., 1991. The Hydrophiloid Beetles. Phylogeny, Classification and a Revision of the Genera (Coleoptera, Hydrophiloidea). –Biologiske Skrifter, Det Kongelige Danske Videnskabernes Selskab 40: 1-368.
Hansen, M., 1999. World Catalogue of Insect 2, Hydrophiloidea (s.str.) (Coleoptera). Apollo Books, Stenstrup, 416 pp.
Hebauer, F., 2007a. On endemism and the phenomenon of extremity endemism. (Coleoptera aquatic). Acta Coleopterologica 23 (1): 49-55.
Hebauer, F., 2007b. Distribution and Endemism in Hydrophiloidea. (Coleoptera, Hydrophiloidea). Acta Coleopterologica 23 (2): 3-48.
Komarek, A. & R.G. Beutel, 2007. Phylogenetic analysis of Anacaenini (Coleoptera: Hydrophilidae: Hydrophilinae) based on morphological characters of adults. Systematic Entomology 32: 205-226.
Short, A.E.Z., 2007. Hansen Catalogue Updates. Additions & Corrections: 2006. Updated 7 January 2007. http://www.hydrophiloidea.org/taxres/catalogue/2006update6Jan.pdf. In: Hydrophiloidea.org, http://www.hydrophiloidea.org/home.html/ (accessed on 24 May 2010).
Short, A.E.Z. & F. Hebauer, 2006. W orld Catalogue of Hydrophiloidea –additions and corrections, 1 ( 1999–2005) (Coleoptera). Koleopterologische Rundschau 76: 315-359.
3rd GEN Network and 4th Rispescia International Seminar Sustainable Bio-resources for Global Welfare
16
EL NINO AND LA NINA CLIMATE ANOMALY IMPACT ON MAIZE PRODUCTION AND SUPPLY IN JAVA
Arini Wahyu Utami, Suhatmini Hardyastuti, Jamhari
Department of Agricultural Socio-Economics, Faculty of Agriculture, Gadjah Mada University [email protected]
ABSTRACT
Maize was the second important food crop in Indonesia, after paddy, and Java Island became one of its production centers, besides Sumatera and Sulawesi. The more frequent occurrence of El Nino and La Nina climate anomaly after the global warming was hypothesized has influenced the production, and also the supply, of maize. This paper described and analyzed the impact of El Nino and La Nina on maize production and supply in Java.
Panel data was used, that was combining between cross sectional data from four provinces in Java island, i.e. West Java, Central Java, East Java, and DI Yogyakarta, with time series data from 1987-2006 of those provinces. The table analysis was used to describe the impact of El Nino and La Nina on rainfall and maize production. The autoregressive regression model, which were include the dummy variable of El Nino and La Nina occurrence and Southern Oscillation Index value, was run to estimate the maize supply.
The table analysis showed that the El Nino occurrence decreased rainfall by 22.74%, while La Nina increased it by 38.41% from normal. The maize production decreased, both on E l Nino and La Nina occurrence, consecutively 30.24% and 33.10%. Meanwhile, the regression analysis showed that El Nino didn’t influence the maize supply, but La Nina did. Maize supply function showed that the supply of maize in Java island increasing when La Nina occurred.
Keywords: El Nino, La Nina, production, supply
INTRODUCTION
The 2006-2009 General Policy of Food Security from Indonesian Agency of Food Security stated that maize was the second most important food crop in Indonesia, after paddy. Besides used as staple food in several regions, such as Madura and East Nusa Tenggara, the demand and using of maize al so i ncrease significantly after
the fast growing of animal husbandary (Erwidodo et al., 2003 cit. Ariyanti, 2007). Maize production is concentrated in Java Island, which is more than 50% of its production yielded in East Java and Central Java provinces in this island (Agency of Food Security, 2006). Thus, Java Island became an important area for food production, especially paddy and maize as strategic food crops.
3rd GEN Network and 4th Rispescia International Seminar Sustainable Bio-resources for Global Welfare
17

Maize was seasonal crop with short planting period. This made the maize will be easily influenced by climate anomaly. Two climate anomalies usually attack Indonesia were El Nino and La Nina, which recently deviated from its normal cycle. The both climate anomalies became more frequent and have longer duration since 1990’s. The El Nino occurance was usually followed by rainfall decreasing, while the La Nina stimulated the rainfall increasing above normal. Those both incidents harmed the agricultural production by its impact on water supply. In El Nino period, there was shortage in water supply, causing the decreasing of agricultural yield because of the drought. Otherwise, La Nina stimulated excessive water supply which sometimes causing flood and failure in crop harvest.
Water was dominant factor for plant growth, yield, and production stability.
The water need for maize was 45-145 millimetres per month (Directoral General of Higher Education, Department of Education and Culture, 1991). The El Nino can cause the rainfall decrease below normal, i.e. less that 50 millimetres per month, while La Nina opposites. Many plant activities using water, such as photosynthesis, which were important for the plant to produce seed and fruit. Thus, El Nino and La Nina climate anomaly was clearly impacted on maize, seasonal food crop with short planting period.
The fluctuating maize production because of the climate anomaly will also impact on its supply, which was the quantity produced and supplied by the farmers. Thereby, this paper aimed to analyze the impact of El Nino and La Nina climate anomaly on maize production and supply in Java.
DATA
Data used was secondary data, which was collected from several related institutions, such as Central Bureau of Statistics, Ministry of Agriculture, Bureau of Meteorology, Climatology, and Geophisics, website of Australian Bureau of Meteorology, website of National Weather Service of United States of America, etc. The data panel was used, which was combining between cross section data from four provinces in Java Island, i.e. West Java, Central Java, Daerah Istimewa Yogyakarta, and East Java, with quarterly time series data from 1987 to 2006.
ANALYSIS
The table analysis was employed to describe the impact of El Nino and La
Nina on rainfall and maize production. The histogram was also formed to show the comparison of maize production in normal climate, El Nino, and La Nina.
The Ordinary Least Square regression function was run to analyze the El Nino and La Nina impact on maize supply. The maize supply function was developed using autoregressive model, which analyze in two kinds of model. Firstly, the dummy variable of El Nino and La
Nina occurance was included in the model to analyze its impact on maize supply. Secondly, the value of Southern Oscillation Index (SOI), as the El Nino and La Nina indicator, was included to analyze the elasticity or changing value of maize supply because of the both climate
3rd GEN Network and 4th Rispescia International Seminar Sustainable Bio-resources for Global Welfare
18

anomalies. Autoregressive model was econometric model which included the time lag value of its dependent variable
(Widarjono, 2005). The maize supply models were as followed:
lnQjg = 0 + 1 lnPjgt-4 + 2 lnPkat-1 + 3 lnLPjg + 4 lnUr + 5 lnUc + 6 Den + 7 Dln +
8 Qjgt-1 + e lnQjg = 0 + 1 lnPjgt-4 + 2 lnPkat-1 + 3 lnLPjg + 4 lnUr + 5 lnUc + 6 IOS + 7 Qjgt-1 + e
Note: Qjg = supply quantity of maize in farmer stage (ton) Pjgt-4 = price of dried maize in farmer stage 4 quarters ago (Rp/quintal) Pkat-1 = price of dried groundnut in farmer stage 1 quarter ago (Rp/quintal) LPjg = harvested area of maize (hectare) Ur = retail price of urea fertilizer in rural area (Rp/kilogram) Uc = agricultural wage labor for ploughing (Rp/day/person) SOI = value of Southern Oscillation Index Den = dummy variable for El Nino occurance, value 1 for El Nino climate condition and 0 for others Dln = dummy variable for La Nina occurance, value 1 for La Nina climate condition and 0 for others Qjgt-1 = supply quantity of maize in farmer stage 1 quarter ago (ton) 0 = intercept 1-8 = function coefficient e = disturbance factor
The both models were tested using goodness of fit, F test, t test, and test for deviation classical asumption, i.e. multicolinearity, autocorrelation, and heteroscedasticity.
RESULTS AND DISCUSSION El Nino and La Nina Impact on Rainfall and Maize Production
The occurance of El Nino and La
Nina was related with the air pressure on equator zone of Pasific Ocean. These climate anomalies were observed by observing the air pressure between Darwin, Australia and Tahiti, French Polinesia. The air pressure diffence between those places was standardized and became indicator for El Nino and La Nina occureance, i.e. Southern
Oscillation Index (SOI). The SOI value used in this paper was SOI which was published by National Weather Service of United States of America and ranging between -10 and +10. The SOI value less than -1 in 3 months consecutively indicated El Nino occurance, while SOI value more than +1 in 3 months consecutively indicated La Nina. Table 1 be low described the time and period of El Nino and La Nina climate anomaly in the period of 1987-2006.
3rd GEN Network and 4th Rispescia International Seminar Sustainable Bio-resources for Global Welfare
19

Table 1. Time and Duration of El Nino and La Nina Occurance, 1987-2006 Climate Condition Incident
Month of Duration (month)
Average Monthly Rainfall (mm)
Average of SOI Value
Normal Average 10 137,8 -0,200
El Nino January 1987-January 1988 13 194,2 -1,246
March 1991-June 1992 16 146,4 -1,394 March 1993-October 1993 8 31,6 -1,200 April 1994-April 1995 13 101,1 -1,154 April 1997-April 1998 13 145,4 -1,946 May 2002-June 2003 14 116,1 -0,879 July 2004-February 2005 8 72,4 -1,000 August 2006-December 2006 5 44,5 -0,880 Average 11 106,5 -
1,200 (decrease 22,74% below normal)
La Nina May 1988 - July 1989 15 181,3 1,153
July 1998 - April 2000 22 166,7 0,936 October 2000 - March 2001 6 224,2 1,133 Average 14 190,7
1,100 (increase 38,41% above normal)
Source: Analysis of Secondary Data, 2008
Table 1 showed that there were 8 times of El Nino and 3 times of La Nina in the 20 years period of 1987-2006. The El Nino and La Nina duration were longer, that were 11 months for El Nino and 14 months for La Nina. The table also showed that rainfall in El Nino period was lower than normal and it was higher in La Nina period. The rainfall decreased 22.74% in El Nino period, but indrease 38.41% in La Nina period. According to
the month of incident, the El Nino mostly occurred in rainy season, i.e. in the year 1987/1988, 1991/1992, 1994/1995, 1997/1998, 2002/2003, 2004/2005, and 2006, while La Nina in dry season. Table 2 be low described the comparison of average maize production in normal, El Nino, and La Nina climate condition. Averagely, the El Nino and La Nina bothly decrease the maize productions,
3rd GEN Network and 4th Rispescia International Seminar Sustainable Bio-resources for Global Welfare
20

Dummy El Nino 0,10 0,75 1,28 Dummy La Nina 0,51*** 2,85 2,32
Southern Oscillation Index 0,06* 1,81 1,28
which were 30.24% in El Nino period and 33.10% in La Nina period. Compared with paddy, maize production was more
sensitive with climate anomaly (Utami et. al., 2008)
Table 2. Average Maize Production in Normal, El Nino, and La Nina Condition, 1987-2006 Production average (ton) in climate condition:
Percentage Percentage Period Normal El Nino Changing La Nina Changing
(%) (%)
Jan-Apr 3.062.185 2.530.631 -17,36 2.275.019 -25,71 May-Agt 1.648.519 1.136.534 -31,06 968.678 -41,24 Sep-Des 1.690.068 975.187 -42,30 1.143.251 -32,35
Average -30,24 -33,10 Source: Analysis of Secondary Data, 2008
The decreasing maize
production in El Nino and La Nina related with the rainfall condition (Table 1). In 1987-2006, rainfall in El Nino period in November-December increased above normal. Besides, in the period of 1987-2006, there were two La Nina occured in dry season. The excessive water supply in dry season, which usually become maize planting season, caused the decreasing maize production.
Regression Analysis of Maize Supply Function
Results of regression analysis of the maize supply function was shown in Table 3 be low. The both model have high adjusted R2, i.e 0.87. The F-test significance on = 1% and the maize supply function free from multicolinearity, auticorrelation, and heteroscedasticity. The both model showed that maize supply was influenced by climate anomaly occurance.
Table 3. Regression Analyses of Maize Supply Function With dummy variable With SOI value
Independent Variable Coefficient t-statistic t-table Coefficient t-statistic t-table Constant 2,24 0,83 1,28 3,95 1,37 1,28 Ln maize price (t-4) 0,71** 2,04 1,64 0,68* 1,90 1,28 Ln groundnut price (t-1) -0,87*** -2,75 2,32 -0,88** -2,58 1,64 Ln maize harvested area 0,79*** 17,10 2,32 0,82*** 19,61 2,32 Ln urea price -0,45 -1,31 1,28 -0,35 -1,00 1,28 Ln ploughing wage 1,05*** 2,86 2,32 0,70** 2,19 1,64 Maize supply (t-1) 0,35** 2,32 1,64 0,38** 2,29 1,64
Adjusted R2
0,87
0,87 F statistic 209,97*** 232,52*** F table 2,41 2,51
Source: Analysis of Secondary Data, 2008 Note: *) significance on = 10%; **) significance on = 5%; ***) significance on = 1%
3rd GEN Network and 4th Rispescia International Seminar Sustainable Bio-resources for Global Welfare
21
The t-test for independent variables showed that maize price 4 quarters ago, groundnut price 1 quarter ago, harvested area of maize, agricultural wage for ploughing, and maize supply 1 quarter ago influenced significantly on maize supply in Java Island. Dummy variable for La Nina occurance influenced significantly on maize supply, and so did the SOI value. Retail price of urea fertilizer and dummy variable of El Nino occurance didn’t influenced the maize supply.
The maize price 4 quarters ago influenced positively on maize supply, that 1% increase on maize price 4 quarters (1.33 years) ago would increase maize supply 0.68%, vice versa. The higher maize price more than 1 year ago made the farmers decide to plant maize. This made the maize production increase, and so did its supply.
In the case of planting area, groundnut was considered as maize substitute plant because the both plants can be planted on t he dry land. The groundnut price 1 quarter ago influenced negatively on maize supply, which was 1% increase in groundnut price would decrease the maize supply 0.87%, vice versa. The increasing groundnut price would attract farmers, so that they would more interested to plant groundnut. Thus, the maize production would decrease, and so did the maize supply.
The harvested area of maize influenced positively on maize supply in Java Island. The 1% more on harvested area of maize would increase maize supply 0.79%, vice versa. The wider harvested area usually followed with higher production quantity. Thus, the maize supply would also increase.
Agricultural wage for ploughing influenced positively on maize supply. Every 1% increasing on pl oughing wage would increase t he maize
supply 0.70% , vi ce ve rsa. T he increasing in agricultural wage, especially ploughing, would make the farmers manage the maize farming in better way to get more yield. The higher production was expected would give higher income as the compensation for increasing in input cost. The better farming management after the increasing on ploughing wage would increase the maize production, and so did the maize supply.
The maize supply was influenced significantly by La Nina occurance, as shown by significant influence on dummy variable of La Nina occurance and SOI value. The positive sign of dummy variable meant that the La Nina occurance can increase the maize supply. Based on the elasticity value of SOI variable, the maize supply would increase 0.06 ton or 60 kilogram for every 1 point increasing on SOI value. The maize farming in Java Island usually planted on dry land area with insufficient water. The increasing rainfall in La Nina period can increase the water supply in maize planting area. Thus, the maize production increased and so did its supply, although only in slightly amount.
The maize supply 1 quarter ago influenced positively on maize supply, in which 1% decreasing on maize supply 1 quarter ago would decrease maize supply 0.35%, vice versa. This meant that the farmers decision to plant maize not only influenced by maize price, substitute plant price, input cost, harvested area, and climate condition, but also by maize supply 1 quarter ago.
CONCLUSIONS
El Nino and La Nina climate anomaly decreased the maize production quantity in Java Island in the period of 1987-2006. Production quantity determined supply quantity of maize in farmer stage. El Nino did not impacted on maize supply, while La Nina did. The maize supply in Java Island increased
3rd GEN Network and 4th Rispescia International Seminar Sustainable Bio-resources for Global Welfare
22
when La Nina occured, i.e. maize supply will increase 60 ki lograms for every 1 point increasing in SOI value.
It was needed to improve the irrigation or drainage system in agricultural land, especially in dry land area for maize cultivation. This is because maize have more important role
this recent year and La Nina climate anomaly positively impacted its supply. By better irrigation and drainage system in maize farming, it is expected that the La Nina will be usefull for maize production.
REFFERENCES Ariyanti, D., 2007. Permintaan Jagung
Sebagai Bahan Baku Industri Pakan Ternak di Indonesia.
Thesis. Graduate School, Gadjah Mada University. Yogyakarta, Indonesia.
Debertin, D. L., 1986. Agricultural Production Economics. Macmillan Publishing Company. New York, United States of America.
Agency of Food Security. 2006. General Policy of Food Security 2006-2009. Agency of Food Security. Jakarta, Indonesia.
Direktorat Jenderal Pendidikan Tinggi Departemen Pendidikan dan Kebudayaan, 1991. Kapita Selekta dalam Agrometeorologi. Direktorat Jenderal Pendidikan Tinggi Departemen Pendidikan dan Kebudayaan. Jakarta, Indonesia.
Irawan, B., 2006. Fenomena Anomali Iklim El Nino dan La Nina: Kecenderungan Jangka Panjang Dan Pengaruhnya Terhadap Produksi Pangan. Forum Penelitian Agro Ekonomi (24)1: 28-45.
Irianto, G., dan Suciantini, 2006. Anomali Iklim: Faktor Penyebab dan Karakteristik. Iptek
Tanaman Pangan (2): 101-121. Meiviana, A., D. R. Sulistiowati, dan M.
H. Soejahmoen, 2004. Bumi Makin Panas Ancaman Perubahan Iklim di Indonesia. Kementerian Lingkungan Hidup Republik Indonesia dan Yayasan Pelangi Indonesia. Jakarta,
Indonesia. Mulyana, E., 2002. Hubungan antara ENSO dengan Variasi Curah Hujan di Indonesia. Jurnal
Sains dan Teknologi Modifikasi Cuaca (3)1: 1-4.
Nicholson, W., 1995. Teori Mikroekonomi Prinsip Dasar dan Perluasan Edisi Kelima Jilid I
(Alih bahasa Drs. Daniel Wirajaya). Binarupa Aksara. Jakarta, Indonesia.
Tim Pelaksana Universitas Gadjah Mada, 2001. Studi Antisipasi Dampak El-Nino terhadap Produksi Tanaman Pangan dan Pendapatan Petani. Kerjasama antara Direktorat Jenderal Bina Produksi Tanaman Pangan dan Hortikultura dan Fakultas Pertanian Universitas Gadjah Mada. Yogyakarta, Indonesia.
Utami, Arini W. 2008. Dampak El Nino dan La Nina terhadap Penawaran dan Kesejahteraan Petani Padi dan Jagung di Jawa. Thesis. Graduate Program of Agricultual Sciences, Faculty of Agriculture, Gadjah Mada University. Yogyakarta, Indonesia.
Widarjono, A., 2005. Ekonometrika: Teori dan Aplikasi. Yogyakarta: Ekonisia.
3rd GEN Network and 4th Rispescia International Seminar Sustainable Bio-resources for Global Welfare
23

THE CAPABILITIES OF Fusarium sp. F092 ON CHRYSENE AND CRUDE OIL DEGRADATION UNDER SALINE CONDITION
Asep Hidayat1, Kazutaka Itoh1, Sanro Tachibana1
1. Department of Applied Bioscience, Faculty of Agriculture, Ehime University, Tarumi 3-5-7,
Matsuyama, Ehime, Japan, 790-8566, E-mail : [email protected]
ABSTRACT
Chrysene is low aqueous solubility and promote its accumulation in non-aqueous phase, as consequence become difficult for microbial degrader. As a polycyclic aromatic hydrocarbon (PAH), it is also an important compound consisting in crude oil. In this study, we focused on e valuating on chrysene and crude oil degradation by Fusarium sp. F092 under saline condition. Fusarium sp. F092, a fungus screened from nature, has abilities to growth on agar medium contaminated with chrysene and crude oil. In liquid medium, sea water salinity (35o/oo) has not significant effect on the ability of Fusarium sp. F092 in chrysene degradation. The degradation of chrysene was increased 0.03 and 2.1 fold high at agitated culture (80 rpm) and surfactant (1%), respectively. Furthermore, Fusarium sp. F092 degraded 77% total saturated and aromatic of crude oil at 60 days incubation. Fusarium sp. F092 also converts chrysene to became chrysene 1,2-oxide and chrysene trans-1,2-dihydrodiol. Chrysene trans-1,2-dihydrodiol be further converted to 1-hydroxy 2-naphtoic acid and next step to cathecol via salicylic acid. Key words: Chrysene, Crude oil, Degradation, Fusarium sp. F092, synthetic sea water
1. INTRODUCTION
Petroleum and crude oil represent the single most common environmental contaminant. The spillage of crude oil can damage to the environment and the ecosystem. They contaminate from several accident such as offshore platform and drilling rigs and well accident, transportation accident, seepage and ruptured pipelines, and routine washings of the storage tanker (Chaineau et al., 2005; Tehrani et al., 2006; Elshafie et al., 2007; Hasanuzzaman et al., 2007) . Oil spill was estimated over of 42-100 million US gallons (Pidd, 2010) . These conditions will make serious damage to ecosystem. Crude oil contained saturated, aromatic, NSO and Asphaltene that potent to have carcinogenic and immunotoxic effect.
Polycyclic aromatic hydrocarbons (PAH) are one of the crude oil components and also formed by incomplete combustion
of fossil fuels, coal gasification and liquefaction, incineration of industrial waste, wood treatment and preserve processes, accidental spillage of petroleum hydrocarbon, tobacco smoke, forest fire and farm debris fires (Johnsen et al., 2005; Wang et al., 1999). The environmental fate of PAHs mainly depends on the number of rings in the molecule and environmental factors such as pH, temperature and salinity (Kanaly and Harayama, 2000). PAHs are biodegraded by microorganisms present in soil, sewage and water. They have been found to have a variety of toxic, mutagenic, teratogenic, and carcinogenic on microorganisms. Chrysene is low aqueous solubility and promote its accumulation in non-aqueous phase, as consequence become difficult for microbial degrader.
The ability of microorganisms on degradation of PAHs has been reported
3rd GEN Network and 4th Rispescia International Seminar Sustainable Bio-resources for Global Welfare
24

and also their biochemical pathway of biodegradation (Johnsen et al., 2005; Shuttleworth and Cerniglia, 1995). Several studies reported the mechanism of ring oxidation and also co-metabolism of PAHs (Juhasz et al., 1997; Gibson et al., 1975) and other studies reported that isolated microorganisms such as fungi and bacteria could use some PAHs as the sole carbon source (Kastner et al., 1994; Walter et al., 1991). PAHs and crude oil should be treated because of very harmful or toxic compounds. In this study, we will use biodegradation method to purify pollutant in the environment using fungus screened from nature. It has been shown to be a viable, relatively low cost, low-technology technique and widespread use (Bogan and Lamar, 1996; Kang and Oulman, 1996; Vidali, 2001). In this study, we focused on evaluating the ability of Fusarium sp. F092 in chrysene degradation under saline condition; to investigate the several treatments such as agitated culture, and addition of surfactant to enhance degradation rate; and to evaluate the ability of Fussarium sp. F092 in C heavy oil degradation also under saline condition. 2. Material and methods 2.1 Chemical. 2,4,8 TCDF (tetrafuran), 4-CB (chlorobiphenyl) were purchased from TCI. Co. Ltd (Osaka, Japan). Chrysene, agar, glucose, wakogel S-1 silica gel and other chemical were purchased from Wako. Co. Ltd (Osaka, Japan). Thin layer chromatography (TLC) aluminium sheet (silica gel 60 F254, 20x20 cm) were obtained from Merck (Darmstadt, Germany). Synthetic of sea water was obtained from Delphis (Osaka, Japan). C heavy oil was obtained from Taiyo Petroleum Co. Ltd (Japan). 2.2 Fungus strain and inoculum preparation. Fusarium sp. F092, isolated from soil, was used as fungus degrader in our studies. For preparation of the inoculums, fungus was grown on m alt extract agar medium (malt extract 20 gl-1, glucose 20 gl-1, agar 20 gl-1, polypeptone 1
gl-1) at 25 C for several days and maintained at low temperature 4 C. 2.3 Culture preparation. Chrysene degradation: Liquid culture experiments were conducted in Erlenmeyer flasks containing of malt extract (ME) liquid medium. ME liquid medium was supplemented with 35 gl-1 of synthetic sea water. Medium was sterilized for 20 min at 121 C and then three 5 mm disk obtained by punching out from an actively growing fungus. After pre-incubating, each inoculated flasks were supplemented with 1 mM of chrysene and then incubated in the dark condition at 25 C. Control experiments have been performed on Erlenmeyer flasks only containing 20 m l of malt extract (ME) liquid medium containing 1 m M of chrysene without inoculated fungus. Crude oil degradation: The liquid culture experiments were conducted in Erlenmeyer flasks containing of potato glucose medium (PGM) with composition potato 500 g l-1, glucose 20 g l-1, yeast extract 5 g l-1 and added by sea water (35 g l-1 of synthetic sea powder in distilled water). The fixed concentration of C heavy oil dissolved with n-hexane was added in the culture. After the solvent evaporated and over night stand in a clean bench, three 5 mm disk actively growing fungus F092 in agar plate were inoculated into the Erlenmeyer culture. The culture was incubated for 15, 30 a nd 60 da ys in the dark condition at 25 C. 2.4 Analytical methods. Chrysene residues were quantified after fixed time (15 and 30 da ys). The culture flask was acidified with 5 ml 1 N HCl and added with 2,4,8 T CDF. The initial extraction was conducted by adding the culture with 50 ml of acetone and homogenized at 10000 rpm for 10 m inutes. Samples were evaporated prior to extraction using ethyl acetate by funnel separation. Chrysene adsorbed in the mycelium was extracted with 300 ml ethyl acetate by using a soxhlet apparatus for 16 hour s. Each extract were mixed and evaporated to
3rd GEN Network and 4th Rispescia International Seminar Sustainable Bio-resources for Global Welfare
25

0
25
50
0 10 20 30 40
Time (days)
Deg
rada
tion
(%)
0
25
50
75
100
Uni
t/Lite
r
Chrysene degradation (%)
1,2-Dioxygenase
2,3-Dioxygenase
Fig. 1 The radial growth of Fusarium sp. F092 on agar medium containing chrysene (n=3)
Fig. 2 C hrysene degradation, 1,2-dioxygenase, 2,3 dioxygenase activity (Ul-1) in a liquid medium under saline condition
obtain concentrate extraction. It was added with 4-CB and purified on a chromatography column and then anthracene was added as internal standard followed with analyzed by gas chromatography coupled with mass spectrometer (GG-MS Shimadzu QP-5000). Percent recovery was calculated for chrysene, 2,4,8 TCDF and 4-CB by using standard curve. Total petroleum hydrocarbon concentration was determined by extraction and purification process using several solvent. The culture was extracted with n-hexane, dichloromethane (CH2Cl2) and chloroform (CHCl3), respectively. The soluble combined and then separated into n-hexane insoluble and soluble fractions. The n-hexane insoluble
fraction calls as asphaltenes and some organic compounds. The n-hexane soluble fraction was further separated to obtain aliphatic, aromatic and NSO fraction by purification process with n-hexane, toluene and combination CHCl3 and methanol at ratio 1 : 1 (v/v). The aliphatic and aromatic fractions were analyzed by gas chromatography (GC Shimazdzu G-3000). Aliphatic compound of C heavy oil was analyzed by kovats retention index system (Jennings and Shibamoto, 1980). Pentadecane (C15H32) and hexadecane (C16H34) were subjected in the gas chromatography analysis. The kovats rentention index formulated was compared with reference in order to know a prediction of aliphatic structure.
3 Results
Fusarium sp. F092 was collected and isolated based on its abilities to grow on chrysene agar medium. The ability of Fusarium sp. F092 increased 20% on chrysene agar medium under saline
condition (Fig 1). Furthermore, this fungus was also quantified to degrade chrysene in saline liquid medium. Fig. 2 s howed that chrysene degradation was obtained at level 28% and 40% on 1 5 and 30 da ys, respectively. As the effect of sea water
salinity (35o/oo), the ability of Fusarium sp. F092 on c hrysene degradation was no significant decrease (p < 0.05) on 30 days if compared when this fungus incubated without addition of synthetic sea water (data no shown). 3.1 Effect of Tween80 on chrysene degradation
To investigate the influence of surfactant concentration on c hrysene degradation, Fusarium sp. F092 was incubated in a liquid culture containing 1 mM chrysene and in the four surfactant concentration (Fig. 3). It showed
sequentially increased significantly on chrysene degradation with increasing concentration of surfactant (p < 0.05). Furthermore, the chrysene degradation and the degradation throughout process were significant different (p < 0.05) among of all surfactants concentration tested. Fusarium sp. F092 degraded chrysene 22%, 40%, 59%, and 70% with surfactant concentration 0%, 0.25%, 0.5% and 1% for 30 days, respectively. 3.2 Effect of agitation on chrysene degradation
3rd GEN Network and 4th Rispescia International Seminar Sustainable Bio-resources for Global Welfare
26
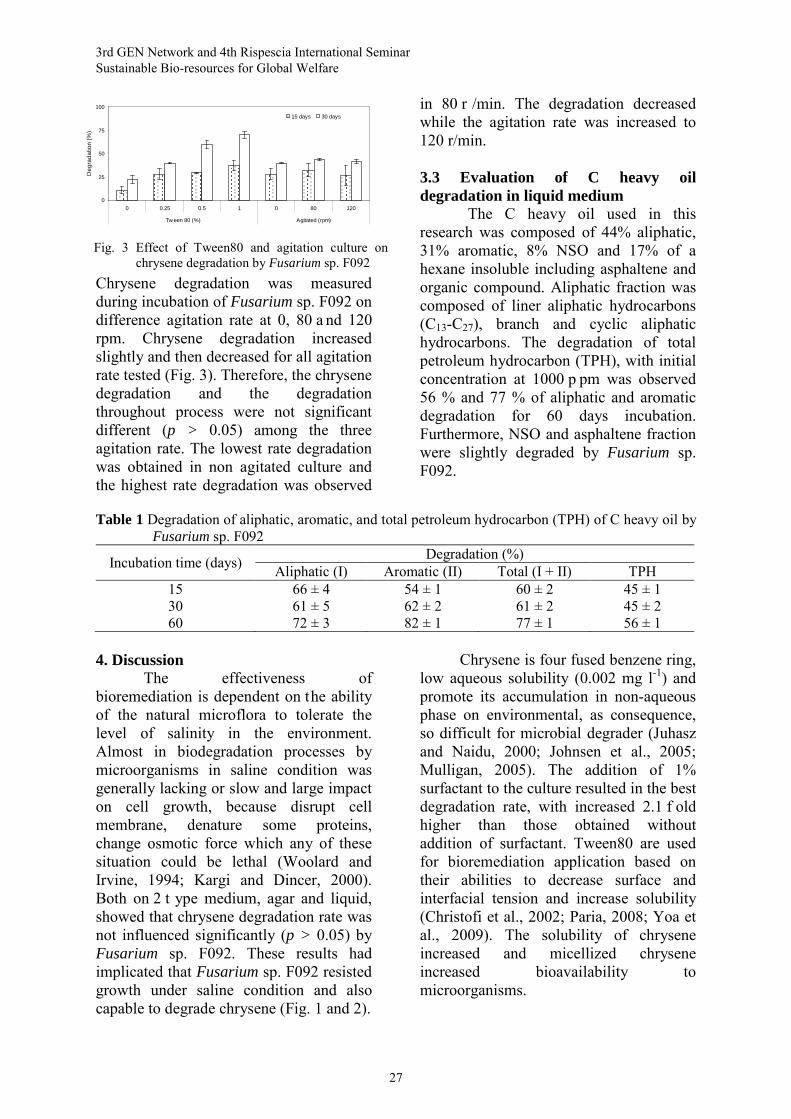
Chrysene degradation was measured during incubation of Fusarium sp. F092 on difference agitation rate at 0, 80 a nd 120 rpm. Chrysene degradation increased slightly and then decreased for all agitation rate tested (Fig. 3). Therefore, the chrysene degradation and the degradation throughout process were not significant different (p > 0.05) among the three agitation rate. The lowest rate degradation was obtained in non agitated culture and the highest rate degradation was observed
in 80 r /min. The degradation decreased while the agitation rate was increased to 120 r/min.
3.3 Evaluation of C heavy oil degradation in liquid medium
The C heavy oil used in this research was composed of 44% aliphatic, 31% aromatic, 8% NSO and 17% of a hexane insoluble including asphaltene and organic compound. Aliphatic fraction was composed of liner aliphatic hydrocarbons (C13-C27), branch and cyclic aliphatic hydrocarbons. The degradation of total petroleum hydrocarbon (TPH), with initial concentration at 1000 p pm was observed 56 % and 77 % of aliphatic and aromatic degradation for 60 days incubation. Furthermore, NSO and asphaltene fraction were slightly degraded by Fusarium sp. F092.
Table 1 Degradation of aliphatic, aromatic, and total petroleum hydrocarbon (TPH) of C heavy oil by
Fusarium sp. F092
Incubation time (days) Degradation (%) Aliphatic (I) Aromatic (II) Total (I + II) TPH
15 66 ± 4 54 ± 1 60 ± 2 45 ± 1 30 61 ± 5 62 ± 2 61 ± 2 45 ± 2 60 72 ± 3 82 ± 1 77 ± 1 56 ± 1
4. Discussion
The effectiveness of bioremediation is dependent on the ability of the natural microflora to tolerate the level of salinity in the environment. Almost in biodegradation processes by microorganisms in saline condition was generally lacking or slow and large impact on cell growth, because disrupt cell membrane, denature some proteins, change osmotic force which any of these situation could be lethal (Woolard and Irvine, 1994; Kargi and Dincer, 2000). Both on 2 t ype medium, agar and liquid, showed that chrysene degradation rate was not influenced significantly (p > 0.05) by Fusarium sp. F092. These results had implicated that Fusarium sp. F092 resisted growth under saline condition and also capable to degrade chrysene (Fig. 1 and 2).
Chrysene is four fused benzene ring, low aqueous solubility (0.002 mg l-1) and promote its accumulation in non-aqueous phase on environmental, as consequence, so difficult for microbial degrader (Juhasz and Naidu, 2000; Johnsen et al., 2005; Mulligan, 2005). The addition of 1% surfactant to the culture resulted in the best degradation rate, with increased 2.1 f old higher than those obtained without addition of surfactant. Tween80 are used for bioremediation application based on their abilities to decrease surface and interfacial tension and increase solubility (Christofi et al., 2002; Paria, 2008; Yoa et al., 2009). The solubility of chrysene increased and micellized chrysene increased bioavailability to microorganisms.
0
25
50
75
100
0 0.25 0.5 1 0 80 120
Tw een 80 (%) Agitated (rpm)
Deg
rada
tion
(%)
15 days 30 days
Fig. 3 Effect of Tween80 and agitation culture on chrysene degradation by Fusarium sp. F092
3rd GEN Network and 4th Rispescia International Seminar Sustainable Bio-resources for Global Welfare
27

Agitation increased contacting area between cell, oxygen and substrate and facilitated interphase mass transfer of PAHs into aqueous phase. With the surfactant present, the iceberg structure is broken up or weakened during agitation process, as result it is easier for PAHs to be transported to the hydrophobic core (Yao et al., 2009). The decreasing of surface and interfacial tension and increasing solubility were thought to be main reason for facilitating the transport and degradation of hydrocarbon, as proven in our result showed in Fig. 3. The suitable agitated culture is important for ensuring good mixing, among nutrients supply required growth of microorganisms and facilitating mass transfer without shear stress on mycelia, as consequence degradation rate increased.
A proposed pathway that includes the ethyl acetate-extractable metabolites produced from chrysene by culture of Fusarium sp. F092 was investigated previously. Chrysene have converted by Fusarium sp. F092 to be formed chrysene 1,2-oxide and chrysene trans-1,2dihydrodiol. Furthermore, Fusarium sp. F092 attacked chrysene trans-1,2-dihydrodiol became 1-hydroxy 2-napthoic acid. Salicylic acid was further produced via the formation of cathecol after the aldose and hydroxylase reaction, tran-o-hydroxybenzylidenepyruvate (tHBPA) which next mineralized to carbon dioxide and water.
The degradation rate of aliphatic and aromatic fraction was observed on 77%. Other hand NSO and asphaltene fractions were slightly degraded by Fusarium sp. F092. The hexane insoluble fraction contained asphaltene and polar molecules have been shown to be partially or completely resistant to microbial assimilation and maximum degradation in optimal culture about 15-20% (Chaineau et al., 2005).
Microbial degradation of crude oil often occur by attack on alkanes or light aromatic fraction, while the high
molecular weight aromatic, resin and asphaltene are considered recalcitrant (Lal and Khanna, 1996). It is often difficult to find organisms that will individually degrade all the faction of crude oil (Obayori et al., 2009). In nature, biodegradation of crude oil typically involves a succession of species within the consortia of microbes present (Venosa and Xueqing, 2003; Obayori et al., 2009). The biodegradation of alkanes was usually in the order linier>branched>cyclic indicated a preferential order in the assimilation of carbon sources (Chaineau et al., 2005). Alkanes in the C10-C26 range are considered the most rapidly degradable components. The predominant mechanism of n-alkane degradation involves terminal oxidation to corresponding alcohol, aldehydes, or fatty acid functional groups. Branches alkanes are less rapidly degraded in comparison to n-alkanes (Venosa and Xueqing, 2003).
Acknowledgements This research was partly supported by KAKENHI - Japan (20580178). References Bogan B W, Lamar R T, 1996. Applied
and Environmental Microbiology, 62: 1597-1603.
Chaineau C H, Rougeux G, Yepremian C, Oudot J, 2005. Soil Biology and Biochemistry, 37: 1490-1497.
Christofi N, Ivshina I B, 2002. Journal of Applied Microbiology, 93: 915-929.
Elshafie A, Alkindi A Y, Al-Busaidi S, Bakheit C, Albahry S N, 2007. Marine Pollution Bulletin, 54: 1692-1692.
Gibson D T, Venkatanayarana M, Jerina D M, Yagi H, Yeh H, 1975. Science, 189: 295–297.
Hasanuzzaman M, Ueno A, Ito H, Ito Y, Yamamoto Y, Yumoto I, Okuyama H, 2007. International Biodeterioration and Biodegradation, 59: 40-43.
3rd GEN Network and 4th Rispescia International Seminar Sustainable Bio-resources for Global Welfare
28

Jennings W, Shibamoto T, 1980. Qualitative analysis of flavor and fragrance volatiles by glass capillary gas chromatography. Academic Press, Inc, New York
Johnsen A R, Wick L Y, Harms H, 2005. Environmental Pollution, 133: 71-84.
Juhasz A L, Britz M L, Stanley G A, 1997. Journal of Applied Microbiology, 83: 189–198.
Juhasz A L, Naidu R, 2000. International Biodeterioration and Biodegradation, 45: 57-88.
Kanaly R A, Harayama S, 2000. Journal of Bacteriology, 182: 2059–2067.
Kang S –H, Oulman C S, 1996. Journal of Environmental Engineering, 122: 384-387.
Kargi F, Dinçer A R, 2000. Water Environmental Research, 72: 170-174.
Kastner M, Breuer-Jammali M, Mahro B, 1994. Applied Microbiology and Biotechnology, 41: 267–273.
Lal B, Khanna S, 1996. Journal of Applied Bacteriology, 81: 355-362.
Matsubara M, Lynch J M, De Leij F A A M, 2006. Enzyme and Microbial Technology, 39: 1365-1372.
Obayori O S, Sunday A A, Adam O A, Ganiyu O O, Odunola O O, Rashid A A, Mutthew O I, 2009. Journal of Environmental Science, 21: 243-248.
Paria S, 2008. Advances in Colloid and Interface Science, 138: 24-58.
Pidd H, 2010. http://www.guardian.co.uk/environment/ 2010/jun/11/bp-oil-spill-estimates-double.
Shuttleworth K L, Cerniglia C E, 1995. Applied Biochemistry and Biotechnology, 54: 291–302.
Tehrani D T, Herfatmanesh A, Dehkordi F A, Minooi S, 2006. Pakistan Journal of Biological Science, 9: 1531-1535.
Venosa A D, Xuaqing Z, 2003. Spill Science and Technology Bulletin, 8: 163-167.
Vidali M, 2001. Pure and Applied Chemistry, 73: 1163-1172.
Walter U, Beyer M, Klein J, Rehm H J, 1991. Applied Microbiology and Biotechnology, 34: 671–676.
Wang Z, Fingas M, Shu Y Y, Sigouin L, Landriault M, Lambert P, 1999. Environmental Science and Technology, 33: 3100–3109.
Woolard C R, Irvine R L, 1994. Water Environmental Research, 66: 230-235.
Yao C, Jin S, Shen X, Chen S, Zhang C, Sun Y, 2009. Journal of Hazardous Materials, 164: 195-203.
3rd GEN Network and 4th Rispescia International Seminar Sustainable Bio-resources for Global Welfare
29

SILVICULTURE OF COMMUNITY FOREST FOR ADAPTATION OF GLOBAL-ENVIRONMENT ISSUES: BETWEEN PRODUCTIVITY,
CONSERVATION AND PEOPLE PROSPERITY
Budiadi1, Dwiko B. Permadi, Singgih Utomo Faculty of Forestry, Universitas Gadjah Mada, Yogyakarta 55281, INDONESIA
1E-mail: [email protected]
ABSTRACT
The rate of forest degradation and number of people depend on forest resources in Indonesia will affect global livelihood. Java island has the biggest livelihood problem due to 69% of people are living in 6% of total Indonesia land area, where state forest only covers about 20%. This paper reviews technical options of community forest (CF, forest developed and owned by communities) for alleviating environmental issues. Development of CF in Java (constitute 50% of CF area in Indonesia) is promising for complementing the role of state forests. Javanese CF covered 651,204 ha in 2007, compared to degraded-state forest 1,767,304 ha; produced greater timber (e.g. teak 2-3 times greater, although with low quality) than state-forests, contributed up to 60% to farmers’ income. However, CF management has changed plantation pattern with less number of tree species (i.e. teak, mahogany, albizia or Acacia auriculiformis), resulting tree domination to crops and threatening food production. Traditional tebang butuh selective cutting is questioned to sustain timber production because stand structure is dominated by medium-big tree size, and less seedling and soil-seed bank for regeneration source. Selective cutting at optimum age and dynamic tree-crop combination should be applied to replace tebang butuh system. Spatial arrangement, thinning (for productivity), pruning (for timber quality), and promotion of natural regeneration should be practiced to develop multi-strata CF ecosystems. Nevertheless, current observed carbon accounting data will be valuable if incentive scheme for carbon conservation is adopted for CF farmers. Keywords: population growth, forest degradation, community forest, productivity, silvicultural solution, Java, Indonesia
BACKGROUND
Tropical forests of Indonesia are not only an important part for local livelihood, but also for regional and global interests especially in mitigating global warming in the near future. However, their significant role is experiencing serious problems. Though huge areas, counted for 120,35 million ha (Ministry of Forestry, 2009), their current status is so degraded due to deforestation, uncontrolled illegal logging, illegal mining, land occupation, and forest fire. Its deforestation rate is about 1 – 1,9 million ha per year during
2000 – 2005 (Ministry of Forestry, 2009). Moreover, the number of forest dependent people who live in forest areas is accounted for 40 – 65 million people, but if we calculate people that directly and indirectly depending on forest products and services the number will double (Fisher et al, 1997). Obviously, it is a huge number to potentially harm and threaten the forests more severely and in the end of the day environmental problem is still becoming problematic issues for the next decades.
3rd GEN Network and 4th Rispescia International Seminar Sustainable Bio-resources for Global Welfare
30

Comparing to the other part of Indonesia archipelago, Java is the most threatened island especially regarding environmental and quality of life for people live in (Ref). The majority of Indonesian people (69%) live in only 6% of Indonesia areas (Statistic Bureau of Indonesia, 2009). Consequently, forest areas in Java are less than 30% after long exploitation since colonial era and developing plantation estate for agricultural products in mid nineteen century (Simon, 2000). This small area is not the real number because many part of the areas has already degraded, plantation forest failure has occurred repeatedly (Simon, 2000).
On the other hand, forests cultivated in the private land have grown considerably and managed individually as tree farming in the hilly and dry land due to government policy, market, and infrastructure development (Fillius, 1997). The role of community forests to fuelwood consumption has recognized since 1976 (Simon, 2010) as well as other function such as to support life system and environmental sustainability. Despite their significant roles, some technical and managerial problems require solutions, such as how to improve the productivity or
traditional management system of community forests. This paper aims to analyze the development of community forests in Java and their role to complement and support forest functions, and the opportunity to induce community forests more sustainable by interfering with silviculture technique. Population growth and forest degradation in Indonesia Forest degradation in Indonesia cannot be separated with the development of population growth rate that is 2% per year causing decrease in land carrying capacity to support quality of life (Simon, 2000). Unequal distribution of Indonesian people, concentrated only in Java Island (Figure 1), has also brought about environmental degradation more severe especially in the very densely populated areas. With the population density reaching up to 1000/km2 and the high population growth rate (1,58% per year), Java island is becoming vulnerable areas due to human needs. It is a relevant issue to conclude that discussing environmental problems should take into account the forest degradation and the population increase in the context of Java Island.
Pop
ulat
i Sumatra Java Bali-
Growth
3rd GEN Network and 4th Rispescia International Seminar Sustainable Bio-resources for Global Welfare
31

Figure 1. Population distribution and growth rate in main islands in Indonesia, with distinguishable condition number of people per unit area in Java Island (Statistical Bureau of Indonesia, 2009)
Beside, vegetation covers in the big islands of Indonesia have decreased especially when forest concessionaries had been introduced since 1970s. In Java, vegetation covers decreased under the national average rate compared to year 1950s. The awareness to recover land degradation occurred in 1970s with the regreening program induced by government policy in the new order regime. Gradually, the program has evolved outside degraded state forest land including in private land. Nowadays, this forested land is called community forests (Figure 2) (MoF, 2009).
According to Ministry of Environmental (MoE, 2009) state forest in Java covers only 7% of total Java island. The remaining areas of state forests are still degraded, bare, and without trees. It totally differs from other island outside Java, so that this problem requires different approach to handle, as well as how to deal with social economic problems. Different data of forest cover are shown by Ministry of Forestry. It is stated that forest areas in Java still 19,4% of total island (MoF, 2009). Both data are not contradictory since MoF data refers to legal status of forest area, while MoE bases on vegetation cover of state forests. Therefore, based on the practical use, vegetation cover is more relevant and important information in which the actual un-forested areas are known, than only legal status of forest areas. Community forest development in Java Regarding with the importance of community forests in high populated island of Java, ecologist and social scientists strongly emphasized the
development of community forest for complementing function of state forest. On Ministry of Forestry (MoF) data (2008) 50% of community forests area in Indonesia has established in Java. Most of Javanese farmers take optimizing small land area with woody trees establishing such a forest-like ecosystem into account, like dry land and home garden (Budiadi, 2008). Various data showed the high rate of adoptability of community forest to Javanese farmers in the two decades, increasing from 1.67 Million ha (1995), to 1.87 million ha (1997) and reaching 2.52 million ha (2008) (Poffenberger 2006; MoF, 2008). In productivity point of view, Javanese community forest contributed to significant amount of farmer’s income (Cahyono et al. 2002; Riva 1997; Darusman and Harjanto 2006; Sitanggang 2009; Hardjanto 2001). Community forest in Java produced significant volume of timber higher than state forest, e.g. in Central Java timber production was recorded more than 15 million m3 in 2008, where more than 90% produced from community forest (MoF, 2009). Regarding with vast adoptability of community forest and land cover, to solve the environmental and people prosperity problems in Java will be strongly relied on community forest. In the view of land cover, forested area both in state- and community-forest in 2007 has been approached more than 30% of total Java island (data analyzed from Poffenberger 2006; MoF 2008) (Figure 3). It is, therefore, community forest in Java which plays important role for environment stability, timber supply and people prosperity, needs special concern and management.
3rd GEN Network and 4th Rispescia International Seminar Sustainable Bio-resources for Global Welfare
32
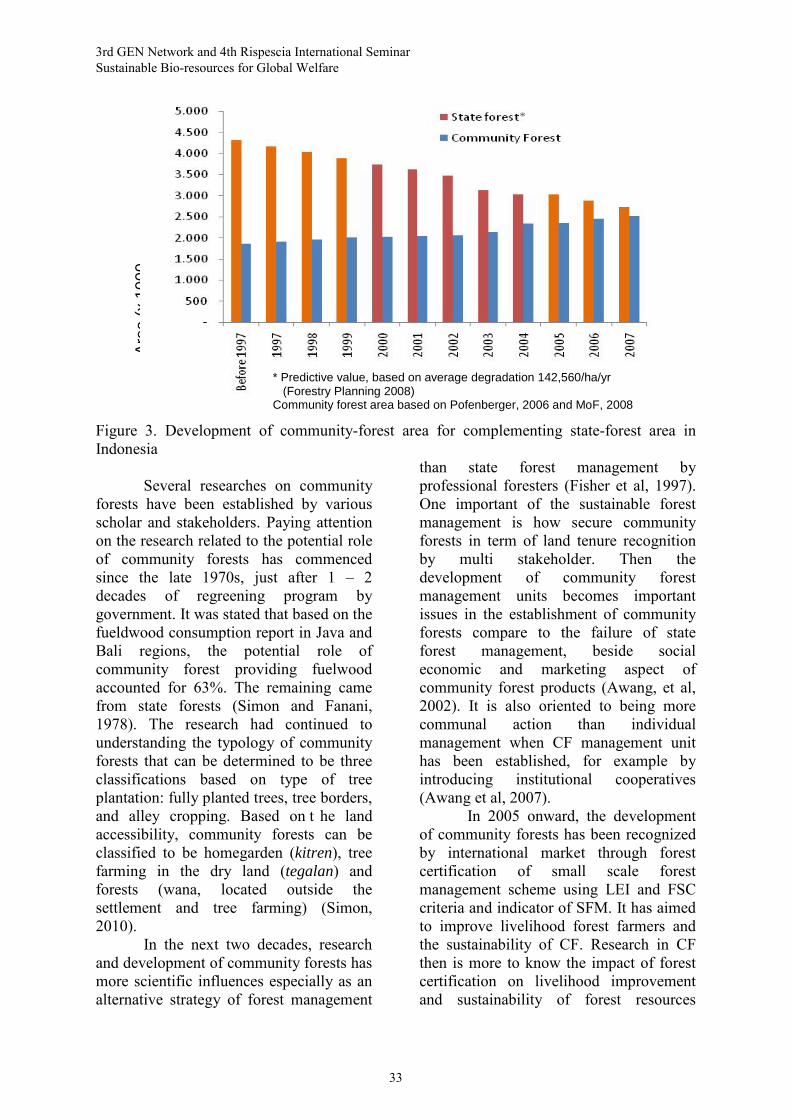
Figure 3. Development of community-forest area for complementing state-forest area in Indonesia Several researches on community forests have been established by various scholar and stakeholders. Paying attention on the research related to the potential role of community forests has commenced since the late 1970s, just after 1 – 2 decades of regreening program by government. It was stated that based on the fueldwood consumption report in Java and Bali regions, the potential role of community forest providing fuelwood accounted for 63%. The remaining came from state forests (Simon and Fanani, 1978). The research had continued to understanding the typology of community forests that can be determined to be three classifications based on type of tree plantation: fully planted trees, tree borders, and alley cropping. Based on t he land accessibility, community forests can be classified to be homegarden (kitren), tree farming in the dry land (tegalan) and forests (wana, located outside the settlement and tree farming) (Simon, 2010). In the next two decades, research and development of community forests has more scientific influences especially as an alternative strategy of forest management
than state forest management by professional foresters (Fisher et al, 1997). One important of the sustainable forest management is how secure community forests in term of land tenure recognition by multi stakeholder. Then the development of community forest management units becomes important issues in the establishment of community forests compare to the failure of state forest management, beside social economic and marketing aspect of community forest products (Awang, et al, 2002). It is also oriented to being more communal action than individual management when CF management unit has been established, for example by introducing institutional cooperatives (Awang et al, 2007). In 2005 onward, the development of community forests has been recognized by international market through forest certification of small scale forest management scheme using LEI and FSC criteria and indicator of SFM. It has aimed to improve livelihood forest farmers and the sustainability of CF. Research in CF then is more to know the impact of forest certification on livelihood improvement and sustainability of forest resources
* Predictive value, based on average degradation 142,560/ha/yr (Forestry Planning 2008) Community forest area based on Pofenberger, 2006 and MoF, 2008
Are
a (x
100
0
3rd GEN Network and 4th Rispescia International Seminar Sustainable Bio-resources for Global Welfare
33

(Rohman, 2010). Furthermore, the research has also been orientated to solve some technical problems encountered by traditional community forests farmers and the role of global climate change problems especially related to community carbon accounting. Regardless high adoptability of community forest in Java, the development of community forest in Java has several weaknesses that scientifically should be taken into account. Traditional and individual management, and less scientific intervention, especially silvicultural improvement, are of the most weaknesses in Javanese community forest management that affecting low productivity and timber quality. Possible impose of traditional community forest management are (Figure 4):
1. Farmers are affected by timber market, that stably increase, resulting domination of wood on seasonal crops. Farmers converted seasonal crop farm to woodlots, affecting less food production and food severity. Most of woodlots are planted in monoculture system with less ecological function.
2. Low competency in wood silvics and physiology affecting less concern on tree to tree competition. Farmer concerns on agronomy but less educated on silviculture, and producing less timber productivity.
3. Seasonal cropping season is changed to long-term farming system, and therefore, short-term income will be affected, although timber end-value will be potentially higher.
Figure 4. Positive and negative impacts of community-forest development in Java
Problems on Traditional Community Forest Management 1. Traditional tebang butuh system in
community forest management is a cutting system applied to individual
tree of under or over optimum ages (Figure 5). The system produced low quality timber, less value added to farmer and unsecure to environment.
3rd GEN Network and 4th Rispescia International Seminar Sustainable Bio-resources for Global Welfare
34

Figure 5. Curve of tree growth and tebang butuh selective cutting in community forests in Java 2. Patchiness is a s pecial characteristics
of community forest or agroforest management (Nair 1993), which each farmer practices different low standardized tradition and technique. Community forests are practiced in diverse area and varies plantation pattern namely pekarangan/home garden, tegalan/dry land and alas/forest.
3. Traditional silvicultural technique affecting: a. Abnormal stand structure
(reflecting J type), no management on regeneration and improvement (Budiadi 2008)
b. Low productivity due to no thinning practiced and spatial arrangement
c. Low quality timber due to no individual tree treatment such as pruning
d. Low sustainability, that affected by no biomass and nutrition management (Utomo, 2008; Hartanto 2008; Budiadi 2010)
Solution and Silvicultural Recommendation in Community Forest Management
Possible silvicultural techniques in community forest should be lead to 5 (five) recommended areas: 1. Improvement of stand structure, for
converting J type to L type, which the stands are dominated by young trees and less dominated by old trees
2. Improvement of high quality regeneration will secure future stand production
3. Dynamic plantation pattern, changing from irregular trees-along border and random mixture to alternate rows with regular initial spacing (Budiadi 2008)
4. Application of selective cutting system to mature trees, to ensure regeneration and spatial arrangement, resulting high diversity and multi-stratum stands
5. Biomass and nutrition management, through pruning-lopping and improve resources sharing
Silvicultural application will be ensure production sustainability in future stands, and improve environmental services if the community forests are integrally managed by group of communities. Integrated community forest management has been initiated in the last few years to alleviate the weaknesses of traditional community forest management (Bao Huy 2006) with special interest to establish micro-economy institution in
3rd GEN Network and 4th Rispescia International Seminar Sustainable Bio-resources for Global Welfare
35

Gunung Kidul district to reduce negative impacts of tebang butuh cutting system (Rohadi…). Nevertheless, economic and ecological value can be increased if incentive mechanism for farmers on water catch and carbon sequestration is implemented in future community forest management in Java. References Awang, SA, W. Andayani, WT WIdayanti, B
Himmah (2002) Hutan Rakyat: Sosial Ekonomi dan Pemasaran. Penerbit: BPFE, Yogyakarta.
Awang, SA (2008) Deforestasi dan Konstruksi
Pengetahuan Kehutanan Berbasis Masyarakat. Pidato Pengukuhan Guru Besar Fakultas Kehutanan UGM, Yogyakarta.
Bao Huy (2006) Technical guidelines –
Community Forest Management. Extension and Training Support Project for Forestry and Agriculture in the Uplands (ETSP), Hanoi, Vietnam
Budiadi (2008) Tunjauan suksesi dan dan
regenerasi hutan rakyat. Prosiding Seminar Pendidikan Agroforestry sebagai Strategi Menghadapi Pemanasan Global: 29-37. Fakultas Pertanian Universitas Sebelas Maret, Surakarta.
Budiadi (2010) Peran sistem agroforestry
dalam mitigasi karbon: membangun metode pengukuran tingkat dekomposisi seresah. Prosiding Seminar Nasional Agroforesty II: 141-146. Universitas Mataram, Nusa Tenggara Barat.
Cahyono, SA, Nugroho NP, Jariyah NA
(2005) Tinjauan faktor kelayakan, keuntungan, dan kesinambungan pada pengembangan hutan rakyat. Info Sosial Ekonomi : Volume 5 No.2 ; Halaman 99-107
Darusman D. dan Hardjanto (2006) Tinjauan
Ekonomi Hutan Rakyat.
PROSIDING Seminar Hasil Penelitian Hasil Hutan : 4-13
Filius, A.M (1997) Factors Changing Farmer’s
Willingness to Grow Trees in Gunung Kidul (Java, Indoensia). Nederland Journal of Agricultural Science 45, p. 329 – 345.
Fisher R.J., Somjai Srimongkontip, Cor
Veer, Michael Victor, Nitiya Kijtewachakul (1997) People And Forests In Asia And The Pacific: Situation And Prospects. Regional Office for Asia and the Pacific, Bangkok. Forestry Policy and Planning Division, Rome.
Hardjanto (2001) Kontribusi Hutan Rakyat
terhadap Pendapatan Rumah Tanggal Di SUB DAS Cimanuk Hulu. Jurnal Manajemen Hutan Tropika Vol. VII No. 2 : 47-61
Hartanto D (2008) Laju dekomposisi seresah
gamal (Gliricidea sepium (Jacq) Kunth ex Walp) dan ketela pohon (Manihot utilisima Pohl) pada berbagai bentuk penggunaan lahan. Skripsi. Fakultas Kehutanan UGM, Yogyakarta
Ministry of Environment (2009) Status
Lingkungan Hidup Indonesia 2008, Bab 4 H utan dan Lahan p 42 -67. Kementrian Negara Lingkungan Hidup, Jakarta, Indonesia
Ministry of Forestry (2009) Forestry Statistics
of Indonesia 2008. Ministry of Forestry, Jakarta, Indonesia
Poffenberger, M. (2006) People in the forest:
community forestry experiences from Southeast Asia. Int. J. Environment and Sustainable Development, Vol. 5, No. 1: 57
Riva, W.F. 1997. Pengelolaan Kebun
Campuran Tradisional dan Kontribusinya terhadap Pendapatan Rumah Tangga: studi kasus di Kampung Naga Salawu Tasikmalaya Jawa Barat. Makalah Seminar Hasil-
3rd GEN Network and 4th Rispescia International Seminar Sustainable Bio-resources for Global Welfare
36

Hasil Penelitian Kehutanan Masyarakat, 4 November 1997. Fakultas Kehutanan IPB.
Rohman, N (2010) Kajian Dampak Sertifikasi
Pengelolaan Hutan Berbasis Masyarakat Lestari di Gunung Kidul. Tesis S2 Magister Ilmu Lingkungan, Universitas Diponegoro.
Simon, H (2000) Pengelolaan Hutan Bersama
Rakyat, Teori dan Aplikasi pada Hutan Jati di Jawa. Penerbit: Bigraf. Jogyakarta.
Simon, H (2010). Dinamika Hutan Rakyat di
Indonesia. Penerbit: Pustaka Pelajar, Jogyakarta.
Sitangang, PH (2009) Manfaat Ekonomi
Sistem Pengelolaan Hutan Rakyat (Studi kasus Desa Marubun Pane, Kecamatan Tigarunggu, Kabupaten Simalungun). Skripsi. Fakultas Pertanian, Universitas Sumatra Utara, Medan.
Utomo, S (2008) Laju dekomposisi seresah
johar (Cassia siamea Lamk.) dan kedelai (Glicine max (L.) Merill ) pada berbagai bentuk pemanfaatan lahan. Skripsi. Fakultas Kehutanan UGM, Yogyakarta
3rd GEN Network and 4th Rispescia International Seminar Sustainable Bio-resources for Global Welfare
37

DESIGN OF A SUSTAINABLE GREENHOUSE STRUCTURE FOR THE TROPICAL REGIONS: APPLYING COMPUTATIONAL FLUID
DYNAMICS METHODS
Erizal1, Herry Suhardiyanto1, Yayu Romdhonah2
1Faculty of Agricultural Engineering and Technology, Bogor Agricultural University (IPB) FATETA-IPB, Kampus IPB Dramaga, Bogor, 16680, Indonesia,
Telephone: 0251-8622713, Email: [email protected] 2Master student of IPB Graduate School, Kampus IPB Dramaga, Bogor 16680 Indonesia
ABSTRACT
In the future, greenhouses in Indonesia will be used not only in vegetable and ornamental crop production but also in the production of plant seedlings, either from seed or through tissue culture procedures. Specific structure should be designed according to its humid tropical climate. The purpose of this project is to simulate the existing greenhouse at Bogor Agricultural University using Computational Fluid Dynamics (CFD) methods in order to investigate the greenhouse environment and identify necessary design considerations for an environmentally and economically sustainable greenhouse for the humid tropics. The CFD model predicted temperature and airflow distributions of the greenhouse. The visual representations of the airflow distributions in the greenhouse were created via contours and presented.
Keywords: airflow, CFD, design, greenhouse, simulation, temperature, tropics
INTRODUCTION
The growing of plants in greenhouses is essentially subtropics phenomenon. It is not, however, a new phenomenon in the tropics. Greenhouses have in recent years become widely used for crop production in tropical countries such as Indonesia whether for vegetables, fruit or ornamentals. In the future, greenhouses in Indonesia will be used not only in vegetable and ornamental crop production but also in the production of plant seedlings, either from seed or through tissue culture procedures.
For that reason, adapted structures for Indonesia are needed. The temperate greenhouses i.e. quonset or tunnel type structure and glass-covered greenhouse are not suitable for the region since they resulted in high in-house temperature
causing plant stress that eventually reduced the crop yield. Otherwise, active control like exhaust fans and fogging system had to be used to maintain the desired temperature and humidity which resulted in high operational cost (Suhardiyanto and Romdhonah, 2007).
Several tropical greenhouse structures have been proposed (Campen, 2005; Kamaruddin et al., 2006; Harmanto et al., 2006; Impron et al., 2007). There is always space for improvement to provide the optimum environment for the plants inside the greenhouse. This effort can be best done using computational fluid dynamics (CFD). CFD is an advanced technique for design in engineering. CFD has been used for closed greenhouses (Boulard et al 1999) and for greenhouses with natural ventilation (Mistriotis et al., 1997, Karcia et al 1998; Lee and Short,
3rd GEN Network and 4th Rispescia International Seminar Sustainable Bio-resources for Global Welfare
38

2000; Lee at al., 2000; Barzanas et al, 2001; Pontikakos et al 2006). With CFD simulation, it is possible to predict the inside air temperature and to see the air flow before the greenhouses are built (Reichratch et al., 2002; Pontikakos et al., 2005).
The aim of this study was to simulate the existing greenhouse at Bogor Agricultural University using Computational Fluid Dynamics (CFD) methods in order to investigate the greenhouse environment and analyze the components necessary to create a sustainable greenhouse, in terms of optimum greenhouse environmental condition at a low operational cost, for the humid tropical regions like Indonesia. The commercially available CFD code Solidworks® was used for the simulation of a standard peak greenhouse design. The simulation will give understanding on the mechanism of greenhouses structures reacts to the surrounding environment. MATERIAL AND METHODS
Experimental Field
The measurements were conducted in February 2010 in an empty standard peak type greenhouse with roof and sidewall ventilation covered with wire screen (porosity 0.64) located at IPB university farm, Indonesia. The E-W oriented greenhouse was a 150 m 2 single-span greenhouse (width, 8 m; length, 18.75 m; ridge height, 7 m; eaves height, 4.130 m), covered with a 0.8-mm thick polycarbonate Solar Tuff®. Parameters measured were macro and micro climate of the greenhouse. Air temperature, relative humidity, wind speed and its direction, solar radiation, and precipitation were measured using weather station and its console, while roof temperature, inside air temperature, side wall temperature, floor temperature, relative humidity of the greenhouse were measured with
thermocouples and a data logger. These experimental data were used not only to provide input data for the model, but also for its validation.
Greenhouse Simulation Model
The geometry of the greenhouse was built in Solidworks® Office Premium 2010 x64 edition (Serial No. 9000 0078 3094 0176 64N 9 XP9B) and the greenhouse environment was simulated in its Flow Simulation 2010 SP4.0 Build: 1299. The program uses the finite volume method to numerically solve the Navier–Stokes equations, i.e., the mass, energy and momentum balances, permitting the calculation of air velocity and temperature fields.
A three dimension simulation model was created for the experimental greenhouse. The computational domain for the greenhouse model was created with the following dimensions: five times the length of the greenhouse in the windward and leeward directions, and also five times the height of the ridge, ensuring that the domain boundaries had a negligible effect on the flow in the vicinity of the greenhouse (Richards P J; Hoxey R P., 1992).
The size of the model was significantly limited by the available computer memory and processor speed. In this research the computer used was a PC with Intel ® Core ™ i7 CPU; 8GB RAM; and 64-bit Operating system. In the simulations, two common net porosity cases were investigated. For the boundary conditions, floor and the roof were set as real wall with temperatures as in Table 1. The simulations were conducted only for low wind speed as to investigate the effect of thermal and wind forces ventilation on the greenhouse microclimate. Internal analysis was chosen for the flow simulation. Table 1 gives all input data for the simulations.
3rd GEN Network and 4th Rispescia International Seminar Sustainable Bio-resources for Global Welfare
39

Table 1. Input data for the simulations
CASE Input Data
Initial Conditions Boundary Conditions Porous Medium
1 Wind speed 0.4 m/s Outside air temperature 32.4⁰C Relative Humidity 68 % Solar Radiation 1002 W/m2
Floor temperature 42.5⁰C South Roof temperature 34.82⁰C North roof temperature 38.36⁰C
Wall and roof ventilation as porous medium covered with wire screen (porosity 0.64)
2 Wind speed 0.4 m/s Outside air temperature 32.4⁰C Relative Humidity 68 % Solar Radiation 1002 W/m2
Floor temperature 42.5⁰C South Roof temperature 34.82⁰C North roof temperature 38.36⁰C
Wall and roof ventilation as porous medium covered anti greenhouse whitefly (mesh 58; porosity 0.44)
RESULTS AND DISCUSSIONS
The Existing Greenhouse Environment
The experimental greenhouse was a typical tropical greenhouse with roof and
side walls ventilations covered with wire screen with 0.64 porosity. Figure 1 shows the geometry and computational domain of the greenhouse model. Distribution of inside air temperature and the airflow were given in Figure 2 and Figure 3.
Figure 1. Greenhouse geometry and computational domain for the flow simulation.
Figure 2 s hows that there was no
significant distribution of temperature inside the greenhouse when external wind speed was low (0.4 m/s). However, according to experimental measurements, air temperature inside the greenhouse had maximum values of 36.95°C near the roof
openings (x=3 m, y=5 m, z=-4 m) and near the floor, whereas at y=1 m, the temperature was 33.00°C. The greenhouse temperature was lower near the wall openings and almost no differences with the outside at the windward. This was because fresh air from outside entered the
3rd GEN Network and 4th Rispescia International Seminar Sustainable Bio-resources for Global Welfare
40

greenhouse through wall and ridge openings at windward (Figure 3) and out from leeward openings. The air entered the greenhouse (x=0m) with a t emperature similar to the outside one and left (x=-8 m) 2 °C warmer.
The combined openings i.e wall and ridge openings, had significant effect to the greenhouse climate when external wind speed was low.
Figure 3. Airflow of the experimental greenhouse at low wind speed
Validation of the CFD Model
Validation of the CFD model was conducted by comparing the simulated temperature and the measure ones (Table 2). Validation was made to 8 point goals located inside the greenhouse. Maximum error of 12.25% was achieved. It showed that the simulated values of inside air temperature had a fine agreement with the experimental data. Therefore, this model can be used for temperature prediction of the greenhouse using different screen porosity.
Predicted Greenhouse Environment at Low Wind Speed
The validated CFD model was used to predict the inside air temperature of the greenhouse with less porous screen (0.44). This screen was chosen since it is usually used as anti greenhouse whitefly screen. For this case, air temperature was predicted higher 1 (Figure 4). The air temperature in the middle of the greenhouse was much higher than any other places in the greenhouse. The air flow vectors inside the greenhouse was presented in Figure 5. Where there was no screen in the openings the inside air temperature was almost equal to the outside (Figure 4).
Figure 2. Temperature distribution of the experimental greenhouse at low wind speed.
3rd GEN Network and 4th Rispescia International Seminar Sustainable Bio-resources for Global Welfare
41

Table 2. Simulated and measured air temperature difference.
Case Point Temperature x [m] y [m] z [m] Simulated [°C] Measured [°C] Error (%)
WS=0.4 3 1 0 32.41 31.60 -2.55 porosity 0.64 3 1 -4 32.50 33.00 1.51
3 1 -8 32.65 34.76 6.09
3 5 -4 32.43 36.95 12.25
15.75 1 0 32.41 32.10 -0.96
15.75 1 -4 32.50 32.30 -0.63
15.75 1 -8 32.66 32.70 0.11
15.75 5 -4 32.43 33.60 3.49
Figure 5. Airflow of the experimental greenhouse at low wind speed with less porous creen. CONCLUSIONS
The CFD simulation was able to predict the greenhouse temperature and show temperature distribution inside. Simulations with the less (0.44) porosity anti-insect screen showed that it reduced ventilation airflows and raised air temperature. Screen porosity should be made into consideration when designing a greenhouse that applying natural ventilation.
ACKNOWLEDGEMENTS
This work was under the Competitive Research Project for International Publication Batch III 2009, funded by Directorate General of Higher Education, Ministry of National Education, Indonesia.
Figure 4. Temperature distribution of the experimental greenhouse at low wind speed with less porous screen.
3rd GEN Network and 4th Rispescia International Seminar Sustainable Bio-resources for Global Welfare
42
REFERENCES Barzanas T., T. Boulard, C. Kittas, 2001.
Numerical simulation of the airflow and temperature distribution in a tunnel greenhouse equipped with insect-proof screen in the openings. Computers and Electronics in Agriculture, Special Issue on Applications of CFD in the Agri-food Industry, 34, 207-221.
Campen, J.B. 2005. G reenhouse design applying CFD for Indonesian conditions. Acta Hort. (ISHS) 691:419-424.
Harmanto, H.J. Tantau, V.M. Salokhe. 2006. Optimization of ventilation opening area of a naturally ventilated net greenhouse in humid tropical environment, Presented at the International Symposium on Greenhouse Cooling: Methods, Technologies, and Plant Response, CSA06-16, 24-27 April 2006, Almeria, Spain.
Impron, I., S. Hemming, G.P.A. Bot. 2007. Simple greenhouse climate model as a design tool for greenhouses in tropical lowland. Biosytem Engineering (98): 79-89.
Karcia M., T.H. Short, R.R. Stowel. 1998. A CFD evaluation of naturally ventilated, multi-span, sawtooth greenhouses. Trans. Am. Soc. Agric. Eng. 41, 833-836.
Lee, I., L. Okushima, A. Ikegushi, S. Sase, T.H. Short. 2000. P rediction of natural ventilation of multi-span greenhouses using CFD techniques and its verification with wind tunnel test, presented at the 93rd Annu. Int. Meeting of ASAE, Paper No. 005003, Milwaukee, Winsconsin, USA, July 9-12, 2000.
Lee, I., T.H. Short. 2000. T wo-dimensional numerical simulation of natural ventilation in a multi-span greenhouse. Transactions of the ASAE, 43(3), 745-753.
Mistriotis A., P. Picuno, G.P.A. Bot, Scarascia-Mugnozza G. 1997. Computational study of the natural ventilation driven by buoyancy forces. Proceedings of the 3rd international workshop on mathematical and control applications in agriculture and horticulture. Pergamon Press. pp. 67-72.
Pontikakos, C., K .P. Ferentinos, T . Tsiligiridis, A.B. Sideridis. 2006. Natural ventilation efficiency in a twin-span greenhouse using 3D computational fluid dynamics. Proceeding of the 3rd International COnference on Information and Communication Technologies in Agriculture (HAICTA), September 20-23, Volos, Greece.
Pontikakos C., K.P. Ferentinos, T . Tsiligiridis. 2005. W eb-based estimation model of natural ventilation efficiency in greenhouses using 3D computational fluid dynamics. In: Proceeding of the International Congress on Information Technology in Agriculture, Food and Environment (ITAFE’05), October 12-14, 2005, Turkey.
Reichrath S., T.W. Davies. 2002. U sing CFD to model internal climate of greenhouses: past, present and future. Agronomie (22): 3-19.
Richards P J; Hoxey R P. 1992. Computational and wind tunnel modeling of mean wind loads on the Silsoe structures building. Journal of Wind Engineering and Industrial Aerodynamics, 43(1–3), 1641–1652.
Suhardiyanto, H., and Y. Romdhonah. Research on greenhouse application in the tropics. Jurnal Teknik Pertanian ISSN 0853-3965, Volume 21, No.4: 313-321. 2007.
3rd GEN Network and 4th Rispescia International Seminar Sustainable Bio-resources for Global Welfare
43

THERMAL DECOMPOSITION OF VOCs CATALYZED BY OXIDES-ZEOLITES NANOCOMPOSITES SYNTHESIZED
FROM INDUSTRIAL BY-PRODUCTS
Erni Johan, Zaenal Abidin, Naoto Matsue, Teruo Henmi
Faculty of Agriculture, Ehime University, 3-5-7 Tarumi, Matsuyama Ehime 790-8566, Japan
Tel / Fax: +81-89-946-9681 / +81-89-977-4364
E-mail: [email protected]
ABSTRACT
Volatile organic compounds (VOCs) such as toluene, xylene, formaldehyde and acetaldehyde are toxic, and cause degradation of housing environment and building syndrome for human beings. Acetaldehyde and formaldehyde are effectively adsorbed by faujasite, zeolite-A and so on. However, VOCs with benzene ring in their structure such as toluene are hardly adsorbed onto these zeolites with high cation exchange capacity and low Si/Al ratio. The purpose of this study was to find effective materials for adsorption and decomposition of VOCs, especially those with benzene ring structure.
We have succeeded to synthesize ZSM-11, zeolite with high Si/Al ratio, from by- product of optical fiber as a raw material. CeO2–ZSM-11 nanocomposite was also synthesized by adding CeO2 during the synthesis process of ZSM-11. The synthesis products were applied for adsorption and thermal decomposition of toluene. Both ZSM-11 zeolite and the CeO2-ZSM-11 nanocomposites had high capacity for toluene adsorption. The simple reason is that both the adsorbent (ZSM-11) and the adsorbate (toluene) are hydrophobic in nature. Furthermore, the nanocomposites decreased combustion temperature of toluene from 342 °C for ZSM-11 to 298 °C for CeO2-ZSM11 nanocomposite. The decrease in the decomposition temperature of toluene was due to CeO2 which acted as thermal catalysis during combustion process. By this manner, adsorbed toluene can be effectively removed by thermal decomposition, and be reused again for toluene adsorption. Key words: VOCs, ZSM-11, thermal decomposition
3rd GEN Network and 4th Rispescia International Seminar Sustainable Bio-resources for Global Welfare
44

BACKGROUND
Recently pollution of VOCs (volatile organic compounds) in housing environment becomes serious problem around the world. VOCs are defined as chemical organic compounds that have enough vapor pressure under normal condition to significantly vaporize and enter the atmosphere. VOCs are toxic compound for human bodies which cause symptoms called sick house syndrome. Some examples of VOCs are formaldehyde, acetaldehyde, ethyl and propyl alcohols, and toluene. Toluene is one of the dangerous VOCs, that is discharged from painting and printing industries in high concentration.
Some study concerning adsorption and decomposition of acetaldehyde and
formaldehyde by adsorption and TiO2-phocatalytic decomposition have been done (Johan et al., 2006, Ichiura et. al, 2002). Acetaldehyde and formaldehyde are easily adsorbed on common zeolites, such as zeolite-A or Na-X. However, toluene and xylene, VOCs with benzene ring in their structure, are hardly adsorbed on these zeolites with low Si/Al ratio. Our preliminary study indicated that ZSM-11, a high silica zeolite had high capacity for toluene adsorption.
On the other hand, many industries discharge by-products difficult to burry. For example fiber glass industry discharge by-product with high silica content. Fiber glass is made from quartz glass, and during
manufacturing of the quartz glass, about 40% of SiO2 is flied on the air and remains as by-product. For simplicity, the by-product is called soot, and the soot contains more than 98% of SiO2. In the present study we synthesized ZSM-11 zeolite from soot, with and without the addition of cerium oxide (CeO2). The oxide was chosen because it has catalytic combustion property. The synthesized products were characterized by XRD, SEM and FTIR, and were subjected for adsorption and thermal combustion experiments of toluene. Here, Toluene gas represents one of VOCs containing benzene ring with hydrophobic in nature, that is hardly adsorbed onto common zeolites such as phillipsite, zeolite-A, or natural zeolite.
MATERIALS AND METHODS
ZSM-11 was synthesized from soot with and without the addition of CeO2. Soot was firstly ground and sieved with 20 meshes. Molar ratio of starting materials for ZSM-11 was described as follow: SiO2: Al2O3: NaOH: TBABr (tetra n-propyl ammonium bromide) : H2O = 1: 0.008: 0.04: 0.1: 40. Sodium aluminate (NaAlO2) was purchased from Nacalay tesque and was used as an aluminum source. NaOH was purchased from Nacalay tesque, and TBaBr was purchased from Kanto Chemical Co., Inc. Six grams of soot as a silicon source was mixed with other reagents and was stirred for 15 minutes. The mixture was then
3rd GEN Network and 4th Rispescia International Seminar Sustainable Bio-resources for Global Welfare
45

transferred into stainless steel autoclave, followed by heating reaction in an oven at 170 °C for 72 h. Reaction product was washed with pure water and was dried at 100 °C, followed by calcination at 450 °C for 3h to remove the organic template (TBABr). Similar experiments were done in the synthesis o f CeO2-ZSM11 nanocomposite, but 0.3 g of CeO2 was added during the synthesis process. The obtained products were subjected for characterization by powder XRD with Cu-KH radiation (Rigaku Ultima IV X-ray Diffractometer), SEM (Hitachi High Technology S-8000), and FTIR (Jasco FT/IR-4100).
Adsorption and thermal decomposition of toluene was done on three samples, namely ZSM-11 (blank), CeO2-ZSM-11 nanocomposite, and mixture of CeO2 and ZSM-11. About 0.1 gram of sample was mounted on a glass slide, and put in a 200 mL reaction chamber. Toluene gas was introduced into reaction chamber so as to give initial toluene concentration of 180 ppm. Decrease in toluene concentration was monitored every 20 minutes for 90 minutes, by using gas chromatography (Shimadzu Gas Chromatograph GC-14A with FID detector). Thermal decomposition experiment was carried out by putting 0.1 g of samples on a watch glass, and then two drops of toluene was added, and stand for 30 m inutes to allow evaporation of excess of toluene. The samples were then subjected for TG-
DTA measurement from 20 °C - 800 °C with heating rate of 20 °C/minute. Appearance of exothermic peaks was considered as thermal combustion of toluene.
RESULTS AND DISCUSSION
Chemical composition of soot is shown in Table 1. The high SiO2 content of soot is favorable to synthesize high-silica ZSM-11. Figure 1 shows X-ray diffraction patterns of soot, and synthesized products. Raw material (soot) showed broad peak only at d space of 3.98Å, indicating that the material is amorphous. The synthesized products (a, b, c) showed strong peaks at 11.18 Å, 10.06 Å, 3.84 Å, 3.72 Å, 2.98 Å and 2.01 Å, indicating the presence of ZSM-11. The CeO2-ZSM-11 nanocomposite and mixture of CeO2 and ZSM-11 also showed peaks of CeO2, in addition t o t hose of ZSM-11. These data proved that ZSM-11 is successfully synthesized from soot, an industrial by-product.
Figure 2 show SEM (scanning electron microscopy) of soot, ZSM-11 and
CeO2-ZSM-11 nanocomposite. The figures show that soot has small particle of 0.07μm that is combined into aggregate with diameter from 18μm to 27μm. On the other hand, ZSM-11 has spherical shape of 1.9μm in size. This feature is similar with the observations of Gonzalez et al. (2009). Furthermore, by adding CeO2 during synthesis, the particle size became larger (14.5μm in diameter) with CeO2 particle on its
3rd GEN Network and 4th Rispescia International Seminar Sustainable Bio-resources for Global Welfare
46

11.18Å ▼ ◇ : CeO2
10.06Å 3.72Å
2.98Å 2.01Å a ▼ ▼
▼ ▼ ▼
▼ ▼ 3.12Å
◇ 1.91Å ▼ ▼ 2.70Å ◇
3.63Å
b ▼ ▼▼ ▼ ▼ ▼ ▼
▼
c ▼
▼▼ ▼▼▼ ▼ ◇ ▼
◇
d
11.18Å ▼ ◇ : CeO2
10.06Å 3.72Å
2.98Å ▼
▼
▼ ▼ ▼
▼ ▼ 3.12Å
◇ 1.91Å ▼ ▼ 2.70Å ◇
3.63Å
▼ ▼▼ ▼ ▼ ▼ ▼
▼
▼ ▼
▼ ▼▼▼ ▼ ◇ ▼
◇
surface (Figure 3), this may be due to the effect of nanocomposition, where the presence of CeO2 o xide increased the
particle size of ZSM-11.
a b Table 1. Chemical composition of soot
Mass (%)
SiO2 98.00
Fe2O3 0.11
P2O5 0.59
CaO 0.17
MgO 0.01
3.98Å
soot
60μm
6.0μm 11.18Å
▼
10.06Å
3.84Å
▼
3.72Å ▼
▼ : ZSM-11 ◇ : CeO2
▼
▼ ▼ ▼ ▼
▼
▼
2.98Å ▼
▼ 3.12Å ◇
▼ 2.70Å ◇
2.01Å ▼
1.91Å 3.63Å
◇ ◇
b ▼
▼ ▼ ▼ ▼ ▼ ◇
▼ ▼
▼ ▼
c ▼ ▼
▼▼▼ ▼ ◇ ▼ ◇ ◇
c d d
6.0μm 1.5μm
◇
1.56Å ◇
Figure 4 pr esents adsorption of toluene on the synthesis products (decrease in toluene concentration with time). Toluene concentration decreased drastically f rom 180 p pm to 3 0 p pm during first 10 minutes, then gradually decreased up to 0 ppm for ZSM-11 and 5 ppm for CeO2-ZSM-11 nanocomposite. This indicates that ZSM-11 and its nanocomposite have high capacity for toluene a dsorption. T he adsorption
capacity was even greater than ZSM-5, another family of high silica zeolite (laboratory data).
Figure 5 shows FTIR spectra of the samples and CeO2. Generally the appearance of the peaks is common for high silica zeolites. However, CeO2-ZSM-11 nanocomposite sample showed a shoulder at 998 cm-1, which was not found in the spectra
Fig. 2 SEM imagines of raw material and synthesized
Fig. 1 XRD patterns of soot and synthesized product:
a: ZSM-11, b: CeO2-ZSM-11 nanocomposite, c: CeO2-ZSM-11 mixture, d: CeO2
3rd GEN Network and 4th Rispescia International Seminar Sustainable Bio-resources for Global Welfare
47
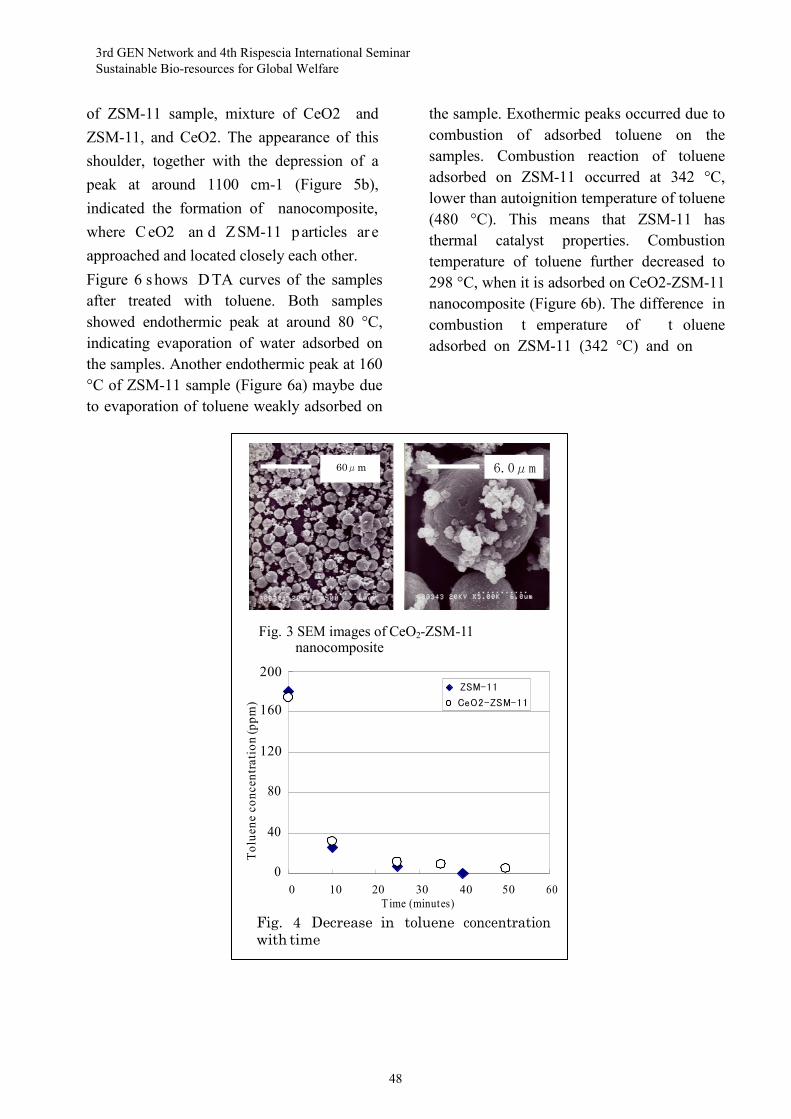
e
trat
ion
pm)
of ZSM-11 sample, mixture of CeO2 and ZSM-11, and CeO2. The appearance of this shoulder, together with the depression of a peak at around 1100 cm-1 (Figure 5b), indicated the formation of nanocomposite, where C eO2 an d ZSM-11 particles ar e approached and located closely each other. Figure 6 s hows D TA curves of the samples after treated with toluene. Both samples showed endothermic peak at around 80 °C, indicating evaporation of water adsorbed on the samples. Another endothermic peak at 160 °C of ZSM-11 sample (Figure 6a) maybe due to evaporation of toluene weakly adsorbed on
the sample. Exothermic peaks occurred due to combustion of adsorbed toluene on the samples. Combustion reaction of toluene adsorbed on ZSM-11 occurred at 342 °C, lower than autoignition temperature of toluene (480 °C). This means that ZSM-11 has thermal catalyst properties. Combustion temperature of toluene further decreased to 298 °C, when it is adsorbed on CeO2-ZSM-11 nanocomposite (Figure 6b). The difference in combustion t emperature of t oluene adsorbed on ZSM-11 (342 °C) and on
60μm 6.0μm
Fig. 3 SEM images of CeO2-ZSM-11 nanocomposite
200 ZSM- 11
160 CeO2 -ZS M-1 1
120
80
40
0 0 10 20 30 40 50 60
T ime (minut es)
Fig. 4 Decrease in toluene concentration with time
3rd GEN Network and 4th Rispescia International Seminar Sustainable Bio-resources for Global Welfare
48

| | | | | Tran
smitt
ance
(%)
298℃ 342℃ |
a a
b
b
c
d
| | | |
2000 1500 1000 500 wave number (cm-1)
Fig. 5 FTIR spectra of the samples: a, ZSM-11, b: CeO2-ZSM-11 nanocomposite, c: mixture of CeO2
and ZSM-11, d: CeO2
20 200 400 600 800 Temperature (℃)
Fig. 6. DTA patterns of the samples after toluene treatment: a. ZSM-11; b. CeO2-ZSM-11 nanocomposite
CeO2-ZSM-11 nanocomposite (298 °C) is due to the presence of CeO2 in the nanocomposite acted as a thermal catalyst
that oxidatively combusted adsorbed toluene. In case of the mixture of CeO2 and ZSM-11,
the combustion temperature of adsorbed toluene was observed at 333 °C (data not shown). This suggested that thermal catalytic property of CeO2 was more effectively exerted in the nanocomposite than in the physical mixture. In this manner, toluene can be adsorbed then be combusted by such kind of nanocomposite, and the nanocomposite can be reused again as an adsorbent. This kind of thermal catalyst process is also applicable for other kind of VOCs.
Conclusion 1. ZSM-11 and CeO2-ZSM-11
nanocomposite are successfully synthesized from industrial by-product of glass fiber.
2. CeO2-ZSM-11 nanocomposite is an effective material for removing VOCs, by adsorption and thermal catalyst.
References: 1 . Johan, E. Fukugaichi S, N. Matsue, T.
Henmi (2006) Removal of volatile organic compounds by artificial zeolites. Frontiers Science Series No. 48: 235-238.
3rd GEN Network and 4th Rispescia International Seminar Sustainable Bio-resources for Global Welfare
49

2. Ichiura, H.T., Kitaoka, H. Tanaka (2002) Preparation of composite TiO2-zeolite sheets using a papermaking teqnique and their application to environmental improvement. Journal of Material Science 31: 2937-2941.
3. Gonzales, G. M.E. Gomes, G. Vitale, G..R. Castro (2009) Effect of Al content on phase transitions of zeolite MEL. Microporous and Mesoporous Materials 121: 26-33.
Aknowledgment: This research was partly supported by grant for Research and Development support of Ehime University 2009-2011.
3rd GEN Network and 4th Rispescia International Seminar Sustainable Bio-resources for Global Welfare
50
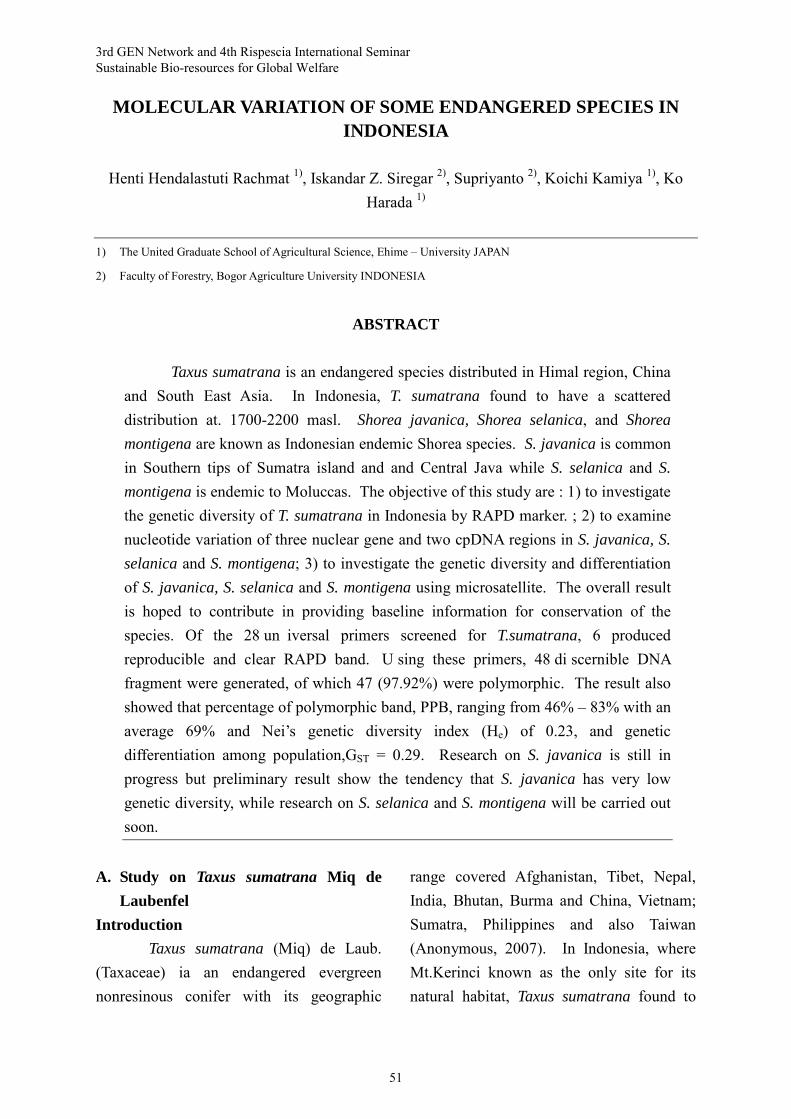
MOLECULAR VARIATION OF SOME ENDANGERED SPECIES IN INDONESIA
Henti Hendalastuti Rachmat 1), Iskandar Z. Siregar 2), Supriyanto 2), Koichi Kamiya 1), Ko
Harada 1)
1) The United Graduate School of Agricultural Science, Ehime – University JAPAN
2) Faculty of Forestry, Bogor Agriculture University INDONESIA
ABSTRACT
Taxus sumatrana is an endangered species distributed in Himal region, China
and South East Asia. In Indonesia, T. sumatrana found to have a scattered distribution at. 1700-2200 masl. Shorea javanica, Shorea selanica, and Shorea montigena are known as Indonesian endemic Shorea species. S. javanica is common in Southern tips of Sumatra island and and Central Java while S. selanica and S. montigena is endemic to Moluccas. The objective of this study are : 1) to investigate the genetic diversity of T. sumatrana in Indonesia by RAPD marker. ; 2) to examine nucleotide variation of three nuclear gene and two cpDNA regions in S. javanica, S. selanica and S. montigena; 3) to investigate the genetic diversity and differentiation of S. javanica, S. selanica and S. montigena using microsatellite. The overall result is hoped to contribute in providing baseline information for conservation of the species. Of the 28 un iversal primers screened for T.sumatrana, 6 produced reproducible and clear RAPD band. U sing these primers, 48 di scernible DNA fragment were generated, of which 47 (97.92%) were polymorphic. The result also showed that percentage of polymorphic band, PPB, ranging from 46% – 83% with an average 69% and Nei’s genetic diversity index (He) of 0.23, and genetic differentiation among population,GST = 0.29. Research on S. javanica is still in progress but preliminary result show the tendency that S. javanica has very low genetic diversity, while research on S. selanica and S. montigena will be carried out soon.
A. Study on Taxus sumatrana Miq de
Laubenfel Introduction
Taxus sumatrana (Miq) de Laub. (Taxaceae) ia an endangered evergreen nonresinous conifer with its geographic
range covered Afghanistan, Tibet, Nepal, India, Bhutan, Burma and China, Vietnam; Sumatra, Philippines and also Taiwan (Anonymous, 2007). In Indonesia, where Mt.Kerinci known as the only site for its natural habitat, Taxus sumatrana found to
3rd GEN Network and 4th Rispescia International Seminar Sustainable Bio-resources for Global Welfare
51

have a scattered distribution. D uring the field survey, this highly valuable tree is usually distributed in shady valley and slopes at high altitudes of 1700-2200 masl.
Taxus sumatrana those grown in Indonesia has not been studied intensively. Nothing is known except for the study of endophytic fungi (Syukur et al., 2003). The present study is an important step toward investigating the genetic diversity and population structure of Taxus sumatrana in Indonesia.
Materials and Method
Leaves of 30 individuals were collected from 3 reproductive populations. Population of natural parents tree and natural seedling were taken from Mt. Kerinci, Jambi Province – Indonesia. The population of cultivated tree originated from twigs cutting were taken from Cibodas Botanical Garden. In each of three reproductive populations, random sample of 10 plants were analyzed using RAPD.
Genomic DNA was extracted from dried leaves using a modified CTAB method (Milligan, 1989). DNA checked by electrophoresis on 1% agarose gel. 28 primers (Operon Technology) were screened for their ability to amplify polymorphic bands among the populations. 6 primers produce strong, clear, and reproducible bands. These primers were selected for further study of the 30 i ndividuals. 13.5µl PCR reaction were carried out in a M J Research PTC-100 and run for: 1 cycle pre-denaturation at 95oC for 2 min, 45 cycles of 1 min denaturation at 95oC, 2 min annealing
at 37oC, 2 m in extension at 72oC and 1 cycle final extension at 72oC in 10 min.
A matrix of different RAPD phenotype was established and used for statistical analysis. Data analysed using the program POPGENE version 1.31 ( Yeh et al., 1999), parameter observed are percentage of polymorphic band (PPB), the effective number of allele per locus (Ae), and Nei’s genetic diversity (He). The diversity among population was measured by Nei’s genetic distance (D) and genetic differentiation (GST). Result
The 6 selected RAPD primers generated a total of 48 ba nds (loci) that ranged in size from 100-1500 base pairs. The primers yielded 5-11 bands, with an average of 8 bands per primer. Among the 48 bands, 47 ( 97.92%) were polymorphic. The percentage of polymorphic bands (PPB) at the population level was 69% on average, ranging from 46%-83%. The average effective number of alleles per locus (Ae) was 1.40 and 1.57 at the population and species level respectively. Assuming Hardy-Weinberg equilibrium, the average gene diversity (He) was estimated to be 0.23 within population and 0.33 at the species level. Among the three reproductive population, the natural parent trees population (He = 0.26) and cultivated population (He = 0.30) exhibit high levels of variability
Genetic differentiation among population (GST) of Taxus sumatrana was estimated as 0.29 , i ndicating that 29% of the genetic variability was distributed
3rd GEN Network and 4th Rispescia International Seminar Sustainable Bio-resources for Global Welfare
52

among population, or most of the total genetic diversity was distributed within population. Nei’s genetic distance (D) was varied from 0.13 – 0. 26 with the average of 0.20. This means that around 80% of the genetic variability exists within population and only 20% exist among population. Discussion
Data showed that genetic diversity within population of Taxus sumatrana from Indonesia is relatively high (mean of He = 0.23). These results comply with Hamrick et al. (1992) that stated genetic variation in long-lived Gymnospermae should theoretically be relative high within population and relatively low between populations. Generally, conifer will have high genetic variability due to its low genetic differentiation among population.
In the Genus of Taxus, genetic diversity within population of Taxus sumatrana is higher compared to anothers Taxus species such as Taxus fuana from Pakistan (He=0.12), Taxus wallichiana from south east India, Taxus canadensis (He=0.10), and Taxus brevifolia (He= 0.17). While, Taxus baccata has higher genetic diversity (He= 0.28). The percentage of polymorphic bands for Taxus sumatrana (PPB) (69%) is also higher than Taxus fuana (38%), Taxus wallichiana (45%), Taxus canadensis (26%), Taxus cuspidata (31%), and Taxus brevifolia (42%), but slightly lower than Taxus baccata (71%) (Shah et al., 2008; Saikia et al., 2000; Senneville et al., 2001; Kassaby & Yanchuk, 1998; Lewandowski et al, 1995; Hilfiker et al., 2004).
The genetic diversity of seedling population from Taxus sumatrana was lower than natural parent trees population and cultivated population. The same result obtained in Taxus baccata (Lewandowski et al.,1995), where slight excess of homozygote (F = 0,049) was observed from progeny trees while the homozygote for parental population was very low (F = -0,104). This will be understood for a dioecy tree where any observed inbreeding must be the result of mating between relatives or close neighbours. The genetic diversity within population of cultivated population was higher than natural parent tree population. The high genetic diversity within cultivated population was also found in cultivated Taxus cuspidata var. nana (Li et al., 2005), where the cultivated population generated from very few mother trees by stem cutting showed a high genetic diversity within population. S uch variability may result from two factors, those: 1) The original mutant has already harbored a large amount of pre-existing somatic variation, or 2) There has been genetic instability such as rapid occurrence and accumulation of somatic mutation.
Compared to others Taxus, the genetic differentiation among population of Taxus sumatrana was classified into moderate because its value is still lower than Taxus fuana (GST = 0.58) and higher than Taxus brevifolia (Gst = 0.08), and Taxus canadensis (GST = 0.10). Conclusion
Knowledge of genetic variation of population of rare and endangered species
3rd GEN Network and 4th Rispescia International Seminar Sustainable Bio-resources for Global Welfare
53

plays an important role in the formulation of appropriate conservation strategies both in-situ and ex-situ. In ex–situ conservation strategy, the information of genetic variation is needed to determine the number of collected population or individual for maintaining the genetic diversity value. In in-situ conservation strategy, it is important to determine the location number, width area and number of individual.
From the study result, it is known that the level of genetic variation of Taxus sumatrana from Indonesia is high. Due to the fact that natural growing habitat of Taxus sumatrana from Indonesia is only found in Mt. Kerinci and the genetic variation of the seedling population is low, for exploration activity and ex-situ conservation program will require big number of individual to be collected. The high variability in vegetatively cultivated population and low seedling existence, that is very rare in its natural habitat, will allow cuttings to be planted for ex-situ conservation program.
B. Study on Indonesian endemic Shorea
species Introduction
Shorea javanica Koord & Valeton is an indigenous species to Indonesia where it is common in Southern tips of Sumatra and found scattered in Central Java. Locally it is known as dammar mata kucing (cat eye resin ) and it produces non t imber forest product ( high quality, clear resin – known as dammar). N owadays, Indonesia is the only dammar-producing country in the
world. (Anonymous 1995). Shorea selanica Blume is grouped
into red meranti. Locally known as dammar selan, kayu bapa, sehu, boba, luma, bahut, biahgawa. S. selanica is also endemic to Indonesian and only found naturally in Moluccas islands (Newman et al., 1998). This species could reach 50 cm in diameter at breast height in less than 30 years (Subiakto et al. 2001; Anonim 1987). Measurement on mean annual increment (MAI) by Mindawati et al (2004) showed S. selanica as a potential for proposed species in plantation forest with MAI could reach 2.0 cm/year.
Shorea montigena Slooten is grouped into white meranti. Locally known as bahut, kayu bapa, gawa, babat, umale. This species is also endemic to Moluccas with narrower distribution compared to S. selanica. S. montigena is also said possibly found in North Sulawesi but so far this possibility support only by sterile collection (Newman et al., 1998).
Several studies have been conducted on the genetic variation of the Shorea species using RAPD, allozyme, SSR, and DNA sequences. H owever, the genetic variation within and among population and also population lineage by using DNA-based marker to S. javanica, S. selanica, and S. montigena has not been reported. Materials and Method
Leaves sample of S. javanica collected both from Sumatra and Java population. For Sumatra population, leaves sample collected both from natural habitat
3rd GEN Network and 4th Rispescia International Seminar Sustainable Bio-resources for Global Welfare
54
in Bukit Barisan Selatan National Park and also planted trees from dammar agroforest in Southern tips of Sumatra (Krui area of Lampung). J ava population represented by individual that grows naturally in Sancang Nature Reserve in Garut, West Java and also planted trees in Bogor Botanical Garden. There are still two proposed location for Shorea javanica sample collection, those are: South Sumatra (Sumatra population) and Subah, Central Java (Java population). While leaves sample of Shorea selanica and Shorea montigena will be taken from their natural habitat in Moluccas islands.
Genomic DNA extracted using a modified CTAB method. P CR optimalization due to the primers used when molecular variation will be generate from two cpDNA region, three nuclear gene, and at least 10 microsatellite markers. Preliminary results
Research on S. javanica is still in progress but preliminary result shows the tendency that S. javanica has no variation in trnL – trnF region and posses very low genetic diversity in GapC region. Study on some others cpDNA and nuclear gene region to whole individual in each population is still in progress. Research on S. selanica and S. montigena will be carried out soon. References Anonymous. 1995. S trengthening
Community-based Damar Agroforest Management as Natural Buffer-zone of Bukit Barisan Selatan National Park, Lampung, Indonesia. Research Report.
Lembaga Alam Tropika Indonesia (LATIN).
Anonymous. 2007. Taxus sumatrana Description. www.biologie.uni-hamburg.de/ b-online/earle/ta/ta/sumatrana.htm
Hamrick JL, Godt MJW, Sherman-Broyles SL. 1992. Factor influencing level of genetic dibersity in woody plant species. New. For. 6, 95-124.
Hilfiker K, Rolf H, Peter R, Felix G. 2004. Dynamic of genetic variation in Taxus baccata. Local versus regional perspective. Can. J. Bot. 82:219-227.
Kassaby YAE, B Jaquish. 1998. G enetic variation of western larch in British Columbia and its conservation. The American Gen. Assc, 89: 248-253.
Lewandowski A. J Burczyck. L Mrjnartowicz. 1995. G enetic structure of English yew (Taxus baccata L) in the Wierzchlas Reservve : implication for genetic conservation.Forest Ecology and Management 73 (1995) 221-227.
Li XL. XM Yu. WL Guo. YD Li. XD Liu. NN Wang. And B Liu. 2006. Genomic diversity within Taxus cuspidata var nana revealed by Random Amplified Polymorphic DNA Markers. R ussian Journal of Physiology, 2006 Vol 53, No. 5. pp 684-688.
Milligan BG. 1998. Total DNA Isolation. In Textbook : Molecular Genetic Analysis of Population, a Practical Approach 2nd Ed. E ditor Hoelzel AR. Oxford University Press. New York.
Mindawati, N., Heriansyah, I., Hiratsuka, M., Toma, T., Morikawa, Y., Ginting,
3rd GEN Network and 4th Rispescia International Seminar Sustainable Bio-resources for Global Welfare
55

N., and Morikaya, Y. 2004. Tree growth of dipterocarp plantation forest in Java, Indonesia. I nfo Hutan I (2): 53-58.
Nei M., A.K Roychoudhury. 1974 . Sampling Variance of heterozygosity and Genetic Distance. Genetics 76: 379-390.
Newman, MF., PF Burgess., TC Whitemore. 1996. M anual of Dipterocarps for Foresters. S umatra Light hardwood. Royal Botanic Garden Edinburgh – Centre for International Forestry Research (CIFOR).
Newman, MF., PF Burgess., TC Whitemore. 1998. D ipterocarp of Java to New Guineae Royal Botanic Garden Edinburgh – Centre for International Forestry Research (CIFOR).
Nybom H, Bartish IV. 2000. E ffect of life history traits and sampling strategies on genetic estimates obtained with RAPD markers in plant. Perspect. Plant Ecol. Evol. Syst. 3, 93-114.
Nybom H. 2004. C omparison of different nuclear DNA marker for estimating intraspecific genetic diversity in plant. Mol. Ecol. 13, 1143-1155.
Saikia D, Suman, PS Khanuja, Ajit KS, Mahendra PD, Arun K, and Kukreja SK. 2000. Assestment of diversity among Taxus wallichiana accessions from northeast India using RAPD analysis. P lant . G enet. Res. Newsl. 121, 27-31.
Senneville S, Beaulieu J, Daoust G, Deslauriers M, B osquet J. 2001. Evidence of low gwnwtic diversity and
metapopulastion structure in Canade yew (Taxus canadensis): consideration for conservation. Can. J. For. Res. 31, 110-116.
Shah A, De-Zhu L, Lian-Ming G, Hong-Tao L, and Michael M. 2008. Genetic diversity within and among population of the endangered species Taxus fuana (Taxaceae) from Pakistab and implication for its conservation. Biochemical Systematics and Ecology 36 (2008) 183-193
Subiakto, A., Hendromono and Sunaryo. 2001. E x situ conservation of dipterocarps species in West java and Banten. In: In situ and ex situ conservation of commercial trees. Faculty of Forestry, Gadjah Mada University. ITTO. Yogyakarta. 183-191.
Syukur S, Julinar, Abdi D, Leonardus BSK. 2003. Studi kapang endofitik penghasil Taxol. J urnal Kimia Andalas. 9(1).40-42.
Yeh FC. 2000. P opulation genetic. In: Young A, Boscher D, Boyle T, editors. Forest Conservation Genetic. Australia: CSIRO Publishing
3rd GEN Network and 4th Rispescia International Seminar Sustainable Bio-resources for Global Welfare
56

THE ROLE OF KENYA FORESTRY RESEARCH INSTITUTE IN REDD+ PROJECTS
¹,²Kigomo J.N.
¹Kenya Forestry Research Institute, P.O. Box 20412-00200, Nairobi
²Faculty of Agriculture, Ehime University, Japan Mobile number: +81 80 4039 5544
ABSTRACT
Since reducing carbon emissions from deforestations and forest degradation (REDD+) projects require sound scientific principles and findings prior to implementation, forestry research have a big role to play. KEFRI’s past research in rehabilitation of degraded forests, monitoring land cover changes, forest inventory and silvicultural practices in different ecological zones of Kenya will form important baseline of information and implementation strategies. The other task will be developing methodologies for carbon accounting and reference emission scenario in different forest types toward carbon markets. Monitoring performance of REDD+ strategy in terms of reducing carbon emissions, forests productivity and improvement of livelihoods will be undertaken as per international standards of monitoring, reporting and verification. Inadequate forest resource database, inconsistent methodologies, and unclear benefit sharing arrangements are the key challenges. The paper reviews status of forests in Kenya, national progress of REDD+ projects and highlights achievements of KEFRI
Key words: REDD, KEFRI, R-PP, climate change, carbon credits
INTRODUCTION
With wide acceptance of human-induced climate change, there is a growing recognition that deforestation and forest degradation play a significant role in carbon emission. Kenya’s forest cover is currently about 5 per cent (3.47 million ha) of total land area and a projected 12,000 hectares are lost every year, primarily through conversion to farmlands (FAO, 2009). The remaining forests are degraded due to unsustainable utilization, illegal logging, uncontrolled grazing and exploitation for charcoal. It’s estimated over 50 per cent of urban energy requirements and 80 pe rcent of rural cooking and heating requirements are from forests (KEFRI, 2009). Deliberate efforts are made by government, private sector, development partners and local
communities to restore degraded forest areas throughout the country. Water catchment areas have received close attention due to their significance in soil, water and biodiversity conservation in addition to amelioration of regional climatic conditions. Furthermore, the forests in water catchments have been flagged out as important in supporting Kenya’s long term development agenda “vision 2030”.
As a follow-up of Bali action plan (UNFCCC, 2008), Forest Carbon Partnership Facility (FCPF) under World Bank and UN-REDD were formed aiming to assist developing nations in formulating a roadmap in terms of awareness and preparedness towards international REDD+ mechanism. Kenya is among 37 developing countries participating in FCPF
3rd GEN Network and 4th Rispescia International Seminar Sustainable Bio-resources for Global Welfare
57

through formulation of Readiness Preparation Proposal (R-PP) and its implementation. Furthermore, the National Climate Change Response Strategy (NCCRS) has prioritized increasing forest cover and planed REDD+ initiatives in its action plan (GOK, 2010)
KEFRI is a public research institution mandated to undertake forestry research and development for improved livelihoods and healthy environment. The institute’s Research and Development (R&D) agenda is organized into five key programmes: farm forestry; natural forests; dryland forestry; industrial forest plantations; and technology dissemination. In 2009 a Climate Change Working Group was formed to address climate change issues including national preparedness in REDD+ mechanism. Key collaborators include Kenya Forestry Service (KFS) and National Environment Management Authority (NEMA).
MATERIALS AND METHODS
This paper was developed through a review of existing literature, discussions with representatives of Climate Change Working Group in KEFRI and other institutions represented in the on-going R-PP activities during the month of May and June 2010. Partial data obtained was analyzed by MS Excel.
RESULTS AND DISCUSSION
Preparedness and awareness of REDD+ projects
Submission of REDD Readiness Plan Idea Note (R-PIN) in 2008 and grant agreement in November 2009 initiated the R-PP activities. The initial activity has been creating awareness and formulation of national and regional committees. Implementation of R-PP is expected to commence in 2011 t o establish technical, legal and monitoring arrangements. The key pillars of REDD+ projects which include carbon accounting methods,
establishment of baselines scenario, emission reduction strategies, monitoring and modalities of carbon-credit sales will be addressed at this stage.
Having six research centres and ten sub-centres distributed in all regions of Kenya, KEFRI have played a key role in propagating knowledge of REDD+ mechanisms, as well as opportunities and challenges that are anticipated during implementation. Since the year 2009, a total of ten workshops have been held across Kenya, targeting stakeholders drawn from community forest associations, indigenous groups, public institutions, community-based organizations and private sector. Development of dissemination materials such as brochures and pamphlets has also been undertaken to reach more stakeholders with diverse interest in REDD+ process. To implement REDD+ projects effectively, various committee have been formed which will be involved not only in R-PP formulation but also during implementation of REDD+ projects. These include national coordination, steering committee and technical working group in which KEFRI have been instrumental in advisory and providing technical information. This is expected to continue during R-PP implementation.
Establishment of REDD+ baselines in Kenya
Efforts to quantify historic carbon emissions/removals from deforestation and degradation will be the next agenda, after the expected approval of R-PP. Development of expected trajectories of carbon emissions/removals in the absence of REDD+ incentives will also be undertaken to set the baseline scenario.
At present, Kenya reports its forest area using a minimum crown cover of 10 per cent, minimum height of 5 meters, and minimum area of 0.5 ha. The last estimate of the net emissions of Green
3rd GEN Network and 4th Rispescia International Seminar Sustainable Bio-resources for Global Welfare
58
House Gas (GHG) from the forest sector was in the First National Communication to the United Nation Framework on Convention on Climate Change (UNFCCC) submitted in 2002 but it was based mostly on data from the last national inventory carried out in 1994 (GOK, 2002). Furthermore, good practice guidance for land use, land use change and forestry were still under discussion.
In the REDD projects, modalities to establish carbon crediting baseline are yet to be set since policy decisions are still ongoing under the UNFCCC. It’s anticipated that most of the activities under REDD+ could be implemented using Inter governmental Panel on C limate change (IPCC) framework under agriculture, forestry and other land use (AFOLU). The historical emission is earmarked from the year 2000 t o 2010. To facilitate the estimation of land cover and land use change, satellite image for the target period will be sourced and changes synthesized. Approaches used by Akotsi et. al. (2006) in assessing forest changes using satellite remote sensing technologies in five key water catchment areas (water towers) in Kenya could be utilized with modification in addition to other modern techniques. Massive destruction of forest from 2000 t o 2005 w as observed in Mau complex forest with 16,563 ha deforested and only 334 ha showing signs of recovery over the period. The other four water towers showed signs of recovery with insignificant deforestation.
Forest degradation and stock enhancement are difficult to detect using satellite imagery hence methods shall be developed during the implementation stage of the R-PP. As a starting point, members of REDD technical working group and other experts will meet to plan a
strategy for estimating emissions/removals during the historic time period. Methodologies for forest inventory, volume/biomass equations for carbon stock estimation and modeling forest carbon future trajectory will be the definite output. The IPCC recognizes five forest carbon pools: aboveground biomass, belowground biomass, soil, litter and dead wood. K enya proposes to use aboveground and belowground carbon stock in trees as the main pools in all land cover changes related to REDD+ activities. Currently national carbon stock estimate based on IPCC Tier 1 and other models varies from 163 to 618 Mt C, this shows inadequate sampling and inconsistent methods across the country (Gibbs et. al., 2007). National Forest Inventory carried out in 1989-1993 by two projects, namely Kenya Forestry Master Plan on plantation forests and Kenya Indigenous Forest Conservation Project jointly covering some 900,000 ha of possible 1.22 Million ha, provides important basis for designing REDD+ protocols. Other existing key inventories are regionally based such as mangrove forests, Mt. Kenya ecosystem and Mau ecosystem among others. There is an on-going national forest inventory being carried out, Figure 1 shows results of main plantation species namely Cupressus lusitanica (cypress) and Pinus patula (pine). Most of the growing stock is between 25 to 35 years with cypress occupying larger areas as compared to pine. The target rotation age for both species toward saw logs is about 25 years. This shows most of the plantations are over mature mainly due to national timber harvesting ban which is already in place.
3rd GEN Network and 4th Rispescia International Seminar Sustainable Bio-resources for Global Welfare
59

Figure 1: Plantation forest inventory of main species in Kenya
Lessons learnt and technologies developed during implementation of Participatory Forest Management (PFM) and Social Forest Extension Model (SOFEM) projects would be crucial in the REDD+ framework. The initiative of PFM and SOFEM was, and still is promoting joint ownership of indigenous forest resources and enhancement of growing of trees in degraded forest areas and farmlands. Moreover, the government is in a process of decentralization of forest management to community forest associations (GOK,
2005). Guidelines for high conversion efficiency methods of charcoal burning, pruning and thinning regimes of common plantation species and cost effective rehabilitation techniques have been developed. These technologies will be crucial in carbon stock enhancement and forest management.
Fire has also been a threat to natural forest as shown in Figure 2. However quantification of the amount of carbon emitted after destruction has not been undertaken.
Figure 2: Estimated forest areas destroyed by fire (Source; KFS annual reports)
3rd GEN Network and 4th Rispescia International Seminar Sustainable Bio-resources for Global Welfare
60
Monitoring of REDD+ Projects
The main aim is to develop a monitoring, verification and reporting system that will allow for transparent accounting of emission and removals of carbon dioxide against projected reference scenario. R obust methods to determine changes in carbon stock and improvement of livelihoods will be undertaken as per the required international standards. CONCLUSIONS AND WAY FORWARD
Progress in R-PP is on track with a lot of enthusiasm on t he ground by the local community and policy makers. Although no a greement was reached on REDD mechanism in 15th Conference of the Parties (COP 15) held in Copenhagen, December 2009, it’s hoped an agreement will be reached in the forthcoming COP 16. Dissemination of research outputs to target beneficiaries will be crucial in addressing drivers of deforestation to alleviate further carbon emission and consequently enhance the carbon sink. Inadequate forest resource database, inconsistent methodologies and unclear benefit sharing arrangements are the key challenges.
LITERATURE CITED
Akotsi E., Gachanja M. and Ndirangu J. (2006) Changes in Forest cover in Kenya’s five water towers, 2000 – 2005. Department of resource surveys and remote sensing and Kenya forest working group
Food and Agriculture Organization (2009) Global Forest Resources, 2010 Country Report, Kenya
Gibbs H. K., Brown S., Niles J.O., Foley J. A. (2007) Monitoring and estimating tropical forest carbon stocks: making REDD a reality. Environ Res. Lett. 2 (13pp)
Government of Kenya (2002) First National Communication of Kenya to the Conference of Parties to the United Nations Framework Convention on Climate Change
Government of Kenya (2005) Kenya Forest Act 2005, 67 pp
Government of Kenya (2010) National Climate Change Response Strategy, 2010, Government Printers
KEFRI (2008) Kenya Forest Research Institute Strategic Plan, 2008 – 2012
UNFCCC (2008) Report of the Conference of the Parties on t hirteenth session held in Bali from 3 to 15 December, 2007
3rd GEN Network and 4th Rispescia International Seminar Sustainable Bio-resources for Global Welfare
61

THE INFLUENCE OF IMPLEMENTING TOTAL QUALITY MANAGEMENT TOWARDS INNOVATION PERFORMANCE
Meirani Harsasi ([email protected])
Olivia Idrus ([email protected]) Universitas Terbuka
Address correspondence: Faculty of Economics Universitas Terbuka Jl. Cabe Raya, Pondok Cabe, Pamulang
Tangerang Selatan 15418
ABSTRACT
Total Quality Management (TQM) is a topic that is often linked to company performance, including innovation performance. Some studies showed that TQM has influence on pe rformance, while some others showed contrary results. This study examined the effect of TQM on innovation performance of manufacturing companies in West Java - Indonesia. The method of data collection was conducted through mailed questionnaires, which consist of 155 r espondents using purposive sampling method. The hypotheses were tested by using multiple regression analysis. The results indicated that all TQM variables had significant influence on i nnovation performance. Another finding was that strategic planning was the only independent variable that had negative impact on innovation performance.
Keywords: TQM, innovation performance, manufacturing companies
INTRODUCTION Indonesia's business world is faced with some tough challenge. Companies have to compete on regional, national and even international arena as well. Therefore, competing globally is a requirement for companies to survive. To obtain competitive advantages, companies must be able to provide a high quality of products or services with reasonable and competitive prices. Moreover, companies should realize the importance of quality and quality management as major factors of success to enhance the ability to compete. In other word, the main key to improve competitiveness is quality. Hence, companies need to focus on quality or Total Quality Management (TQM).
Dimensional concept of quality management has often been mentioned by
many experts. Dean and Bowen, 1994; Hackman and Wageman, 1995; Powell, 1995 state that the elements of TQM include: the involvement of top management team, the adoption of quality philosophy, the emphasis on T QM-oriented training, customer focus, continuous process improvement, management by facts, and the use of TQM methods. Thus for the organization to improve all aspects of products and services to consumers, TQM can be used as management application for the whole organization (Heizer and Render, 2005).
The implementation of quality management is not always successfully implemented within company. In a research conducted by Buran (1994) in Ettlie (1997) about quality programs of companies in the United States, it s hows
3rd GEN Network and 4th Rispescia International Seminar Sustainable Bio-resources for Global Welfare
62
that more than 50% of surveyed companies reported that their quality program does not produce improvements in business performance. Only third of surveyed companies believe that quality program affects its competitiveness significantly. Taylor (1997) also shows a similar result. Taylor’s research on the role of leadership in TQM in small firms shows that the respondent answers regarding the application of quality management in company is inconsistent, for example, small firms that have positive results of TQM are actually not really understand about TQM. In addition, smaller companies also lack the motivation to achieve TQM but claim that quality management is a strategic issue in organizations. These failures happen due to the implementation of TQM partially.
Research on quality management is often associated with company performance. Murphy, Trailer, and Hill (1996) states that the measures of performance in business enterprise can be determined from the efficiency, growth rate, profit, size, liquidity, failure or success and leverage. Research by Madu, Kuei, and Jacob (1996) states that the measures of organizational performance shown by the short-term and long term performance, productivity, cost performance, profitability, competitiveness, sales growth, revenue growth and market share. Other performance measurement that can be used to determine the company performance is innovation performance. Therefore in order to obtain all aspects of innovation, the measurement of product and process innovation were conducted (Prajogo dan Sohal, 2006). The criterias that were developed to measure the innovation is determined based on previous studies that include the speed of innovation, degree of innovation and market share.
Many studies have focused on the impact of quality management on bus iness performance and still show contradictory
results. Some research shows the result of the relationship between quality management on performance. But other studies also show the opposite result as quality management and performance do not have any correlation. Research by Flynn, Schroeder, dan Sakakibara (1995) which examines the effect of quality management practices on quality performance and competitive advantage, is one of the researches that support the existence of the relationship between quality management with performance. The results show that the infrastructure has an influence on the implementation of quality management. This result also supported by Ahire, Golhar, and Waller’s (1996) research which confirm the positive influence between the quality management strategies and the quality of the company's products. Moreover, Madu, Kuei, and Jacob (1996) also reveal a similar result stating that there is a relationship between quality dimension and organizational performance.
On the other hand, several other studies on this subject show contradictory results that quality management has no effect on performance. Powell (1995) conducted research on T QM and shows that not all TQM practices influence corporate performance. Out of 12 elements of TQM, only three elements that affect the performance e.g executive commitment, open organization and employee empowerment. And other elements, such as benchmarking, training, flexibility, process improvement and the repairement of measuring instruments, show no significant effect on the performance of TQM. The result of Powell's research is supported by research conducted by Dow, Samson, and Ford (1999) explaining that there is no di rect positive relationship between quality management practices with quality performance. This research also reveals different results from the previous research by Flynn, Schroeder, and Sakakibara (1995) which shows the
3rd GEN Network and 4th Rispescia International Seminar Sustainable Bio-resources for Global Welfare
63

results of any significant effect between quality management with quality performance. Furthermore, Flynn, Schroeder, and Sakakibara’s (1995) research then was replicated by Kumalaningrum (2000). Kumalaningrum research shows that not all of TQM’s practices have a positive effect on performance. There is even only one practice of TQM that affect the performance quality i.e statistical control/feedback.
Based on research results that show the differences in influence of TQM implementation on performance, this research is conducted to determine how the application of TQM affects the performance of manufacturing companies in Indonesia.
RESEARCH HYPOTHESES AND DEVELOPMENT MODEL
Hypothesis Development
TQM implementation can be done from various aspects, including leadership, strategic planning, customer focus, information and analysis, workforce management, and process management (Prajogo & Sohal, 2006). The study also shows a correlation between TQM implementation with performance innovation.
Therefore based on the theoretical framework, the hypothesis proposed in this study are: 1. H1: leadership has an influence on
innovation performance. 2. H2: strategic planning has an influence
on innovation performance 3. H3: focus on customer has an influence
on innovation performance 4. H4: information and analysis has an
influence on innovation performance 5. H5: workforce management has an
influence on innovation performance
6. H6: process management has an influence on innovation performance
Research Model
The proposed research model is:
Figure 1. Research Model
RESEARCH METHOD
To achieve the research objectives in analyzing the effect of TQM on innovation performance, six dependent variables were used i.e leadership, strategic planning, customer focus, information and analysis, workforce management, and process management. Beside that innovation performace was applied as independent variable. Moreover, the instruments used for measurement were prepared in accordance with the variable that will be measured using a 5-point Likert scale.
The population in this study is all manufacturing companies in West Java registered in the Manufacturing Industry Directory that published by the Central Statistics Agency of West Java Province in 2006. The selection of West Java province
Leadership
Strategic Planning
Focus on Customer
Information and Analysis
Workforce Manajement
Process Manajement
Innovation Performanc
3rd GEN Network and 4th Rispescia International Seminar Sustainable Bio-resources for Global Welfare
64

as the population of the study based on data from the Capital Investment Coordinating Board since almost 60% of manufacturing industry in Indonesia is located in West Java. Furthermore, the sample in this study includes big manufacturing companies located in West Java. Probability sampling was applied as sampling method with simple random sampling as the sampling technique. Probability sampling is used when the elements in the population have equal opportunity to be selected as subjects in the sample (Sekaran, 2003). And simple random sampling is applied when every element in the population are known and have the same opportunity to be selected as subject to obtain a sample size that was determined. The samples in this study were taken from the Manufacturing Industry Directory published by the Central Statistics Agency of West Java in 2006.
Data used in this study are primary data wherein the method of data collection is done through a survey using questionnaires. Herein the mail survey was conducted by sending a questionnaire through mail to the respondents who have been determined. After the data was collected, the next step was analyzing the sequence data by conducting the test of validity, reliability and hypotheses using multiple linear regression analysis.
RESEARCH RESULTS AND DISCUSSION
Data Collection
Data were collected by sending questionnaires, with a total of 1.374 copies of questionnaires. The results of the distribution of questionnaire shows that from 1.374 copies of questionnaires, as many as 32 questionnaires were returned because of unknown addresses, 155 questionnaires were returned and could be used, and the rest 37 questionnaires were returned but could not be used because the information provided was incomplete.
All manufacturing companies who have participated and taken as sample in this study represent large-scale manufacturing companies with the criteria of at least 100 workforces. This criterion is based on the criteria issued by the Central Bureau of Statistics (2003).
Industrial types of samples were classified according to the classification of industrial field operations at the industrial directory issued by BPS (2003). Based on the classification of industrial field operations by BPS, there are 20 types of industries as shown in table 1.
Table 1. Classification of Industrial Manufacturing Company in West Java
No. Industry Type Amount 1. Nonmetallic minerals 1 2. Furniture & wood processing industry 5 3. Rubber and rubber materials 10 4. Wood and articles of wood 6 5. Motor vehicle 6 6. Paper and pulp 3 7. Chemicals and chemical’s products 20 8. Leather and leather goods 2 9. Electricity nd electrical equipment 11 10. Basic metals 3 11. Food and beverages 41
3rd GEN Network and 4th Rispescia International Seminar Sustainable Bio-resources for Global Welfare
65

12. Machinery and equipment 5 13. Machines office equipment 8 14. Apparel 15 15. Publishing and printing 3 16. Gas Processing 2 17. Radio, TV and electronic equipment 6 18. Textiles 9 19. Metal goods 7 20. Tobacco - 21. Total 155
Source: Processed data
Validity and Reliability Test Results
To achieve the research objectives that have been defined, firstly, the testing of the validity of instruments was conducted. Validity testing is done through Confirmatory Factor Analysis (CFA). Measurement using CFA is shown with indicator of each construct that has a significant loading factor which proves that the indicator is a unit measuring instrument that measures the same constructs and can predict well constructs that should be predicted (Hair et al., 2006). CFA measurement was performed on each given question which shows a grouping of the variables that had been specified.
Based on the results of CFA’s calculation, it indicates that the acceptable convergent validity is items that have a factor loading greater than 0.40 and significant level of 5%. From the results of factor analysis, the overall validity of nearly all the items shown above 0.40 a nd there are three questions that must be excluded because they do not meet the validity requirements of kp2, pl5, and pl6. For that, those three items of question must be removed in the next validity analysis. By looking at the results of both analyses, all items show the validity above 0.40. This signifies that the instruments used in this study actually measure the real thing (Sekaran, 2003).
Table 2. Results of the Final Validity Testing
Item Component Notes 1 2 3 4 5 6 7
Kp1 .694 valid Kp3 .732 valid Kp4 .804 valid St1 .803 valid St2 .702 valid St3 .546 valid St4 .871 valid Pl1 .562 valid Pl2 .784 valid Pl3 .842 valid Pl4 .684 valid I1 .792 valid I2 .810 valid I3 .761 valid I4 .711 valid Tk1 .666 valid
3rd GEN Network and 4th Rispescia International Seminar Sustainable Bio-resources for Global Welfare
66

Tk2 .750 valid Tk3 .657 valid Tk4 .688 valid Tk5 .596 valid Pr1 .609 valid Pr2 .700 valid Pr3 .713 valid Pr4 .737 valid Pr5 .767 valid Pr6 .656 valid K1 .635 valid K2 .490 valid K3 .578 valid K4 .517 valid K5 .761 valid K6 .877 valid K7 .825 valid K8 .706 valid K9 .626 valid
Having tested the validity, the next step was conducting reliability test. The reliability testing of each construct was done by using the coefficient of Cronbach's Alpha and item-to-total correlation that is useful to improve the measurement by eliminating the items that could decrease the Cronbach's Alpha. From the result of reliability testing, the value of Cronbach's Alpha obtained in all
constructs is greater than 0, 60. And since each constructs have alpha values above 0.60, it means that all constructs have met the reliability test. In other words, the internal consistency of each items of questions in the questionnaire are acceptable. The full results of the reliability test using Cronbach's Alpha can be seen in Table 3
Table 3. Reliability Test Results
Variabel Cronbach’s Alpha Value Based on Standardized Items
Notes
Leadership (Kp) .727 Reliable Strategic Planning (St) .758 Reliable Customer Focus (Pl) .744 Reliable Information and Analysis (I) .793 Reliable Manpower Management (Tk) .728 Reliable Process Management (Pr) .829 Reliable Innovation Performance (K) .880 Reliable
After the question had been tested for validity and reliability, then the next step is testing the hypothesis. In this research, the hypotheses were tested using multiple linear regressions. The variables of leadership, strategic planning, customer focus, information and analysis, workforce
management, and process management, were applied as independent variables. While the innovation performance as dependent variables. By using multiple regression models in SPSS version 12, the value of t as parameter estimation, multiple correlation coefficients (R), and
3rd GEN Network and 4th Rispescia International Seminar Sustainable Bio-resources for Global Welfare
67

coefficient of multiple determinations (R 2)
were obtained, as well as the regression coefficient for each independent variable. The application of α for 0.05 on t his research means it has 95% of confidence level.
Referring to the limits above, it can be said that if the value of p ≤ 0.05, it means that the independent variables influence the
dependent variable significantly, with 95% of confidence level and tolerate a maximum deviation level of 5%, while the coefficient of multiple determination (R 2) indicates the ability of independent variables that jointly explain the variation of the dependent variable.
For more details, test results of multiple regression can be seen in table 4
Table 4. Multiple Regression Test Results
Independent Variables Coefficient Standard Error t Sig t Leadership (Kp) .229 .069 3.065 .003 Strategic Planning (St) -.149 .077 -2.093 .038 Customer Focus (Pl) .162 .075 2.157 .033 Information and Analysis (I) .153 .059 2.135 .034 Manpower Management (Tk) .154 .066 2.108 .037 Process Management (Pr) .190 .096 2.429 .016 R2 .226 Adjusted R2 .236 F 8.930 Sig F .000
Based on test result in Table 4, it indicates that all the independent variables have significant impact, which means that those independent variables can give a positive influence on innovation performance simultaneously. However, the values of R 2 in this model is very low (only 0.226) which means that 22% of the company's innovation performance variation can be explained by the variables of leadership, strategic planning, customer focus, information and analysis, workforce management, and process management. However, by considering the contribution given by each independent variable, then it can be concluded that all independent variables have a s ignificant effect on t he level of α ≤ 0.05.
CONCLUSION AND RECOMMENDATION
Conclusion
This study aims to analyze the effect of TQM implementation that includes the variables of leadership, strategic planning, customer focus, information and analysis, workforce management, and process management toward innovation performance of manufacturing companies. Many studies have focused on the impact of quality management on bus iness performance. Prajogo and Sohal (2006) examined the relationship of TQM implementation on pe rformance quality and innovation performance and showed that TQM has an affect on quality performance and innovation performance.
3rd GEN Network and 4th Rispescia International Seminar Sustainable Bio-resources for Global Welfare
68
Data were collected by sending questionnaires with a total of 1.374 copies of questionnaire. The results of the distribution of questionnaire shows that from 1.374 copies of questionnaires that were sent, as many as 32 questionnaires were returned because of unknown addresses, 155 que stionnaires were returned and could be used, and the rest 37 questionnaires were returned but could not be used because the information provided was incomplete. All manufacturing companies who have participated and taken as sample in this study represent large-scale manufacturing companies with the criteria of at least 100 workforces. This criterion is based on the criteria issued by the Central Bureau of Statistics (2003).
Statistical test of the collected data was done gradually, namely through the test of validity, reliability, and multiple linear regression. The validity test results indicate that there are three items of question (kp2, pl5, and pl6) that must be removed from subsequent analysis because they were not clustered in the right factors. While the reliability test shows that all variables are reliable. Futhermore, the hypothesis test results using multiple linear regression shows that all the independent variables have a s ignificant effect on the dependent variable simultaneously. However, the values of R 2 in this model is very low (only 0.226) which means that 22% of the company's innovation performance variation can be explained by the variables of leadership, strategic planning, customer focus, information and analysis, workforce management, and process management. However, by considering the contribution given by each independent variable, then it can be concluded that all independent variables have a significant effect on the level of α ≤ 0.05.
Suggestion
Based on t he conclusions, it is expected that this research could have implications for future research. The limitations in this study should be refined for subsequent research. As for things that need to be considered for further research are:
1. This research is expected to contribute to further research in the field of Operations Management. This research analyzes performance in terms of performance innovation. The next study is expected to use other measure of performance, for example by adding a marketing performance and financial performance, so that the effect of quality management towad the overall business performance can be determined.
2. The sample for this research only covers manufacturing industries in West Java. Subsequent research is expected to take samples in other areas or wider region that can accurately portray the industry in Indonesia.
3. In this research, the samples were taken from all types of industries without specializing in specific industry types. Subsequent research is expected to draw a sample in some specific industries thus the results have strong characteristics of the selected type of industry.
REFERENCES
Ahire, S., Golhar, D. dan Waller, M. (1996). Development and validation of TQM implementation constructs. Decision Sciences, Vol. 27, pp. 23 –56.
Ahire, S., dan Dreyfus, P. (2000), The impact of design management and process management in quality: an
3rd GEN Network and 4th Rispescia International Seminar Sustainable Bio-resources for Global Welfare
69

empirical investigation. Journal of Operations Management, Vol. 18, pp. 549-575.
Dean, J; & Bowen, D. (1994). Management theory and total quality: improving research and practice through theory development. Academy of Management Review, 19:392-418.
Dow, D., Samson, D., dan F ord, S. (1999). Exploding the myth: do a ll quality management practices contribute to superior quality performance?. Production and Operations Management, Vol. 8 No. 1, pp. 1-27.
Ettlie, J.E. (1997), Quality, technology, and global manufacturing. Productions and Operations Management, Vol. 6 No. 2, pp. 150 -166.
Flynn,B.B., Schroeder,R.G., & Sakakibara, S. (1995). The Impact of quality management practices on performance and competitive advantage. Decision Science, 26, 5, 659-691
Fynes, B. dan Voss, C. (2001). A path analytic model of quality practices, quality performance, and business performance. Production and Operation Management, Vol. 10 No.4, pp. 494-513
Hackman, J; & Wageman, R. (1995). Total quality management: empirical, conceptual, and practical issue. Administrative Science Quarterly, 7:375-381.
Hair, Jr., J.F., Black, W.C., Babin, B.J., Andersen, R.E. dan Tatham, R.L. (2006). Data Analysis Multivariate 6th edition. New Jersey:.Pearson Education, Inc.
Heizer, J. dan Render, B. (2005), Operations Management. New Jersey: Pearson Education, Inc.
Kumalaningrum, M.P. (2000), Analisis hubungan TQM, kinerja perusahaan dan keunggulan kompetitif perusahaan. Tesis Program Pascasarjana Magister Sains Program Studi Manajemen Universitas Gadjah Mada. Tidak dipublikasikan.
Madu, N. C., Kuei, H.C. & Jacob, A. R. (1996). An empirical assesment of the influence of quality dimensions and organizational performance. International Journal of Production Research, Volume 34, No. 7.
Murphy, B. G., Trailer, W.J. & Hill, C.R. (1996). Measuring performance in entrepreneurship research. Journal of Business Research, Volume 36, 15 -23.
Powell, T. (1995). Total quality management as competitive advantage: a review and empirical study. Strategic Management Journal, 16: 15-37.
Prajogo, D.I., & Sohal, A.S. (2006) The integration of TQM and technologi/R&D management in determining quality and innovation performance. The International Journal of Management Science, 34, pp. 296-312
3rd GEN Network and 4th Rispescia International Seminar Sustainable Bio-resources for Global Welfare
70

Sekaran, U. (2003). Research Methods for Business: A Skill Building Approach 4th edition, John Wiley & Sons, Inc.
Taylor, W.A. (1997), Leadership challenges for smaller organizations: self-perceptions of TQM implementation. Omega
International Journal of Management Science, Vol. 25 No. 5, pp. 567-579.
3rd GEN Network and 4th Rispescia International Seminar Sustainable Bio-resources for Global Welfare
71

A FRAMEWORK OF PERFORMANCE MEASUREMENT SYSTEM TO MEASURE THE SUSTAINABILITY FURNITURE PRODUCTION IN
SMALL-MEDIUM ENTERPRISES (SMEs)
Muh. Hisjam Ph. D Candidate in Environmental Science, School of Graduate, Gadjah Mada University
Jl. Teknika Utara, Pogung, Sleman, Yogyakarta, 55281, INDONESIA Laboratory of Logistics System and Business,
Department of Industrial Engineering, Faculty of Engineering, Sebelas Maret University Jalan Ir. Sutami No. 36ª, Kentingan, Surakarta, 57126, INDONESIA
E-mail:[email protected]
Wahyudi Sutopo1 Laboratory of Logistics System and Business,
Department of Industrial Engineering, Faculty of Engineering, Sebelas Maret University Jalan Ir. Sutami No. 36ª, Kentingan, Surakarta, 57126, INDONESIA
E-mail:[email protected] 1 Corresponding author/ Presenter
ABSTRACT
There are many Small-Medium Enterprises (SMEs) that produce furniture products in Surakarta Residence, Central Java, Indonesia. Their products are less competitive than the products from the other countries. One of the unsustainable of raw material is an important reason to make their export uncompetitive. This paper describes the performance measurement framework for investigating problems of the sustainability furniture production in SMEs. This will fill the lack of understanding of sustainable Supply Chain Management (sSCM) especially for Furniture SMEs in Surakarta Residence. The paper describes a structured methodology for the design of performance measurement systems in the sustainable wood supplies. This framework provided guidelines that are subsequently used to inform the development of a value chain approaches. This paper contributes a scheme to highlight a difference between input, process, output, and outcome measures in raw material procurement for furniture manufacturers. The findings of the key performance indicators for mapping problems of raw material procurement are presented. The alternatives of value chain for ensuring of sustainable raw material supplies are discussed. Keywords: p erformance measurement system, sustainable SCM, value chain, furniture SMEs.
1. INTRODUCTION Indonesia is rich with tropical wood
species that support the furniture industry such as teak, rubber wood, mahogany, and acacia (Usaid, 2006; Asmindo, 2008). Indonesia is one of main exporter wooden furniture products to the global market (Loebis and Schmitz, 2005, T ambunan, 2006). This growth generates high demand for wood materials up to 7 million cubic meters of wood materials annually (Asmindo, 2008). Most of wooden furniture producers spread over in Java Island
especially in Jepara, Solo Raya, Semarang, Surabaya and Gresik. There are many Small-Medium Enterprises (SMEs) that produce furniture products in Solo Raya, Central Java, Indonesia (Sutopo, 2006; Yuniaristanto et al., 2009). To export their products, SMEs have to be part of a furniture value chain. The value chain describes a s equence of related business activities including from the provision of specific inputs (base raw materials, semi-finished materials), through primary production as well as transformation and marketing (wholesaler and retailers/distributors/exporters), up to the
3rd GEN Network and 4th Rispescia International Seminar Sustainable Bio-resources for Global Welfare
72

final sale of the particular product to the consumer (Usaid, 2007). Since the last few decades, there are some possible problems in raw material supplies for instant unsustainable and insufficient of raw material supply, inconsistence of raw material quality, and high fluctuation of raw material costs (Sutopo, 2007, Reichert, 2007). It is of importance the sustainable wood supply to ensure the sustainability of raw material supply in furniture production for SMEs. This situation forces SMEs to not only focus on economic targets but also on social as well as on environmental issues. However, it is difficult challenges for SMEs to develop and maintain focus on the sustainability.
The sSCM is a root in supply chain management where sustainability refers to an integration of social, environmental, and economic issues (Teuteberg & Wittstruck, 2010). The New Zealand Business Council for Sustainable Development (2003) defines sustainable supply chain management (sSCM) as “Management of raw materials and services from suppliers to manufacturer/service provider to customer and back with improvement of the social and environmental impacts explicitly considered”. Many contributors, for instant Dakov & Novkov (2008), Seidel et al. (2009), Croom et al. (2009), Juang et al. (2009, Ninlawan et al. (2010), and Teuteberg & Wittstruck (2010) have dealt with investigated literature review and models on sSCM. Exploratory study intended to provide an overview of practice and inform further researches were done by Dakov & Novkov (2008), Croom et al. (2009) and Teuteberg & Wittstruck (2010). Seidel et al. (2009), J uang, et al. (2009) and Ninlawan (2010) were developed models on s SCM considering supply chain issues for manufacturing and procurement in electronics industry. According to Teuteberg and Wittstruck (2010), there are two crucial problems for implementing sSCM : how measures the sSCM establishment and how relationship between sSCM establishment and long-term financial success. Furthermore, the integration of key business processes is required to achieve the suitable economic results and to leverage benefits (Simchi-Levi et al. 2003, C hopra and Meindl, 2004).
As in the papers cited above, none of the previous works is appropriate to investigate the challenges for SMEs to develop and
maintain focus on the sustainable wood supplies for furniture SMEs. However, the SMEs have differences problems compared to large companies. In this work, a strategic level of supply chain performance evaluation is addressed, that is a framework of performance measurement system. A set of performance measures will be build up to identify the problems of SMEs on implementing sSCM. This paper will fill the lack of understanding of sustainable Supply Chain Management (sSCM) especially for Furniture SMEs in Surakarta Residence. The objective of this paper is to determine a structured methodology for the design of performance measurement systems for mapping problems of raw material procurement. In the second section in this paper, we describe a framework of PMS in the sSCM. In the third section, we describe a case study the sSCM for furniture production in Solo Raya SMEs. Finally, conclusions and future research directions are presented in Section 4.
2. A FRAMEWORK OF sSCM FOR
FURNITURE PRODUCTION IN SMEs SMEs are dominating up t o 85%
furniture producers and the rest are large enterprises or trading/exporter houses in Solo Raya (Sutopo, 2007). It is important to discuss a s pecific framework of sSCM for furniture production in SMEs because they have specific characteristics compared to large enterprises. We pictured the real condition to determine the relevant system then investigated possible sSCM issues related to the SMEs in Solo Raya.
2.1 The Furniture Industry Value Chain
The relationship between the SMEs and the large enterprises (LEs) in Solo Raya furniture industry can be described using value chain analysis. This concept considers the business transactions from inputs to raw material production through harvesting, trading, processing/manufacturing, and distribution up to final consumption. In order to attain more insight into the furniture industry value chains (IVC), we conduct a field research in the furniture cluster in Solo Raya (Sutopo, 2006, 2007). Survey respondents were collected from multiple sources and included interviews with
3rd GEN Network and 4th Rispescia International Seminar Sustainable Bio-resources for Global Welfare
73

suppliers, manufacturers, distributors, retailers, and Indonesia Furniture Association. This study is aimed to map the value chains (physical supply chain and actors), from input suppliers to end consumers; and to describe the mechanisms and the inter-relationship (main activities and objectives) of these
firms throughout each step of the IVC. The Furniture IVC can be shown in Fig. 1
2.2. A specific framework of sSCM
for furniture production in SMEs
A specific framework of sSCM for furniture production in SMEs can be developed into two steps (Fig.2). First, we capture current relationship between the SMEs and the LEs in furniture industry and then describe the scope and activities of the SMEs related to sSCM. According to NZBCSD (2003); Dakov & N ovkov (2008); Ninlawan et al. (2010); Teuteberg & Wittstruck (2010); a scope and activities of the SMEs related to furniture sSCM is described. In general, we observed about procurement, manufacturing, distribution, and/or reverse logistics cycle. Then, we investigated significant issues for the relationship between the SMEs and the Les
related to raw material procurement for furniture manufacturers. The procurement cycle discuss some activities related to sustainable source of raw materials including all components; short-long term supply, inventory levels and fair play, consisting of involvement in activities that include the reduction, reuse and recycling
of materials in the process of purchasing for SMEs. The manufacturing cycle is defined as furniture production processes which use inputs (water, air, energy and materials) with relatively low effect on environmental impacts (waste, pollution, and contamination). The manufacturing cycle can lead to lower operational costs and production efficiency gains. The distribution cycle are consists of green packaging and green logistics. Packaging characteristics such as size, shape, and materials have an impact on distribution because of their affect on t he transport characteristics of the product. Reverse logistics cycle is the process of retrieving the product from the end consumer for the purposes of capturing value or proper disposal. Activities include collection, combined inspection/selection/sorting, reprocessing/direct recovery, redistribution, and disposal.
Figure 1: The Furniture Industry Value Chain
3rd GEN Network and 4th Rispescia International Seminar Sustainable Bio-resources for Global Welfare
74
Figure 2: A specific framework of sSCM for furniture production in SMEs
The furniture clusters in Solo Raya are selected for case studies. Their products can be categorized as bedroom (30%), living room (30%), kitchen (20%) and case goods such as bookcases, cabinets and dressers (20%). T he supply chain considers the interactions between a business and its customers and suppliers. The SMEs are heavily dependent to export their products due low quality, little marketing knowledge and a lack of sustainable supply of raw material (Reichert, 2007). The SMEs also have some limitations related to procurement, internal operations and product development & stewardship (Tambunan, 2006; Sutopo, 2006, 2007; Yuniaristanto et al, 2009). Key constraints of integrating SMEs into value chains in sSCM are: lack of information about sSCM (what is a sSCM and why it is important; how to implement a sSCM for their business) and SMEs often rely on hierarchical patron-client relations and stratified value chains, with an unequal distribution of benefits. Furthermore, the partnership between the SMEs and the LEs into a part of the furniture sSCM is challenging due to the following important constraints: diversity of constitution of SMEs (with informality and insecure financial resources), lack of managerial capacity and bargaining power to deal with business partners (financial institutions; buyers, and etc) and inadequate market information.
3. A Scheme of PMS in sSCM for
Furniture Production in SMEs SMEs need to recognize that they have
to identify, understand and manage issues within their own company in the sSCM issues. The furniture industry in the Solo region has not been able to compete in the global market some possible problems related to sustainability of wood supplies. The SMEs have some barriers for implementing sSCM. To address these issues, it is important to measure problems in current system. It is important to develop a suitable performance measurement system to address SMEs issues including the sSCM scope, structure, and activities. A performance measurement system (PMS) can be defined as the set of metrics used to quantify both the efficiency and effectiveness of actions (Neely et. al. 2000 and Bourne et. al, 2003). Based on a specific framework of sSCM for furniture production in SMEs, we focus on manufacturing cycle especially for representing the relationship between the SMEs and the LEs including procurement, internal operations and product development & stewardship. Then, we investigate a scheme to highlight a difference between input, process, output, and outcome measures in raw material procurement for furniture manufacturers (Figure 4).
3rd GEN Network and 4th Rispescia International Seminar Sustainable Bio-resources for Global Welfare
75

Figure 4: A scheme of PMS in sSCM for Furniture Production in SMEs
Based on Fig. 4., there are some strategic partnership projects between the SMEs and the LEs. The objectives of every SPPs will be investigating problems, extensive field study on industrial practices and experiences, construction of the sustainability furniture production models, and models validation in terms of model structure, behavior, and predictability to solve the problems. The report presents briefly the concept of SPPs, its requirements, activities and outcomes. It makes a p roposal for a s cheme of PMS in sSCM for Furniture Production in SMEs, which suggests more holistic approach of thinking and way of visualization, incorporating more environmental, social, and economic aspects. To make this proposal clear, a more profound description of the possibilities for action is offered.
4. CONCLUSION Establishing sSCM for furniture manufacturing in Solo Raya is heavily determined b y the relationship between
the SMEs and the LEs. The SMEs have some limitations related to procurement, internal operations and product development & stewardship. Therefore, in this study, a specific framework of sSCM for furniture production in SMEs was established. Then, this works give a scheme to highlight a difference between input, process, output, and outcome measures in raw material procurement for furniture manufacturers. It makes a P MS tool for mapping problems of raw material procurement. The following conclusions were summarized: • The relationship between sSCM
establishment and long-term financial for SMES could be presented outcomes not only to minimize operational costs but also to maximize corporate values.
• The SMEs should consider following key performance indicators: long term supply; 3R alternatives R/Ms; Co-efficient fabrication & assembling; upgrade labor-skills; and commitment to delivery.
• This result is pre-study for in detail further researches.
3rd GEN Network and 4th Rispescia International Seminar Sustainable Bio-resources for Global Welfare
76

ACKNOWLEDGMENTS The authors are grateful to the
anonymous referees for the comments and recommendations that improve the paper. This work was partially funded by Research Group of Logistic System and Business, Department of Industrial Engineering, Faculty of Engineering, Sebelas Maret University. REFERENCES 1. ----, ASMINDO (2008), Overview of
Indonesia Furniture and Handicraft Industry, available: www.timbertradeactionplan.info-%20Indonesia.pdf. Accessed June 25, 2009.
2. ----, NZBCSD - The New Zealand Business Council for Sustainable Development (2003), Business Guide to a Sustainable Supply Chain - A Practical Guide, available: www.nzbcsd.org.nz/supplychain, accessed July 17, 2010.
3. ----, USAID : T he United States Agency for International Development (2006), EU Furniture Market Study – Summary, available: http:// pdf.usaid.gov/pdf_docs/PNADH793.pdf. accessed June 25, 2010.
4. Bourne, M., Neely, A., Mills, J. and Platts, K. (2003), Implementing performance measurement systems: a literature review, Int. J. Business Performance Management, 5(1),1-24.
5. Chopra, S. and Meindl, P. (2004), Supply Chain Management : Strategy, Planning, and Operations, 2nd Edition. Prentice Hall, Upper Saddle River, New Jersey, USA.
6. Croom, S., Barani, S., B elanger, D., Lyons, T., and Murakami, J., (2009), Sustainable supply chain management – an exploration of current practice, European Operation Management Association (EurOMA) Conference, June, 2009.
7. Dakov, I and N ovkov, S. (2008), Sustainable Supply Chain Management – Scope, Activities and Interrelations with Other Concepts, Proceedings of the 5th International Scientific Conference of Information and Communication Technologies in Business, 640-645 (Vilnius, Lithuania, May 16-17, 2008).
8. Lambert, D.M. and Cooper, CM.
(2000), Issues in Supply Chain Management, Industrial Marketing Management, 29, 65-83.
9. Loebis, L and Schmitz, H. (2005), Java furniture makers: winners or losers from globalisation?, Available: www.standards.org.au, accessed July 17, 2010.
10. Neely, A., Bourne, M. and Kennerley, M. (2000), Performance measurement system design: developing and testing a process-based approach, International Journal of Operations & Production Management, 20(10), 1119-1145.
11. Ninlawan C., Seksan P., Tossapol K., and Pilada W. (2010), The Implementation of Green Supply Chain Management Practices in Electronics Industry, Proceedings of the 2nd the International Multi Conference of Engineers and Computer Scientists 2010, 1-6, (Hongkong, March 17-19, 2010).
12. Reichert, C. (2007), Rattan Furniture Value Chain Promotion in the Solo Region, Central Java, Indonesia. GTZ-RED, Jakarta, Indonesia.
13. Seidel,R., S hahbazpour, M. and Seidel, M. (2009), E stablishing Sustainable Manufacturing Practices in SMEs, http://www.engineers.auckland.ac.nz/~rsei001/ accessed June 25, 2009,
14. Simchi-Levi, D,. Kaminsky, P. & Simchi-Levi, E. (2003), Designing and Managing the Supply Chain : Concept, Strategies, and Case Studies. McGraw-Hill Higher Education, Singapore.
15. Sutopo, W. (2006), Report on S urvey on Regulations and Policies Affecting Rattan Furniture Production. (Baseline study on the Rattan Furniture Sector for case study in Surakarta and surrounding districts), Working Paper, Collaboration with Regional Economic Development (RED) and GTZ.
16. Sutopo, W. (2007), Mapping of Global Logistics Operating Systems in Indonesia: Rattan Industry Case Study, Working Paper, Laboratoy of Logistics System and Business, Department of Industrial Engineering, Sebelas Maret University, wrote in Bahasa Indonesia
17. Tambunan, T. (2006), The Growth and Competitiveness of Indonesia’s Wood Furniture Export, Indonesian Chamber of Commerce and Industry, Available: www.kadin-indonesia.or.id/./KADIN-
3rd GEN Network and 4th Rispescia International Seminar Sustainable Bio-resources for Global Welfare
77

98-3023-01082008.pdf, Accessed June 25, 2010.
18. Teuteberg, F. a nd Wittstruck, D. (2010), A Systematic Review of Sustainable Supply Chain Management Research: What is there and what is missing?, Proceedings of MKWI 2010, pp. 1001-1015. Available : www.uwi.uos.de/sscm_references.pdf, accessed June 25, 2010
19. Ying-Shen Juang, Shui-Shun Lin, Hua-Jhen Cao, and Rui-Lin Wang (2009), Green Supplier Selection Models Utilizing Voting Analytic Hierarchy Process, Proceedings of the APIEMS 2009, 2698-2709, (Kitakyusu, Japan, Dec 14-16, 2009).
20. Yuniaristanto, Sutopo, W., and Aisyati, A. (2009). A Facility Location-Allocation Model for Distributing Raw-Rattan Material To Increase the Rattan Industry Competitiveness: A Case Study. Proceedings the 5th International Intelligent Logistics System Conferences, 116.1– 116.7. (September 27th - 30th 2009, Gold Coast, AUSTRALIA).
AUTHOR BIOGRAPHIES Muh. Hisjam is a l ecturer in Department of Industrial Engineering, Faculty of Engineering, Sebelas Maret University. He obtained his Master degree in Industrial Engineering from Bandung Institute of Technology, Indonesia in 2002. H is research interest is in logistics information system, decision support system, logistics and supply chain development. He has published many papers in several national journals and proceeding of international conferences. His email address is [email protected] Wahyudi Sutopo is currently an assistant professor in the Department of Industrial Engineering, Sebelas Maret University and a researcher in the Research Group of Logistic System and Business, Faculty of Engineering, Sebelas Maret University. He received a B.S. in Industrial Engineering from Bandung Institute of Technology in 1999 and a M.S. in Management Science from the University of Indonesia in 2004. Prior to joining Sebelas Maret University in 2003, he spent 4 years in PT. Panasonic
Manufacturing Indonesia (was PT. Panasonic Gobel). His industrial experience is in product engineering, product planning, corporate planning and merchandizing for consumer electronics especially home appliance products. Since joining Sebelas Maret University, Sutopo’s research has been focused on supply chain design and performance evaluation, logistics management, and inventory & distribution. He can be reached at [email protected].
3rd GEN Network and 4th Rispescia International Seminar Sustainable Bio-resources for Global Welfare
78
THE UTILIZATION OF RARE SUGARS (8 KINDS OF KETOHEXOSES) TO CHICKEN SAUSAGE MAKING
Mulyana Hadipernata1) and Shigeru Hayakawa2)
1) Indonesian Center for Agricultural Postharvest Reseach and Development, Jl Tentara Pelajar 12,
Bogor 16114. email : [email protected] 2) Kagawa University, Faculty of Agriculture, Ikenobe, Miki, Kagawa 761-0795, Japan
ABSTRACT
Rare sugars are defined as monosaccharides that exist in nature but are only present in
limited quantities. Rare sugars have the potential to be used in sweeteners and as food products with new functional characteristics to prevent diabetes, arteriosclerosis and obesity by suppression of lipid accumulation and hyperglycemia. In this experiment, rheological property (breaking strength) and weight loss after cooked of chicken sausages added with different sugar (8 kind rare sugar) were determined. The results showed that the chicken sausage with addition D-Psicose, L-Sorbose, L-Tagatose and L-Fructose have a good reologycal properties than sucrose. The highest value of breaking stress was 1,22 x 10⁵ N/m2 with D-Psicose treatment and the highest value of breaking strain was 36,09 % with L-Fructose treatment. Seven Kinds of Ketohexoses (D-Psicose, D-sorbose, D-Tagatose, L-Psicose, L-Sorbose, L-Tagatose, L-Fructose) were superior to decrease weight loss of chicken sausage than sucrose, The result indicated that rare sugars can improved their ability to hold water in sausage.
Key words : chicken, sausage, rare sugars BACKGROUND
Chicken meat is an important food for meal which is well accepted by consumers all over the world. It is rich in essential amino acids and comprises high quantity of proteins, hence consumption of meat chicken and meat products such kind chicken sausage is currently growing. Sausage is an emulsion-type meat product and the main ingredients are meat, fat, water, salt, sugar, polyphosphate Sausages being one of the product that are delicious and nutritious due to their high content of protein, fats, vitamins and minerals. Sausages are comminuted and seasoned meat roducts that may be also cured, smoked, molded and heat processed (Judge et al, 1989). The major factors used in determining the quality of fresh sausage are colour, stability, general appearance, cooking properties and eating properties.
Rare sugars are defined as monosaccharides that exist in nature but are only present in limited quantities. There are more than 50 kinds of rare
sugars while naturally abundant monosaccharides such as D-glucose and D-fructose are very few in number. Rare sugars such as of D-Psicose showed high antioxidative activity and excellent food properties and is promising as a functional dessert for alderly people (Sun et al., 2007).
Granstrom et al (2004) describe a scheme to display all the rare sugars in a ring-form called an “Izumoring”. There are three different Izumorings, one for tetroses, one for pentoses, and one for hexoses. A scheme was drawn for the production of ketohexoses based upon the network composed of the four groups comprising all of the ketohexoses and hexitols. We can draw a s ymmetric Izumoring comprising of 16 a ldohexoses, 8 ketohexoses, and 10 hexitols. All the compounds are connected to each other by enzyme reactions or by hydrogenation reactions.
A ketohexose synthesis strategy using the Izumoring clearly suggests a
3rd GEN Network and 4th Rispescia International Seminar Sustainable Bio-resources for Global Welfare
79

way for designing a production process for any ketohexose from D-fructose that can be produced from D-glucose. For example, L-fructose has some interesting properties as a source of energy (Klein et al, 1993) and as an inhibitor for glycoproteins (Muniruzzaman et al., 1996). Following the route of the Izumoring from D-fructose to L-fructose we can facilitate the production method for L-fructose via four reactions. The first step is epimerization of D-fructose to D-psicose by D-tagatose 3-epimerase (Itoh et al., 1995). The second step is reduction of D-psicose to allitol (D-,L-allitol) by oxidoreductase (Takeshita et al.,2000). The third reaction is transformation of allitol (D-,L-allitol) to L-psicose by oxidoreductase. The final step is epimerization of L-psicose to L-fructose by D-tagatose 3-epimerase (Itoh et al, 1995).
In sausage making, after all ingredients are mixed together, meat emulsion is obtained and sausage is formed after heated, Therefore emulsifying and gelling properties are required in sausage making. T exture of sausage usually determined by viscoelasticity, high viscoelasticity indicates a good texture of sausage. Viscoelasticity is related to gelling property, when gel matrix is formed, water and other liquid substances will be held in this matrix. T herefore, if gel matrix can hold water well, sausage will have better viscoelasticity.
Concerning to health problem, health detrimental ingredients such as fat, NaCl, sucrose and polyphosphate have been tried to omit. Alternative methods to
maintain sausage texture with reduced amount or none of unsatisfied substance, such as using pressure, enzyme, or adding with the other ingredients such as rare sugar have been studied (Mugurama et al.,2003).
In this experiment, rheological property (breaking strength) and weight loss after cooked of chicken sausages added with different sugar (8 kind of Ketohexoses) were determined. MATERIAL AND ANALYSIS
Meat Chicken, salt and sucrose were purchased from local supermarket. D-Psicose (D-Psi), D-sorbose (D-Sor), D-Tagatose (D-Tag), D Fructose (D-Fru), L-Psicose (L-Psi), L-Sorbose (L-Sor), L-Tagatose (L-Tag), L Fructose (L-Fru) were obtained from rare sugar cluster, Kagawa University, Japan. For Sausage making, firstly, meat chicken and salt, polyphosphate and sugar were mixed together by a food processor (Food Processor TK-551, Tescom Japan) for I minute after that added with cold water, the mixture was mixed again by the some food processor for another I minute. Meat batter was left for 15 minute in a bowl with ice outside. After that, the meat batter was stuffed into a cel lulose casing (25 mm d iameter, captain stag Belgium). The stuffed sausages were heated in a water bath at 80oC for 30 minute, cooled down by leaving at room temperature for 2-3 hours.The ingredients ratio is showed in Table 1 and the flowchart of research showed in Figure 1.
Table 1. Ingredients in sausage making, different rare sugars were added into sausage No Code Treatment Material of sausage
Chicken meat
Cold Water
Sugar/ rare sugar
polyphosphate
Salt
1 C Control/Sucrose 200 g 50 ml 6 g 1 g 4 g 2 D-Psi D-Psicose 200 g 50 ml 6 g 1 g 4 g 3 D-Fru D-Fructose 200 g 50 ml 6 g 1 g 4 g 4 D-Tag D-Tagatose 200 g 50 ml 6 g 1 g 4 g 5 D-Sor D-Sorbose 200 g 50 ml 6 g 1 g 4 g 6 L-Psi L-Psicose 200 g 50 ml 6 g 1 g 4 g
3rd GEN Network and 4th Rispescia International Seminar Sustainable Bio-resources for Global Welfare
80

7 L-Fru L-Fructose 200 g 50 ml 6 g 1 g 4 g 8 L-Tag L-Tagatose 200 g 50 ml 6 g 1 g 4 g 9 LSor L-Sorbose 200 g 50 ml 6 g 1 g 4 g
To analyze rheological property,
sausage were cut vertically for 2 cm thick and measured the breaking strength by creep measurement using a r heometer (Rheoner RE2-3305, Yamaden Japan) Interfaced with a computer for
computation of creep phenomena. Furthermore to analyze weight loss, sausage were weighed before and after heating, and was expressed as a precentage, weight loss was calculated by the following formula :
Weight loss (%) = Weight after heated –Weight before heated X 100
Weight before heated
RESULT AND DISCUSION Figure 1a. Showed the value of
breaking stress of chicken sausage added with D-Psi was 1.22 x 10⁵ N/m2, that the highest value than Sucrose (1,02 x 10⁵ N/m2) and the other rare sugars. The value of breaking stress with D-Sor, D-Tag, D-Fru, L-Psi, L-Sor, L-Tag and L-Fru, were 0.95 ; 0,99 ; 0.99 ; 1,02 ; 1,05 ; 1,07 and 1,11 (x 105 N/m2). Moreover, the value of L-Sor, L-Tag and L-Fru were higher than value of sucrose, that added to chicken sausage.
Rare sugars as a s ausage additive contributes to improving and intensifying some properties of meat, protein, water-binding and emulsifying capacities. But not all kind af ketohexoxes have significance effect to increase of breaking stess value. D-Psi, L-Sor and L-Fru have ability to make meat emulsion In sausage making. Therefore emulsifying and gelling properties are required in sausage making.
Texture of sausage usually determined by viscoelasticity, high viscoelasticity indicates a good texture of sausage. Viscoelasticity is related to gelling property, when gel matrix is formed, water and other liquid substances will be held in this matrix. Therefore, if gel matrix can hold water well, sausage will have better viscoelasticity. The result indicated that D-Psi, L-Sor, L-Tag and L-Fru were superior and had acceptable function properties of breaking stress than sucrose.
Both the rheological properties and texture must be correlated with the structure and composition of the meat products. Therefore, evaluating a meat product’s rheological properties can help manufacturers to understand its flow and operation properties, estimate the protein network and gelation mechanism, and predict final product texture (Park et al., 1994).
a b
3rd GEN Network and 4th Rispescia International Seminar Sustainable Bio-resources for Global Welfare
81

Fig 1. Breaking stress (a) and breaking strain (%) (b) of chicken sausage added with different rare sugars. Each value represents error bars represents standard deviations (n=3).
The other sausage additive have the
some function with rare sugars to improving rheological properties of sausage. S alt is the main flavoring agent used in making sausages and it contributes to basic taste characteristics of the final product. Salt also "solubilizes" and extracts the muscle protein on the surface of meat particles. This semi-fluid protein film coagulates during heating, binding the meat particles together and producing a firm sausage texture, most sausage formulations contain 1 to 3% salt. Altough the other sausage additive have the some function with rare sugars to improving the quality of rheology properties, rare sugars have advantages as a functional food to improving in the medical field. Rare sugars such as of D-Psicose showed high antioxidative activity (Hayakawa, 2008). Rare suars can prevent diabetes, arteriosclerosis and obesity (Sun et al., 2007).
Figure 1b. showed the value of breaking strain of chicken sausage added with D-Psi was 35,11%. It has higher value than sucrose (34,27%) but lower than L-Tag and L-Fru. T he value of breaking strain with D-Sor, D-Tag, D-Fru, L-Psi and L-Sor were 31,42% ; 34,41% ;
32,93% ; 34,18% and 32,99%. Furthermore, the highest value of of breaking strain of chicken sausage added with L-Fru was 36,09%. Moreover D-Sor, and D-Fru resulting the value of breaking strain lower than sucrose. Chicken sausage properties can be improved with addition some ingredients to increase water-binding and emulsifying capacities. But not all kind af ketohexoxes as a ingredients have significance effect to increase of breaking strain value. D-Psi, D-Tag, L-Psi, L-Tag, L-Sor and L-Fru have ability to increase breaking strain In sausage making than sucrose treatment. The result indicated they treatments were superior function to increase reologycal properties of breaking strain.
As seen in Figure 2, weight loss value of D-Psi treatmant was 10.40%, that the lowest value than other treatment. Furthermore, D-Sor value 11,12% was lower than L-Sor 11,63%, however D-Tag and D-Fru have the higher value than L-Tag and L-Fru. Weight loss value of chicken sausage added with D-Tag and D-Fru were 11,41% and 12,97%. On the other hand, weight loss value chicken sausage added with L-Tag and L-Fru were 11,40 and 11,39.
Fig 2. Weight loss of chicken sausage after heated at 80oC for 30 minute. Each value represents error
bars represents standard deviations (n=3).
Weight loss is one of the most important properties of emulsion type
sausage products as it is related to water holding capacity. Higher water holding capacity of meat decreased weight loss in
3rd GEN Network and 4th Rispescia International Seminar Sustainable Bio-resources for Global Welfare
82

final products. Water holding capacity is defined as the ability of meat to retain its own or added water during application of external forces such as cutting, heating, grinding or processing (Judge et, al 1989). Water is added to be retained in many finished sausage products. Water aids the salt in "solubilizing" meat proteins, helps the mixing of the batter and contributes to the juiciness of the final product.. The research result showed that several rare sugars had a significant influence than sucrose to decrease weight loss of chicken sausage. Seven Kinds of Ketohexoses were superior to decrease weight loss than sucrose, On the other hand, one kind Ketohexoses (D-Fru) was inferior than sucrose, because it has higher value of weight loss. The result indicated that rare sugars can improved their ability to hold water in sausage. CONCLUSION D-Psi, L-Sor, L-Tag and L-Fru can improved reologycal properties of chicken sausage than sucrose. The highest value of breaking stress was 1,22 X 10⁵ N/m2 with D-Psi treatment and the highest value of breaking strain was 36,09 % with L-Fru treatment. Seven kinds of Ketohexoses (D-Psi, D-Sor, D-Tag, L-Psi, L-Sor, L-Tag, L-Fru) were superior to decrease weight loss of chicken sausage than sucrose, The result indicated that rare sugars can improved their ability to hold water in sausage. ACKNOWLEDGMENTS The author wish to thank Gadjah Mada Ehime Network (GEN) ; Kagawa University ; Indonesia Center for Agricultural Posthrvest Reserch and Development ; Dr. Adi Joko Guritno and Dr. Henry Yuliando. REFERENCES Granstrom, T.B., G. Takata, M.
Tokuda,AND K. Izumori. 2004. Izumoring: A Novel and Complete Strategy for Bioproduction of Rare Sugars Journal of Biosience
and Bioengineering. Vol. 97, N o. 2, 89–94.
Hayakawa, S. 2008. Improvement in food function using rare sugars. Collection technology achievment related to rare sugar, Kagawa University.
Itoh, H., Sato, T., and Izumori, K. 1995. Preparation of D-psicose from D-fructose by immobilized D-tagatose 3-epimerase. J. Ferment. Bioeng., 80, 101–103.
Izumori, K.: Bioproduction strategies for rare hexoses. Naturwissenschaften,89, 120–124 (2002).
Judge, M. D., Aberle, E., Ferrest, J. Hedrick, H. and Merkel, R. 1989. Principles of meat science. Kendall/Hunt publishing company. Iowa, USA.
Kim, J. M., & Lee, C. M. 1987. Effect of starch on t extural properties ofsurimi gel. Journal of Food Science, 52(3), 722–725.
Klein, M., Hoffmann, L., Block, H., and Herrmann, U. 1993. Investigation of energetic utilization of L-fructose in rats. Nahrung, 37, 305–320.
Kong, C. S., Ogawa, H., & Iso, N. (1999a). Compression properties of fish-meat gel as affected by gelatinization of added starch. Journal of Food Science, 64(2), 283–286.
Muguruma , M., Tsutruoka, K., Katayama, K., Erwanto, Y.,Kawahara, S., Yamaguchi, K., Sathe S. K., and Soeda, T. 2003. S oybean and milk protein modified by transglutaminase improves chicken sausage texture oven at reduced levels of phosphate. Meat Sciences, 63, 191-197.
Muniruzzaman, S., Pan, Y. T., Zeng, Y., Atkins, B., Izumori, K., and Elbein, A. D. 1996 Inhibition of glycoprotein processing by L-
3rd GEN Network and 4th Rispescia International Seminar Sustainable Bio-resources for Global Welfare
83
fructose and L-xylulose. Glycobiology, 6, 795–803.
Park, J. W., Yongsawatdigul, J., & Lin, T. M. 1994. R heological behavior and potential cross-linking of pacific whiting (Merluccius productus) surimi gel. Journal of Food Science, 59(4), 773–776.
Sun, Y., S. Hayakawa, M. Ogawa, K. Izumori. 2007. A ntioxidant properties of custard pudding dessert containing rare hexose, D-psicose. Food Control 18 : 220–227.
Takeshita, K., Ishida, Y., Takada, G., and Izumori, K. 2000. Direct production of allitol from D-fructose by a coupling reaction using D-tagatose 3-epimerase, ribitol dehydrogenase and formate dehydrogenase. J. Biosci. Bioeng., 90, 545–548.
3rd GEN Network and 4th Rispescia International Seminar Sustainable Bio-resources for Global Welfare
84

ABSTRACT Please contact their email to get the full paper
3rd GEN Network and 4th Rispescia International Seminar Sustainable Bio-resources for Global Welfare
85
D3-AGRO
Inserted Text
D3-AGRO
Inserted Text

SUCCUS BASE PRODUCT IN COUGH MEDICINE COMPETITION
Francis Wanandi PT Combiphar
ABSTRACT
OBH Combi become a generic brand for Black Liquid Syrop Cough Medicine in Indonesia since early 90’s. Black Liquid Syrop (OBH) has been an old formulation made by pharmacist for more then 100 years and can be made as a compound medicine by the pharmcist. Due to the high demand and pratices by most of pharmacist in Indonesia , Combiphar look as the opportunity to standarize the market by creating a mass production of OBH and branded OBH Combi. The response was very positive because that will reduce the complexity of making it by the pharmacist and also reduce their inventory of raw material as well as standard of giving to the consumer. During the crisis of 1997/98 where most company reduce their marketing expenditure, Combiphar is doing the opposite direction by investing heavly on the brand as well as spreading their coverage nation wide. The situation forced industry players to revisit pricing strategy because of the weakening purchasing power and consumers got smarter which they prefered to choose products with better value for money. With its price advantage in comparison to Multi National Company products, OBH Combi put more investment behind the brand across all areas: production line, distribution forces and brand communication in order to build strong brand awareness, consumers loyalty and trusted image. Using succus as one of key active ingredients, OBH Combi established its position as a long-heritage product that is trusted for its efficacy, a quick solution for cough problem. The brand becomes a leading player in cough medicine, rank no 1 in succus base cough syrup and rank no 2 in cough syrup market.
3rd GEN Network and 4th Rispescia International Seminar Sustainable Bio-resources for Global Welfare
86

SUSTAINABLE MINING OPERATIONS AT PT TIMAH (PERSERO) TBK INDONESIA:
A HARMONIZATION AMONG STAKEHOLDERS
Wachid Usman President Director of PT Timah (Persero) Tbk, Indonesia
ABSTRACT
Facts that mining operation can potentially damage the environment are often understood by the community disproportionately. Mining operation involves a sequential process that can be justified from the aspects of mining, operational safety, financial impact, as well as ecological and environmental. In Indonesia, mining operation should meet environmental guidelines regulated in AMDAL (Analysis on t he Environmental Impacts) in the beginning and concludes with environmental restoration or reclamation stipulated in Decree of Director General of Public Works No. 236/1996, Decree of the Minister of Forestry and Plantation No. 146/Kpts-II/1999 and mine closure with the Minister of Energy and Mineral Resources Regulation No. 18/20. Until the year of 2009, PT Timah has done post-mining land reclamation area of 12.460 h ectares (consisting of 75% onshore and 25% ex-mining pond) and in 2010 will also conduct reclamation of another 2000 hectares. The main problem in reclamation is the re-mining by illegal activity that will disturb the environment as the excavation will take place at an already reclaimed land. Reclamation problems faced are: the extremely low level of acidity in post-mining water, minimum amount of top soil in mined area, re-mining, high land surface temperature and minimal rainfall in the dry season. Harmonization among the needs of mining profits by the state through mining royalties and dividends, environmental sustainability for the community and mining business operations should always be conducted to achieve the goals of each stakeholder.
Keywords: post-mining, regulation, operational, reclamation, stakeholders
3rd GEN Network and 4th Rispescia International Seminar Sustainable Bio-resources for Global Welfare
87

MICROEMULSION AS DELIVERY SYSTEM FOR ANTIOXIDANT AND OTHER FUNCTIONAL COMPONENT OF FOOD
Sri Raharjo
Department of Food and Agricultural Product Technology Faculty of Agricultural Technology,
Gadjah Mada University, Yogyakarta 66281, Indonesia Email : [email protected]
ABSTRACT
It is well known that most of the bioactive or functional components in foods are lipophilic. These lipophilic components may include bioactive lipids, flavors, antimicrobials, and antioxidants. Incorporation of these functional ingredients in the formulation of food and beverage products, particularly aqueous-based food and beverage products, can be difficult. One way that the industry has attempted to satisfy these conflicting requirements is to incorporate the water immiscible materials using microemulsions. A microemulsion is dispersion of two immiscible liquids in which the individual droplets of the dispersed phase have an average radius less than about one-quarter the wavelength of light.
Because of thermodynamic stability, microemulsions are easy to prepare and require no significant energy contribution during preparation. Microemulsions have low viscosity compared to other emulsions. The formation of microemulsion is reversible. They may become unstable at low or high temperature but when the temperature returns to the stability range, the microemulsion reforms. Surfactants must be carefully chosen so that an ultra low interfacial tension (< 10-3 mN/m) can be attained at the oil / w ater interface which is a prime requirement to produce microemulsions. Concentration of surfactant must be high enough to provide the number of surfactant molecules needed to stabilize the microdroplets to be produced by an ultra low interfacial tension.
The use of microemulsion as delivery systems can improve the efficacy of bioactive lipids such as carotenoids, omega-3 fatty acids, tocopherol, and flavonoid compounds, without undesirable side effect on organoleptic properties of the food or beverage. It can also contribute to long-term shelf stability under typical food and beverage shipping, storage and use conditions.
3rd GEN Network and 4th Rispescia International Seminar Sustainable Bio-resources for Global Welfare
88
INTENSIFIED TREE PLANTING ON THE LOGGED-OVER FORESTS IN KALIMANTAN TO PROVIDE MEANS FOR REDD+ IMPLEMENTATON:
LESONS-LEARNED AND ROADMAP OF SILIN PROGRAM
Muhammad Naiem 1), Eny Faridah 2), Widiyatno 2), Suryo Hardiwinoto 2), Soekotjo 2)
1) Fac of Forestry, Gadjah Mada University (UGM), 2) Forest Biometrics laboratory UGM, 3) Forest Management department, Riau University, 4) Forest Remote Sensing-GIS laboratory, UGM, 5) Physical
Geography department UGM, 6) Geomatics & Geodetic Engineering department UGM, 7) Forest Conservation laboratory UGM, 8) Soil Chemistry Laboratory, UGM, 9) Study Program of Geophysics,
UGM, 10) Lab of Forest Hydrology UGM, 11) Lab of Forest Soils, UGM Yogyakarta Indonesia
*) corresponding author :[email protected] and [email protected]
ABSTRACT
Massive carbon stored on forests and existing high of deforestation rate make Indonesia potential for any support to retaining carbon, in order to contribute to the global efforts in stabilizing atmospheric CO2 concentration. Initially, REDD architecture has been strongly associated with more conservation approach, and Indonesia has been contributing as a major part in developing this scenario. Unfortunately, as a developing countries, forests pl ay a key role for development, and thus merely conserving forests will be facing various political challenges at ground level. As a consequence of being as development agent, forest is within the condition in a highly dynamics, especially dynamics of carbon (turnover of harvesting-new planting-growth) is very high. To accommodate this, a new rule of play called REDD+ is introduced to allow any carbon gain from a new tree planting on the logged-over forests is being accounted.
To provide insight on how REDD+ is potentially adopted in logged-over forests areas, here we present our experiences in developing an intensified tree planting of dipterocarps in Kalimantan.
3rd GEN Network and 4th Rispescia International Seminar Sustainable Bio-resources for Global Welfare
89
BIO-CONSERVATION OF FLORA AND FAUNA AT FIRST FOREST FLOOR AS SECOND SEED DISPERSER IN PAHMUNGAN VILLAGE, KRUI, WEST
LAMPUNG 1
Bainah Sari Dewi 2, Sugeng P. Harianto 2,3
1 Paper Presented in GEN Seminar 3 rd and Rispecia 4th Nusa Dua Bali Beach Hotel, August 7- 8 th, 2010
2 Forestry Department, Lampung University, Soemantri Brojonegoro street No. 1 Bandar Lampung, Indonesia
3 Rector of Lampung University
ABSTRACT
Repong Damar area is one of Community Based Forest Management scheme in Pekon Pahmungan, Krui, West Lampung, that the important habitat for specific flora and fauna. Harianto and Winarno (2008) had been done vegetation dynamic research continuously for 4 years. Following by Dewi and Harianto (2009) who researched fauna biodiversity through interview the community and transect. These research would be as important information and data for the next research to investigate flora and fauna in first forest floor as niche of flora and fauna. Research had been done for 4 months in 2010 in permanent plot Repong Damar in Pekon Pahmungan, Krui West Lampung and will continue for species identification and analyze the role of flora and fauna in biodiversity cycles especially in the first strata of forest floor. Traps method was used for identification of fauna insect and dung beetles in first forest floor. Literature study and plot base on s eedling stage were used for species of vegetation in this area. The fauna analysis in the first forest floor found mammalia (6 species), aves (7 species), other (11 species), various insect and dung beetles were investigared. Analysis of flora found 3 species: Damar mata kucing ( Shorea javanica ), durian ( Durio zhibethinus ), and duku ( Lansium domesticum ) were a mutual species in our research area. And, dung beetles provide a species for representatives from second seed disperser in first forest floor, tunneller type as bio-resources for seed disperser’s role.
3rd GEN Network and 4th Rispescia International Seminar Sustainable Bio-resources for Global Welfare
90

“Forest Carbon Budgeting for REDD”
3rd GEN Network and 4th Rispescia International Seminar Sustainable Bio-resources for Global Welfare
91

FOREST CARBON BUDGETING FOR REDD TO COUNTER CLIMATE CHANGE
T. Sweda Ehime University
3-5-7 Tarumi, Matsuyama 790-8566 Japan Phone, Fax: +81-89-946-9878
E-mail: [email protected]
ABSTRACT
Although COP 13 in Copenhagen in 2009 failed to agree upon the introduction of the REDD (Reducing Emission from Deforestation and Degradation) scheme, it is very likely to be introduced in not so distant future as one of the important post-Kyoto measures of reducing carbon emission globally. Being the incentive to reduce carbon emission for developing countries, the REDD concept is totally different from the reduction obligation of the Kyoto Protocol, but the basic method of accounting forest carbon budget is very likely to be inherited from the Kyoto Protocol, i.e. the “Good Practice Guidance for Land Use, Land-Use Change and Forestry (IPCC 2003)”, in which accurate, transparent and complete forest carbon accounting is mandatory. To fulfill this requirement, measurements of forest carbon stock at the term head and term end at least as ground truth for expanding nationally or regionally by remote sensing or by modeling are inevitable. Similarly as in the Kyoto Protocol, several options should be available in terms of tier levels as well as of the means of data retrieval. In this session, on top of their forest and forestry status, technical, political and social preparedness for REDD of several selected countries are discussed f or smooth introduction of the forthcoming REDD scheme.
3rd GEN Network and 4th Rispescia International Seminar Sustainable Bio-resources for Global Welfare
92

ISSUES IN AND SOLUTIONS FOR FOREST
CARBON BUDGETING IN LAOS
VICHITH Bounpheng B. Phontongsavath Vientiane Lao PDR Phone: +856-21 352234; +856203223359
E-mail: [email protected]
ABSTRACT
Laos is a r elatively less developed country, which however has started implementing economic reforms in the 1980s. Laos is a multi-ethnic society consisting of more than 49 ethnic groups, they house holds are dependent on forests for collection of wood and NTFP for own consumption and sales with different
degrees and many of them practice shifting cultivation. The government of Lao PDR gives the important of about avoiding catastrophic climate change, we need to limit global warming resulting from increased concentrations of greenhouse gases in the atmosphere. This means limiting and reducing global net emissions. But how and why and where a carbon budget comes in.
Issues in solutions are such as:
• Lack of alternative livelihood or production systems to replace shifting cultivation in remote areas and access to market together with lack of social services such as education and health care
• Incomplete land use planning including forest zoning and village level land use planning and land titling and insufficient resources for management of each land or forest zone
• Unclear resource and land tenure • Weak coordination between sectors • Weak law enforcement and governance • Insufficient understanding or ignorance of existing laws and regulations by
business people and local people • Limited human and financial resources
3rd GEN Network and 4th Rispescia International Seminar Sustainable Bio-resources for Global Welfare
93
TOWARD GOOD PEATLAND GOVERNANCE: CHALLENGES IN ACCOUNTING OF CARBON IN TROPICAL PEATLAND
Oka Karyanto 1*), Ari Susanti 2), Nurul Qomar 3), Wahyu Wardhana 4), Junun Sartohadi 5), Soeta’at 6), Muhammad Taufik Trihermawan 7), Benito Purwanto 8), Suparwoto 9) , Djoko Soeprijadi 2) ,Hatma
Suryatmadja 10) and Cahyono Agus 11)
1) Fac of Forestry, Gadjah Mada University (UGM), 2) Forest Biometrics laboratory UGM, 3) Forest Management department, Riau University, 4) Forest Remote
Sensing-GIS laboratory, UGM, 5) Physical Geography department UGM, 6) Geomatics & Geodetic Engineering department UGM, 7) Forest Conservation
laboratory UGM, 8) Soil Chemistry Laboratory, UGM, 9) Study Program of Geophysics, UGM, 10) Lab of Forest Hydrology UGM, 11) Lab of Forest Soils, UGM
Yogyakarta ndonesia
*) corresponding author : [email protected] ; [email protected]
ABSTRACT
Due to rapid peatland utilization for economic activities, about half of peatforests in Indonesia ha s switched from previously very efficient carbon sequestering into a massive carbon emittor system and c ontribute to significant global emission hot-spot. This emission is l argely due to peatland drainage and human-related fire during land preparation. Any efforts that merely based on c onservation has been proven to be very challenging , s ince peatland is now considered as major arable land available to many districts in Sumatera, Kalimantan and Papua. Increasing land-based economic activities following decentralization and expanding plantations for supplying palm oil and pulp-paper has increased draining and cultivation of peatforests. In the current national issue where comitment on reducing the emission is being implemented and get various global supports, existing pe atland opening is becoming a major leakage of green house gas emission and need to be strictly monitored.
We will present r ecent study located in one amongst largest tropical peatland areas in S umatera ie. Kampar Peninsula (700,000 ha) (Riau province which totally composed of about 4-6,7 million Ha deep peatland). to share our findings and challenges in an efforts to und erstand process controlling carbon stock-flux components incl. impacts of land management, and how to upscale carbon stock and flux at landscape scale predicting p attern under disturbance (human intervention, climate change). This information will be next promoted to provide means for supporting good peatland governance, especially that all peatland management should satisfy environmental issues to reduce emission, whilst at the same time any established production system o peatland should also satisfy long-term sustainability and not adding the existing abandoned land.
3rd GEN Network and 4th Rispescia International Seminar Sustainable Bio-resources for Global Welfare
94

ISSUES AND CHALLENGES IN IMPLEMENTING REDD SCHEME IN PARAGUAY
H. Silva Imas National Universtity of Asuncion
Mcal. Estigarribia Km 11,5 – San Lorenzo, Paraguay Telephone:++ 595-21-585606/10
Fax: ++ 595-21-585612 E- mail: [email protected]
ABSTRACT
Forest cover in Paraguay had massive changes in the last decades. In the Eastern region, where almost 95% of the population live, forest cover was reduced to 8% of what existed in 1945. This situation has threatened several species of animals and plants and it has also caused a reduction in the stock of wood fuel which is the main energy used by the population. Simultaneously to this rapid decline of forest cover, Paraguay is suffering from intense degradation processes which are mainly driven by forest fires. By the year 2007, fire had burned 500,000 hectares under severe drought conditions with more than 100,000 people affected.
This scenario has that Paraguay would be one of the pilot countries of the Latin American and Caribbean region to implement the UN-REDD Programme. Currently, its National Joint Programme (NJP) is under development but there are aspects that should be strengthened. Data access procedures are needed considering that National IPCC reporting requirements suggests that all relevant data should be made available in a national forest carbon information system. A national forest carbon inventory needs to be established in order to get precise information. Therefore, human and technical resources are needed for field work, measurements and data interpretation and analysis.
Complementarity with other initiatives can facilitate the implementation of NJP such as monitoring strategy implemented by Forestry National Institute, establishment of permanent plots along Paraguay by National University of Asuncion and the possibility of installing CO2 monitoring devices and other equipment financed by Japan International Cooperation Agency (JICA).
3rd GEN Network and 4th Rispescia International Seminar Sustainable Bio-resources for Global Welfare
95

PROCESS FOR ESTABLISHING REDD BASELINES IN VIETNAM
Truong Tat Do Vietnam Directorate of Forestry
No_02, Ngoc Ha, Ba Dinh, Hanoi Tel: (84 4) 38438814; Fax: (84 4) 38438793
E-mail: [email protected]
ABSTRACT
Forests, especially tropical forests, play a major role in the sequestration of atmospheric carbon; they offer great potential for reducing greenhouse gas emissions. Recognizing the importance of tropical forests in the climate change mitigation efforts, proposals have been being advanced to compensate tropical forest countries for reducing emissions from degradation and deforestation (REDD) as part of a future international climate agreement. Although the international community failed to reach a binding REDD agreement at the end of 2009 (COP15 – Copenhagen), a number of key issues are extremely to be the parts of REDD will be implemented in future. A baseline is an essential precursor to a viable and robust international compensation scheme for REDD; it provides a benchmark against which emissions reduction can be calculated. An important obstacle to REDD project development is the lack of data for baseline definition. The government of Vietnam wants to promote REDD projects and had set up the necessary institutions for REDD. Some projects have been being conducted to calculate the carbon emissions of Vietnam for establishing its national REDD baselines, but they are in small scale due to lacks of technical standards and insufficient finance. Therefore, Vietnam needs not only finance but also technical assistances from international organizations and developed countries. This report focuses on some initial results, the difficulties and the requirements for establishing REDD baselines in Vietnam.
3rd GEN Network and 4th Rispescia International Seminar Sustainable Bio-resources for Global Welfare
96
ESTIMATION OF BELOWGROUND BIOMASS AND CARBON STOCK IN SECONDARY FORESTS AND RUBBER AGROFORESTS IN JAMBI, CENTRAL
SUMATRA
S. Hardiwinoto, D.T. Adriyanti, Handojo H.N., Cahyono ADK., Adriana, Widiyatno (Faculty of Forestry, UGM) and T. Kato (CFFMP, JICA)
ABSTRACT
In recent decades, deforestation of tropical forests has accelerated and valuable natural resources have been lost. Forests are important in controlling CO2 concentration in the atmosphere. They absorb CO2 during photosynthetic process and store it as organic material in plant biomass. Objective of this study is to estimate belowground biomass and carbon stock in secondary forests and rubber based community forests. In this study, two types of vegetation cover, secondary forests and rubber based community forests were selected. In each type, three semi permanent plots with size 20m x 20m were established. Inventories of all trees with diameter at breast height (dbh) of more than 2 cm in each plot were done; the trees were numbered, identified their names, and measured their dbh. To estimate the belowground biomass, 10 t rees in each vegetation type were selected and used as destructive samples. The ten trees were chosen based on s pecies and range of stem diameters (dbh). Allometric relations between dbh and the total dry weight (TDW) of belowground biomass were formulated and discussed based on t he obtained data. Estimated amounts of carbon stocks in the belowground biomass of the forest types will be discussed in this paper.
Keywords: belowground biomass, carbon stock, secondary forest, rubber agroforest
3rd GEN Network and 4th Rispescia International Seminar Sustainable Bio-resources for Global Welfare
97

COULD WE EXPAND FORESTS AREAS IN INDONESIA ?: LESSONS LEARNED FROM COMMUNITY FORESTS DYNAMICS IN ACROSS JAVA WITHIN THE LAST 20 YEARS AS REVEALED BY SATELLITE IMAGERIES
Wahyu Wardhana 1), Firman Fahada 2), 1) Fac of Forestry, Gadjah Mada University (UGM), 2) BPKH , Miistry of Forestry, Yogyakarta Indonesia
*) corresponding author :[email protected]
ABSTRACT
Forest cover occupies more than 70% of total terrestrial ecosystem in Indonesia. However, deforestation and forest degradation is widely occur in Indonesia and thus many efforts have been promoted to maintain existing forests areas or even to increase forest areas under activities to strengthen the national capacity to stabilize atmospheric CO2. Whilst many regions are strongly characterized by lossing of their forest areas and now is struggling to re-planting their deforested-degraded areas. There are many challenges in re-forestation in outer of Java. In contrast, in Java, forests area is steadily increasing in term of quality and quantity. This is despite much higher population pressure on forests in Java.
In this paper, we will share our study on quantification of dynamics of forest area under community concessionaires (owned small-holders). Time-series (1990-2008) of Landsat ETM +7 and Spot imageries were used and were ground-truthed in across 20 districts in order to derive time-series carbon-based or land-cover map of community forests in Java. This study found that increasing forest cover under high population areas in Indonesia is inevitable.
3rd GEN Network and 4th Rispescia International Seminar Sustainable Bio-resources for Global Welfare
98

STAND STRUCTURE AND SPECIES COMPOSITION IN RELATION TO CARBON BUDGETING MAU FOREST, KENYA
1,2Awino Chrispine Ochieng 1Ehime University, Faculty of Agriculture
2Kenya Forest Service, P.O. Box 30513-00100, Nairobi. Kenya. Phone: +81-9094561386
E-mail: [email protected]
ABSTRACT
Mau forest has undergone serious degradations over the past decades ranging from illegal logging to settlements. This study was to assess the aboveground biomass, species composition and horizontal structure of the forest to understand its ecological state. The study was conducted in 7 plots each measuring 30 x30m over 2,000 m a.s.l. A total of 254 individuals, belonging to 19 f amilies, 21 g enera and 25 s pecies were inventoried. The preliminary result shows that the most common family was the Apocynaceae representing 22.8%, while Alangiaceae, Podocarpaceae, and Flacourtiaceae, each with over 10%. The most common species Rauvolfia caffra accounted for 22.8%. Shannon diversity index for the families was 2.56 indicating the level of diversity. Diameter size for all species combined followed the reverse J-curve, typical of uneven aged mixed forests with the class of 10-14.9 cm recording the highest number of occurrence. The forest supports a basal area of 24.3 m-2ha-1 and aboveground carbon stock of 214 Mg C ha-1. The biomass of Rauvolfia caffra, a dominant species, accounted for over 10% and the total estimates compared to other tropical rainforests in Asia and Africa is similar.
3rd GEN Network and 4th Rispescia International Seminar Sustainable Bio-resources for Global Welfare
99

LAND-COVER CLASSIFICATION OF DEGRADED PEAT SWAMP FOREST USING AIRBORNE LASER PROFILING
Yoshiko Maeda, Hayato Tsuzuki and Tatsuo Sweda United Graduate School of Agricultural Sciences, Ehime University
3-5-7 Tarumi, Matsuyama, Japan. 81-89-946-9878
ABSTRACT
A preliminary land cover classification of degraded peat swamp of Central Kalimantan, Indonesia was conducted using Airborne Laser Profiling (ALP). Field observation prior to the present analysis revealed six cover types, i.e. logged forest, drained forest, grassland, farmland, burn and fallow/bush, of which the last two cover types were spared in the present analysis covering a sample area of 40 km2 and focusing especially on forest type classification. Of various quantitative measures of vegetation such as spatial distribution of foliage deducible from ALP, only vegetation height and cover density were used in this preliminary analysis.
The result of this bivariate analysis revealed that distinction among the four cover types, i.e. logged forest, drained forest, grassland and farmland is basically possible. Although the present bivariate classification still leaves considerable overlap respectively between the logged and drained forests as well as between the grassland and farmland, introduction of variance or skewness of canopy height, or laser reflection hierarchy (i.e. spatial distribution of foliage) as the third variate would easily resolve the overlap. With more variates closely representing vegetation structure and configuration reducible than from the satellite, ALP has greater potential of accurate and versatile land-cover classification then does the satellite image which is widely used today.
3rd GEN Network and 4th Rispescia International Seminar Sustainable Bio-resources for Global Welfare
100

ESTABLISHMENT OF NATONAL FOREST DATABASE FOR REDD IN VIETNAM
Msc. Pham Duc Cuong Forest Inventory and Planning Institute
Phone: +84.904357920 ; Fax: +84.4.3.8616081 E-mail: [email protected] or [email protected]
ABSTRACT
Forests play a signicant role in maintaining the ecological balance besides providing various benefits to society. Further, maintaining forest ecosystems can contribute to increased resilience to climate change. It is a well known fact that deforestation and forest degradation, through agricultural expansion, conversion to pastureland, infrastructure development, destructive logging, fires etc., account for nearly 20% of global greenhouse gas emissions, more than the entire global transportation sector and second only to the energy sector. It is now clear that in order to constrain the impacts of climate change within limits that society will reasonably be able to tolerate, the global average temperatures must be stabilized within two degrees Celsius. This will be practically impossible to achieve without reducing emissions from the forest sector, in addition to other mitigation actions.
The study is aimed at the finding of biotic pressure on the forests management, establishment of forest database for REDD. The methods consisted of both on s creen visual interpretation of satellite image data for the preparation of forest type and density maps and forest inventory data related to the study. The entire spatial and non-spatial database were integrated, analyzed and modeled under GIS software. The study revealed the assessment of total area, suitable with respect to its technical. Results show that the totally Vietnam has forest areas of 13.12 mil ha accounting for 38,7% of the total natural land of the country and Total timber volume for the whole country were about 751.5 mil m3; and 8.4 bi ll bamboo stems by 2008 forest inventory. Forest covers in Vietnam changes drastically from 1943 t o 1990, s lightly from 1990 t o 1995 and increase from 1995.
Establishment of forest database was to use the experiences, techniques and develop methodologies for extracting information useful for other forestry and ecological studies, techniques for extracting quantitative information, information for the use of the forest resources protection and conservation, forest ecosystem studies and studies pertaining to forest’s role in climate using satellite remote sensing also have been initiated in the country. Land use study in Vietnam get more and more attention with using remote sensing and GIS technique and with more emphasis on s ocio-economical factors and human dimension.
3rd GEN Network and 4th Rispescia International Seminar Sustainable Bio-resources for Global Welfare
101

PRESENT STATUS OF REDD-RELATED PROJECTS IN PNG
Bruno. Kuroh PNG Forest Research Institute
PO Box 314, LAE 411, Papua New Guinea Phone: (675) 472 4188, Fax: (675) 472 4357
Email: [email protected], [email protected]
ABSTRACT
Papua New Guinea (PNG) signed the Kyoto Protocol (KP) in 1997 and ratified in 2000. Under the United Nations Framework Convention on C limate Change (UNFCCC) all Parties are requested to report their GHG emissions in their respective National Communications.
The country reported its First National Communication to the UNFCCC in 2004 and is now working on the Second National Communication, which it hopes to present during the Conference of Parties (COP16) in Cancun, Mexico in December 2010.
PNG will be utilizing the Inter-governmental Panel on C limate Change (IPCC) Good Practice Guidelines (GPG) and Guidance methodologies to report starting from Tier 1 and work towards Tier 3 approach 3.
This presentation provides an overview on PNGFA (PNGFRI’s) role in the development of a methodological strategy for implementing REDD projects and undertaking pilot/demonstration activities within the readiness phase.
PNG is currently embarking on a development plan that incorporates a REDD+ strategy through inclusive multi-stakeholder consultations and building capacity in monitoring, reporting and verification (MRV). This cross sectoral approach will allow all relevant government agencies and stake holders to collaborate in implementing and facilitating the process of carbon stock assessment and budget accounting as well as initiating pilot REDD and CDM projects in the country.
3rd GEN Network and 4th Rispescia International Seminar Sustainable Bio-resources for Global Welfare
102

PROCESS FOR ESTABLISHING REDD BASELINE IN LAOS
Mr Khamdy Linthong Forest Inventory and Planning Division (FIPD)
Department of Forestry, Laos Phone: 856-20-5567-5133
Email: [email protected]
ABSTRACT
The approach to determine national baseline for measuring reduced emission from deforestation and degradation (REDD) has emerged as central to negotiation over a REDD mechanism in a post-Tokyo policy framework. The baseline approach is critical to the success of a REDD mechanism because it affects the quantity, credibility and equity of credits generated from efforts to reduce forest carbon emission.
REDD (Reducing Emissions from Deforestation in Developing countries) is now a commonly shared concept of conserving forests as a climate mitigation strategy by providing incentives for the conservation of carbon stored in existing forests. REDD is considered a cost-effective way to reduce emissions which could contribute to sustainable forest management in developing countries.
Base on t he COP 13 Decision on "reducing emissions from deforestation in developing countries: approaches to stimulate action" paved the way for further work on REDD by encouraging the Parties to build capacities for
i) data collection, ii) emissions estimations and monitoring and iii) to undertake demonstration activities to enhance forest carbon stocks.
The Process for establishing REDD baseline in Laos must be followed: Joint Forest Carbon Partnership Facility in 2015 A ssigned Responsibility Agency, and Forming REDD Task Force in 2015, Negotiate with Donors on REDD Programmes (incl. Bilateral and International Organisations), Conduct Joint-Feasibility Studies for Establishing the Pilot REDD Programmes and Capacity Building on REDD.
3rd GEN Network and 4th Rispescia International Seminar Sustainable Bio-resources for Global Welfare
103

“Functional Food”
3rd GEN Network and 4th Rispescia International Seminar Sustainable Bio-resources for Global Welfare
104

EVALUATION OF FOOD FUNCTIONS BY ANIMAL CEL CULTURE AND EXPERIMENTAL ANIMALS
Takuya Sugahara1,*, Kosuke Nishi1 and Sogo Nishimoto2 1Faculty of Agriculture, Ehime University, Matsuyama, Ehime 790-8566, Japan.
2Center for Marine Environmental Studies, Ehime University, Matsuyama, Ehime 790-8577, Japan. *Corresponding author: Tel/Fax: +81-(0)89-946-8963, [email protected]
ABSTRACT
Animal cell culture has become an essential tool for the study of most biochemical and physiological processes. Many kinds of functions of foods and foodstuffs can be evaluated by cell culture techniques by using various cell types. O n the basis of the evidence obtained by cell culture, we examine the functions of food in mice or rats.
We are revealing some kinds of physiological functions such as immunostimulation activity, allergy suppression activity, anti-metabolic syndrome activity, and anti-cancer activity by using various cell lines. In addition to cell lines, we use primary immune cells from murine immune tissues such as spleen, Peyer’s patches, and mesenteric lymph nodes (MNL) for in vitro assay. P rimary immune cells are very useful for evaluation of the effects of substances on varieties of immune cells. Following in vitro assay, the effect of the substance in vivo may be examined. W e normally use mice for revealing the food functions in the body. Mice are orally given substances for several weeks and examined various responses in the body.
An extensive screening of various foodstuffs revealed that a water-soluble fraction of kale (Brassica oleracea) has an immunoglobulin (Ig) production stimulating activity on human–human hybridoma HB4C5. T he stimulatory effect was also observed on lymphocytes from MNL and Peyer’s patches from mice administered with kale extracts for 14 da ys. K ale extracts were purified by anion-exchange chromatography and subjected to ESI-LS-MS/MS analysis to identify the active substance. T he result indicated that the active substance is ribulose-1,5-bisphosphate carboxylase/oxgenase (RubisCo).
3rd GEN Network and 4th Rispescia International Seminar Sustainable Bio-resources for Global Welfare
105

ALLERGY SUPPRESSION ACTIVITY OF GREEN CRAB EXTRACTS
Kota Kanda1, Sogo Nishimoto2, Hiroshi Oda3, Hisashi Yoshioka3 and Takuya Sugahara1,*
1 Faculty of Agriculture, Ehime University, Matsuyama, Ehime 790-8566, Japan. 2Center for Marine Environmental Studies, Ehime University, Matsuyama, Ehime 790-8577, Japan.
3Maruha Nichiro Holdings, Inc., Tsukuba, Ibaraki 300-4295, Japan. *Corresponding author: Tel/Fax: +81-(0)89-946-8963, [email protected]
ABSTRACT
Allergic diseases such as pollinosis, atopic dermatitis, and allergic asthma are global health problem and increasing in the number of patients. T hese allergic diseases are triggered by immunoglobulin (Ig) E produced by lymphocytes. Hence, we have screened IgE production-suppressing factors in food stuffs to develop anti-allergy functional foods. As a r esult of screening, we found that extracts from green crab (Carcinus maenas) suppress IgE production by human myeloma U266 cells in vitro. I n addition, we examined whether green crab extracts suppress allergic response in allergic model mice. Female 6-week-old BALB/c mice were induced allergy reaction by intraperitoneal injection of ovalbumin (OVA), and the mice were orally given green crab extracts or 10 mM NaPB as vehicle for 28 days. After the experimental period, Ig levels in mice sera and cytokine production of splenocytes were measured by enzyme-linked immunosorbent assay. F urthermore, Igs and cytokines mRNA expression levels in splenocytes were measured by quantitative real-time PCR technique. A s a result, oral administration of green crab extracts significantly decreased total IgE level in serum as compared with control mice. The production of interleukin (IL)-4 known as one of the Th2 cytokines inducing IgE production was significantly suppressed by uptake of green crab extracts. Moreover, ex vivo assay revealed that green crab extracts down-regulate IgE and IL-4 mRNA expression levels in splenocytes. These results indicate that green crab extracts might suppress allergy response not only by suppression of the IgE production by lymphocytes, but also by improvement of Th1/Th2 balance in vivo.
3rd GEN Network and 4th Rispescia International Seminar Sustainable Bio-resources for Global Welfare
106

IMMUNOGLOBULIN PRODUCTION STIMULATING FACTORS IN CITRUS PEEL
Ayako Muranaka1, Sogo Nishimoto2, Ayumu Kadota3 and Takuya Sugahara1,* 1 Faculty of Agriculture, Ehime University, Matsuyama, Ehime 790-8566, Japan.
2Center for Marine Environmental Studies, Ehime University, Matsuyama, Ehime 790-8577, Japan 3Ikata Service Co., Ltd, Ikata-cho, Ehime 790-0421, Japan.
*Corresponding author: Tel/Fax: +81-(0)89-946-8963, [email protected]
ABSTRACT
Auraptene (AUR) and b-cryptoxanthin (b-CRP) are well-known components in citrus peel, and possess several physiological functions such as anticancer effects. We focused on the immunoregulatory functions of AUR b-CRP.
We investigated the immunoglobulin (Ig) production stimulatory effects of AUR and b-CRP on hum an-human hybridoma HB4C5 cells, splenocytes, and mesenteric lymph node (MLN) lymphocytes from BALB/c mice. T he amounts of Igs and cytokines produced by immune cells in culture medium were measured by ELISA. The effects on gene expression levels in hybridomas and lymphocytes were examined by quantitative real-time RT-PCR technique. A UR was administrated to female 6-week-old BALB/c mice for 2 weeks to investigate the effects in vivo. After administration, the activities of splenocytes and MLN lymphocytes from mice were examined ex vivo.
b-CRP dose-dependently enhanced IgM production by HB4C5 cells. A UR also stimulated IgM production by HB4C5 cells about 2-fold. G ene expression level in HB4C5 cells was stimulated by both b-CRP and AUR. IgA and IgG production by splenocytes from BALB/c mice were obviously enhanced by b-CRP or AUR treatment in vitro. Real-time RT-PCR analysis revealed that AUR and b-CRP accelerated IgA mRNA expression level in lymphocytes to enhance IgA production. In addition, IgA, IgG, and IgM production by MLN lymphocytes were also increased.
AUR was orally administered to BALB/c mice for 2weeks, and immunostimulatory effect of AUR in vivo was examined. A UR significantly activated IgA, IgG, and IgM production of splenocytes and MLN lymphocytes, though it was not affected serum Ig levels at all.
3rd GEN Network and 4th Rispescia International Seminar Sustainable Bio-resources for Global Welfare
107

PREBIOTIC EFFECT OF ARROWROOT AND SWEET POTATO
Eni Harmayani Faculty of Agricultural Technology
Gadjah Mada University
ABSTRACT
Modern consumers are increasingly interested in their personal health, and expect the foods they eat to be beyond tasty and attractive also safe and healthy. Recently acute and chronic gut disorders continues to increase. As efficient therapies are few, attention has turned towards the use of so called functional foods to mediate against gut disorder. Prebiotic effects in the gut can be evaluated on the basis of the growth of health promoting bacteria such as lactobacilli and bifidobacteria as well as the decrease in intestinal pathogens. Sweet potato and arrowroot are the local tubers found in Indonesia and are containing of high dietary fiber. Our study on the functional properties of these local tubers indicated that sweet potato and arrowroots potentially used as prebiotics. Sweet potato fiber contained oligosaccharides (verbacose), while arrowroots contained raffinose and stachyose which had health benefit to the gastrointestinal tract. Sweet potato fiber extract increased the population of Lactobacillus acidophilus and found to be very useful in preventing diarrhea caused by bacterial pathogens in rats. Supplementation of arrowroots flour in the diet improved intestinal health of Sprague Dawley rats as indicated by increasing number of L. acidophillus and Bifidus cells and surpressed Clostridia and Eschericia coli. Further study is needed to evaluate the application of those local tuber as functional foods.
Key words: prebiotic, sweet potato, arrowroot, local tubers
3rd GEN Network and 4th Rispescia International Seminar Sustainable Bio-resources for Global Welfare
108
IMMUNOMODULATORY EFFECT OF INDIGENOUS PROBIOTIC : IN VITRO AND IN VIVO STUDIES
Lily Arsanti Lestari1, Eni Harmayani2, Takuya Sugahara3
1 School of Nutrition & Health, Faculty of Medicine, Gadjah Mada University, 2 Faculty of Agricultural Technology, Gadjah Mada University
3 Animal Cell Technology Laboratory (ACTL), Faculty of Agriculture, Ehime University, Japan
ABSTRACT
Probiotics can communicate and cooperate with the immune system to organize cooperative strategies. They stimulate the body’s immune cells, activating the cell-mediated responses, the humoral responses, and indirectly, the body’s barrier mechanism through immunoglobulin production. They stimulate T-cells, B-cells, macrophages, NK-cell, and production of cytokines.
The aim of the research was to to evaluate the immunostimulatory effect of heat-killed indigenous probiotics (Lactobacillus acidophilus Dad13, L. plantarum Mut7, L. acidophilus D2, and L. acidophilus N2) in HB4C5 cell-line and Balb/c mice. The HB4C5 cell line is the fusion product of human B lymphocytes from a lung cancer patient and human fusion partner NAT-30 cells. Lactobacillus acidophilus Dad13 was isolated from “dadih” (fermented buffalo milk of West Sumatera). L. plantarum Mut7 was isolated from “gatot” (fermented cassava of Yogyakarta). Lactobacillus acidophilus D2 and Lactobacillus acidophilus N2 were isolated from the fecal material of newborn babies in Sardjito Hospital, Yogyakarta. The probiotic was prepared by heat-killed the cell suspension at 80 oC for 10 min. The concentrations of probiotic cell were 109, 108, 107, and 106 cell/ml. The female Balb/c mice were obtained from ACTL, Ehime University, Japan.
The results showed that Dad13, Mut7, and D2 stimulated the IgM production in HB4C5 cell-line, whereas N2 did not. The IgM production was higher in the highest cell concentration (109 cells/ml). In vivo animal study showed that all strains did not stimulate the IgA, IgG, and IgM production in serum and splenocyte, might be due to the short oral administration (7 days). In further study, Mut7 could enhance the production of TNF-α and IFN-γ in mice splenocyte, and enhanced the production of IgA in serum of Balb/c mice administrated with Mut7 for 14 days.
As a conclusion, heat-killed probiotic bacteria L. plantarum Mut7 enhanced the immune responses in vivo after 14 days supplementation.
3rd GEN Network and 4th Rispescia International Seminar Sustainable Bio-resources for Global Welfare
109

THE EFFECT OF ARROWROOT (Maranta arundinacea) ON IMMUNOSTIMULATION RESPON in vitro, SCFA AND PHYSICO-CHEMICAL
PROPERTIES OF RATS COLON
Ika Dyah Kumalasari Faculty of Agricultural Technology
Gadjah Mada University
ABSTRACT
Arrowroot (Maranta arundinacea.L) is a local product in Indonesia potentially to be developed as functional food. The objectives of this research was to evaluate the immunostimulation effect of arrowroot extracts and effect of diet supplemented with arrowroot flour on physical and chemical properties in rats digesta. Arrowroot starch was added on s plenocyte and the amount of immunoglobuline was measured by enzyme-linked immunosorbent assay (ELISA). In vivo study was conducted using Sprague Dawley rats with AIN93 diet as a control and arrowroot diets. The results revealed that arrowroot starch has immunostimulation effect in vitro. Diet with the arrowroot flour decreased pH value of rat colon, enhanced short chain fatty acid (SCFA) concentrations and molar proportion of SCFA especially butyrate and increased water content of digesta. It can be concluded that supplementation of arrowroot powder in the diet improved physico-chemical properties of rat digesta toward colonic healthy.
Key words: arrowroots, immonostimulation, SCFA, colon
3rd GEN Network and 4th Rispescia International Seminar Sustainable Bio-resources for Global Welfare
110

“Molecular Genetics of Tropical Rain Forest”
3rd GEN Network and 4th Rispescia International Seminar Sustainable Bio-resources for Global Welfare
111

CHLOROPLAST DNA POLYMORPHSIM IN THE LOCAL POPULATIONS SERAYA (Shorea curtisii Dyer)
Ko Harada, Koich Kamiya, Satoshi Nanami, Kenszo Tanaka, Reiji Yoneda, Bibian Diway, Lucy Chong, Mohamad A. Alias, Nik M. Majid, Shawn Lum, Wong Khoon-Meng
Faculty of Agriculture, Ehime Univeristy, 3-5-7 Tarumi, Matsuyama 790-8566 Japan. Tel&Fax: +81-89-946-9870, e-mail: [email protected]
ABSTRACT
Seraya (Shorea curtisii Dyer) belongs to the Red Meranti group and broadly distributes in hill dipterocarp forests in Malay Peninsula and northeastern coastal part of Borneo (North of Rajang River). We determined 2,480bp o f cpDNA non-coding regions (trnH-psbA-trnK, trnL-trnF) for 6 populations in Malay Peninsula and 2 populations in Borneo, and found 13 nucleotide subtitutions, which determined 12 haplotypes. Phylogenetic analysis revealed two distinctive groups of haplotypes; one in Malay Peninsula with 9 haplotypes and the other in Borneo with 3 ha plotypes. In each haplotype group, one common haplotype type with high frequeciy was found. It is shown that all of the other haplotypes were derived from one of these two common haplotypes. No haplotypes, which were shared in two regions (Malay and Borneo) were found. High genetic differentiation between the regions (FST = 0.959, dA = 0.00159) and low genetic differentiation among the populations within the regions (FST = 0, dA = 0.00000) were found. Tajima’s D was -2.0023 (P < 0.05) in Malay Peninsula. This shows Seraya populations had experience bottle neck followed by rapid expansion in this area. The value was negative (D = -1.1624), but was not significant in Borneo. Sequence analysis with other Red Meranti species revealed that the sequences in at least two haplopypes of Seraya in Malay Peninsula was shared with other species. This suggests Seraya originated in Malay Peninsula.
3rd GEN Network and 4th Rispescia International Seminar Sustainable Bio-resources for Global Welfare
112

ANTIOXIDANT POTENTIAL OF INDONESIAN MEDICINAL PLANTS GROWING IN EAST KALIMANTAN
Irawan Wijaya Kusuma, Asshaima Paramita Devi, Enih Rosamah, Enos Tangke Arung
Faculty of Forestry, Mulawarman University, Jl. Ki Hajar Dewantara, Kampus Gunung Kelua, Samarinda, Indonesia 75116, Tel/Fax. +62-541-737081, E-mail: [email protected]
ABSTRACT
Important phytochemicals are extensively isolated and identified from a large number plant at different levels. An important aspect where the phytochemicals have been used is an antioxidative mechanism to control free radicals. Free radicals are reported to generate cataract, cancer and various degenerative diseases. Flora of East Kalimantan appears to be a rich and interesting source for supplementary ethnomedicinal and phytochemical studies. In this paper, the scavenging activity toward free radical propagation and toxicity against brine shrimp of some Indonesian medicinal plants growing in East Kalimantan were reported. Extractions of the 15 dried powdered plant samples were performed using ethanol at room temperature. A free radical scavenging activity against a common stable radical, DPPH (1,1-diphenyl-2-picryl hydrazil) was assayed to evaluate the antioxidant activity of the plants. Toxicity of the plant extracts against Artemia salina was evaluated using the brine shrimp lethality test. Result of free radical scavenging assay indicated that Murayya koenigii, Cinnamomum burmanni and Syzigium polyantha have potential as natural antioxidant with more than 80% DPPH scavenging activity and low toxicity against brine shrimp. The results also suggest that the level of antioxidant activity in the selected plants varies to a great extent. Of the plant extracts tested, toxicity against brine shrimp was displayed by Eugenia aquea and Phaleria macrocarpa which caused more than 50% mortality. Upon achievement of this work, and using more plant samples, an extra benefit of these medicinal plants may be found.
3rd GEN Network and 4th Rispescia International Seminar Sustainable Bio-resources for Global Welfare
113

SHOREA PROJECT: A COLLABORATIVE RESEARCH ON GENETIC VARIATION OF SHOREA
SPP IN INDONESIA
I.Z. Siregar, U.J. Siregar, A. Sukendro, S. Wilarso and T. Yunanto Department of Silviculture
Faculty of Forestry, Bogor Agricultural University (IPB) Kampus IPB Dramaga, Bogor 16001
E-mail: [email protected]
ABSTRACT Indonesia is the region of highest species diversity of Dipterocarpaceae, particularly Shorea which is the most popular genus. The diversity of Shorea is under assault from deforestation and habitat alteration. Attempts to maintain the existing genetic variation of this important genus need to be taken urgently. However, efficient selection and design for genetic conservation of Shorea require good understanding of the genetic diversity and its dynamics in time and space at all levels. Through two collaborative project initiatives (2003-2005) funded by German Research Foundation (DFG) and ASEAN-EU University Network Program (AUNP), Faculty of Forestry IPB took part and co-implemented several activities aiming at determining genetic variation of Shorea spp and building capacities on c onservation of tree genetic resources. T his paper presents the outputs and outcome of the activities and discusses the possible future impacts on effective science-policy interfacing with regards to sustainable utilization of forest tree genetic resources. Keywords: Shorea, genetic variation, sustainable forest management, conservation,
science-policy interfacing
3rd GEN Network and 4th Rispescia International Seminar Sustainable Bio-resources for Global Welfare
114

CHLOROPLAST DNA VARIATION OF Shorea leprosula, MIQ IN BORNEO DETECTED BY MICROSATELLITE MARKERS
Zulfahmi1, Iskandar Zulkarnean Siregar2, Ulfah Juniarti Siregar2.
1Department of Agrotechnology, Faculty of Agricultural and Animal Science, State Islamic University of Sultan Syarif Kasim Riau, UIN SUSKA Campus at Panam, PO Box 1004, Pekanbaru 28293, Riau,
Indonesia, Tel. +62-761-562051, Fax +62-761-562052. e-mail: [email protected] 2Department of Silviculture, Faculty of Forestry, Bogor Agricultural University (IPB), IPB Campus at
Darmaga, PO Box 168, Bogor 16680, West Java, Indonesia
ABSTRACT
Shorea leprosula, Miq is member of dipterocarpaceae family. It is ecologically and economically important in Indonesia. In present study, we used chloroplast microsatellite to observe the haplotype distribution and to assess the variation within and among populations of S. Leprosula from Borneo. Based on c hloroplast microsatellite analysis, two haplotypes were observed for S. leprosula, namely haplotype H1 and H2, respectively. The low chloroplast DNA haplotypes variation is closely related with chloroplast DNA characteristics such as slow mutation rates The value of genetic differentiation measured for S. leprosula was Gst = 0.071 (Ht = 0.072; Hs = 0.066). The Gst values in this study is lower than the mean Gst value estimated in angiosperms plant for maternally inherited. Key words: Shorea leprosula, Chloroplast DNA, Genetic Variation, Microsatellite markers
\
3rd GEN Network and 4th Rispescia International Seminar Sustainable Bio-resources for Global Welfare
115

“Plant Factory”
3rd GEN Network and 4th Rispescia International Seminar Sustainable Bio-resources for Global Welfare
116

EARLY DETECTION OF DROUGHT STRESS IN TOMATO PLANTS WITH CHLOROPHYLL FLUORESCENCE IMAGING SYSTEM IN GREENHOUSE
Kotaro Takayama, Soushi Iyoki, Hiroshige Nishina, Seiich Arima, Kenji Hatou, Yuko Ueka, Yuzuru Miyoshi (Matsuyama, Japan)
Department of Biomechanical Systems, Faculty of Agriculture, Ehime University, Tarumi 3-5-7, Matsuyama, 790-8566, Japan
Tel/Fax: +81-89-946-9821 E-mail: [email protected]
ABSTRACT
The speaking plant approach (SPA) is a highly sophisticated concept for environmental control in current greenhouses. This concept is defines the optimal plant cultivation conditions should be achieved by monitoring the physiological status of the plants. The first and most important step of SPA is to obtain plant physiological information and then to judge whether or not the plant is healthy. For this purpose, imaging techniques have been thoroughly investigated. Chlorophyll fluorescence imaging technique is useful to evaluate the photosynthetic functions of plant body. In our previous study, we developed a chlorophyll fluorescence imaging system for the measurement of chlorophyll fluorescence images of tomato plants in greenhouse. This system images chlorophyll fluorescence induction phenomenon, a dynamic change in chlorophyll fluorescence intensity induced by an excitation light under dark condition and analyzes the shape of the induction curve, i.e. the time course of the chlorophyll fluorescence intensity during this phenomenon. The shape of the induction curve is characterized with the initial maximum peak (P), the following transient dip (S) and secondary small peak (M). We defined a photosynthetic function index (PFI; the fluorescence intensity of P divided by the average fluorescence intensity from S to M) to evaluate the shape of the induction curve. In this study, we applied this system to detect drought stress in hydroponically-cultivated tomato plants in a greenhouse.
3rd GEN Network and 4th Rispescia International Seminar Sustainable Bio-resources for Global Welfare
117
UNFAVORABLE EFFECTS OF TROPICAL ENVIRONMENTS ON MELON (Cucumis melo) FRUIT QUALITY IN THE SIMPLE GREENHOUSE
Mohammad Affan Fajar Falah1), Nafis Khuriyati1), Budi S Daryono 2), Rosa Amalia S 3), Rifa N4) and Ika Restu R 3).
Faculty of Agricultural Technology, Gadjahmada University, Indonesia
Jl.Sosio Yustisia No 1 Bulaksumur Yogyakarta Indonesia, Tel/fax 62-274-523660 Faculty of Biology, Gadjahmada University, Indonesia
Student of Faculty of Agricultural Technology, Gadjahmada University, Indonesia Student of Faculty of Biology, Gadjahmada University, Indonesia
ABSTRACT
In the food production using hydroponics, fruit quality that produced is often better than that from conventional method (soil culture). This system was frequently used as model experimental system,however, tropical environmental conditions affect fruit quality in the hydroponics food production especially in the simple tropical greenhouse which is not environmentally controlled in.
Simple hydroponics food production using Melon (Cucumis melo) was cultivated in the simple greenhouse, without any controlling of environments, such as temperature, relative humidity and solar radiation. Fresh melons from hydroponics were evaluated through physical (fresh weight and diameter) and chemical (firmness, acidity, color evaluation, water content, sugar content, and sensory evaluation ) for quality parameter and compare with that produce from soil culture.
Melon plant can not growth well on t he hydroponics enclosed in simple tropical greenhouse, caused variability of air temperature, especially of high air temperature (37- 40oC) on t he greenhouse and also in nutrient solution of hydroponics that frequently occurred. Melon fruit that produced in this cultivation could not perfectly made the net, fully change of the color, smaller the physical parameter, and relatively lower of quality on the chemical parameter compare with that produce from conventional method in soil culture. Furthermore, we need this information to develop and anticipate unfavorable effects on the automatic hydroponics food production for melon in tropical greenhouse.
3rd GEN Network and 4th Rispescia International Seminar Sustainable Bio-resources for Global Welfare
118

A CONCEPT OF CUSTOMIZABLE AGRICULTURAL PRODUCT: KANSEI ENGINEERING APPROACH TO PLANT FACTORY
Mirwan Ushada
Gadjah Mada University, Faculty of Agricultural Technology Department of Agricultural Industrial Technology
Laboratory of Production Systems Jl. Flora No.1 Bulaksumur Yogyakarta Indonesia ZIP 55281
Telp/Fax: +62-274-551219 Email: [email protected]
ABSTRACT
Today’s products are often sold in saturated markets in competition with many similar products. Each product needs to offer features which make it distinguishable and affective. A customizable product is a product which is produced with some affective features to satisfy consumers. Up to date, there is no concept for applying customizable product to agricultural products. The main problem of agricultural product is its dynamic features due to hardly controllable biological activity. In this paper, a concept of customizable agricultural product using Kansei engineering approach to plant factory was proposed. Kansei engineering is a consumer-oriented technology for product development. Kansei is a Japanese word which means a consumer’s psychological image and feeling regarding a product. When a consumer wants to buy an agricultural product, he or she has an image of the product such as “Fresh and Delicious”. In addition, consuming agricultural product could stimulate the different feeling such as “Energetic, Vigorous and Lively”. Kansei engineering approach enables translating such kind of consumer images and feelings to the product features. Plant factory can be used as the problem solution to produce customizable agricultural products. Plant factory is defined as a production system in which plants are under continuous production control throughout the growth period until the harvest. Since environmental factors in a plant factory are observable and controllable, biological activity can be controlled to provide affective product features. A concept of customizable agricultural product was proposed to provide potential value added product in terms of consumer-driven agriculture.
3rd GEN Network and 4th Rispescia International Seminar Sustainable Bio-resources for Global Welfare
119

SIMULATION STUDY OF TROPICAL GREENHOUSE ENVIRONMENTS UNDER SEVERAL SCENARIOS
Yayu Romdhonah1, Herry Suhardiyanto2, Erizal2, Satyanto K. Saptomo2
1Master student of IPB Graduate School, Kampus IPB Dramaga Bogor 16680 Indonesia, email: [email protected]
21Faculty of Agricultural Engineering and Technology, Bogor Agricultural University (IPB) FATETA-IPB, Kampus IPB Dramaga, Bogor, Indonesia
ABSTRACT
A generic greenhouse model based on energy and mass balance principles was developed to predict the behavior of a standard peak greenhouse under several scenarios. The greenhouse was alternatively: (1) naturally ventilated, (2) naturally ventilated and fanned, (3) naturally ventilated, fanned and shaded. The energy and mass balance equations were solved by an iterative procedure with a computer program. Climate data and greenhouse characteristics were used as inputs for the simulation. Several simulations are presented and discussed with the aim of addressing the potential of greenhouse expansion to low land areas of Indonesia. The simulation produced realistic approximations of the dynamic behavior of greenhouse environments with different operational strategies.
3rd GEN Network and 4th Rispescia International Seminar Sustainable Bio-resources for Global Welfare
120

THE SUPERVISED MULTI-AGENT SYSTEMS FOR A LARGE SCALE GREENHOUSE-BASED CROP INDUSTRY
Kudang B. Seminar & Herry Suhardiyanto
Faculty of Agricultural Technology – Bogor Agricultural University (IPB) e-mail: [email protected]
ABSTRACT
The complexity of a large scale greehouse-based crop industry is characterized by the number and size of greenhouses, the varieties of crops and the corresponding treatments, the scheduling of crop production, the distributed locations of greenhouses and the corresponding climate conditions. This must be handled by a control system that employes multi-agent systems to cope with various tasks and objects. The agents are supervised to act collaboratively and concurrently to manage all greenhouses involved in a large scale crop industry. This paper describes the design of the supervised multi-agent systems for a large scale greenhouse-based crop industry. The simulated prototype is also described to show potential applicabilities of the system proposed. The supervisory controller is the heart of the supervised multi-agent systems since it s upervises, coordinates, directs and instructs all the agents to behave and function for collaborative work. The generality and modularity of the system architecture allows its application for various a large scale agroindustries that used closed-house systems (e.g. poultry house, broiler house, duck house, flower house). Keywords : green-house, supervisory controller, multi-agent systems, agroindustry
3rd GEN Network and 4th Rispescia International Seminar Sustainable Bio-resources for Global Welfare
121

ESTIMATION OF FIRMNESS, SOLUBLE SOLIDS CONTENT, AND ACIDITY OF DRAGON FRUIT (Hylocereus undatus) BASED ON FRUIT COLOR
Nafis Khuriyati1), Muh Bayu Fibrianto2), Darmawan Ari Nugroho1)
1) Faculty of Agricultural Technology, Gadjah Mada University, Indonesia Jl. Sosio Yustisia No 1, Bulaksumur Yogyakarta Indonesia
2) Student of Faculty of Agricultural Technology, Gadjah Mada University, Indonesia
ABSTRACT
The cultivation of dragon fruit (Hylocereus undatus), a group of new cactus fruit crops originating in tropical America, has spread to tropical and subtropical regions throughout the world. Currently, there is much interest in developing this crop for fresh fruit export beyond the ‘local’ Asian markets. Dragon fruit has potential for use as a source of functional ingredients to provide nutrients that may prevent nutrition-related diseases and improve physical and mental well-being of the consumers. This research introduces a simple and rapid-nondestructive method for quality assessment of dragon fruits.
Dragon fruits in various growing stages (14-43 DAA) were obtained from an orchard and measured for quality parameters. The fruit color was measured nondestructively using Chromameter; firmness, soluble solids content, and acidity were measured destructively. Each quality parameter was modeled as a function of fruit age by using regression method. Based on the fruit color measured nondestructively, the age of fruit was estimated using a developed regression model of fruit color. Thus, the other quality parameters were estimated using the significant model based on the estimated age of fruit.
The cubic regression modeled the fruit color, firmness and soluble solids content as a function of fruit age significantly, but did not modeled the acidity. Using the significant regression model of fruit color, the age of fruit from different sample set was estimated then used for estimated firmness and soluble solids content. Paired t-test shows that the estimated firmness and soluble solids content were not significantly different from the actual ones. Using this method, many quality parameters could be estimated at the same time based on the fruit color.
3rd GEN Network and 4th Rispescia International Seminar Sustainable Bio-resources for Global Welfare
122

MASS TRANSFER DURING DRYING OF PADDY USING DIRECT SUN DRYING
Hanim Z. Amanah, Sri Rahayoe Universitas Gadjah Mada, Yogyakarta, Indonesia
ABSTRACT
Page equation was used to evaluate mass transfer and the constant drying rate (k) of paddy by direct sun drying and modified sun drying with employing the green house effect. The k parameter was used to predict water content of paddy during drying process. In this research, 15 kg of paddy were spread in the tray of dryer with the thickness of 3 – 4 cm and then dried using both drying methods. The changes of temperature and water content were observed every 30 minutes.
Result showed that constant drying rate (k) with modified sun drying using green house effect was higher than direct sun drying, respectively and this parameter could be used to predict water content of paddy during drying process accurately.
Key words: Paddy, sun drying, drying rate, green house effect
3rd GEN Network and 4th Rispescia International Seminar Sustainable Bio-resources for Global Welfare
123

INTERMITTEN IRRIGATION WITH AUTOMATIC FUZZY TIMER CONTROL
Satyanto K.Saptomo1, Budi I. Setiawan1, Herry Suhardiyanto1, Marzan A.Iskandar2
1Faculty of Agricultural Engineering and Technology, Bogor Agicultural University (IPB) FATETA-IPB, Kampus IPB Darmaga, Bogor, email:[email protected]
2Indonesia Agency for The Assesment and applicaitonof Technology (BPPT)
Jalan MH.Thamrin 8, Jakarta 10340
ABSTRACT
A fuzzy timer control (FTC) technique was developed for application in intermitten irrigation control. FTC is the modification of the general fuzzy logic control (FLC) which have been widely known and been applied in various control systems. The difference with the original FLC is that FTC give timer output rather than the magnitude of the actuator, and good for application with on-off device when the simply on-off control system is not perefered. The FTC was applied in simulation using water balance analysis of weather, evapotranspiration and soil condition information. FTC showed good performance in the anticipation of water level fluctuation to maintain water level near the setpoint, but faced difficulty with heavy rainfall event in rainy season. The simulation was conducted using spreadsheet programmed with macro basic language. The simulation also gave the irrigation capacity of 1.3 lt/sec.ha for rainy season and1.6 lt/sec.ha for dry season, with each performance index of 11871.5 a nd 42 25.4, which values are the results of optimization during the simulation.
Keywords : Fuzzy Control, Irrigation, Automatic Control
3rd GEN Network and 4th Rispescia International Seminar Sustainable Bio-resources for Global Welfare
124

“Biodiversity and Natural History Museum”
3rd GEN Network and 4th Rispescia International Seminar Sustainable Bio-resources for Global Welfare
125

BIODIVERSITY AND INSECT COLLECTIONS IN FOUR INSTITUTES
Hiroyuki Yoshitomi Ehime University Museum
Bunkyo 3, Matsuyama 790-8577 Japan Telp. +81-89-946-9898
E-mail address : [email protected]
ABSTRACT
Georissus overbecki was described by Dr. F. van Emden from Yogyakarta in 1934. There is no additional record and information about this species. Is this species already extinct or still alive? I explored this species by two ways: indoor (literature and specimen) and outdoor (field investigation). I rediscovered this species in Yogyakarta in 2009, and I also report the difficulties in taxonomic studies.
3rd GEN Network and 4th Rispescia International Seminar Sustainable Bio-resources for Global Welfare
126

ALTITUDINAL GRADIENTS IN TROPICAL ICHNEUMONID SPECIES-RICHNESS IN NORTHERN SULAWESI, INDONESIA
Keizo TAKASUKA1 & Kyohei WATANABE2 1Entomological Laboratory, Faculty of Agriculture, Ehime University
Tarumi 3-5-7, Matsuyama, Ehime 790-8566, JAPAN TEL/FAX(Lab) +81-89-946-9927 E-mail [email protected]
2Laboratory of Entomology, Tokyo University of Agriculture
ABSTRACT
Increasing accumulation of data shows that tropical ichneumonid faunae are no more species-rich than extra-tropical ones, despite the fact that most of their host groups show increased tropical species-richness. Ichneumonidae is parasitoids whose larvae develop whilst feeding in/on the host and has two different lifestyles, koinobiont (allows further hosts' development) or idiobiont (inhibits further hosts' development). Host range of koinobiont is relatively narrow (specialist) and vice versa (generalist). The phenomenon of ichneumonid species-richness decreasing toward the equator is thought to result from that specialist can’t inhabit tropics because of low host density caused by tropical high biodiversity.
However, the composition of tropical upper montane ichneumonid faunae is thought to resemble more closely that of temperate rather than tropical regions. The host density hypothesis predicts that specialist might form a larger proportion of a montane fauna in the tropics, because the diversity of potential hosts is much lower at high altitude than tropical lowland.
I investigated tropical ichneumonid fauna by malaise traps with four level altitudinal gradients (100, 500, 900 a nd 1200m) for a month in northern Sulawesi, Indonesia. In consequence of identification into morphospecies, Simpsons' index of diversity relatively high (15 or more) and the ratio of specialist exceeds 80% at 900m and 1200m areas. Whereas at 100m area, although Simpsons' index is the highest (25.14), the ratio of specialist is extremely low (38.6%) and number of individual is the lowest. This results advocate previous hypothesis and additionally suggests that generalist are more variety in the tropical lowland.
3rd GEN Network and 4th Rispescia International Seminar Sustainable Bio-resources for Global Welfare
127

“Hydrological Issues under Global Warming”
3rd GEN Network and 4th Rispescia International Seminar Sustainable Bio-resources for Global Welfare
128

AVERAGE AREA RAINFALL CALCULATION IN KUROSE DAM CATCHMENT AREA
SANZ GRIFRIO LIMIN Ehime University
ABSTRACT
Precipitation data provide is important data for basic engineering planning, especially for civil engineering and agriculture engineering. An rain gauge records rainfall at geographically point. In most of hydrologic analysis, average depth of rainfall over the area under consideration is required to computed an hourly, daily, storm period, ten-day, monthly or annually basis. This average depth of rainfall over the area is called Areal Average Rainfall. T he areal average rainfall (AAR) is necessary for water balance reckonings, agriculture, planning of urban regions, flood modelling, projecting of water resources, climate workings and for the estimation of water run-off. One of the basic problems of hydrometeorology is to estimate AAR from point rainfall values, which are measured at a set of irregularly located meteorological stations in a region. Estimation reliability is dependent on the density, position, distribution and representation ability of meteorological stations, and the methods applied to the data. Some practical methods to calculate average rainfall in a w atershed area are : (1) the arithmetic mean; (2) the Thiessen polygon; (3) elevation regression method. Unfortunately, the most commonly used Thiessen (1911) polygon method for AAR calculations does not consider areal rainfall amounts recorded at individual stations in the partition of the whole catchment area into smaller polygonal subareas. Therefore, once the polygons are obtained on the basis of existing rain gauge network configuration they remain the same as long as meteorological station locations do not change or there are no additional stations. However, it is logically plausible to expect that the subareas should change in response to the spatial variation of rainfall. In other words, the partition should be based not only on the rain gauge network configuration but also on the recorded rainfall amounts at the stations. This method is called Percentage Weighting Polygon (PWP). PWP is a method that consider the periodically rainfall amount on each rainfall stations. From the results of average areal rainfall calculation, elevation regression method has given significantly different result from others three methods. T hese differences occur because elevation regression method was obtained from regression line between elevation of weather station and rainfall rate at that station. Some regression line cannot present 100 % of rainfall event that occur in station. In purpose for result validation, next step of this research is validate the average areal rainfall calculated by use runoff model.
3rd GEN Network and 4th Rispescia International Seminar Sustainable Bio-resources for Global Welfare
129

A STUDY ON THE MECHANISM OF CATASTROPIC EARTH DAM FAILURE USING HIDRO-GEOTECHNICAL APPROACH
Teuku Faisal Fathani Department of Civil and Environmental Engineering
Faculty of Engineering Gadjah Mada University Phone: +62-274-545675 Fax: +62-274-545676
E-mail: [email protected]
ABSTRACT
The catastrophic failure of Situ Gintung dam on 27th March 2009 has caused more than 100 casualties from a tsunami as caused by more than 10 m/s flow velocity resulted from the embankment failure in only less than 2 hours. This failure is a specific phenomenon that happened rarely in the case, but it should be realized that it may occur anytime and anywhere. The era of mitigation efforts as a part of disaster management cycle requires various parties to understand the dam failure phenomenon. These include the understanding on the mechanism of hydrology-hydraulics process in conjunction with the dam structural integrity, as well as its abrupt of the discharge during the failure process. Prior to the dam failure occurrence, a relatively high intensity of rainfall (more than 70 mm/hrs) occurred at the catchment area. Besides, the embankment structural condition is far than at fair condition. These were indicated by apparent physical conditions such as too narrow spillway, insufficient width of spillway crest, imperfect interface between spillway structure and soil embankment, utilization of downstream embankment for housing, etc. These of course contributed the Situ Gintung dam failure phenomenon which needs to be studied thoroughly. The geotechnical analysis indicates that interaction between the dynamic of water elevation and the cutting slope of earth fill dam plays a significant role in the occurrence of dam failure. The appurtenances of Situ Gintung and the cutting slope due to the houses construction were evaluated to understand the historical aim of the dam development. A two-dimensional stress-strain analysis has been performed to figure out the distribution of relative shear stress and plastic points on the dam embankment at the time of failure. The safety factor decreases from 1.426 at the un-interfered embankment to 1.266 due to the cutting slope and the increase of reservoir water level.
3rd GEN Network and 4th Rispescia International Seminar Sustainable Bio-resources for Global Welfare
130
EVALUATIONS THE ACCURACY OF CMORPH OUTPUT FOR RAINFALL DATA INTERPOLATION IN INDONESIA
Diva Oktavariani, Rizaldi Boer
Center for Climate Risk and Opportunity Management
In Southeast Asia and Pacific (CCROM-SEAP)
Bogor Agriculture University, Indonesia Address: Kampus IPB Baranangsiang, Gedung Fisik dan Botani Lt.2
Jl. Pajajaran, Bogor – West Java, Indonesia T: +62 251 8313709, F: +62 251 8310779, E: [email protected]
ABSTRACT
The demand to reliable rainfall data is rapidly rising, but on the other side lacking of full-skill observer remains a problem. Global rainfall data derived from satellite estimation is growing as an alternative. This study aims to assess the accuracy of NOAA CPC Morphing Technique (CMORPH) output for rainfall estimation in particular areas. Area of study are Meulaboh, Gorontalo, Amahai, Tarakan, Juanda, Menado, Pontianak, Tabing and Palangkaraya which accordingly represent three existing rainfall patterns in Indonesia i.e. Equatorial, Monsoonal and Local. Main activities involved in the study are: (i) Derived the rainfall estimation from CMORPH output by downscaling the area to 3 different domains i.e. 1x1 grid (grid specifically covers the weather station location), 3x3 grid and 5x5 grid; (ii) Physical Component Analysis (PCA) to determine the best-fit domain. This analysis revealed that 3x3 grid domain provided the best result; (iii) developed a simple regression model to describe the correlation between CMORPH estimation data with ground observation data; (iv) Developed a correlation model between the selected PCA component with observation/ground data; (v) Validated the model with the latest observation/ground data. The study indicated that 3x3 grid domain provided rainfall estimation that perfectly reflects its observation/ground data, both for wet season and dry season.
Keywords: CMORPH, Downscaling, Rainfall
3rd GEN Network and 4th Rispescia International Seminar Sustainable Bio-resources for Global Welfare
131
RELATIONSHIP OF MICROCLIMATE, SOIL ORGANIC CARBON AND CO2 EMMISIONS FROM SOIL SURFACE AT DIFFERENT CANOPY COVER IN
PALU, CENTRAL SULAWESI, INDONESIA
Ade Irawan Bogor Agricultural University (IPB)
Kampus IPB Dramaga, Bogor, Indonesia
ABSTRACT
This study aims to determine the amount of CO2 emissions from soil surface in Bariri tropical forest, Lore Lindu National Park Palu, Central Sulawesi, Indonesia. We studied the relationship of microclimate, soil organic carbon and CO2 emmisions from soil surface at different canopy cover (low canopy cover, medium canopy cover, high canopy cover). CO2 emmisions from soil surface was measured in May 2008 using closed chamber method. We took gas sample before closing chamber (0 min) and after the chamber was closed, we took one gas sample for CO2 after 6 min. At the same time, we measured soil surface temperature, soil temperature at a dept 5 cm, air temperature, soil moisture at a dept 10 cm and take of soil sample at a dept 30 cm for analysis soil organic carbon. Based on the measurement result, mean of CO2 flux from soil surface is 299.15 mgCO2m-2h-1 or 7.14 t onC ha-1yr-1. The measurement result show the existence of difference on emission CO2 from soil surface at different canopy cover. The range of flux CO2 for low canopy cover, medium canopy cover, high canopy cover were 329.33-375.77 mgCO2m-2h-1, 213.30-403.08 mgCO2m-2h-1, 209.24 -304.18 mgCO2m-2h-1 respectively. CO2 emmisions from different canopy cover (low canopy cover, medium canopy cover, high canopy cover) positif correlated highly with soil temperature surface (R=0.75,P<0.09; R=0.74,P<0.1; R=0.70,P<0.13), s oil temperature (R=64,P=0.17; R=81,P=0.05; R=0.75,P=0.08), air temperature (R=0.71,P<0.05; R=0.26,P=0.08; R=47,P<0.05), negative correlated with soil moisture (R=-0.17,P=0.02; R=-0.43,P<0.05; R=-0.39,P=0.01), and soil organic carbon (R=0.02,P=0.64; R=-0.51,P<0.37; R=-0.15,P<0.53).
3rd GEN Network and 4th Rispescia International Seminar Sustainable Bio-resources for Global Welfare
132
ANALYSIS OF LANDUSE CHANGE TO SURFACE RUN OFF AND WATER DEMAND AT CIMANUK WATERSHED
Sisi Febriyanti Muin Center For Climate Risk And Opportunity Management In Southeast Asia And Pacific (Ccrom-Seap) -
Bogor Agricultural University Email: [email protected]
ABSTRACT
The downstream of Cimanuk watershed is an agricultural production area for rice and palawija. The agricultural area reached 165,500 hectares or about 49% of the total Cimanuk watershed area. The region’s agricultural productions were constrained by the increasing rate of land use change from agriculture to non-agriculture and by the unequal agricultural water distributions especially during dry season. Based on these problems, a r esearch about land use changes and water demand assessment in the region is important.
The aims of this research are as follow: (1) to build a land use change model for Cimanuk watershed, (2) to estimate surface run-off impacted by land use changes in different recurrence periods of rainfall, and (3) to estimate water demands in Cimanuk watershed.
Land-use change models were developed under six different equations using logistic regression technique, with determination coefficient ranges from 0.05-0.2, and with 53% precision. F-test shows that all of the six equations are significant. Additionaly, t-test result indicates that the population is the most significant variable that influence the land use conversion from dry land to settlement (227.86) and from dry land to dry land (-55.19). The highest portion of the increasing rate of land use change is occurred in settlement, i.e. about 18.71% from 1999 to 2006.
This study suggests that water demands for Cimanuk watersed will increase during 2006-2020 periods. In 2006 and 2010, the largest water demand comes from agricultural sector (sub-sector of agriculture fields), i.e. around 0.7x10⁹ m3. In 2020, the largest demand comes from the domestic sector (sub-sectors of urban population), i.e. about 1.8x10⁹ m3.
3rd GEN Network and 4th Rispescia International Seminar Sustainable Bio-resources for Global Welfare
133
AGRO-ECOLOGICAL FACTORS THAT INFLUENCE THE JATROPHA GROWTH
M. Nurcholis, S. Sumarsih, Rr. R. Brotodjojo and D. Haryanto Department of agrotechnology, Faculty of Agriculture, UPN “Veteran” Yogyakarta
Jl. Lingkar Utara Condongcatur Yogyakarta, 55283. Indonesia Personal communication: [email protected]
ABSTRACT
Jatropha curcas is included as perennial crops, and it had been understood by Indonesian people since more than seven decades as a plant producing renewable biofuel. A t the present decade, plants producing biofuel are expected to be developed to overcome the lowering nonrenewable fuel reserves. There are a myths that jatropha may grow well on the marginal lands and draught condition, good performance plant on the non fertile soils, no need agronomic management and it resistances to all plant pests and diseases. The present study was conducted to identify the environmental factors that influenced the growth of jatropha at marginal land on Potorono village, Yogyakarta Province. Jathropha was already planted by local people on the village road sides and on the marginal land field at the local governmental land of this village. They grew jatropha on these areas with the purpose was to prevent the competition to area for foodstuff crops. The results showed that the growth of jatropha was restricted by low content of organic matter, plant nutrition and the worst soil drainage. Applications of manure and macro nutrients (N, P and K) to this crop were able to increase the crop performance. There were shown that the amounts of shoot, flower and fruit bunch were increase by manure and nutrients treatments. Result of the field observation shown that there were identified several kinds of the plant pest, such as acarina, scutellarids, grasshopper, and mealy bugs. that attacked the plant leafs and fruits. There were plant leaf necrotic symptom also observed that was attacked by pathogenic fungi. Accordingly, jatropha is like the general plants that needs a good agro-ecological condition to grow well and producing large amount of jatropha fruit.
Keywords: jatropha, marginal land, plant nutrition, pests, diseases
3rd GEN Network and 4th Rispescia International Seminar Sustainable Bio-resources for Global Welfare
134

PHENOMENON OF THE INCREASING SEA LEVELS AS INDICATION OF GLOBAL WARMING
Nia Trikusuma Ningrum, Firdha Zahra Alfia, Nursyamsi Syam Contact Details : [email protected]
Undergraduate Students, Bogor Agricultural University, Indonesia Bogor, West Java, Indonesia
Telephone 08561464464
ABSTRACT
Global warming is cause by green house effect. Global warming also influence for the increasing of world temperature. The increasing of world temperature give impact for the environment problem such as the increasing of sea levels. On 2007, the temperature of St. George, Utah reached 48o C meanwhile the temperature of Surabaya was all around 30o-37o C (NASA).
The increasing of world temperature which is caused by global warming also give impact to the ice melting of north Pole and south pole. Since 1960 until 2005, the amount of gleitser in all around the world were lost until 8.000 m3 (NASA). The ice melting process in the pole increase sea levels. Nowadays, sea level has increased until 120 meter since the ice age in 18000 years ago. Since 3000 years ago until the beginning of the 19th century, sea level has a little increasing 0,1-0,2 mm per year. Sea level could be increase until 7 meters that could sink a whole beaches, ports, and land all around the world.
The environment damage especially in sand mining and abration caused the sinking of 26 i slands in Indonesia. The impact of climate change are increasing of temperature and the unpredictable season. The increasing of temperature cause ice and gleitser in north and south pole melted. This condition cause evaporation of sea water and inreasing of sea level.
Key words : increasing, sea-level, global warming
3rd GEN Network and 4th Rispescia International Seminar Sustainable Bio-resources for Global Welfare
135

“General Topics”
3rd GEN Network and 4th Rispescia International Seminar Sustainable Bio-resources for Global Welfare
136

LAND USE CONVERSION OF AGRICULTURE AND EFFECTS ON MEAT SELF SUFFICIENCY PROGRAM IMPLEMENTATION IN INDONESIA
Siti Andarwati)1 , Hu Bai)2
)1Department of Socio Economics, Faculty of Animal Science Universitas Gadjah Mada )2 Faculty of Agriculture, Ehime University
ABSTRACT
Humans and the land is like two sides that can never be separated from each other, meaning that in establishing their lives, people absolutely need the land. As population growth and development of human civilization, control and use of land began to shift. Land that originally served as media cultivation (agriculture), it gradually turned into a multifunctional utilization. Specific changes from agricultural to use for non-agricultural use for which became known by the term over land use (conversion) of land, increasing from time to time. Since 2005 until 2010 the government of Indonesia has launched the beef self-sufficiency program, with a target reduction of imports of cattle and beef from 28% to 10%, through the local livestock resources. Implementation of this new program effective in 2008 that success in 2010 was not achieved. To project self-supporting targets to be achieved through three main policy of delay slaughter policies, import steer policies and the policies of beef cattle ruminant feed supply; performed simulations with two scenarios as follows: 1) Scenario I; only do pol icy heifer slaughter delays by 5 pe rcent from number slaughters per year, 2) Scenario II; to delay slaughtering policies as well as the scenario I and made heifer imports from Australia in stages, 100 thousand tail in 2006, 200 thousand tails in 2007 and 300 thousand tails each in 2008, 2009 and 2010. Stage and the amount of imports adjusted heifer breeder readiness, capacity and availability of heifer feedloters in exporting countries. Above simulation with the assumption that "Ceteris paribus", m eaning ot her things being equal/no change. The fact on t he ground indicates that the convertion of agriculture land through the non farm, would mean a reduction in agricultural land area, it means reducing carrying capacity for livestock. Carrying capacity of land for beef cattle per hectare ranges between 1-1,9 livestock units, means to reduce the carrying capacity of 110,000 to 209,000 tails annually. This is related to the availability of feed ingredients for livestoct which also decreased agricultural land narrows. Thus the a dequacy of beef projections still need more serious efforts if it does not want to fail. Breakthroughs that can be taken is to promote the cultivation of a b eef cattle outside the island of Java still has a larger carrying capacity and can be introduced by palm oil plantations. Extensification measures to beef cattle farming outside Java is intended as an effort to answer the challenges of agricultural land convertion rates on the island of Java greater. Over the function of agricultural land into non-agricultural self-sufficiency programs threaten the meat, therefore the government needs to control the rate of transfer of agricultural land use with the rules in favor of the agricultural sector.
Keywords: Land use conversion, Agriculture, Meat self sufficiency
3rd GEN Network and 4th Rispescia International Seminar Sustainable Bio-resources for Global Welfare
137
CANOPY STRUCTURE AND FORAGE QUALITY OF THE DWARF AND NORMAL NAPIERGRASSES FOLLOWING TWO YEARS AFTER
ESTABLISHMENT
Muhammad Mukhtar
Faculty of Agriculture, Gorontalo State University
ABSTRACT
In order to determine canopy structure and forage quality under 3 pl anting densities at 4-, 8- and 16-plants/m2 and 2 cutting frequencies at 3 times and 2 times in 2006 and 2007, r espectively, 2 dw arf varieties (early-heading type, DE and late-heading type, DL) and 2 normal varieties (Wruk wona, Wr and Merkeron, Me) were compared in the following 2 years after establishment. Canopy structural characters were measured every month in 2006 and 3 times at the cutting in 2007. Crude protein concentration (CPC) was measured at each cutting both years and in vitro dry matter digestibility (IVDMD) of each plant organ was examined only in 2006. Although leaf area index (LAI) tended to increase with the increase in planting density both years, it was not responsive to planting density at the final cutting both years. Relationships between LAI and crop growth rate (CGR) were positively correlated and those between LAI and net assimilation rate per total solar radiation (NAR/S) were negatively correlated both years, while the difference in these relationships among varieties was not apparent in either year. Canopy extinction coefficient (K) was linearly and negatively correlated with LAI, and Wr tended to have higher K and DL lower K than other varieties throughout the seasons both years. Mean transparent angle (MTA), measured by plant canopy analyzer, tended to increase from July to November in 2006, while it was less variable among seasons in 2007 than in 2006. DL generally had a higher MTA than other 3 varieties, which was corresponded with lower K in DL than in other varieties. CPC of leaf blade (LB) was higher in Me than in Wr, while CPC of stem with leaf sheath (ST) tended to be highest in dwarf varieties, followed by Me and Wr both years, except for the third cutting in 2006 when the variations in CPC among varieties were small. IVDMDs of LB and ST were higher in dwarf varieties than in normal varieties, except for ST at the third cutting in 2006. The relationships between dry matter weight and IVDMD in ST and LB+ST were negative in normal varieties, while IVDMD was not affected by dry matter weight in dwarf varieties.
3rd GEN Network and 4th Rispescia International Seminar Sustainable Bio-resources for Global Welfare
138

THE CONTRIBUTION OF EHIME UNIVERSITY IN THE INDONESIAN’S BIODIVERSITY HOTSPOT: WALLACEA REGION
Atus Syahbudin (1, 2) and Osozawa Katsuya (3)
(1) Graduate School of Agriculture, Ehime University, 3-5-7 Tarumi, Matsuyama 790-8566, Ehime, Japan. Phone: +81-89-946-9910, Fax: +81-89-943-5242. Email address: [email protected].
(2) Faculty of Forestry, Universitas Gadjah Mada, Jl. Agro 1a, Bulaksumur UGM, Yogyakarta, Indonesia. Phone: +62-274-901402. Email address: [email protected].
(3) Faculty of Agriculture, Ehime University, Japan.
ABSTRACT
Wallacea as region of intermediacy has very high endemic species found nowhere else in the world. This region included in the coral triangle, consisted of four different groups of islands with complex geological history and populated by a mixture of Indo-Malayan and Australasian biogeography. Lack of concern both of Indonesian government and academician cause the high biodiversity of Wallacea decreased and endangered. Since May 2003 Ehime University (EU) Japan that started its research in South Sulawesi Province, constructed research ship “Cinta Laut” to serve research and education program in Wallacea region. In order to know the present contribution of EU to this region, mainly after the construction of “Cinta Laut”, a study was done between October 2009 and June 2010. Data were collected by observation and short interview, both in Ehime and South Sulawesi. In addition, many documents and photos were also studied. EU has significant role in the development of Wallacea region. It develops researches on the sago plantation and livelihood of sago-based communities as well as maritime research and education program and other things associated with it i.e. coastal community health and education, boat engine, timber species for boatbuilding, the ecology of small islands, logging activity and insular forest management. Remote islands, especially Spermonde Islands constitute the most important place observed. The early EU’s activities were mostly affected by the Center of Southeast Studies (CSEAS) at Kyoto University. Until now EU has not studied yet about mammals, birds, amphibians, reptile those have high percent endemism in Wallacea region.
3rd GEN Network and 4th Rispescia International Seminar Sustainable Bio-resources for Global Welfare
139

“Supply Chain in Practices”
3rd GEN Network and 4th Rispescia International Seminar Sustainable Bio-resources for Global Welfare
140

BARRIERS OF SUSTAINABILITY OF EMERGING MANGOSTEEN SUPPLY CHAIN
Retno Astuti12, Marimin3, Roedhy Poerwanto4, Machfud3, Yandra Arkeman3
1 Lecturer of Brawijaya University, Technology of Agriculture Faculty, Technology of Agricultural Industry Department, Jln. Veteran, Malang 65145, East Java, Indonesia,
2 Student of Bogor Agriculture University (IPB) Graduate School, Technology of Agricultural Industry
Department, Jl. Raya Darmaga, Gedung Andi Hakim Nasoetion Kampus IPB Darmaga Bogor 16680, West Java, Indonesia
3 Lecturer of Bogor Agriculture University (IPB) Graduate School, Technology of Agricultural Industry
Department, Jl. Raya Darmaga, Gedung Andi Hakim Nasoetion Kampus IPB Darmaga Bogor 16680, West Java, Indonesia
4 Lecturer of Bogor Agriculture University (IPB) Graduate School, Agronomy and Horticulture
Department, Jl. Raya Darmaga, Gedung Andi Hakim Nasoetion Kampus IPB Darmaga Bogor 16680, West Java, Indonesia
ABSTRACT
Identification of barriers is necessary to manage the sustainability of emerging mangosteen supply chain in Bogor district. The purpose of this paper is to identify barriers of sustainability of emerging mangosteen supply chain in Bogor district and understand their mutual relationships
Data and information were collected through in depth interview, participative discussions and a review of literature. The chain characteristics were mapped to describe the flow of product, funds and information. Interpretive Structural Modeling was used to illustrate the interrelationship of barriers of the chain sustainability.
The results of the analysis showed that distrust with partners, the incompatibility of character and ethics in working together, discrepancies in business development, inequality interests and goals, as well as resources that are not mutually supportive partners are barriers of sustainability of mangosteen supply chain in Bogor District which required maximum attention to be managed due to their high driving power to generate other barriers.
Keywords: barriers, emerging supply chain, mangosteen, Interpretive Structural Modeling
3rd GEN Network and 4th Rispescia International Seminar Sustainable Bio-resources for Global Welfare
141

INFLUENCE OF PARTNERS’ TRUST LEVEL, PARTNERING SUCCESS LEVEL WITH BENEFITS OF PARTNERSHIP ON CONSTRUCTION
PROJECTS IN THE PROVINCE MALUKU
Fransiska Natalia Ralahallo, S.E., M.Sc1 Fakultas Ekonomi Universtitas Pattimura
ABSTRACT
This study aims to test whether the partners' trust level have an influence on partnering success level and test whether the Partnering success level have an influence on the benefits of partnership.
This research was conducted in the Province of Maluku, the respondents are the parties involved in construction projects of the client / owner of the project (services in the Province of Maluku), construction companies and consulting firms. Sampling technique was purposive sampling, in which there are two criteria must be met is for project owners are agencies that have construction projects in the year 2008 until this study was conducted, to contractor companies and consulting firms is the company that handles the project from agencies construction project owners, and the second criterion is the contractor companies and consulting firms must have a minimum working experience of 5 years. This research is a survey research using a questionnaire, which use a questionnaire divided in two ways namely direct and distribute the mailing survey. The questionnaire used Likert scale 1-5. Questionnaires distributed numbered 200, which returned as much as 195 and a decent used to analyze as many as 193. Data analysis to test the hypothesis using an alternative method of SEM is PLS.
The results showed that partners' trust level have a p ositive influence for the partnering success level, the same result at the partnering success level have a p ositive influence for the benefits of partnership.
Key Words : Partners' trust level, partnering success level, benefits of partnership.
1 Ucapan terimakasih penulis berikan kepada yang telah berkontribusi pada penelitian ini, Adi Djoko Guritno (UGM, Jogyakarta), Perengki Susanto (UNP, Padang), Dinas Pendidikan Nasional, Dinas Pekerjaan Umum, Dinas Kesehatan, Dinas Perhubungan, Dinas Sosial, Dinas Koperasi dan Usaha Kecil Menengah, Dinas Pertambangan, Dinas Perikanan dan Kelautan dan Dinas Dinas Pariwisata Tingkat satu Propinsi Maluku, GAPINDO Propinsi Maluku. Penulis bersedia untuk memberikan data yang dibutuhkan terkait dengan penelitian ini.
3rd GEN Network and 4th Rispescia International Seminar Sustainable Bio-resources for Global Welfare
142

INFORMATION TECHNOLOGY, RELATIONSHIP COMMITMENT AND CONFLICT ON REVERSE LOGISTICS
Comparation Study of Franchised Retail and Independent Retail
Arstiani Yulianti Universitas Gadjah Mada
ABSTRACT
Environment damage issue, the changes of consumers’ behaviour and government regulation in spite of the association had given support to business owner to make changes in business process that he/she does (Business Process Reenginering/BPR). One of them is integration of reverse logistics approach in the process of forward supply chain in several manufacture, including retail. Product return is one of the forms of reverse logistics which is done by its retail.
This research was aimed at finding the return pattern product in retail and attempting the description about the relationship commitment aspect, conflict and the usage of information technology in returning process from retail to supplier. This research used multiple case study. There are four kinds franchised retails which are compared to three other independent retails as the objects.
The result reveals that reverse logistics pattern in franchised retail and independen retail are almost the same. The relationship commitment aspect and conflict between franchisee (retail) and franchisor (supplier) and the usage of information technology have no relationship with reverse logistics process for all products (durable and non durable) sold by both retails.
Key words: Forward supply chain, reverse logistics, franchised retail, independent retail, relationship commitment, conflict and information technology
3rd GEN Network and 4th Rispescia International Seminar Sustainable Bio-resources for Global Welfare
143
REALITY CHALLENGES SUPPLY CHAINS’ DYNAMIC IN SUPPORTING SALES STRATEGY
Titiek Sri Hendarti Head Of Combiphar Consumer Products
ABSTRACT
Almost 200 c ompanies play in over the counter (OTC) products where the Top 20 accounts for 72% of total 170 l ocal companies (ITMA MAT Q1-2010). Every year, managers in charge to run commercial units face great challenges in find ways to grow sales and deliver more profits, especially for those in low tier rank. F or Business Manager one of the biggest challenge in couping with growing sales volume is to determine the best-fit model in distribution to support the overall business strategy. Despite there is no magic-formula in choosing the model, the subject brought up for discussion will briefly share common factors considered by practioners in determining the options. In comparison to small companies, big companies enjoy many advantages in dealing with distributors such as lower distribution fee, exclusive services, c hoose big distributors with strong penetration to all type of shops. In a company where growth strategy lies on O TC products, beside traditional pharma stores i.e. pharmacies, drug stores and modern trade; an OTC product like cough medicine should have a strong presence in general trades (GT) considering 45%-50% of consumers purchase the product from GT also called warung (Nielsen RA report, May 2010). However, for cost reason most distributors normally appoint sub-distributors to reach GT instead of visit those small retailers directly. In the other hand, a company with high content of consumer-healthcare products need wide availability in modern trade (supermarkets). This is because, supermarkets provide space and opportunities for the brands to build emotion-bond with target consumers, which is very important for personal-care products. Hence, a company with personal-care majority will go to distributors with Modern Trade resources and capabilities. In principal side, the job has not completely done untill real consumption happens. In the world of consumer-healthcare products, fierce competition also happens in ‘availability and visibility’ games. To win the competition, business managers have to win the in-store battle as well as win the heart of consumers’ through various brand activations.
Key words: grow, sales, distribution, shops
3rd GEN Network and 4th Rispescia International Seminar Sustainable Bio-resources for Global Welfare
144

THE MECHANISM OF VEGETABLES TRADING BETWEEN PRODUCER AND SUPERMARKET THAT CAPABLE TO COORDINATE THE SUPPLY CHAIN
Henry Yuliando, Widodo
Department of Agroindustrial Technology,
Agricultural Technology Faculty, Universitas Gadjah Mada, Indonesia e-mail : [email protected]
ABSTRACT
The problem faced by a large supplier of agricultural products or vegetables in this case, is relied in setting the terms of trade with multiple retailers. The producer supplies to independent retailers ( the supermarkets) who in turn sell the vegetables to consumers. Any vegetables traded in this supply chain must have been produced in a previous growing season, so the supplier may sell out of existing inventory. It is too late to produce additional vegetables once information on demand starts to come in.
Each independent supermarket faces an uncertain demand for each variety of vegetables. To determine how much seed to order from the supplier, the dealer maximizes his expected profits. The problem faced by the supplier is how to set the terms of trade so that each supermarket’s ordering decision, driven by individual profit maximization, leads to a result that is good for the supply channel, i.e., the supply chain, as a whole.
In this paper, we examine mechanisms actually employed to set the terms of trade with the independent supermarkets. A key question we ask is whether and under what conditions these mechanisms are capable of coordinating the supply chain in the sense of maximizing total channel profits. Incentive systems are employed to propose a b etter coordination of an independent retailer decisions with supply channel objectives.
Keywords : producer, supermarket, supply chain, channel coordination
3rd GEN Network and 4th Rispescia International Seminar Sustainable Bio-resources for Global Welfare
145

“Zeolite Chemistry and Its Industrial Application”
3rd GEN Network and 4th Rispescia International Seminar Sustainable Bio-resources for Global Welfare
146

IMPROVEMENT OF PLANT PRODUCTION AND SOIL QUALITY BY RECYCLING BIOLOGICAL WASTES IN LOCAL AREA FOR SUSTAINABLE
AGRICULTURE
Hideto UENO Faculty of Agriculture, Ehime University, Japan
ABSTRACT
Resource management in local area has become one of the most important issues in agriculture. Especially in Japan, the government has encouraged to recycle organic wastes discharged from agriculture, industries and household garbage, because almost of potassium and phosphate rocks for fertilizers has been imported from abroad. Here three topics on agricultural recycle approach are summarized and discussed.
There is one of the globally largest cotton industrial factories in Ozu, Ehime and it has discharged a large amount of cotton waste. For recycling use of the waste, cotton mulch sheet for agriculture was developed. Addition to weed suppression, it can save cost and labor for removing the mulch sheet after harvest because the sheet is biodegradable and easily incorporated into soil, leading to improve soil fertility. Furthermore it can decrease the soil temperature under the sheet and it ma ke possible to cultivate a high quality lettuce even in hot summer. In paddy rice cultivation, a high performance on environmental conservation of the sheet was appeared that it can absorb the excess amount of nutrients but not contaminate nutrients to streams, rivers and other water systems. The absorbed nutrients would be supplied around flowering stage and taken up by rice efficiently.
Immediate developments of the appropriate application methods and systems for composts with various qualities and origins are required in sustainable agriculture. The other research topics are on nutrients efficiencies of the composts from household kitchen garbage and sewage sludge, which are produced from everywhere people lives.
3rd GEN Network and 4th Rispescia International Seminar Sustainable Bio-resources for Global Welfare
147
UTILIZATION OF NATURAL ZEOLITE AS BIOFERTILIZER CARRIER AND ITS EFFECT ON RICE GROWTH
Eko Hanudin1), Ahmad Suseno2) dan Endang Kusdiyantini3) 1). Laboratory of Soil Chemistry and Fertility, Dept. of Soil Sciences, Fac. of Agriculture, University of
Gadjah Mada, Yogyakarta, Indonesia 2). Department of Chemistry, 3). Department of Biology Faculty of Mathematic and Natural Sciences,
University of Diponegoro, Semarang, Indonesia Contact person: [email protected], phone/fax: +62274548814
ABSTRACT
Natural zeolite (NZ) as a tectoaluminosilicate posses a surface negative charge and micropores. The mineral is likely to be modified as a carrier for a nitrogen fixing bacteria such as Azotobacter Chroococcum. Surface modification was conducted by applying an organic surfactant (HDTMA+). The main objective of this research was to find out the change of the surface adsorption and IR-spectral characteristics of the modified NZ, and the effect of natural zeolite-azotobacter complex (NZA) on N availability, N absorption and the growth of rice. Pot experiment was arranged in a completely randomized design (CRD) composed of 6 levels (0, 1, 2, 3, 4 and 5 g/pot). Basal nutrients also were added to avoid a defficiency of other nutrients. By adding a bichromate solution indicated that the adsorption capability of the modified NZ increased from the original one (3045.5 to 11701.4 mg/L). T he surface change was also strengtened by the peak appearances of 2850,68 cm-1 dan 2919,63 cm-1 from FTIR spectra, while the peaks were not identified in the original one. The change of zeolite surface morphology was also known by SEM data. By applying a Total Plate Count (TPC) method, the amount of Azotobacter Chroococcum adsorbed by one gram of the modified zeolite could be known around 3.7x10⁹ cfu/mL. Application of the biofertilizer (NZ-azotobacter) was able to increase N-available in soil and N absorption in the shoot of rice IR-64.
Keywords: modified zeolite, surfactant, biofertilizer and rice
3rd GEN Network and 4th Rispescia International Seminar Sustainable Bio-resources for Global Welfare
148

DYNAMIC SIMULATION OF THE EFFECT OF GLOBAL CLIMATE CHANGE ON THE NATIONAL FOOD STOCK
Agus Supriatna Somantri, Wisnu Broto and Ridwan Rachmat
Indonesian Center for Agricultural Postharvest Research and Development IAARD – Ministry of Agriculrure of The Republic Of Indonesia
ABSTRACT
In line with the growth of the population from year to year, the demand of food is also increase. This meant the high intensity of crop production with high harvest yield is stressed to achieve the food crop production. the occurence of global climate change with unpredictable friendly-weather situation effect on the target of cropping system which lead to disturb the stabilization of national food security. T he various actions and strategies to arrange the indegenous effort that immediately can resist the rate of global climate change is very scary. Meanwhile to develop the public awareness in conserving, preserving the environment is always keep in well-managed. This research aims to study global climate change and its effects on food security especially in national food self sufficiency. The output of this study is various strategies to maintain food stock and match with the needs. The method used is a dynamic system where the national rice supply system determined by two major sub-systems is the provision of sub-systems and sub systems demand. Each sub-system identified a specific component or factor and interacts dynamically based on the time and conditions. The results showed that mitigation strategies such as reducing exhaust emissions (carbon dioxide, methane, etc.) that cause the greenhouse effect is an action that must be done by all levels of society in order to reduce climate change impacts. This strategy is a k ey strategy that is able to reduce the rate of global climate change for disrupting food production. As this strategy does not impact directly on production growth, but this is applied to surveilance the occurence o f severe disaster on agricultural land. The implementation of the mitigation strategies must be coupled with anticipation strategy to maintain a sustainable food security. The strategy could save Indonesia from food shortages until the year 2030. Implementation of this policy is an expansion of rice cultivation at 5% per year, stop land use and application of good agricultural systems.
Keywords: dynamic simulation, food stock, global climate change, mitigation strategy
3rd GEN Network and 4th Rispescia International Seminar Sustainable Bio-resources for Global Welfare
149