sustainability_and_strategic_analysis_wu_42110.pdf (2.28 MB)
35
DOE Bioenergy Technologies Office (BETO) 2015 Project Peer Review Impact of Projected Biofuel Production on Water Use and Water Quality March 27-29, 2015 Analysis and Sustainability WBS:4.2.1.10 May Wu Argonne National Laboratory This presentation does not contain any proprietary, confidential, or otherwise restricted information
Transcript of sustainability_and_strategic_analysis_wu_42110.pdf (2.28 MB)
DOE Bioenergy Technologies Office (BETO) 2015 Project Peer Review
Impact of Projected Biofuel Production on Water Use and Water Quality
March 27-29, 2015Analysis and Sustainability
WBS:4.2.1.10
May Wu Argonne National Laboratory
This presentation does not contain any proprietary, confidential, or otherwise restricted information
Goal Statement• Develop analyses on the water use associated with U.S.
bioenergy and bio-products production• Provide tools to quantify impacts on water quality and
resources at multiple scales • Support programmatic decisions by establishing
quantitative metrics for enabling sustainable industry growth that reduces U.S. reliance on petroleum oil
2
Presenter
Presentation Notes
Determine how much water is used in the production life cycle of biofuels Determine the impact of the water use on water quality at regional scale especially at the river basin scale Determine the impact of the water use on regional water resource
Quad Chart Overview
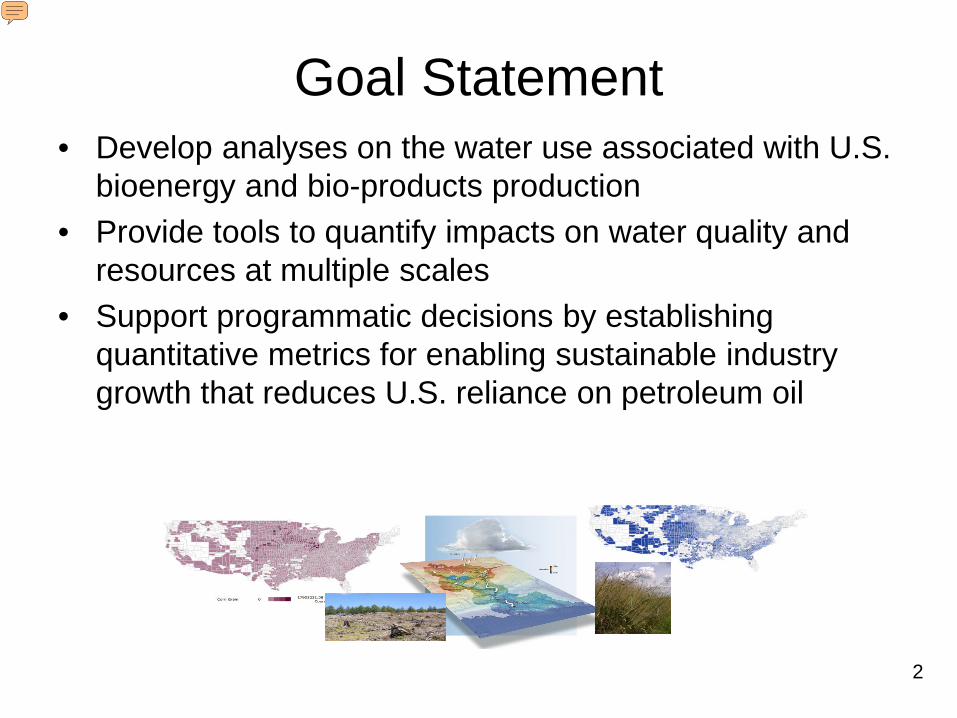
• Project start date: FY09• Project end date: Project
continuation and direction determined by DOE annually
• Percent complete: On going
• St.-B. Consistent and science-based message on bioenergy sustainability
• St.-D. Implementing indicators and methodology for evaluating and improving sustainability
• St.-E. Best practices and systems for sustainable bioenergy production
Timeline
Budget
Barriers
• Collaborations/interactions:─ INL (J. Jacobson; I. Bonner), ORNL
(N. Griffith; Y. Jager; M. Langholtz), PNNL (L. Snowden-Swan), NREL (R. Davis).
─ U.S. Army Corp. Engineers, Purdue University (I. Chaubey)
─ USDA NRCS
PartnersTotal Costs FY 10 - 12
FY 13 Costs
FY 14 Costs
FY15 Planned Funding
DOE Funded
$1295K $550K $710K $625K
Project Cost Share
N/A N/A N/A N/A
3
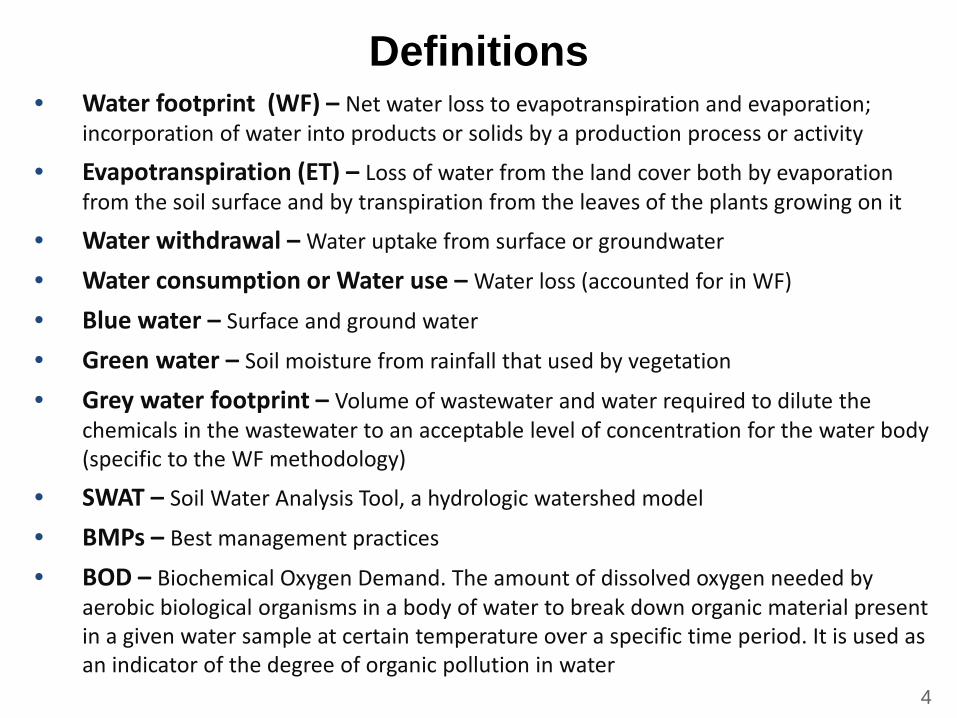
Definitions• Water footprint (WF) – Net water loss to evapotranspiration and evaporation;
incorporation of water into products or solids by a production process or activity
• Evapotranspiration (ET) – Loss of water from the land cover both by evaporation from the soil surface and by transpiration from the leaves of the plants growing on it
• Water withdrawal – Water uptake from surface or groundwater
• Water consumption or Water use – Water loss (accounted for in WF)
• Blue water – Surface and ground water
• Green water – Soil moisture from rainfall that used by vegetation
• Grey water footprint – Volume of wastewater and water required to dilute the chemicals in the wastewater to an acceptable level of concentration for the water body (specific to the WF methodology)
• SWAT – Soil Water Analysis Tool, a hydrologic watershed model
• BMPs – Best management practices
• BOD – Biochemical Oxygen Demand. The amount of dissolved oxygen needed by aerobic biological organisms in a body of water to break down organic material present in a given water sample at certain temperature over a specific time period. It is used as an indicator of the degree of organic pollution in water
4
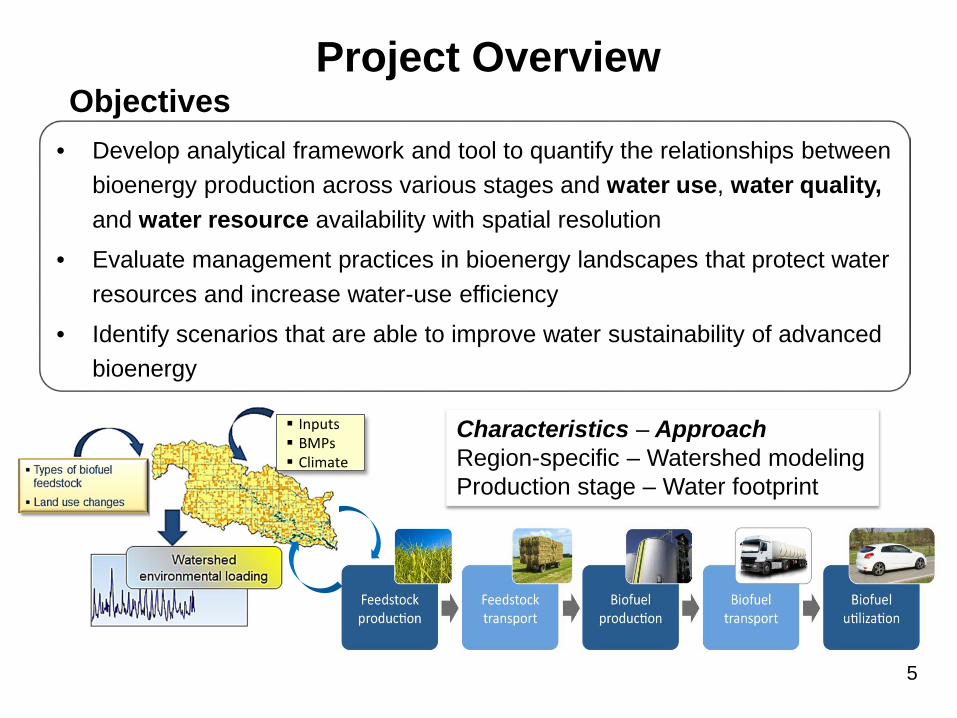
Project OverviewObjectives
• Develop analytical framework and tool to quantify the relationships between bioenergy production across various stages and water use, water quality, and water resource availability with spatial resolution
• Evaluate management practices in bioenergy landscapes that protect water resources and increase water-use efficiency
• Identify scenarios that are able to improve water sustainability of advanced bioenergy
Inputs BMPs Climate
Characteristics – ApproachRegion-specific – Watershed modelingProduction stage – Water footprint
5
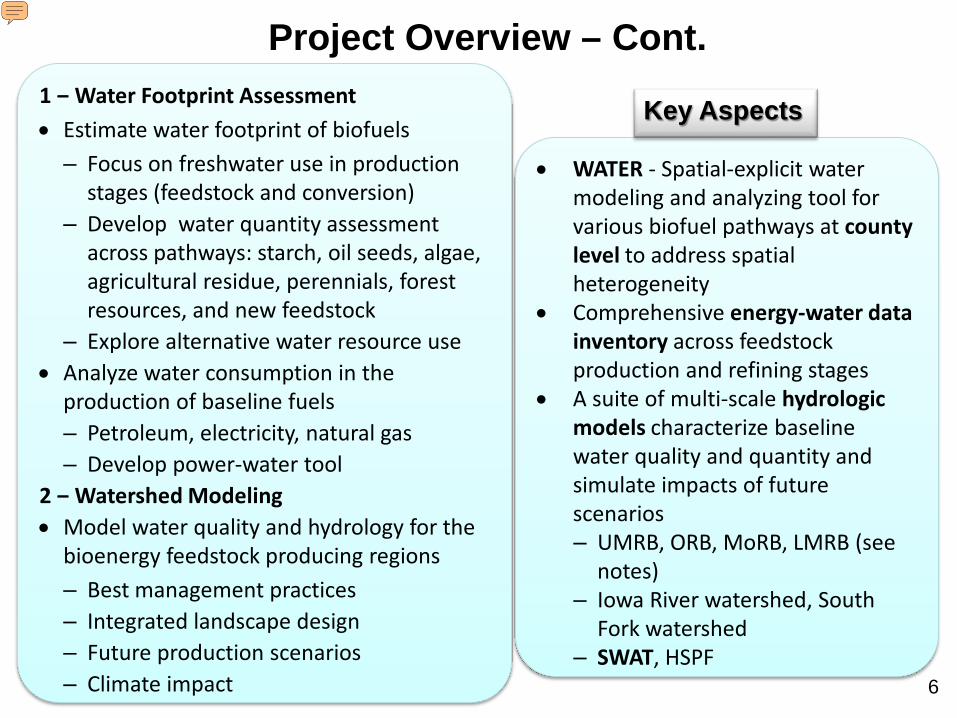
Project Overview – Cont.
• WATER - Spatial-explicit water modeling and analyzing tool for various biofuel pathways at county level to address spatial heterogeneity
• Comprehensive energy-water data inventory across feedstock production and refining stages
• A suite of multi-scale hydrologic models characterize baseline water quality and quantity and simulate impacts of future scenarios‒ UMRB, ORB, MoRB, LMRB (see
notes)‒ Iowa River watershed, South
Fork watershed‒ SWAT, HSPF
Key Aspects1 ‒ Water Footprint Assessment• Estimate water footprint of biofuels‒ Focus on freshwater use in production
stages (feedstock and conversion)‒ Develop water quantity assessment
across pathways: starch, oil seeds, algae, agricultural residue, perennials, forest resources, and new feedstock
‒ Explore alternative water resource use• Analyze water consumption in the
production of baseline fuels – Petroleum, electricity, natural gas – Develop power-water tool
2 ‒ Watershed Modeling• Model water quality and hydrology for the
bioenergy feedstock producing regions‒ Best management practices‒ Integrated landscape design‒ Future production scenarios ‒ Climate impact 6
Presenter
Presentation Notes
SWAT – a hydrologic model (watershed model) Soil Water Analysis Tool developed by USDA ARS, maintained by Texas A&M University. http://swat.tamu.edu/ HSPF – a hydrologic model (watershed model) Hydrological Simulation Program—Fortran developed by USEPA, maintained by USGS. http://water.usgs.gov/software/HSPF/ MRB – Mississippi River Basin. Main contributor of nutrient problems in the Gulf of Mexico UMRB – Upper Mississippi River Basin, responsible for a significant portion of N and P to the Gulf ORB – Ohio River Basin, contributes 49% of the flow and a significant portion of N and P to the Gulf MoRB – Missouri River Basin. Upper Missouri River Basin (UMoRB) SWAT model has been developed, calibrated and validated with 20 yr hydrology and water quality data. Lower MoRB SWAT model is under development.
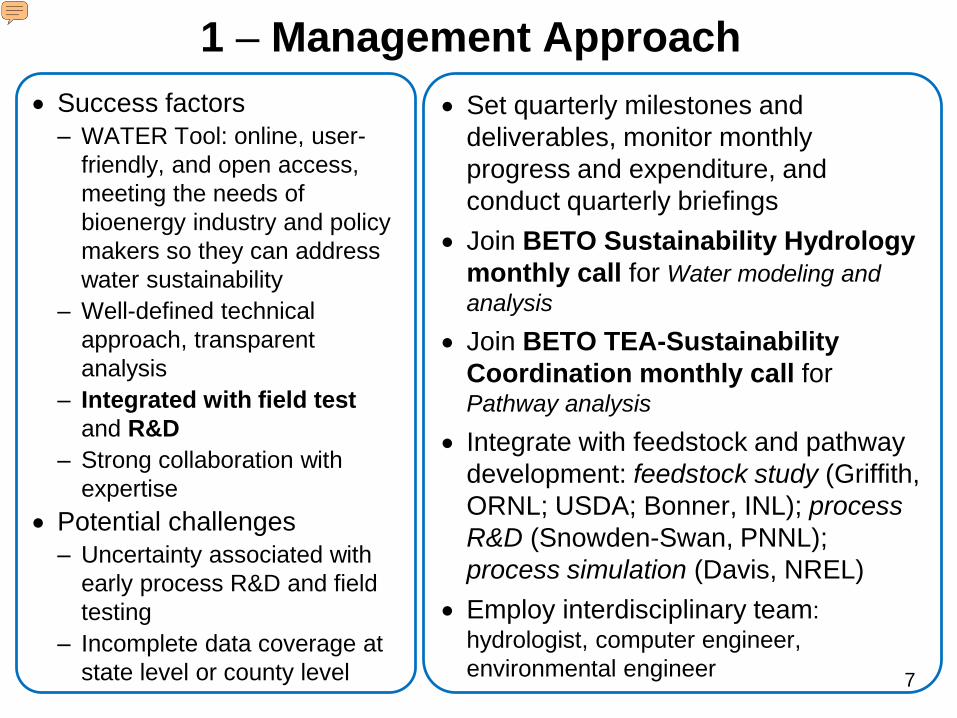
• Success factors ‒ WATER Tool: online, user-
friendly, and open access, meeting the needs of bioenergy industry and policy makers so they can address water sustainability
‒ Well-defined technical approach, transparent analysis
‒ Integrated with field test and R&D
‒ Strong collaboration with expertise
• Potential challenges ‒ Uncertainty associated with
early process R&D and field testing
‒ Incomplete data coverage at state level or county level
1 – Management Approach• Set quarterly milestones and
deliverables, monitor monthly progress and expenditure, and conduct quarterly briefings
• Join BETO Sustainability Hydrology monthly call for Water modeling and analysis
• Join BETO TEA-Sustainability Coordination monthly call for Pathway analysis
• Integrate with feedstock and pathway development: feedstock study (Griffith, ORNL; USDA; Bonner, INL); process R&D (Snowden-Swan, PNNL); process simulation (Davis, NREL)
• Employ interdisciplinary team: hydrologist, computer engineer, environmental engineer 7
Presenter
Presentation Notes
A structure established with support from BETO to effectively manage the project: Two BETO calls serve as a venue to communicate with other BETO projects and share experiences and technical issues in both water modeling and in technology analysis. Leverage other R&D projects that are supported by BETO, develop close collaborations We deal with risk on data availability and quality by collecting additional monitoring data from state, local governments and other agencies, NGOs whenever possible. The data are compiled, compared, screened based on data year, season, crop type, and collection method used. Selected data are then used to generate parameters for WF estimate. In case there is a data gap in certain period of time or in one particular region we substitute with the closest time period that data are available and the data for neighboring region respectively. Finally, uncertainties are discussed in the publications generated from the study.
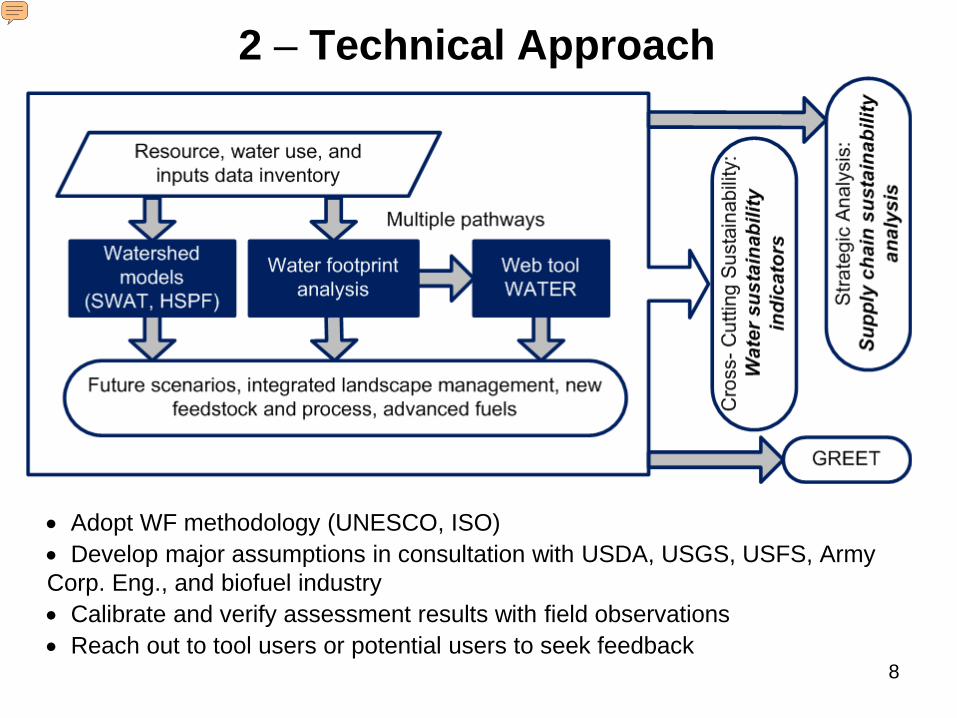
2 – Technical Approach
• Adopt WF methodology (UNESCO, ISO)• Develop major assumptions in consultation with USDA, USGS, USFS, Army Corp. Eng., and biofuel industry• Calibrate and verify assessment results with field observations• Reach out to tool users or potential users to seek feedback
8
Presenter
Presentation Notes
Project plan is to develop a water database for biofuel feedstock and process first; next step is to establish water quality data by hydrologic modeling, which is followed by water footprint (WF) estimate for various biofuel pathways, from conventional to cellulosic to advanced biofuel. Finally, results from the WF will be incorporated into WF tool development. Output of the project feeds to Water sustainability indicator development, GREET, and TEA.
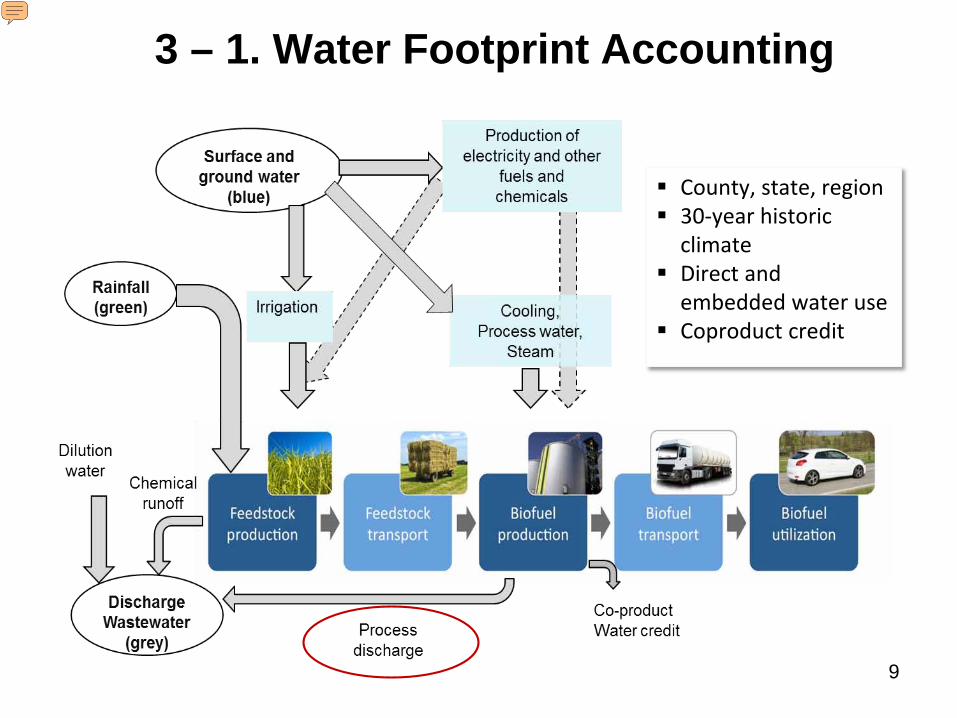
County, state, region 30-year historic
climate Direct and
embedded water use Coproduct credit
3 – 1. Water Footprint Accounting
9
Presenter
Presentation Notes
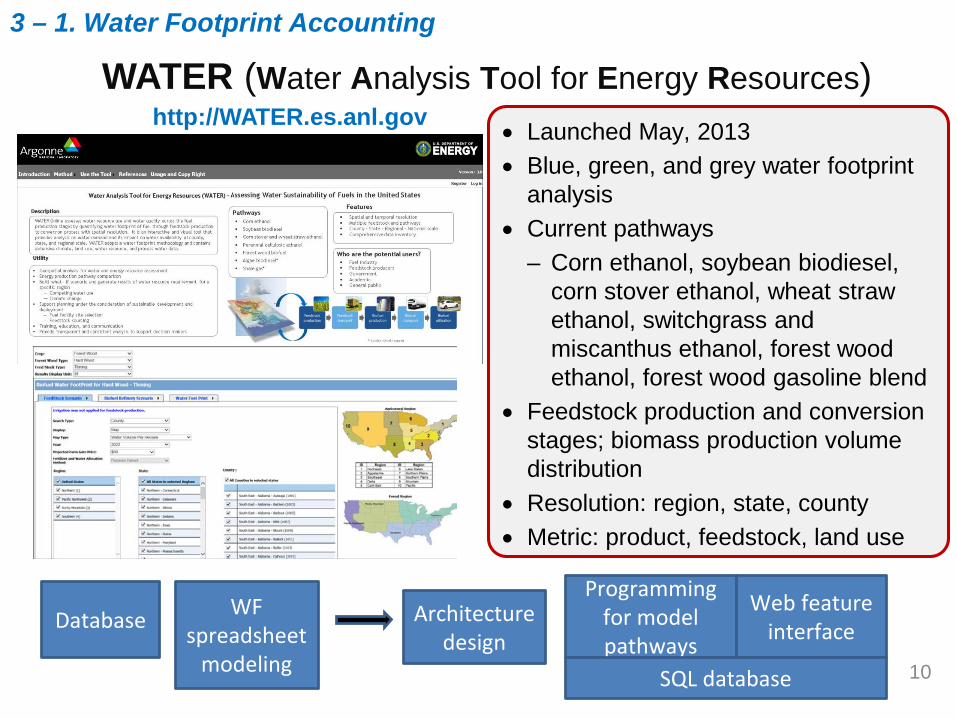
http://WATER.es.anl.gov
* Under development
• Launched May, 2013 • Blue, green, and grey water footprint
analysis• Current pathways
– Corn ethanol, soybean biodiesel, corn stover ethanol, wheat straw ethanol, switchgrass and miscanthus ethanol, forest wood ethanol, forest wood gasoline blend
• Feedstock production and conversion stages; biomass production volume distribution
• Resolution: region, state, county• Metric: product, feedstock, land use
WATER (Water Analysis Tool for Energy Resources)
Architecture design
Programming for model pathways
Web feature interface
WF spreadsheet
modeling
Database
SQL database
3 – 1. Water Footprint Accounting
10
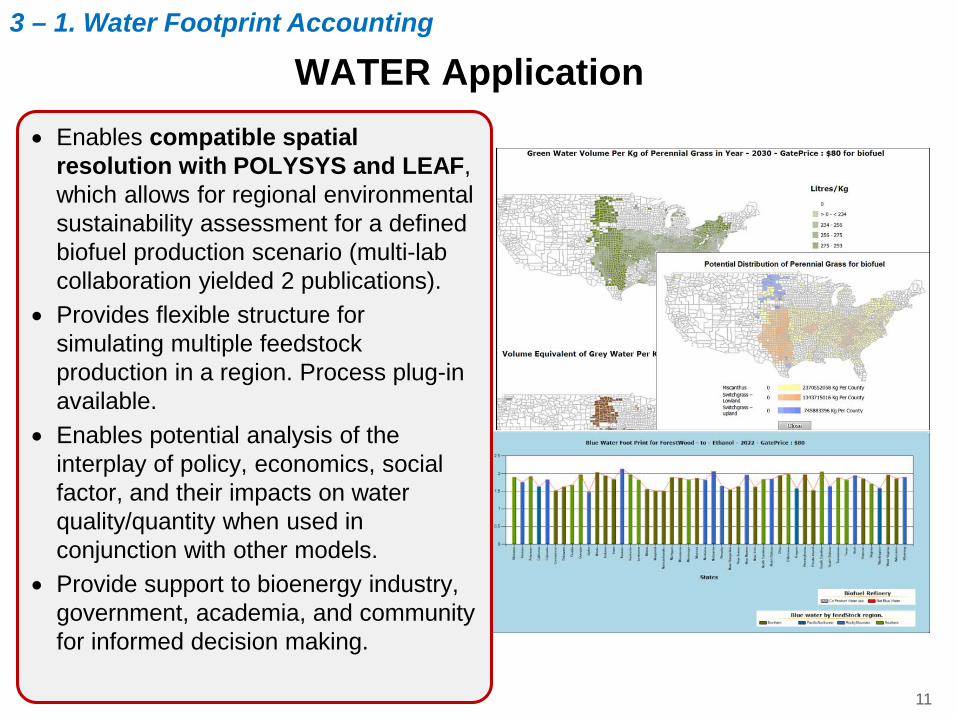
WATER Application • Enables compatible spatial
resolution with POLYSYS and LEAF, which allows for regional environmental sustainability assessment for a defined biofuel production scenario (multi-lab collaboration yielded 2 publications).
• Provides flexible structure for simulating multiple feedstock production in a region. Process plug-in available.
• Enables potential analysis of the interplay of policy, economics, social factor, and their impacts on water quality/quantity when used in conjunction with other models.
• Provide support to bioenergy industry, government, academia, and community for informed decision making.
3 – 1. Water Footprint Accounting
11
Key Milestones and Progress (Since 2013 peer review)
• Develop WF of forest resource-based biofuels by wood types (hardwood, softwood) and by feedstock (Short rotation woody crop (SRWC), thinning, and residue) in the U.S. at county, state, and forest region levels (100%)
• Release WATER v. 2.0 containing perennial (two switchgrass ecotypes and miscanthus) pathways (Mar. 2014); deliver a PMM milestone report to BETO (100%)
• Release WATER v. 3.0 containing forest wood pathway (Jan. 2015) (100%)• Assess WF of corn stover ethanol under a sustainable harvest scenario for
the U.S. (100%)• Estimate grey WF for biofuels produced via fast pyrolysis/hydrotreating:
initial analysis (100%), update (10%)• Estimate grey WF analysis for biofuels produced via biological sugar-to-
hydrocarbon pathway (10%)• Validate SRWC grey water at southeast forest regions (30%)• Update energy-water database for WATER: electricity generation (40%),
natural gas production (conventional and shale gas) (40%)
3 – 1. Water Footprint Accounting
12
Presenter
Presentation Notes
SWG – switchgrass MXG - miscanthus
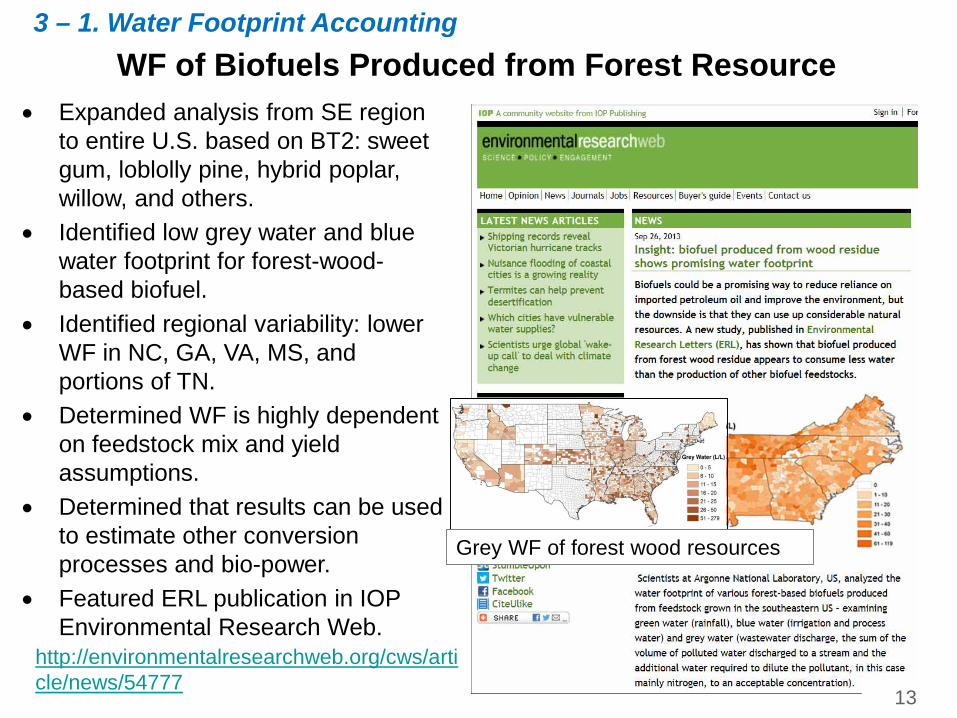
WF of Biofuels Produced from Forest Resource• Expanded analysis from SE region
to entire U.S. based on BT2: sweet gum, loblolly pine, hybrid poplar, willow, and others.
• Identified low grey water and blue water footprint for forest-wood-based biofuel.
• Identified regional variability: lower WF in NC, GA, VA, MS, and portions of TN.
• Determined WF is highly dependent on feedstock mix and yield assumptions.
• Determined that results can be used to estimate other conversion processes and bio-power.
• Featured ERL publication in IOP Environmental Research Web.
http://environmentalresearchweb.org/cws/article/news/54777
Grey WF of forest wood resources
3 – 1. Water Footprint Accounting
13
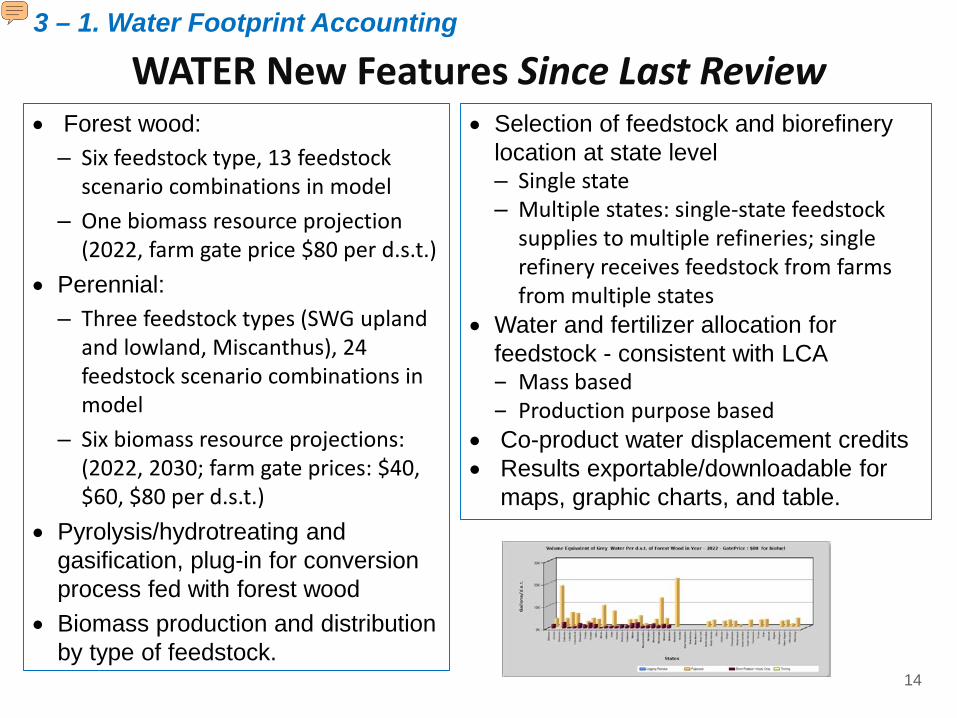
WATER New Features Since Last Review• Forest wood: ‒ Six feedstock type, 13 feedstock
scenario combinations in model‒ One biomass resource projection
(2022, farm gate price $80 per d.s.t.)• Perennial:
– Three feedstock types (SWG upland and lowland, Miscanthus), 24 feedstock scenario combinations in model
– Six biomass resource projections: (2022, 2030; farm gate prices: $40, $60, $80 per d.s.t.)
• Pyrolysis/hydrotreating and gasification, plug-in for conversion process fed with forest wood
• Biomass production and distribution by type of feedstock.
• Selection of feedstock and biorefinerylocation at state level‒ Single state‒ Multiple states: single-state feedstock
supplies to multiple refineries; single refinery receives feedstock from farms from multiple states
• Water and fertilizer allocation for feedstock - consistent with LCA‒ Mass based‒ Production purpose based
• Co-product water displacement credits• Results exportable/downloadable for
maps, graphic charts, and table.
14
3 – 1. Water Footprint Accounting
Presenter
Presentation Notes
Other features: Present WF by individual BM type in a mixed feedstock: 3D chart Security feature Biorefinery analysis and life cycle water footprint at regional level Biorefinery feedstock moisture content and ash content Water use in conversion process is feedstock ash/moisture content specific for the gasification and pyrolysis selection of feedstock and biorefinery location at state level - Single state features feedtock and biorefinery are in the same state. - Multiple states: feedstock and biorefionery can be in different states. Allows for a comprehensive environmental resource sustainability assessment for a defined biofuel pathway, when used in conjunction with the soil sustainability tool LEAF, feedstock resource tool POLYSYS, and possibly others with compatible model resolution Allow for an analysis of trade-offs among environmental, economic, and social impacts at regional level, when used in conjunction with other economic, infrastructure models.
WATER 3.0 Release in 2015• Argonne National Laboratory press release in early Jan., along with a
feature story; WATER announcement sent to biofuel and water experts • Broad media coverage and ripple effects resulted in more than 200
reports/stories in multimedia outlets in two weeks• Coverage spread from biofuel producers and growers, biorefinery
process developers, and forest industry network to academia, NGOs, consultants; coverage extended from U.S. to Europe and Asia. Examples:– DOE: BETO, EERE monthly blast, Bioenergy KDF, AFDC, Clean Cities– NARA, EESI, Sustainable City Network, Science New Daily, NWEEI, CBD (conversion on
biodiversity), Dallas Dumpster News– Biofuel Ind. Today (EIN), Biofuel Digest, Biomass Digest, Lab Manager,
Biofuels.dbio.eu, CPUC.Int, gracelinks, ipbiz, incbio, among others
• Positive responses to the release reflected bioenergy industry needs– Forest industry expressed interest and approached Argonne team; communication is
ongoing– Industry request incorporation of HTL (hydrothermal liquefaction) and other
processes, as well as forest wood logistics, manual. – Refinery siting/planning featured in WATER received attention. 15
3 – 1. Water Footprint Accounting
Grey water footprint
Wastewater composition
Water quality
standard
Wastewater discharge
limits
Treatment cost
Technology feasibility
Treatment options
Wastewater stream flow Local water
resource
Climate
Local water chemistry
Refinery scale
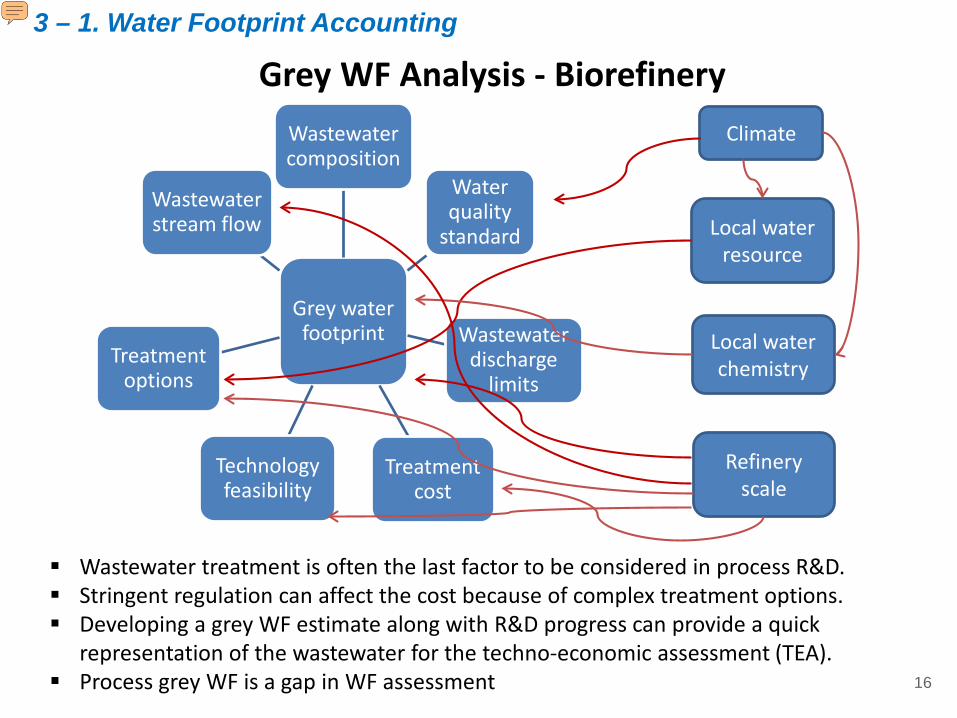
Wastewater treatment is often the last factor to be considered in process R&D. Stringent regulation can affect the cost because of complex treatment options. Developing a grey WF estimate along with R&D progress can provide a quick
representation of the wastewater for the techno-economic assessment (TEA). Process grey WF is a gap in WF assessment
Grey WF Analysis - Biorefinery3 – 1. Water Footprint Accounting
16
Presenter
Presentation Notes
Unlike agricultural fertilizer derived grey water which has been applied in the WF framework, conversion process-specific grey water footprint estimates were very limited. In addition, the methodology to calculate the process grey water is not well defined. In the last two years, our focus in this area has been to develop a methodology to define and quantify industrial grey water for biorefining processes. Our goal is to establish a grey water footprint analysis for each of the BETO supported biorefinery process. Extensive collaborations in this sub task: PNNL (R&D and sustainable analysis) for pyrolysis process sample characterization and biorefinery design NREL (analysis) for sugar-to-hydrocarbon process wastewater characterization and biorefinery design ORNL (field work) for water sample measurements in SRWC testing fields
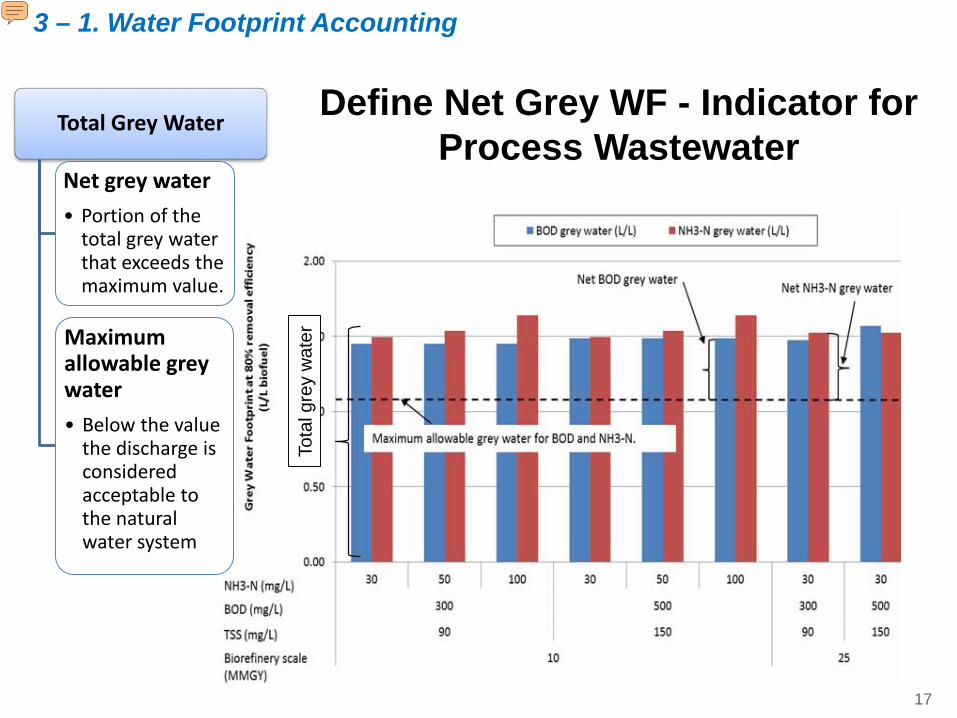
Define Net Grey WF - Indicator for Process Wastewater
Total Grey Water
Net grey water• Portion of the
total grey water that exceeds the maximum value.
Maximum allowable grey water• Below the value
the discharge is considered acceptable to the natural water system
Tota
l gre
y w
ater
3 – 1. Water Footprint Accounting
17
Presenter
Presentation Notes
Concept of the grey water Maximum allowable grey water - Determined by local water quality standards and wastewater discharge NPDES limits Take into account the natural system’s capability of degrading contaminants. Only discharge the level that natural system can absorb.
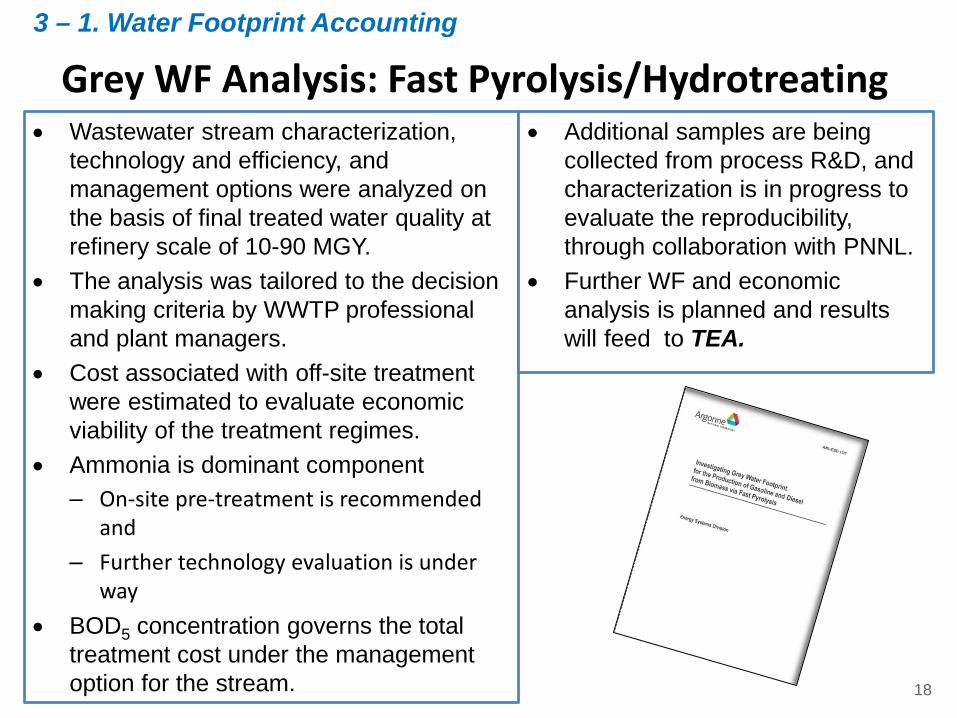
• Wastewater stream characterization, technology and efficiency, and management options were analyzed on the basis of final treated water quality at refinery scale of 10-90 MGY.
• The analysis was tailored to the decision making criteria by WWTP professional and plant managers.
• Cost associated with off-site treatment were estimated to evaluate economic viability of the treatment regimes.
• Ammonia is dominant component ‒ On-site pre-treatment is recommended
and‒ Further technology evaluation is under
way• BOD5 concentration governs the total
treatment cost under the management option for the stream.
Grey WF Analysis: Fast Pyrolysis/Hydrotreating• Additional samples are being
collected from process R&D, and characterization is in progress to evaluate the reproducibility, through collaboration with PNNL.
• Further WF and economic analysis is planned and results will feed to TEA.
3 – 1. Water Footprint Accounting
18
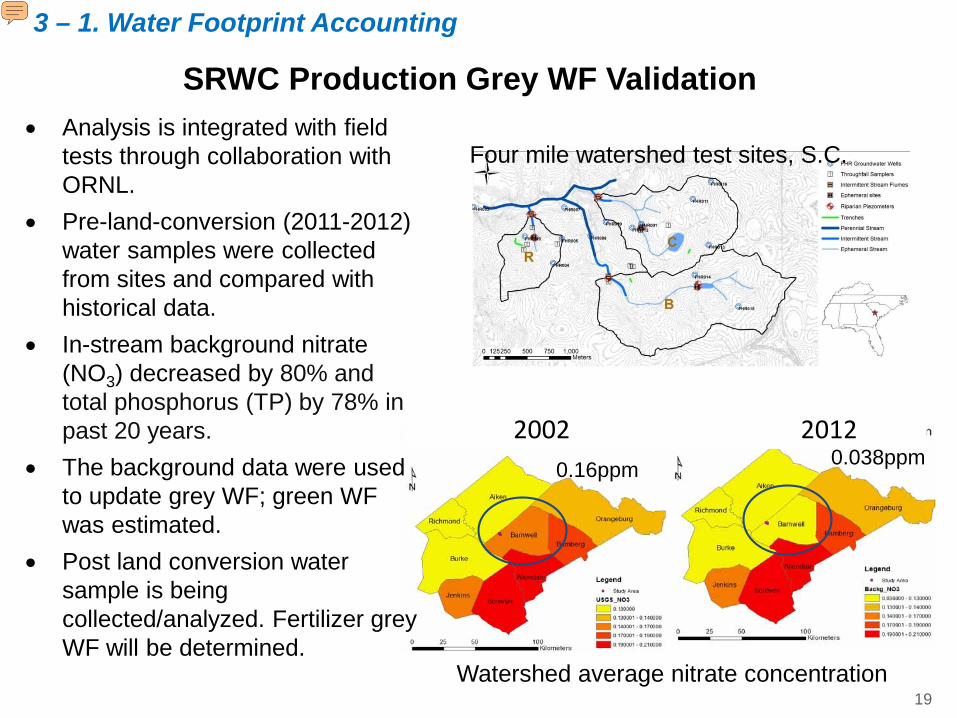
SRWC Production Grey WF Validation
2002 2012
Four mile watershed test sites, S.C.• Analysis is integrated with field
tests through collaboration with ORNL.
• Pre-land-conversion (2011-2012) water samples were collected from sites and compared with historical data.
• In-stream background nitrate (NO3) decreased by 80% and total phosphorus (TP) by 78% in past 20 years.
• The background data were used to update grey WF; green WF was estimated.
• Post land conversion water sample is being collected/analyzed. Fertilizer grey WF will be determined.
Watershed average nitrate concentration
0.16ppm 0.038ppm
3 – 1. Water Footprint Accounting
19
Presenter
Presentation Notes
R: reference watershed, no land use changes B and C: experimental watersheds (SRWC will be planted) SRWC grew in this study is pine. The field tests began in 2011: Background data collection: 2011-2012 Site cleaning: 2013 SRWC planting: 2014 Monitoring planned for next ten years. So far, we have received/analyzed the 2011-2012 background data. Recently the 2013 data has arrived.
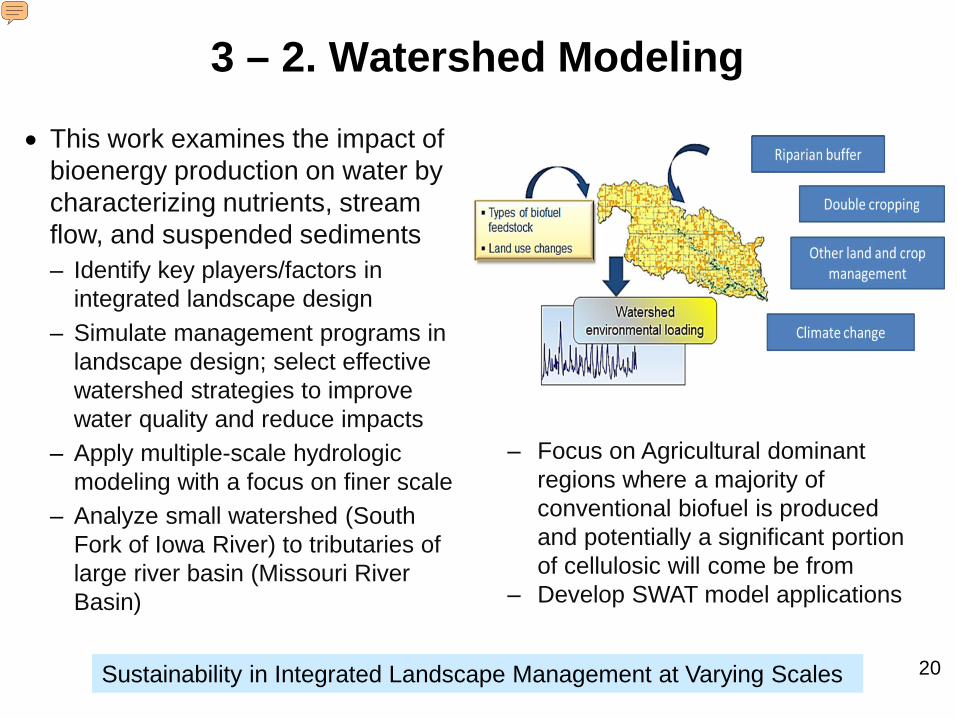
3 – 2. Watershed Modeling• This work examines the impact of
bioenergy production on water by characterizing nutrients, stream flow, and suspended sediments– Identify key players/factors in
integrated landscape design‒ Simulate management programs in
landscape design; select effective watershed strategies to improve water quality and reduce impacts
‒ Apply multiple-scale hydrologic modeling with a focus on finer scale
– Analyze small watershed (South Fork of Iowa River) to tributaries of large river basin (Missouri River Basin)
‒ Focus on Agricultural dominant regions where a majority of conventional biofuel is produced and potentially a significant portion of cellulosic will come be from
‒ Develop SWAT model applications
Sustainability in Integrated Landscape Management at Varying Scales 20
Presenter
Presentation Notes
Develop SWAT watershed models for agricultural dominant watersheds in Midwest to analyze: Best management practices (BMPs) New cropping systems in an integrated landscape management Potential impacts of climate change on water quality (nutrients, suspended sediments) Develop SWAT models for four tributaries of Mississippi river basin (MRB) Upper MRB, Ohio RB, Missouri RB, and Lower MRB Evaluate impacts of future scenarios at river basin/sub basin scale
Key Milestones and Progress (Since 2013 peer review)
• Develop a SWAT base model for South Fork of Iowa River (SFIR) watershed(100%)
• Evaluate modeling approach for the representation of buffer strip in SWAT (100%)
• Implement riparian buffer in SFIR and simulate water quality results (100%)• Apply an integrated landscape design with land conversion to switchgrass
scenario; develop comparisons under climate change for the SFIR watershed (100%)
• Simulate cover crop grown in stover harvest area in the integrated landscape management scenario for SFIR watershed (70%)
• Modeling integrated landscape scenario in a major watershed in IA (10%)• Develop two SWAT base models for Missouri River Basin (MoRB): Upper MoRB
and Lower MoRB (100%); implement a future production scenario (USDA baseline, $50 /d.s.t., 2022) on MoRB SWAT models and conduct tributary basin water quality analysis (100%)
• Conduct a water sustainability analysis for a BT16 scenario at watershed scale (10%)
3 – 2. Watershed Modeling
21
Presenter
Presentation Notes
SWG – switchgrass MXG – miscanthus Due to time limitation, results of cover crop/stover harvest, impact of climate change are not presented.
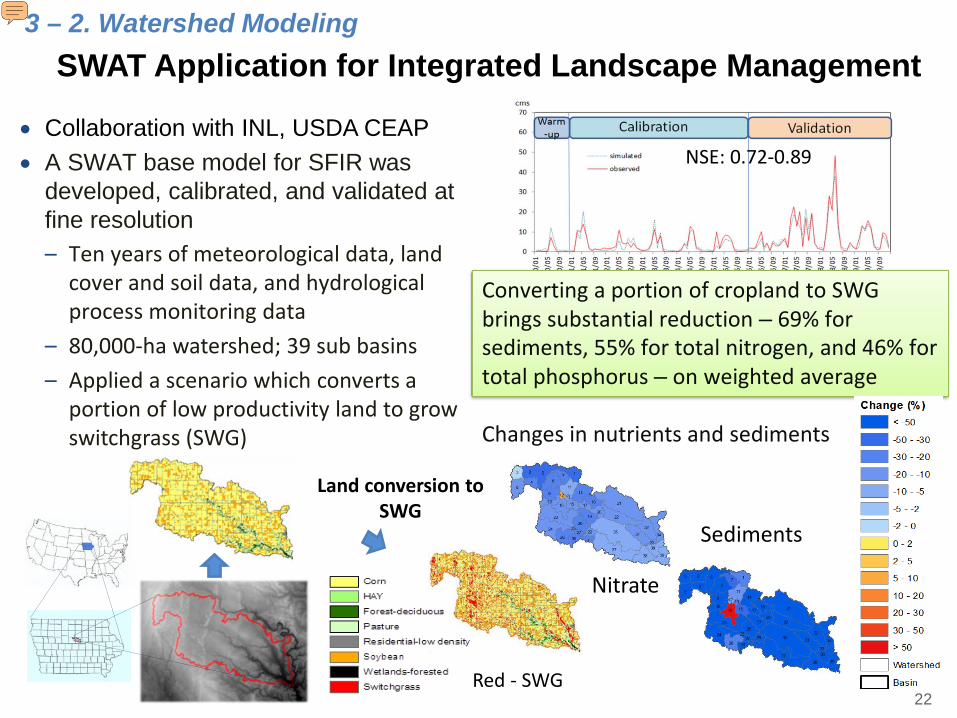
SWAT Application for Integrated Landscape Management
• Collaboration with INL, USDA CEAP• A SWAT base model for SFIR was
developed, calibrated, and validated at fine resolution– Ten years of meteorological data, land
cover and soil data, and hydrological process monitoring data
– 80,000-ha watershed; 39 sub basins– Applied a scenario which converts a
portion of low productivity land to grow switchgrass (SWG)
Land conversion to SWG
Nitrate
Sediments
Changes in nutrients and sediments
Converting a portion of cropland to SWG brings substantial reduction – 69% for sediments, 55% for total nitrogen, and 46% for total phosphorus – on weighted average
NSE: 0.72-0.89
Red - SWG
3 – 2. Watershed Modeling
22
Presenter
Presentation Notes
Land conversion scenario is developed by INL based on soil sustainability and yield potential. Red dots on the map represent areas converted to Switchgrass. These areas include lower productive corn/soybean acreages, idle land, etc. SFIR is a fine scale watershed in which agriculture is dominant with 79% crops being soybean and corn. Four years-crop rotation were modeled. Each segment in the watershed map represent a sub basin area, a total of 39 sub basin are defined for the model to achieve a fine resolution. a total of 1656 hydrologic units (HRUs) – a modeling unit in SWAT. NO3 - nitrate loadings in the watershed (mass/year) SS – suspended sediment loadings in the watershed (mass/year) TP – total phosphorus (mass/year)
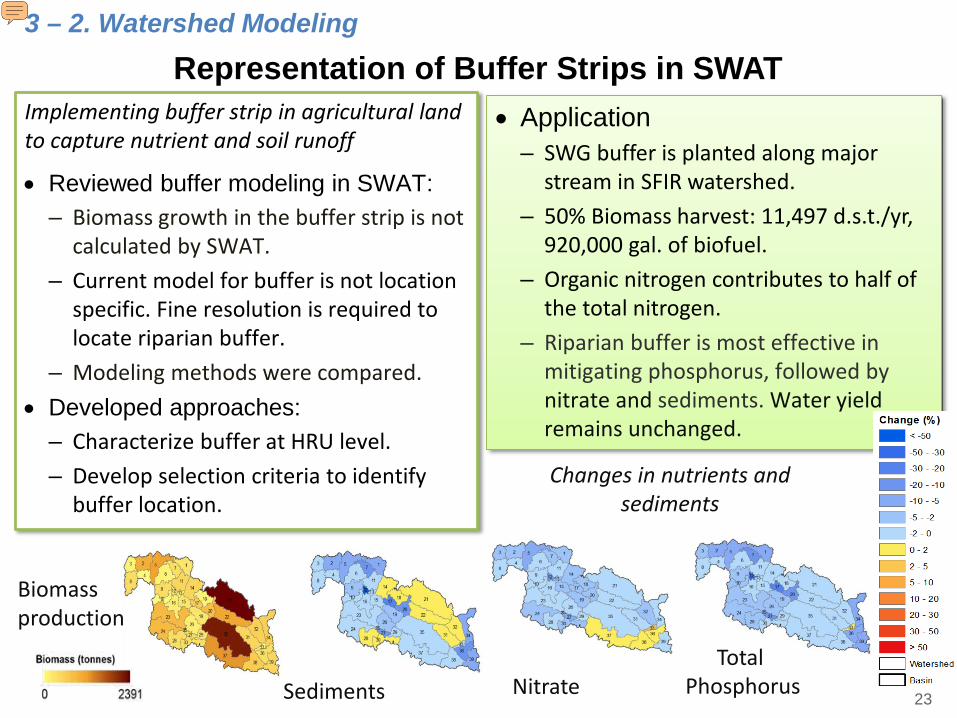
Representation of Buffer Strips in SWATImplementing buffer strip in agricultural land to capture nutrient and soil runoff
• Reviewed buffer modeling in SWAT: – Biomass growth in the buffer strip is not
calculated by SWAT.– Current model for buffer is not location
specific. Fine resolution is required to locate riparian buffer.
– Modeling methods were compared.• Developed approaches:
– Characterize buffer at HRU level.– Develop selection criteria to identify
buffer location.
• Application– SWG buffer is planted along major
stream in SFIR watershed.– 50% Biomass harvest: 11,497 d.s.t./yr,
920,000 gal. of biofuel. – Organic nitrogen contributes to half of
the total nitrogen. – Riparian buffer is most effective in
mitigating phosphorus, followed by nitrate and sediments. Water yield remains unchanged.
Changes in nutrients and sediments
NitrateSedimentsTotal
Phosphorus
3 – 2. Watershed Modeling
Biomass production
23
Presenter
Presentation Notes
Buffer strip benefits have been well documented and was recommended as one of the key best management and practices in agriculture. SWAT – soil water analysis tool, a watershed model developed by USDA. HRU – A modeling sub unit within the watershed determined based on the land use and soil data layers specified. One or more unique land use/soil combinations (HRUs) can be created for each subbasin. 30meter buffer is planted. 26,074 dry metric ton BM is produced, which translates to 16,096 d.s.t./yr, (assuming 70% above ground biomass is harvested, 20%loss during harvest) These BMs can produce 1MM gallons of ethanol (assuming a yield at 80gal/d.s.t.) At 50% harvest rate, d.s.t. biomass can be harvested which leads to 920,000 gal. of biofuel. (20% loss during harvest).
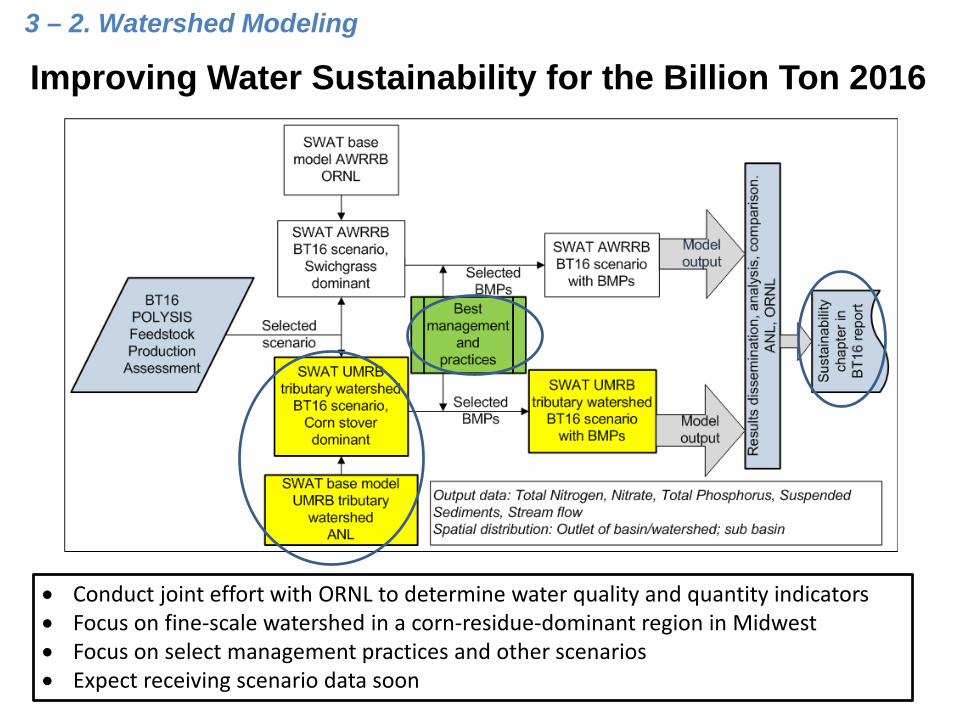
Improving Water Sustainability for the Billion Ton 2016
• Conduct joint effort with ORNL to determine water quality and quantity indicators• Focus on fine-scale watershed in a corn-residue-dominant region in Midwest• Focus on select management practices and other scenarios• Expect receiving scenario data soon
3 – 2. Watershed Modeling
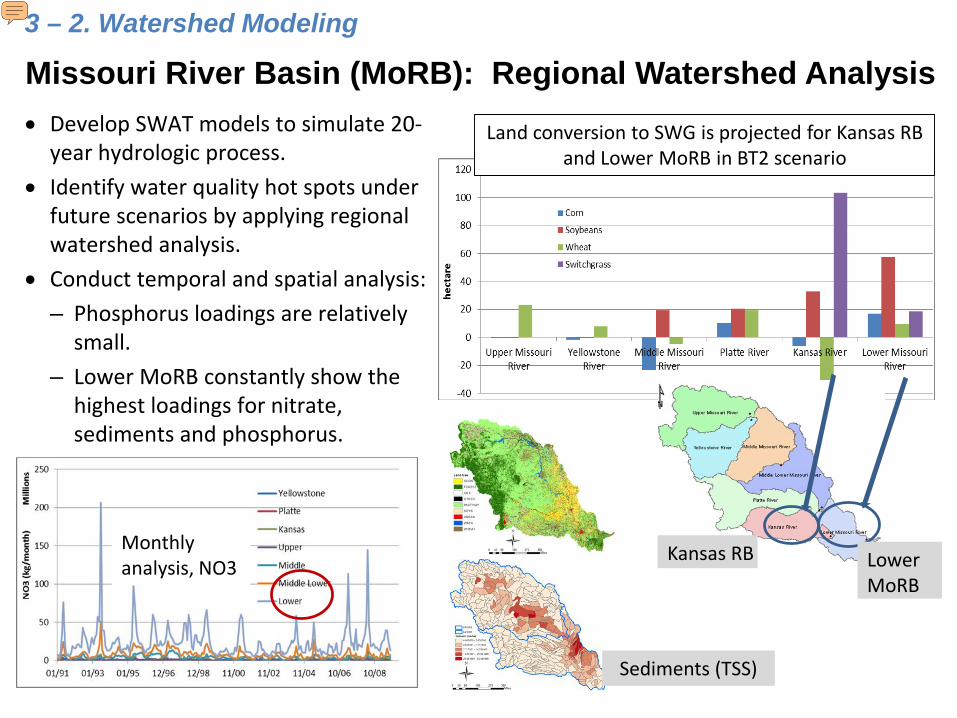
• Develop SWAT models to simulate 20-year hydrologic process.
• Identify water quality hot spots under future scenarios by applying regional watershed analysis.
• Conduct temporal and spatial analysis:– Phosphorus loadings are relatively
small.– Lower MoRB constantly show the
highest loadings for nitrate, sediments and phosphorus.
Monthly analysis, NO3 Lower
MoRBKansas RB
Sediments (TSS)
Land conversion to SWG is projected for Kansas RB and Lower MoRB in BT2 scenario
3 – 2. Watershed Modeling
Missouri River Basin (MoRB): Regional Watershed Analysis
Presenter
Presentation Notes
MoRB land use map: yellow – corn, soybean; light green – pasture; dark green - forest The basin is divided into 7 tributary watersheds for detail analysis. Temporal analysis included 20-year monthly water quality data comparison. Applied a BT2 scenario (USDA baseline, $50/d.s.t., 2022) Collaborated with Army Corp. Engineers: key data collection; Joint effort with ORNL: each model different tributaries in MRB. Purple bar in the chart represents SWG acregae in the BT2 scenario.
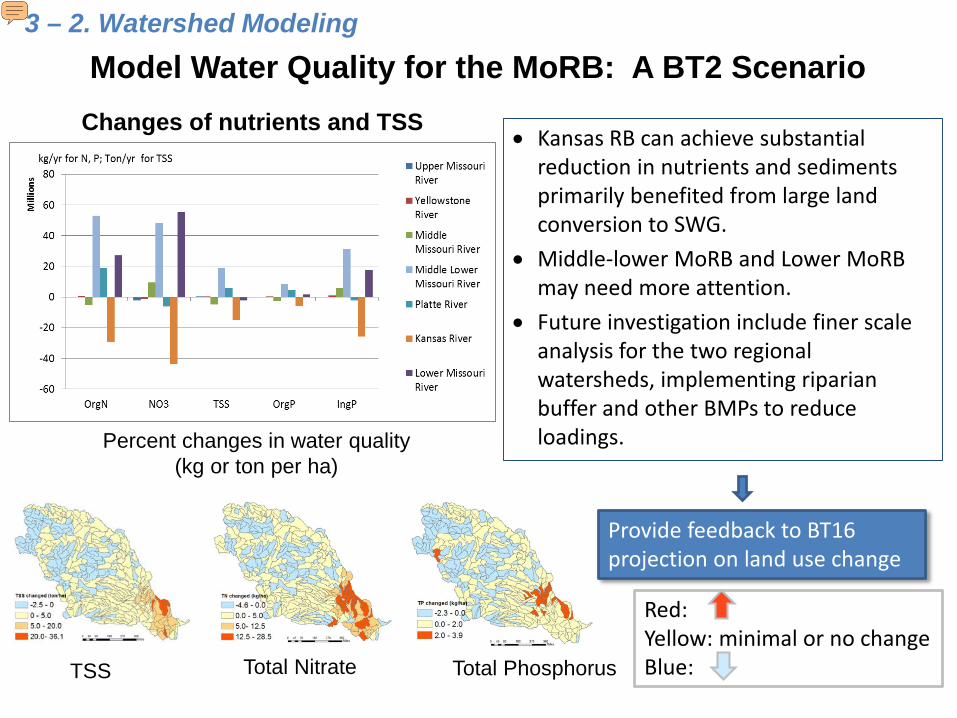
Model Water Quality for the MoRB: A BT2 ScenarioChanges of nutrients and TSS
Total NitrateTSS Total Phosphorus
• Kansas RB can achieve substantial reduction in nutrients and sediments primarily benefited from large land conversion to SWG.
• Middle-lower MoRB and Lower MoRBmay need more attention.
• Future investigation include finer scale analysis for the two regional watersheds, implementing riparian buffer and other BMPs to reduce loadings. Percent changes in water quality
(kg or ton per ha)
Red: Yellow: minimal or no changeBlue:
Provide feedback to BT16 projection on land use change
3 – 2. Watershed Modeling
Presenter
Presentation Notes
Reasonable land use change in the scenario that also targets at the regional watersheds with high nutrient and TSS loadings. Future need includes incorporating BMPs into the lower and Middle Lower MoRB to further reduce loadings. Results will feed to BT16 assessment in land conversion selection. A finer-scale analysis for the two tributary watersheds will be worthwhile.
3 Relevance• Water use and wastewater release are two key issues associated with water
sustainability in bioenergy development. Availability and sufficiency of water resource and meeting tightened regulations can become a barrier in financing and siting of refinery and limit deployment
• This project provides consistent platform to examine water sustainability metrics for bioenergy production, to meet BETO A&S’s strategic goal of integrating water quantity and quality assessments into biomass and bioenergy production analyses (MYPP 2014)─ Water Footprint translates feedstock/pathway selection into estimates of water
resource demand and water quality impact─ SWAT modeling permits multi-scale watershed analysis of water quality impacts of
future feedstock production scenarios• This project analyzes water consumption cross biofuel production stages
– Evaluate integrated landscape management to reduce nutrient and sediments burdens– Identify regional-specific low-water-intensity feedstock mix– Analyze key factors in process water and wastewater management, supporting TEA.
• This project supports stakeholders─ Provides a robust, on-line, user-friendly tool with appropriate functionality─ Facilitates incorporation of local water resource constraints in site selection for new
projects, in addition to economic and infrastructure considerations─ Supports policy makers to compare and evaluate potential impacts of energy policies
on natural resource 27
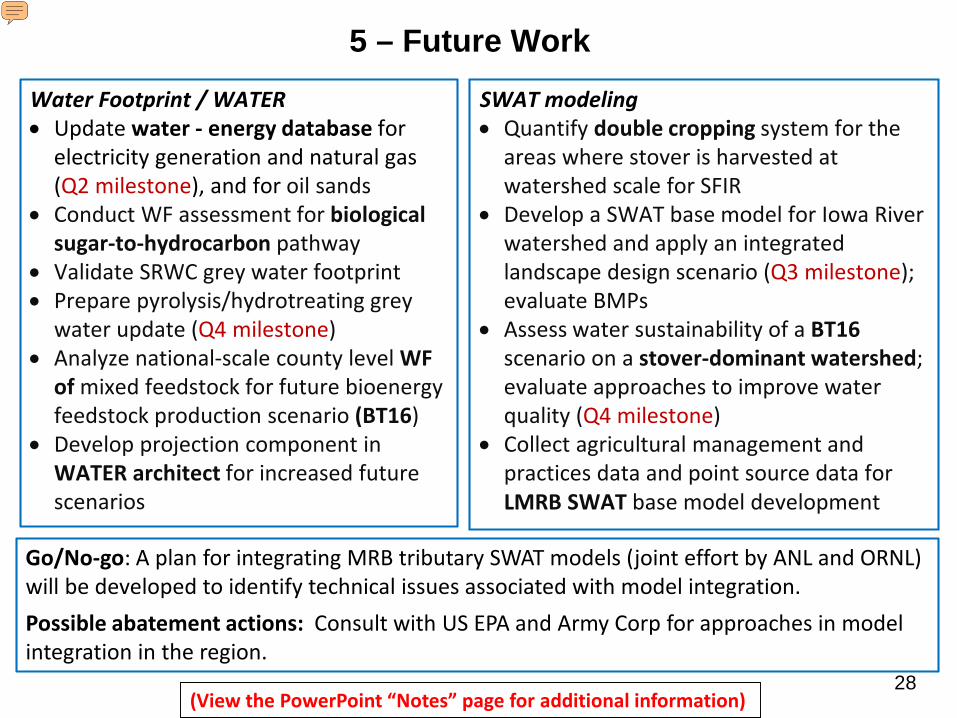
5 – Future WorkWater Footprint / WATER• Update water - energy database for
electricity generation and natural gas (Q2 milestone), and for oil sands
• Conduct WF assessment for biological sugar-to-hydrocarbon pathway
• Validate SRWC grey water footprint• Prepare pyrolysis/hydrotreating grey
water update (Q4 milestone)• Analyze national-scale county level WF
of mixed feedstock for future bioenergy feedstock production scenario (BT16)
• Develop projection component in WATER architect for increased future scenarios
(View the PowerPoint “Notes” page for additional information)
SWAT modeling• Quantify double cropping system for the
areas where stover is harvested at watershed scale for SFIR
• Develop a SWAT base model for Iowa River watershed and apply an integrated landscape design scenario (Q3 milestone); evaluate BMPs
• Assess water sustainability of a BT16scenario on a stover-dominant watershed; evaluate approaches to improve water quality (Q4 milestone)
• Collect agricultural management and practices data and point source data for LMRB SWAT base model development
Go/No-go: A plan for integrating MRB tributary SWAT models (joint effort by ANL and ORNL) will be developed to identify technical issues associated with model integration.Possible abatement actions: Consult with US EPA and Army Corp for approaches in model integration in the region.
28
Presenter
Presentation Notes
Purpose: Describe what will be done in the remainder of this year and in the coming year based on the three-year (2015-2017) AOP reviewed in 2014. Go/No-go: To assess the impact of future feedstock production on water quality in MRB, SWAT modeling for six tributary river basins of MRB (joint effort with ORNL) need to be integrated. A plan will be developed to identify technical issues, such as data availability, interface between tributary boundaries. A decision will be made at that point for the task. Possible abatement actions include closer collaboration with US EPA and Army Corp. for data and modeling methodology. Iowa river watershed is a main watershed in the state of Iowa.
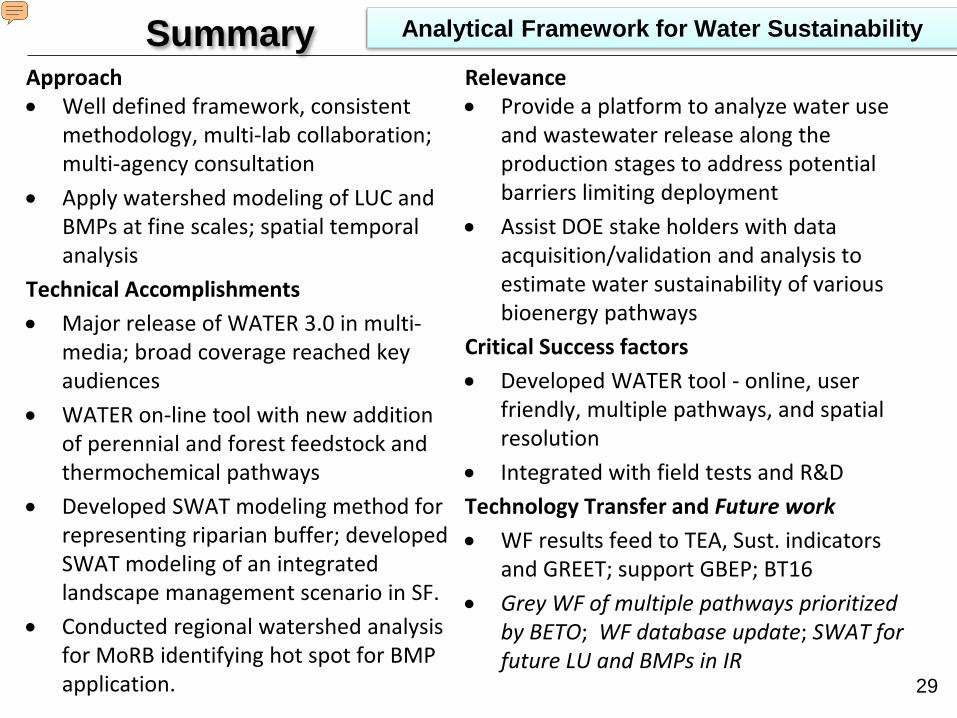
Approach• Well defined framework, consistent
methodology, multi-lab collaboration; multi-agency consultation
• Apply watershed modeling of LUC and BMPs at fine scales; spatial temporal analysis
Technical Accomplishments• Major release of WATER 3.0 in multi-
media; broad coverage reached key audiences
• WATER on-line tool with new addition of perennial and forest feedstock and thermochemical pathways
• Developed SWAT modeling method for representing riparian buffer; developed SWAT modeling of an integrated landscape management scenario in SF.
• Conducted regional watershed analysis for MoRB identifying hot spot for BMP application.
Relevance• Provide a platform to analyze water use
and wastewater release along the production stages to address potential barriers limiting deployment
• Assist DOE stake holders with data acquisition/validation and analysis to estimate water sustainability of various bioenergy pathways
Critical Success factors • Developed WATER tool - online, user
friendly, multiple pathways, and spatial resolution
• Integrated with field tests and R&DTechnology Transfer and Future work• WF results feed to TEA, Sust. indicators
and GREET; support GBEP; BT16• Grey WF of multiple pathways prioritized
by BETO; WF database update; SWAT for future LU and BMPs in IR
Summary Analytical Framework for Water Sustainability
29
Presenter
Presentation Notes
LU – land use IR – iowa river watershed Note: Results from this work are transferred to LCA water module in GREET. In FY14, WF of corn, soybean, and petroleum oil have been incorporated into GREET (FY14), which is reported under GREET project.
AcknowledgementBETO: Kristen Johnson, Alicia Lindauer
• ORNL: Natalie Griffith, Yetta Jager, Matt Langholtz, Laurence Eaton
• INL: Jacob Jacobson, Ian Bonner, Kara Cafferty
• NREL: Eric Tan, Abhijit Dutta, Ryan Davis
• PNNL: Lesley Snowden-Swan, Sue Jones

Additional Slides
31
Responses to Previous Reviewers’ CommentsComments: This project can be viewed as a fundamental or framing project for Sustainability and Analysis water quality projects focused on finer scales …. It is not clear that this project is well integrated in real time with others that are exploring finer scales…Need to validate model predictions across scales with field data.Responses:The project addressed the above comments by emphasizing the integration and validation of modeling through collaboration with other BETO supported projects: 1. SRWC grey water validation task collaborated with SRWC project team (ORNL),
which is exploring field-scale long-term tests. Field data collected since the inception of the project (2011- current) were transferred to ANL and used to estimate and validate grey WF for SRWC over time.
2. Grey WF for pyrolysis/hydrotreating task is integrated well with R&D in PNNL. Process wastewater sample characterization provides a basis for developing WF estimates. As the R&D progresses, samples are collected from 2013 to 2015 and estimate is updated. Similar approach is taken for sugar-to-hydrocarbon pathways.
3. SWAT development for SFIR is based on 10 years USDA CEAP monitoring data and sub-field analysis by INL. 32
Presenter
Presentation Notes
2013 Peer Review Report at http://www.energy.gov/eere/bioenergy/peer-review-2013
Publications• Zhang, Z., M. Wu. Spatial and Temporal Variations of Sediment, Nitrogen and Phosphorous Loading in the Missouri River Basin
under Historical and Projected Land Use Scenarios, Argonne National Laboratory Technical Report, Under review.• Lampert, D.J., M. Wu. 2015. Development of PyHSPF, Open-Source Software for Watershed Modeling with the Hydrological
Simulation Program in Fortran, Environmental Modelling & Software, accepted.• Wu, M. and Y. Chiu, 2014. Developing County-level Water Footprint of Biofuel Produced from Switchgrass and Miscanthus x
Giganteus in the United States, ANL/ESD-14 /18, Argonne National Laboratory, Sept. • Wu, M., Z. Zhang, Y. Chiu, 2014. Life-cycle Water Quantity and Water Quality Implications of Biofuels, Current Reports special
issues: Current Sustainable/Renewable Energy Reports. DOI 10.1007/s40518-013-0001-2, e-ISSN 2196-3010.• Muth, D. J. Jr, M. H Langholtz, E. C D Tan, J. J. Jacobson, A. Schwab, M. Wu, A. Argo, C. C Brandt, K. Y.-W. Chiu, A. Dutta, L. M Eaton,
E. M Searcy, 2014. Investigation of thermochemical biorefinery sizing and environmental sustainability impacts for conventional supply system and distributed preprocessing supply system designs, Biofuels, Bioprod. Bioref. (2014) DOI: 10.1002/bbb.1483.
• Wu, M., M. Ha, S. Yalamanchili, 2013. Implementing water footprint modeling of biofuels produced from switchgrass and miscanthus to WATER, PMM milestone report to BETO. Dec.
• Zhang, Z., Wu, M., 2013. Analysis of Riverine Sediment and Nutrient Exports in Missouri River Basin by Application of SWAT Model, ANL/ESD-13/12. Argonne National Laboratory, Dec.
• Jacobson, J., Langhotz, M., Jager, Y., Wu, M. 2013. Assessing New Crop Management Strategies on Economics, and Sustainability Introduction Assessing New Crop Management Strategies on Economics, and Sustainability Introduction, Milestone report to BETO, Dec.
• Wu, M. 2013. Investigating Grey Water Footprint for the Production of Gasoline and Diesel from Biomass via Fast Pyrolysis, Technical report ANL/ESD-13/7, Argonne National Laboratory, Dec.
• Chiu, Y. and M. Wu. 2013. Water footprint of biofuel produced from forest wood residue via a mixed alcohol gasification process, Environ. Res. Lett. Vol. 8, No. 3 (2013). DOI: 10.1088/1748-9326/8/3/035015.
• Zhang, ZL, M. Wu. 2013. Evaluating the Transport and Fate of Nutrients in Large Scale River Basins Using an Integrated Modeling System, in Landscape Ecology for Sustainable Environment and Culture, Ed. Bojie Fu, K. Bruce Jones, Springer Netherlands. ISBN: 978-94-007-6529-0. 2013.
• Argo, A. E. Tan, D. Inman, M. H. Langholtz, L. M. Eaton, J. J. Jacobson, C. T. Wright, D. J. Muth Jr, M. Wu, Y. Chiu, R. L. Graham. 2013. Investigation of biochemical biorefinery sizing and environmental sustainability impacts for conventional bale system and advanced uniform biomass logistics designs, Biofuels, Bioprod. Bioref. (2013) Vol.7 (3) p282-302. DOI: 10.1002/bbb.1391.
• Chiu, Y., M. Wu. 2013. Considering water availability and wastewater resources in the development of algal bio-oil, Biofuels, Bioprod. Bioref. (2013) Vol. 7 (4), p406-415. DOI: 10.1002/bbb.1397. 33
Presentation• Wu, M., Yalamanchili, S., Chiu, Y., Ha, M., WATER, 15th National Conference and Global Forum on Science Policy and the
Environment, Jan. 26-29, 2015. Washington DC.• Ha, M., Wu, M., Wang, J., Mitigating Impact of Climate Change on Water Quality by Landscape Design Incorporating BMPs in
Biofuel Production, 15th National Conference and Global Forum on Science Policy and the Environment, Jan. 26-29, 2015. Washington DC.
• Ha, M. and M. Wu, Representing Buffer Strips in Agricultural Landscape by SWAT – An Evaluation, American Geophysical Union (AGU) Fall Meeting, December 15-19, 2014, San Francisco, CA.
• Wu, M. WATER (Water Analysis Tool for Energy Resources), National Science and Technology Council’s Committee on Environment and Natural Resources, Subcommittee on Water Availability and Quality Meeting, Nov. 20, 2014.
• Ha, M. and M. Wu, Impacts of climate change and extreme weather events on hydrology and land use in Southforkwatershed, IA, AWRA Annual Water Resource conference, Nov. 6-9, 2014. Tysons Corner, Va.
• Wu, M. Sustainability of Renewable and Advanced Fuel Production, 2014 International Symposium on Adaptation to Climate Change for Energy Sustainability: Education Aspect, April 17, 2014. Taipei, Taiwan
• Wu, M., Dissecting the Water-Energy Nexus: Water Sustainable Production of Biofuel and Baseline Fuels, Illinois Water Day, April 11, 2014, Urbana-Champaign, IL
• Wu, M., Water Footprint of Biofuels: Current Understanding and Challenges, ASABE international symposium, Evapotranspiration: Challenges in Measurement and Modeling from Leaf to the Landscape Scale and Beyond. April 7-11, 2014. Raleigh, NC.
• Wu, M. and Y. Chiu, Municipal wastewater availability for biofuel production in southern states in the U.S. American Water Resource Association Conference 2013, Nov. 4-7, 2013, Portland, Oregon.
• Lampert, D. and M. Wu, Modeling biofuel feedstock and its watershed impacts at UMRB. American Water Resource Association Conference 2013, Nov. 4-7, Portland, Oregon.
• Wu, M., Assessing Impact of Large-Scale Biofuel Feedstock Production on Regional Water Resources, Enhancing Mississippi Watershed Ecosystems with Perennial Bioenergy Crops, CenUSA-Gulf of Mexico Hypoxia Task Force, Sept. 23-24, 2013, Minneapolis, MN
• Lampert, D., M. Wu, Development of a Watershed Modeling Approach to Assess the Impacts of Biofuel Feedstock on Water Quality in the Upper Mississippi River Basin, Energy and Sustainability 2013, 4th International Conference on Energy and Sustainability, 19 - 21 June 2013, Bucharest, Romania.
Presentations
34
Software• A hydrologic modeling software PyHSPF developed with BETO support in last two years has obtained BSD open
source license and been posted at an open source software host. https://github.com/drduffman/PyHSPF with a link to KDF. A link of the software site is being submitted to Aaron Myers at KDF to be included in KDF site.
35