Sustainability - roxasholdings.com.ph RHI 17-A Annu… · 4 THE RIGHT FNDAMENT ALS SUS TAINABILITY...
37
Transcript of Sustainability - roxasholdings.com.ph RHI 17-A Annu… · 4 THE RIGHT FNDAMENT ALS SUS TAINABILITY...


The RighT FundamenTals: SuStainability2
ANNUAL REPORT 2017 3
MISSION VALUESTO OUR CUSTOMERS:Provide quality sugar cane-based products
and services.
TO OUR PARTNERS:Be fair and transparent in our dealings.
TO OUR STOCKHOLDERS:Enhance shareholder value with reasonable
return on equity.
TO OUR PEOPLE:Provide professional growth, development
and recognition.
TO OUR COMMUNITIES:Be a responsible corporate citizen.
R - RELIABILITY & RELEVANCE
RELIABILITYWe fulfill expectations and deliver our commitments with all stakeholders.
RELEVANCEWe are mindful of the constant challenges and changes affecting the environment, and address them with creative, fresh and competent solutions.
H - HIGH STANDARDS
We constantly set high standards and ethics in our operations and with our products, and strive to exceed them.
I - INTEGRITY
We consider doing business following the time-tested principles of fairness, transparency and honesty.
Table of ContentsTable of Contents
Financial Highlights
Message from the Chairman
Message from the President & CEO
Operational Highlights
Corporate Governance& Sustainability
Board of Directors
Board Committees
Board of Advisors
Corporate Officers
02
03
04
06
08
14
20
25
26
27
The Right Fundamentals:
SustainabilityANNUAL REPORT 2017
Independent Auditor’s Report
Consolidated Statements of Financial Position
Consolidated Statements of Income
Consolidated Statements of Comprehensive Income
Consolidated Statements of Changes In Equity
Consolidated Statements of Cash Flows
Notes to Consolidated Financial Statements
Information for Investors
33
36
37
38
39
40
41
70
*RHI changed its fiscal year to October – September cycle.
Ten-Year Financial Highlights
Amounts in PhP M(except for the last three items)
2017 2016 2015 2014 2013 2012* 2011 2010 2009 2008
Net Sales 10,948 12,050 8,208 8,314 6,065 7,674 7,910 6,202 5,865 6,078
Income from Operations 553 410 199 46 1,127 1,028 -124 715 364 646
Net Income 120 102 19 615 486 701 -742 311 143 455
EBITDA 1,624 1,337 996 1,672 1,806 1,718 784 1,010 669 973
Total Assets 23,896 21,658 20,411 14,700 15,121 14,348 18,708 15,685 13,522 9,867
Total Equity 10,544 9,774 8,433 6,928 5,561 5,347 5,406 5,986 5,717 5,501
Debt-to-Equity Ratio 1.27 1.22 1.41 1.12 1.72 1.68 2.09 1.61 1.37 0.79
Earnings Per Share 0.08 0.07 0.01 0.67 0.53 0.77 -0.81 0.34 0.20 0.39
Dividends Per Share _ - 0.12 0.24 0.06 0.04 - - 0.08 0.06
EBITDA
1,6242017
1,3372016
Total Equity
10,5442017
9,7742016
Total Assets
23,8962017
21,6582016
Roxas Holdings, Inc. (RHI) holds
steadfastly onto the value of having the
right fundamentals in every aspect of its
operations. It ensures that its strategies are
well-aligned to propel sustainable growth
and to promote the welfare of its people
and those in nearby communities while
gently protecting the environment.
Striking a balance between its operations,
its people and the concomitant challenges
that beset the environment is a tough
act. However, RHI is committed to deliver
results without compromising people and
the environment. Its uncompromising
determination to sustainability in steering
its businesses – be it sugar, ethanol, or
agribusiness development – defines the
Group.
With this mindset, RHI puts high premium
on sustainability through a thorough and
synchronized way of approaching business
vis-à- vis the environment across all its
operations – building on its strengths
and weaving into its everyday operations
the value of innovation and strategy on a
focused trajectory.
*All figures are in million Pesos (PhP M).
Net Income
1202017
1022016
18%
Income fromOperations
5532017
4102016
35%
21% 10% 8%

The RighT FundamenTals: SuStainability4
ANNUAL REPORT 2017 5
For this, we express our sincere gratitude for the
wisdom and guidance of the members of our
esteemed Board of Directors who constantly remind
us to uphold the right fundamentals, particularly
sustainability, in our operations; the contributions of
our Board of Advisors; the strong commitment of our
Management; the hard work of our employees and
staff; and the solid support of our stakeholders.
Let us continue spurring RHI to achieve its aspirations
to be a world-class sugar and ethanol producer, and a
reliable partner through its agribusiness endeavors.
Everyone’s commitment and contribution will broaden
the horizon for RHI.
Let us all then work together in taking RHI to the next
level. With the right fundamentals, and a focused
adherence to sustainability, we will surely see greater
days for our beloved Company. We can easily hurdle
the tough challenges that will come our way if we
allow our business aspirations to be tempered by
sustainable principles and practices, and guided by our
unwavering commitment to social responsibility.
Thank you.
the interests of our employees, our partners in the
communities where our businesses operate and the
rest of our stakeholders.
Sustainability drives up our campaign to ensure the
continuous and smooth operations of our sugar and
ethanol plants without compromising our corporate
social responsibility.
We continuously engage our partner-planters, support
our employees, and collaborate with the national and
local government units to strike a healthy balance in all
our dealings.
RHI is doing its best to keep up with the tall demands
that technological advances and modernization
bring to the fore. We assess our strengths and our
weaknesses, and evaluate how we can harness the
avalanche of technology to improve the quality of our
policies and processes as well as products and people
to secure that advantage in sustaining our century-old
business that had improved and continue to sustain
the lives of families not only in Negros Occidental and
Batangas, but all over the country.
There is so much that we need to do to make that stark
difference in the lives of people so our commitment
goes beyond producing quality sugar and ethanol. We
commit to put forward and make our agenda to spur
nation building a reality with clarity of vision anchored
on sustainable practices and principles.
Sustainability is a key element in RHI’s journey to its
vision to become a world-class producer of sugar and
sugar-based products. It is a crucial part of the right
fundamentals behind RHI.
Message from the
CHAIRMAN
“Sustainability drives up
our campaign to ensure
the continuous and smooth
operations of our plants...”
Dear shareholDers: The Philippine economy grew at its fastest at 6.7% in
the past year, surpassing previous global and national
economic estimates.
Transitioning from an economy based on agriculture
to that of services and manufacturing, the Philippines,
minting its stature as a Newly Industrialized Country,
had also sealed its position as the world’s 34th largest
economy by nominal gross domestic product (GDP) as
noted by the International Monetary Fund.
The country also set new records by rising as the
13th largest economy in Asia and the third largest in the
Association of Southeast Asian Nations.
These positive economic developments are mirrored
by the national sugar industry, which was able to
overcome challenges that covered a period of
prolonged droughts to a tough competition it had with
the deluge of imported High Fructose Corn Syrup, to
a drop in the average price of sugar, and to the recent
imposition of additional taxes on sugar-sweetened
beverages under the Tax Reform for Acceleration and
Inclusion (TRAIN) Law.
With the end of the droughts which paved the way
for the sugar industry to experience a return to more
normal weather conditions, our company Roxas
Holdings, Inc. also managed to sustain its growth with
Consolidated Net Income at PhP120 million, up 18%
from the previous year – boosted mainly by our sugar
business. Despite some initial hiccups that included
lower ethanol price and extended enhancements
at the plants, our alcohol business was also able to
significantly contribute to the overall results.
We attribute this progressive growth to our Company’s
unwavering commitment to sustainability that
underscores every aspect of our operations.
More than ever, RHI lines up its resources to
sustainable practices and processes that we deem
crucial to our organization’s success. Our emphasis
is on how sustainable our operations are – taking the
long and firm view that we protect the environment
vis-à-vis our uncompromising stand to promote
PeDro e. roXasChairman

The RighT FundamenTals: SuStainability6
ANNUAL REPORT 2017 7
Azucarera de la Carlota, Inc. (CACI) recorded its
highest production volume in its century-old history,
with 2.15 million TCM – exceeding last year’s
1.48 million TCM by 45%. CACI also regained its
position as the third largest sugar producer in Negros
with market share of 13%.
Central Azucarera Don Pedro, Inc. (CADPI), our
Nasugbu-based milling and refinery unit, still
dominating the Batangas market with 71% share,
ended its milling operations with total production of
1.31 million TCM, 4% higher than the previous year’s
production of 1.26 million TCM. CADPI also refined
3.5 million LKg bags, 24% higher than the 2.83 million
LKg in CY 2016.
While the Alcohol Business Unit’s annual production
volume was steady at around 70 million liters, its
revenues slid 14% to PhP3.6 billion from
PhP4.2 billion due to lower average price of ethanol,
which is linked to the prices of sugar and molasses
– the main feedstock in ethanol production. Delays
due to prolonged enhancement works at the plants
in the early part of the year also affected the unit’s
performance.
Despite the drop in revenues, the Alcohol unit’s gross
income for the period rose 28% to PhP293 million from
the PhP229 million in the previous year.
The unit expanded its annual production capacity
to 82 million liters of ethanol as part of sustainability
measures. The expansion is expected to underpin the
continued growth of the alcohol business.
Meanwhile, RHI’s Agribusiness Development
Corporation (ADC), which set out to implement
services designed to sustain sugar cane production
in Negros Occidental and Batangas, commenced
its commercial operations in FY2017 and captured
Message from the
PRESIDENT & CEODear Fellow shareholDers:
We closed fiscal year 2017 on a high note, sustained by
consistent efforts to inch closer to our vision of Roxas
Holdings, Inc. becoming a world-class leader in sugar-
based products and services.
The strong performance of the Sugar Business Unit
spurred the Group to hit its PhP1.6 billion EBITDA target,
up 23% over last year’s PhP1.3 billion, despite challenging
market conditions.
Its Gross Profit climbed 36% to PhP1.457 billion vs. last
year’s PhP1.073 billion, as our Group focused on achieving
higher production volumes and efficiencies. It posted a
Net Income of PhP120 million, 18% higher than the
PhP102 million for the same period in FY 2016.
Beset by the impact of wet weather in its operations vis-à-
vis a very significant drop in average national sugar prices,
brought about by the entry of substantial volume of lower-
priced imported High Fructose Corn Syrup (HFCS) and
other substitute sweeteners, RHI’s Sugar Business Unit
still managed to turn the corner with gross income of
PhP1.164 billion, up 38% from PhP844 million the previous
year. The industry is indirectly affected by pressure
from our Asian neighbor Thailand’s expansion of sugar
farmlands to regain regional market leadership.
Furthermore, the taut discussions on the impact of the
increased taxes on sugar and sugar-sweetened beverages
(SSB) under the Tax Reform for Acceleration and Inclusion
(TRAIN) Law has likewise added to the apprehensions
within our industry.
Through conscious efforts that emphasize the value of
sustainability --- from the policies to the processes across
the organization, RHI, particularly its Sugar unit, recorded
improved production volumes and plant efficiencies that
resulted to 3.46 million tons of cane milled (TCM) for the
period, 26% higher from the 2.748 million in FY 2016. The
unit also produced 6.497 million 50-Kg (LKg) bags of sugar,
surpassing the 5.102 million LKg in the previous year.
Thus, our Sugar unit witnessed several milestones this past
crop year, with our improved relationships with planters
and the upgrades that we implemented at the plants.
Negros Occidental-based sugar subsidiary Central
estimated volumes of 289,000 tons of sugarcane for
CACI and 13,000 tons for CADPI.
The Group has many challenges to brace for.
These include the declining prices in sugar and
bioethanol that could hamper the success of revenue
initiatives; the eventual effects of the TRAIN Law on
consumption; the unregulated entry of lower import
priced alternative sweeteners like the HFCS, Stevia,
and other synthetic sweeteners; the continuing tight
competition on cane supply with other sugar mills;
the deteriorating productivity in the cane farms due
to undesirable practices such as extremely high
percentage of burnt canes and inadequate usage
of fertilizers; the alarming shortage of available farm
labor for cane harvesting and loading; the low level
of compliance among fuel companies to their Local
Monthly Allocations (LMAs) which would increase
industry inventory level that pushes prices down; and
stricter environmental regulations and requirements,
among others.
Rest assured that while the challenges abound,
your RHI team has taken every step to ensure the
sustainability of the business with solid steps and
carefully crafted solutions to overcome the hurdles.
We will continue to sustain and further nurture
our relationship with our planter-partners, support
the communities where we operate, roll out
environmentally safe and secured processes on waste
management and factory operations, further improve
our organizational talents, enhance communications
with our various stakeholders and thereby securing the
future of our businesses.
We see not only challenges but also promising
opportunities that will substantially reduce carbon hubert D. tubioPresident & CEO
“With ‘One Team, One RHI’, we had started to
transform the organization into a solid unit working
collaboratively to get to where the Group wants to be.”
emissions, energy costs, outside fuel consumption and
environmental management costs, especially with the
completion of our Anaerobic Digesters (ADs) and other
projects.
We are also exploring potential sources of canes in
Eastern Batangas and Quezon Province to further our
market share, as we tighten our focus on business
process analysis and total system management
engagement in tandem with our efforts to build a high-
performance work culture through intensive leadership
and talent development.
With “One Team, One RHI”, we had started to
transform the organization into a solid unit working
collaboratively to get to where the Group wants to be.
More than any other time, this is the opportunity for us
to move RHI forward as we innovate the future, solidify
the base, and set out to do more.
Challenges will definitely come in different sizes with
varying levels of impact but RHI stands ready for the
future. With a tight rein on sustainability measures
and an unshakable drive to deliver excellent results
in all frontiers of our business: from sugar to ethanol
to agribusiness development, we can all dream of
that day when RHI launches into the international
arena and steers greater collaboration with different
organizations.
That day may come sooner than expected if we
all strive with the commitment and integrity that
our esteemed members of the Board of Directors
exemplify; the consistent and conscientious work that
our Management and employees put in; and the trust
that our stockholders have in us.
We sincerely thank each of you for being with RHI
through every step of its journey. Together, let us make
that dream a reality at the most immediate time.
The RighT FundamenTals: SuStainability8
ANNUAL REPORT 2017 9
OpeRaTiOnal HigHligHTs
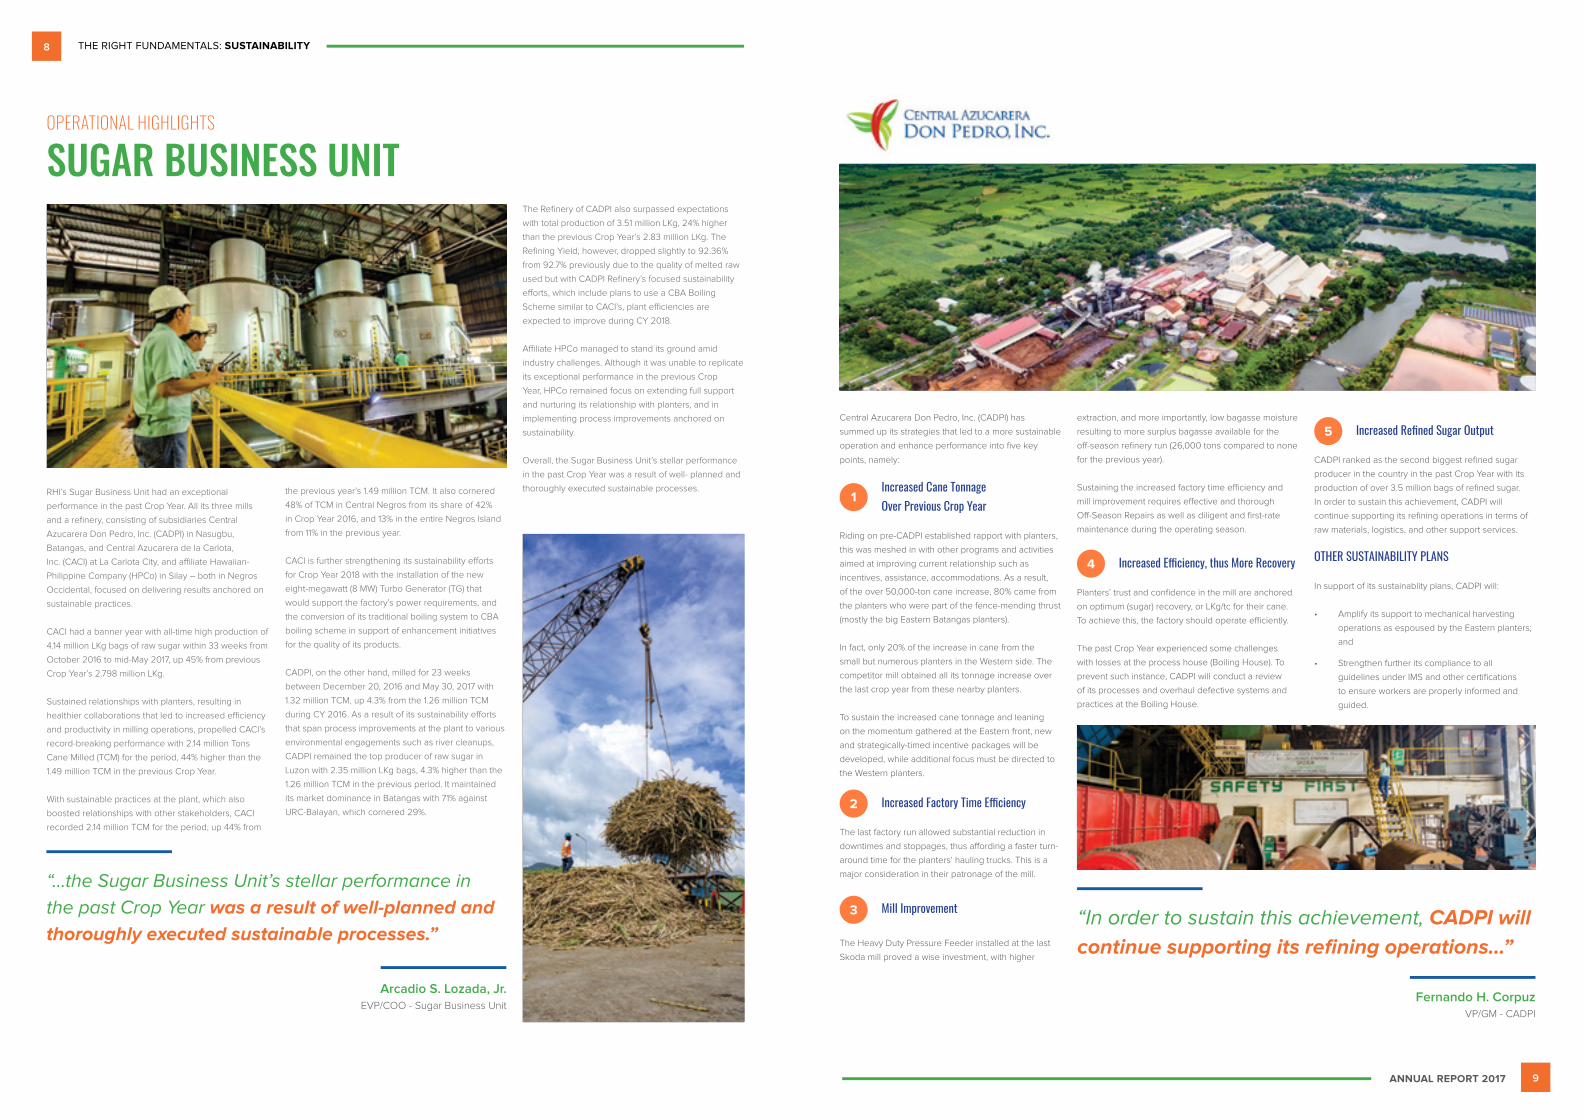
SUGAR BUSINESS UNIT
RHI’s Sugar Business Unit had an exceptional
performance in the past Crop Year. All its three mills
and a refinery, consisting of subsidiaries Central
Azucarera Don Pedro, Inc. (CADPI) in Nasugbu,
Batangas, and Central Azucarera de la Carlota,
Inc. (CACI) at La Carlota City, and affiliate Hawaiian-
Philippine Company (HPCo) in Silay – both in Negros
Occidental, focused on delivering results anchored on
sustainable practices.
CACI had a banner year with all-time high production of
4.14 million LKg bags of raw sugar within 33 weeks from
October 2016 to mid-May 2017, up 45% from previous
Crop Year’s 2.798 million LKg.
Sustained relationships with planters, resulting in
healthier collaborations that led to increased efficiency
and productivity in milling operations, propelled CACI’s
record-breaking performance with 2.14 million Tons
Cane Milled (TCM) for the period, 44% higher than the
1.49 million TCM in the previous Crop Year.
With sustainable practices at the plant, which also
boosted relationships with other stakeholders, CACI
recorded 2.14 million TCM for the period, up 44% from
the previous year’s 1.49 million TCM. It also cornered
48% of TCM in Central Negros from its share of 42%
in Crop Year 2016, and 13% in the entire Negros Island
from 11% in the previous year.
CACI is further strengthening its sustainability efforts
for Crop Year 2018 with the installation of the new
eight-megawatt (8 MW) Turbo Generator (TG) that
would support the factory’s power requirements, and
the conversion of its traditional boiling system to CBA
boiling scheme in support of enhancement initiatives
for the quality of its products.
CADPI, on the other hand, milled for 23 weeks
between December 20, 2016 and May 30, 2017 with
1.32 million TCM, up 4.3% from the 1.26 million TCM
during CY 2016. As a result of its sustainability efforts
that span process improvements at the plant to various
environmental engagements such as river cleanups,
CADPI remained the top producer of raw sugar in
Luzon with 2.35 million LKg bags, 4.3% higher than the
1.26 million TCM in the previous period. It maintained
its market dominance in Batangas with 71% against
URC-Balayan, which cornered 29%.
“...the Sugar Business Unit’s stellar performance in
the past Crop Year was a result of well-planned and
thoroughly executed sustainable processes.”
Arcadio S. Lozada, Jr.EVP/COO - Sugar Business Unit
Central Azucarera Don Pedro, Inc. (CADPI) has
summed up its strategies that led to a more sustainable
operation and enhance performance into five key
points, namely:
Increased Cane TonnageOver Previous Crop Year
Riding on pre-CADPI established rapport with planters,
this was meshed in with other programs and activities
aimed at improving current relationship such as
incentives, assistance, accommodations. As a result,
of the over 50,000-ton cane increase, 80% came from
the planters who were part of the fence-mending thrust
(mostly the big Eastern Batangas planters).
In fact, only 20% of the increase in cane from the
small but numerous planters in the Western side. The
competitor mill obtained all its tonnage increase over
the last crop year from these nearby planters.
To sustain the increased cane tonnage and leaning
on the momentum gathered at the Eastern front, new
and strategically-timed incentive packages will be
developed, while additional focus must be directed to
the Western planters.
Increased Factory Time Efficiency
The last factory run allowed substantial reduction in
downtimes and stoppages, thus affording a faster turn-
around time for the planters’ hauling trucks. This is a
major consideration in their patronage of the mill.
Mill Improvement
The Heavy Duty Pressure Feeder installed at the last
Skoda mill proved a wise investment, with higher
The Refinery of CADPI also surpassed expectations
with total production of 3.51 million LKg, 24% higher
than the previous Crop Year’s 2.83 million LKg. The
Refining Yield, however, dropped slightly to 92.36%
from 92.7% previously due to the quality of melted raw
used but with CADPI Refinery’s focused sustainability
efforts, which include plans to use a CBA Boiling
Scheme similar to CACI’s, plant efficiencies are
expected to improve during CY 2018.
Affiliate HPCo managed to stand its ground amid
industry challenges. Although it was unable to replicate
its exceptional performance in the previous Crop
Year, HPCo remained focus on extending full support
and nurturing its relationship with planters, and in
implementing process improvements anchored on
sustainability.
Overall, the Sugar Business Unit’s stellar performance
in the past Crop Year was a result of well- planned and
thoroughly executed sustainable processes.
extraction, and more importantly, low bagasse moisture
resulting to more surplus bagasse available for the
off-season refinery run (26,000 tons compared to none
for the previous year).
Sustaining the increased factory time efficiency and
mill improvement requires effective and thorough
Off-Season Repairs as well as diligent and first-rate
maintenance during the operating season.
Increased Efficiency, thus More Recovery
Planters’ trust and confidence in the mill are anchored
on optimum (sugar) recovery, or LKg/tc for their cane.
To achieve this, the factory should operate efficiently.
The past Crop Year experienced some challenges
with losses at the process house (Boiling House). To
prevent such instance, CADPI will conduct a review
of its processes and overhaul defective systems and
practices at the Boiling House.
1
2
3
4
“In order to sustain this achievement, CADPI will
continue supporting its refining operations...”
Fernando H. CorpuzVP/GM - CADPI
Increased Refined Sugar Output
CADPI ranked as the second biggest refined sugar
producer in the country in the past Crop Year with its
production of over 3.5 million bags of refined sugar.
In order to sustain this achievement, CADPI will
continue supporting its refining operations in terms of
raw materials, logistics, and other support services.
OTHER SUSTAINABILITY PLANS
In support of its sustainablity plans, CADPI will:
• Amplify its support to mechanical harvesting
operations as espoused by the Eastern planters;
and
• Strengthen further its compliance to all
guidelines under IMS and other certifications
to ensure workers are properly informed and
guided.
5

The RighT FundamenTals: SuStainability10
ANNUAL REPORT 2017 11
Crop year 2016 – 2017 was an auspicious year for
Central Azucarera de la Carlota, Inc. (CACI).
Armed with the right fundamentals and a reinvigorated
and radical management approach to business
essentials, CACI has proven that breakthroughs and
history can be made despite the challenges and
disruptions faced by the sugar industry during the
period.
Creating Momentum
For the first time ever, CACI recorded the highest
volume of tons cane milled (TCM) at 2.145 million,
44.31% higher than the 1.486 million tons of cane
supply acquired in CY 15-16. As a result, CACI moved
a notch higher from fourth place last crop year (12.16%)
to third place this season (16.91%) in terms of province
share of cane supply.
The accomplishment reflects the aggressive and
proactive strategies that were effected in cane supply
campaign as well as the renewed confidence and
patronage of sugar planters who returned to do
business with CACI, attracted by a more responsive
management and a rationalized incentive system.
Raw sugar production experienced a historical year.
The factory produced 4.143 million LKg of raw sugar
13.92% higher or 506,324 tons more than its projection
of 3.637 million tons. This is only the second time
in CACI’s history that the 4-million-ton ceiling was
breached. The last time was during CY 11-12 when CACI
registered a production of 4.119 million tons.
Meanwhile, CACI posted the second highest LKg/TC in
Negros Occidental for the period at 1.93, just 0.01 shy
behind the 1.94 of RHI affiliate Hawaiian – Philippine
Company (HPCo). LKg/TC is a measure of the yield or
the amount of sugar that can be produced from sugar
cane. The higher the value, the more sugar is available
in the canes.
CACI earned during the period the privileged
distinction as the only sugar mill in the entire province
that posted an increase in its overall LKg/TC (from
1.92 to 1.93) while the rest of the sugar mills saw a drop
in their performance compared to the last crop year.
Meeting challenges with resolve
CACI’s milestones were achieved amidst the backdrop
of the low price of sugar in global trading and the entry
of non-cane based sugar substitutes in the traditional
national and local markets.
Continuing upgrades and repairs of factory equipment
and facilities are yielding positive results.
Overall factory efficiency increased from 87.77% to
88.27% compared with the performance in the last
season. CACI’s efficiency level has been experiencing
a gradual increase over the years with 87.09% in CY
14-15, 87.77% in CY 15-16 and the current 88.22%.
Energy utilization has become relatively efficient
with the implementation of major projects such as
the High Grace Continuous Vacuum Pan (HG CVP)
– an equipment used to crystallize sugar, and the
improvement of evaporators. Power consumption per
ton of cane decreased from 25 kWh/TC last year to
23.37 kWh/TC this year.
Steam usage saw a significant improvement with
a figure of 0.6563 TS/TC this year against 0.74 last
season.
With the improvement in operation, CACI has a net
savings of 8,537 tons of bagasse (gross excess
is 20,798.39 tons), 10,831.73 tons of which were
forwarded to RBC, net of payment of woodchips
diverted to CACI.
Dependence on bunker as a source of fuel also posted
a marked drop. This year, CACI only consumed
568,111 liters of bunker fuel as against 2.085 million
liters in CY 15-16 and 802,487 liters in CY 14-15. The
five (5) trial runs that were initiated before the start
of the milling were the only reason for the current
consumption.
Meanwhile, the turn-around time for trucks to complete
their transport and delivery cycle was boosted when
the repair and rehabilitation of Truck Scale No. 5 in
Bucalan was completed. CACI has one of the fastest
delivery cycles in the industry with a turnaround rate
of 5.5 hours for regular trucks and four (4) hours for
transloading.
Factory stoppages, however, continue to be a
challenge. Major stoppages were experienced due
to Mills (46%) and Power House (26.44%) when the
Turbine Generators No. 5 and No. 3 broke down.
These were promptly addressed during the Off Season
Repair (OSR) activities in 2017 with the acquisition and
installation of the 8MW Turbine Generator.
Moving Forward: Sustaining the Gains, Revving up Momentum
CACI’s outlook for the future is upbeat while cognizant
of the ever present challenges in the industry. It
expects to sustain the gains of CY 2016-17 and maintain
its market and competitive edge by implementing a
number of innovations and reforms, including:
Continuous factory operations under
Weekend Preventive Maintenance Program
being implemented in CY 2017-2018.
Improvement in the quality of sugar
production by implementing the CBA
Boiling System and further enhancing
sugar recovery by the installation of the
Continuous Vertical Crystallizer (CVC).
Further reduction in downtime and factory
stoppages by improving the implementation
of OSRs primarily through advance planning
and ample time in the acquisition of
materials and critical parts of equipment.
RHI’s Ethanol Business Unit improved its financial
performance in Crop Year 2016-2017 despite some
hurdles.
While the volume of ethanol it produced in the past
Crop Year was slightly higher than its target of
70 million liters, it was still far better than the previous
crop year.
Mechanical failures restrained increase in production
volume but significant improvements in yield translated
to better profits.
The ethanol unit sustained its operations by learning
from previous mistakes, devising ways to operate more
efficiently and improving employee knowledge and
skills through significant and relevant trainings.
To achieve long-term sustainability, the ethanol unit
will definitely look forward to improving plant reliability,
minimizing environmental risks and utilizing all forms of
by-products to generate additional income.
CY 2016-2017 proved to be a trying year for Roxol
Bioenergy Corporation. But in spite of several
difficulties encountered, like the long shutdowns due
to equipment malfunction, the company remained
strong and steadfast in realizing important production
milestones.
The Plant achieved a volume of 31.95 million liters from
molasses and an increase of 8.6% in alcohol yield.
Both volume and yield records are the highest in the
history of Roxol.
These improvements were mainly due to the various
facility and process adjustments and refinements that
1
2
3
“CACI has proven that breakthroughs and
history can be made despite the challenges...”
Esteban H. CoscolluelaVP/GM - CACI
OpeRaTiOnal HigHligHTs
ETHANOL BUSINESS UNIT
also boosted operator confidence. The increase
in fermentation efficiency was attained through
modification of yeast propagation and control of
bacterial contamination. Also implemented to effect a
more reliable factory operation was the enhancement
of distillation equipment cleaning system and the
installation of new boiler ancillaries like the feed water
pumps.
Guided by one of the basic tenets of sustainable
operation which is reduce, reuse and recycle, Roxol
continues to search for and implement innovative
ways of improving the process as it aims for better
productivity, cleaner operation and cost efficiency.
“...the company
remained strong and
steadfast in realizing
production milestones.”
Noli G. SegoviaFactory Operations Manager - RBC
“The ethanol unit sustained its operations by
learning from previous mistakes...”
Luis O. Villa-AbrilleEVP/COO - Ethanol Business Unit

The RighT FundamenTals: SuStainability12
ANNUAL REPORT 2017 13
Background
RHI Agribusiness Development Corporation (ADC)
was established in 2015 with the mandate of capturing
canes for RHI mills. There were initially two units under
ADC, namely: Farm Operations and Farm Services.
The programs under Farm Operations Unit were
contract growing, in-house farms, crop loans, and
others.
The Farm Services Unit inherited the tractor assets
of the dissolved CADPI Farm Services, Inc. ADC
refurbished those that could still be used and added
in to the pool three (3) mechanical harvesters, 12
sugarcane grab loaders, and two (2) whole stalk
cutters.
ADC made a trial run in Crop Year 2015-16 and started
commercial operations in CY 2016-17, capturing
estimated 289,000 tons of sugarcane for CACI and
13,000 tons for CADPI.
Strategies
One of the major strategies implemented in CY 2016-17
was the hauling partnership with logistics company
Metropac Movers, Inc. (MMI).
ADC partnered with MMI as the third-party contractor
which provided hauling and loading equipment like
prime movers, container vans, and grab loaders. It was
an innovation that captured 94,000 tons of sugarcane
for CACI.
ADC added to its Negros motor pool 12 units of
sugarcane grab loaders in CY 2016-17, which it
imported from Thailand. The one unit that it bought the
previous year was sent to Batangas for use mostly in
in-house farms.
The 12 loaders contributed 93,000 tons cane to CACI.
Challenges
There were a few challenges that beset ADC in its
first year of actual operations. Hauling assets were
not maximized to their full potential, causing a loss in
ADC’s financials. The wet season in Negros extended
until December 2016 which hampered the use of
mechanical harvesting and loading equipment.
The lack of technical people for ADC also hindered
the subsidiary to expand its farm operations. Changes
in ADC leadership likewise posed problems in the
continuity of plans and execution.
Moving Forward
To be more focused, to operate more efficiently, and
to expand its business, ADC reorganized its team
into six (6) different units. The renewed thrusts are
Mechanization, Sugarcane Plantation, Extension and
Fertilization, and Agribusiness Innovation.
Under Mechanization are Hauling and Tractor
Operations, and Harvesting units; under Sugarcane
Plantation is the Model Farm unit; Extension &
Fertilization is another unit; and Agribusiness
Innovation has the Agribusiness Development and
R&D and Information units. ADC is now in the process
of hiring key personnel to man the team.
ADC terminated the contract with MMI but inherited
the assets, which it now manages. It is looking now
at introducing a new equipment, tractor-driven sickle
sword that would be in tandem with a grab loader to
ease up the problem of scarcity in manual labor.
With the new team, ADC hopes to expand its business
by leasing new areas, both for sugarcane and biomass
for ethanol and supplement fuel for boilers.
Agribusiness Development has processed crop loan
facilities to a couple of farmers in Batangas.
The Fertilization and Extension Unit is slowly taking
over the distribution of liquid fertilizer to the farmers
from Roxol.
R&D and Information is working on the monitoring
of the harvesting program thru mapping of ADC-
controlled farms, vertical expansion, and looking at the
possibility of establishing biomass plantations for future
ethanol production.
ADC has introduced new high-yielding sugarcane
varieties in Batangas, so that farmers who have been
stalled to using the same two varieties for years would
shift to using the new ones. Model Farm Unit is closely
monitoring sugarcane production and harvest of ADC-
controlled farms. Harvesting and Tractor and Hauling
Units are getting ready for the following year’s harvest.
With the new team, ADC hopes to expand its business
by leasing new areas, both for sugarcane and biomass
for ethanol and supplement fuel for boilers.
San Carlos Bioenergy, Inc. (SCBI) is the first fuel ethanol
distillery and cogeneration plant in Southeast Asia.
As the second ethanol facility of RHI, SCBI fared well
during Fiscal Year 2017 despite some challenges that
included cane supply issues which limited the plant’s
ethanol-from-cane production capability.
The plant produced 35.4 million liters of alcohol at the
yield of 272. It attained operational stability through
consistent high fermentation and distillation efficiency
with higher molasses yield and syrup yield carried
out through improvements made in the fermentation
liquidation process, and in the conduct of periodic
monitoring of plant parameters and key processes.
Low quality and inconsistent supply of canes
negatively affected sugar syrup yield but the sugar
syrup yield for Crop year 2016-2017 was still higher
than the previous year’s.
It also sustained plant reliability of 98% through
comprehensive maintenance program and process
enhancements.
Capacity utilization of SCBI also increased. It also
strengthened initiatives to diversify to other alcohol
derivatives by improving CO2 generation, enhancing
methane production, improving export power
generation, and enhancing fertilization.
SCBI managed wastewater through higher volume of
spent wash used in farm fertilization. Fertilization piping
lines to nearby farms were reactivated to support this
initiative.
These and other innovations, coupled with firm people
transformation initiatives, allowed SCBI to close
CY2016-2017 on a higher level of performance.
“...SCBI fared well during Final Year 2017 despite
some challenges...”
Damaso T. AgudeloFactory Operations Manager - SCBI
OpeRaTiOnal HigHligHTs

The RighT FundamenTals: SuStainability14
ANNUAL REPORT 2017 15
CORPORATE GOVERNANCERoxas Holdings, Inc. (RHI) rolled out the 2017 RHI
Revised Manual on Corporate Governance last year
in compliance with the circular of the Securities and
Exchange Commission requiring all listed companies
to submit new versions of their respective Manual on
Corporate Governance.
The Corporate Governance Committee unanimously
approved the 2017 RHI Revised Manual on Corporate
Governance, which contains the 16 principles below:
1. RHI shall be headed by a competent, working
Board to foster the long-term success of the
Company, and to sustain its competitiveness
and profitability in a manner consistent with
its corporate objectives and the long-term
best interests of its shareholders and other
stakeholders.
2. The fiduciary roles, responsibilities and
accountabilities of the Board as provided under
the law, the Company’s articles and by-laws, and
other legal pronouncements and guidelines shall
be clearly made known to all directors as well as
to stockholders and other stakeholders.
3. To show full commitment to the Company, the
directors should devote the time and attention
necessary to properly and effectively perform
their duties and responsibilities, including
sufficient time to be familiar with the Company’s
businesses.
4. The Board shall endeavor to exercise objective
and independent judgment on all corporate
affairs.
5. The best measure of the Board’s effectiveness
is through an assessment process. The Board
shall regularly carry out evaluations to appraise
its performance as a body, and assess whether
it possesses the right mix of backgrounds and
competencies.
6. Members of the Board are duty-bound to apply
high ethical standards, taking into account the
interests of the stakeholders.
7. The Board shall adopt standards for professional
and ethical behavior
8. The Company shall establish corporate
disclosure policies and procedures that are
practical and in accordance with best practices
and regulatory expectations.
9. The Company shall establish standards for the
appropriate selection of an external auditor,
and exercise effective oversight of the same to
strengthen the external auditor’s independence
and enhance audit quality.
10. The Company shall ensure that material and
reportable non-financial and sustainability issues
are disclosed.
11. The Company shall maintain a comprehensive
and cost-efficient communication channel for
disseminating relevant information. This channel
is crucial for informed decision-making by
investors, stakeholders and other interested
users.
12. To ensure the integrity, transparency and
proper governance in the conduct of its affairs,
the Company shall have a strong and effective
internal control system and enterprise risk
management framework.
13. The Company shall treat all shareholders fairly
and equitably, and also recognize, protect and
facilitate the exercise of their rights.
14. The rights of stakeholders established by law,
by contractual relations and through voluntary
commitments must be respected. Where
stakeholders’ rights and/or interests are at stake,
stakeholders shall have the opportunity to obtain
prompt effective redress for the violation of their
rights.
15. A mechanism for employee participation shall
be developed to create a symbiotic environment,
realize the company’s goals and participate in its
corporate governance processes.
16. The Company shall be socially responsible
in all its dealings with the communities where
it operates. It shall ensure that its interactions
serve its environment and stakeholders in a
positive and progressive manner that is fully
supportive of its comprehensive and balanced
development.
RHI also has the following policies in place:
Insider Trading Policy
The Company has an Insider Trading Policy which
prohibits the purchase, sale, or trading in securities
of the Company or another corporation while in
possession of material non-public information.
The Policy likewise prohibits the giving of material
non-public information, directly or indirectly, to anyone.
A violation of the Policy subjects the member of
the Board of Directors, Board of Advisors, officer, or
employee to disciplinary action in addition to possible
civil and criminal actions.
Business Conduct Policy
The highest standard of individual conduct is expected
at alltimes from each employee of Roxas Holdings,
Inc. not only in matters of financial integrity but also
in every aspect of business relationships. Business
should be conducted on the bases of fair dealing,
consideration for the rights and feelings of others
and the most stringent principles of good corporate
citizenship.
Each employee is charged with the responsibility of
acquiring sufficient knowledge of the laws relating
to his or her particular duties in order to recognize
potential dangers and to know when to seek legal
advice. Unlawful conduct will not be condoned under
any circumstances. Employees should consult with
the in-house counsel if they have questions regarding
compliance with certain laws, rules or regulations.
Whistle-Blowing Policy
The Group has a public interest disclosure or a whistle-
blowing policy whereby all employees have the right
and moral responsibility to report improper actions and
omissions. A workplace culture is developed in which
employees who act in good faith and in compliance
with the law are protected from interference in,
or retaliation for, reporting improper actions and
cooperating with subsequent investigations and
proceedings. Public Interest Disclosure is required
when employees, in good faith, believe superiors or
colleagues are engaged in an improper course of
illegal or unethical conduct, and they must be able to
disclose such conduct free from fear or intimidation or
reprisal.
Conflict of Interest Policy
The Company and its stakeholders require and expect
that business affairs must be conducted in a manner
that does not cloud judgment when dealing with third
parties, or when making decisions on behalf of the
Company. Business transactions must be undertaken
solely in the best interest of the Company.
Conflict of Interest can only be defined along broad
lines of ethical principles as it is impossible to conceive
of all situations where a conflict may arise. In general,
conflict of interest arises when an employee engages
in business or professional activities exclusively for his
own benefit on Company time or when such vested
interest goes against the interest of the Company
regardless whether it occurs during Company time
or not. In short, a conflict of interest arises when the
Company’s interests are sacrificed. Some illustrative
situations are:
1. Accepting business or outside employment;
2. Solicitation or acceptance of gifts;
3. Business dealings with the Company; and
4. Other analogous circumstances.
Moving forward, the Company is committed to bring
the level of adherence to good corporate governance
at par with the best practices from all over the country
and the ASEAN region.
CORPORATE SOCIAL RESPONSIBILITYThe approach of Roxas Holdings, Inc. (RHI) to
Corporate Social Responsibility (CSR) is embodied in
its mission to be a responsible corporate citizen. RHI
is committed to develop the host and surrounding
communities in its plants while working towards its
goal to be a world-class industry player.
The company integrates social development in its
business operations by implementing CSR Programs in
the communities where we operate. These programs
are in the areas of Environment; Livelihood, Health;
and Education, which are geared to improve, uplift,
and empower the lives of our partner communities,
and aligned with the United Nations Sustainable
Development Goals.
Integrating Environmental Stewardship into Our Operations
As part of the company’s commitment to
environmental conservation and biodiversity
enhancement, RHI subsidiaries engage in various
environmental activities in partnership with our key
stakeholders, primarily the Department of Environment
and Natural Resources (DENR).
Tree Planting
Tree Planting is one of RHI’s programs to a healthy
and balanced ecosystem while shrinking its overall
carbon footprint. RHI ensures that it is doing its
part in taking care of the planet in partnership with
various organizations including DENR and the
local government units (LGUs). Through the active
participation of its employees, RHI regularly conducts
tree planting in its host and surrounding communities.
RHI and its subsidiaries had planted almost 2,000
trees of various species. A total of 510 seedlings were
donated to various organizations including LGUs and
schools and seedlings totaling 1,389 were planted.
Adopt-a-Estero & River Clean-up
RHI is true to its commitment to implement climate
action to minimize environmental impact. Its
subsidiaries are actively participating in the Adopt-
a-Estero Program of the national government. In
partnership with the DENR, the lead agency for the
program, RHI aims to contribute in the achievement
of a cleaner, safer and healthier environment through
a collaborative undertaking between and among
communities along esteros or creeks and rivers,
concerned LGUs, the private sector and the DENR.
The program continues to gain support from various
key stakeholders as we regularly conduct cleanup in
our surrounding communities.
RHI subsidiaries also engaged in river and coastal
cleanups. Every September, each plant site participates
in the International Coastal Cleanup. There is also a
quarterly cleanup.
CADPI conducts monthly cleanup in nearby rivers and
coastal areas in partnership with over 50 volunteers
from CADPI, the LGUs and the Municipal Environment
and Natural Resources Office (MENRO). Since the Lian-
Palico River was adopted and included in the program,
significant improvements were observed. CADPI
employees also participated in the celebration of the
World Oceans Day by doing coastal cleanup of Bucana
Beach in Nasugbu, Batangas.
Strengthening Communities through Livelihood and Enterprise
Educated Marginalized Entrepreneurs Resource
Generation (EMERGE) Program
With the commitment to uplift the lives of communities
where it operates, RHI partnered with the Management
Association of the Philippines (MAP) for the Educated
Marginalized Entrepreneurs Resource Generation
(EMERGE) Program and with the small farmers of
Nasugbu, Batangas to develop the Napier Farming
Project. CADPI is a market for the Napier yields as it
has included Napier as a priority biofuel requirement
of the mill.
This approach is a sustainable way to engage low-
income farmers into RHI’s operations in a way that
creates mutual benefits both for RHI and the farmers.
Select marginal farmers in Barangay Calayo, Nasugbu,
Batangas are the beneficiaries of this project. These
farmers were placed on a mentorship program and
were taught good farming practices, specifically on
how to plant Napier grass. The RHI Agribusiness
Development Corporation, a subsidiary of RHI
provided the necessary technical assistance.
About seven (7) hectares of farmlands in Barangay
Calayo were planted with Napier and as of September
2017, the farmers started to harvest and deliver the
Napier to CADPI plant. RHI estimates to harvest
310 tons of Napier for the planting cycle.
Strategic Partnerships for Innovations in Sugar Cane
Production
One of RHI’s strategies is to establish partnerships with
organizations that share the same commitment and
advocacy towards social development. RHI engaged
with World Wildlife Fund (WWF) for Nature Philippines,
Multi-sectoral Alliance for Development (MUAD), and
the Bank of the Philippine Islands (BPI) Foundation on
the AgriClima Project. The AgriClima is a project that
intends to mainstream sustainability in the business of
sugar cane production.
These multi-party partnership aims to reduce the
impact of agricultural production and promote smart
agricultural practices for more productive and more
efficient farming. The partnership will also lead to
farmers’ access to credit, financial education, and
possible market linkage for intercrops.
RHI, through ADC and the CSR Department, provides
assistance to select farm cooperatives in Pontevedra,
La Castellana, Calatrava and San Carlos City in Negros
Occidental. The Assistance includes technical farm
inputs and access to possible credit and identifies
possible market linkage for the alternative crops or
intercrops of the farmers. Diversification of crops can
provide for additional source of livelihood to tide
farmers through the dreaded tiempo muerto, the low-
season from April to August, when farmers wait for the
sugarcane to grow to harvestable sizes.
Caring for the Health and Well-Being of Our Communities
RHI is committed to extend the benefits of the business
operations to the communities by prioritizing the health
of the residents through various health initiatives.
CORpORaTe gOVeRnanCe & sUsTainaBiliTY CORpORaTe gOVeRnanCe & sUsTainaBiliTY

The RighT FundamenTals: SuStainability16
ANNUAL REPORT 2017 17
Every year, RHI subsidiaries conduct Medical Missions
where free medical consultations and distribution of
medicines are conducted with the help of volunteer
medical professionals, including doctors and nurses
from both private and government sectors, including
the LGUs.
More than 1,500 individuals were served during
medical missions across the RHI subsidiaries during
Crop Year 2016-2017. RHI also reached out to other
areas not serviced during medical missions through the
distribution of medicines to Barangay Health Centers
(BHCs). San Carlos Bioenergy, Inc. (SCBI) provided the
necessary medicines to its four (4) BHCs, all within the
surrounding barangays of the plant.
Improving Access to and Quality of Education
RHI Scholarship Program
RHI ensures that it helps improve the access to
and the quality of education through sustainable
developmental programs that bring together
stakeholders to support the education of children in
the communities near the company’s plants.
The RHI College Scholarship Program aims to send
one child of an employee-dependent to college with
hopes that after graduation and upon employment, the
child can help provide a better future for the family.
The Scholarship Program started in 1985 and covers
the tuition and allowances of a student. Under this
program, CADPI has produced 130 graduates who are
now successfully employed.
RHI’s total number of scholars for Crop Year 2016-2017
is 125, with 63 scholars from Nasugbu, Batangas and
another 62 from Negros Occidental.
Establishing A Better Learning Environment
RHI employees embody the real essence of
responsibility through its active participation in Brigada
Eskwela, a national program of the Department of
Education (DepEd). The program, which has been
running for more than 10 years, gathers people and
organizations together to prepare public facilities for
the opening of classes.
More than the materials provided, the active
participation of RHI is displayed through its employee
volunteerism during Brigada Eskwela. This annual
event is a testament of RHI’s solid commitment to
support public education by creating conducive
learning environment for children in host communities.
Employees, along with other school volunteers, join
hands in repairing school furniture, repainting school
facilities, as well as cleaning the school grounds. Aside
from Brigada Eskwela, RHI also extends assistance
to the students and schools by distributing school
supplies which inspires students to study and helps
families send their children to school. For the Crop
Year 2016-2017, SCBI distributed school supplies to six
adopted public schools.
In support of the Gulayan sa Paaralan Program of
DepEd, CADPI donated compost to sevral schools that
established and maintained gardens as a source of
ingredients for the school-based feeding program.
Reaching Out through Employee Participation
Touching Lives through Tulong Aral
The Tulong Aral is an educational assistance program
being implemented by Roxas Foundation, Inc. since
2010 to help socio-economically deprived families
send their children to school. The grantees of the
program were originally limited to the children of rank
and file employees of Central Azucarera de la Carlota,
Inc. (CACI). Later, however, the program’s coverage was
extended to the deserving children of indigent families
residing in areas near CACI and Roxol Bioenergy
Corporation (RBC).
During the initial years of its implementation, the
program provided assistance only to children in the
elementary grades. Currently, the program caters to
children in both elementary and high school levels.
Employees from RHI and subsidiaries such as CACI,
RBC and CADPI support the program. Twenty-nine
CACI employees, 13 from RBC, and 12 from CADPI
sponsored over 50 deserving students for School Year
2016-2017.
The Gift of Blood is a Gift of Life
The Mass Blood Donation Program of the Philippine
National Red Cross (PNRC) aims to be able to collect
blood from a wider pool of donors through partnership
with different public and private establishments. RHI
and its subsidiaries regularly participate in this national
program.
With last year’s national theme: “What can you do: Give
Blood. Give Now. Give Often”, more than 250 bags of
blood were donated to the PNRC through Mass Blood
Donation activities that RHI employees participated
in and which were carried out in partnership with
neighboring schools, LGUs and other organizations.
CADPI started holding its Mass Blood Donations since
2015. It had donated over 280 bags of blood have
been donated by CADPI volunteers to the blood bank
of Red Cross Nasugbu since the program began.
PNRC awarded RHI a Certificate of Appreciation to
RHI in July 2017 for its meritorious service in promoting
PNRC’s Blood Donation Service program.
Servathon: Mobilizing Manila for Hope in Mindanao
Servathon or service-marathon is one of the flagship
programs of Hands on Manila. This is a venue for
collaborative engagement of companies to service
a select sector or group. The theme for 2017 was
Mobilizing Manila for Hope in Mindanao. Last
September 2017, employees from RHI Head Office and
CADPI joined other company volunteers and crafted
educational kits, prepared sleeping kits and provided
livelihood kits for the rural poor communities and the
families affected by the Marawi conflict.
Engaging Partners
We are driven to advance the principles of good
corporate citizenship and we do it through regular
engagements with key partners who are a core
component of our sustainability strategy. By engaging
converting it into organic fertilizer. FEDMUCO
pays CADPI PhP5 per bag of sold organic
fertilizer.
Working with the Community
Community engagement with the residents of the
areas where we operate in are conducted on a
regular basis to ensure that they are informed of our
environmental initiatives and projects.
♦ CADPI is one of the members in Nasugbu Beach
Forest Management Council whose main goal
is to rehabilitate the beaches at Nasugbu. The
plant consistently participated in the monthly
coastal clean-up as part of the programs of the
Nasugbu Beach Forest Management Council.
♦ CADPI conducts quarterly tree planting activities
at Roxas Village, Nasugbu, Batangas and in other
areas of the town. Roxol Bioenergy Corp. (RBC)
also conducted tree planting activity last Feb
2017 within the plant premises.
♦ RBC and Central Azucarera dela Carlota Inc.
(CACI) also participated in the Department of
Environment and Natural Resources’ Adopt-a-
Estero (Coastal Clean Up) program where a total
of 4,680 kgs of solid waste were collected from
different barangays.
Roxas Holdings, Inc. is fully committed to protect the
natural environment by ensuring that it conducts its
operations in an environmentally responsible manner.
The Group’s Environmental Management System
(EMS) encompasses all the subsidiaries in Batangas
and Negros Occidental.
With the EMS, RHI’s environmental performance
improved through an understanding of environmental
risks (incidents and complaints) and compliance to
regulatory requirements. Batangas-based Central
Azucarera Don Pedro, Inc. (CADPI) has achieved
certification to ISO 14001:2015 after passing the audit
conducted by SGS Philippines last March 14-16, 2017.
RHI has set the following sustainable priorities where
the Group can make the most impact:
ɨ Use of renewable energy to drive energy
efficiencies;
ɨ Conservation of natural resources; and
ɨ Working with the community
Energy:
Bagasse is the main feedstock used in RHI’s subsidiary
plants. This is augmented by wood chips especially
during off milling season. San Carlos Bioenergy, Inc.
(SCBI) has a COGEN plant, which has the capability to
export to national grid.
Natural Resources:
RHI ensures that wastes generated when factories
operate are properly managed to protect the
environment. The program includes monitoring of
wastewater, air emission, solid waste, and hazardous
waste to minimize their impact and comply with
regulatory limits. All RHI plants have valid permits and
licenses related to these aspects. Programs are also
being implemented for future sustainability and a good
example is the waste reduction program in CADPI.
♦ Based on the annual factory report of CADPI in
Batangas, wastewater generated for Crop Year
2016-2017 dropped 20.81% from the previous
year’s volume.
♦ Solid waste, both bio and residual, generated at
CADPI in the past crop year was also reduced
by 24.35% due to proper implementation and
monitoring of garbage segregation. Total factory
solid waster generated during the period was
120,610 kilograms, lower than the previous year’s
159,430 kgs.
♦ The total generated mud press for CY2016-
2017 was 60,049.07 tons. There is an ongoing
engagement with several concessionaires in
organic fertilizer production using mud press as
main raw material. One of the concessionaires
is FEDMUCO, a community-based cooperative
that is engaged in composting of mud press and
ENVIRONMENTAL MANAGEMENT SYSTEM
our partners through various modes that range from
formal to informal meetings, RHI is able to build strong
relationships with its employees, the regulators, the
communities and the farmers.
Farmers’ Day
One of the venues of engagement with our partner-
planters is the Farmers’ Day.
Sugar cane planters continue to face numerous
challenges such as the entry of High Fructose Corn
Syrup (HFCS), regulatory concerns, climate change
including water issues, and the continuous rising prices
of commercial inputs, including fertilizers.
Access to new information and extension services is
more crucial now in order for the sugar cane planters
to thrive in these challenging times. The Farmers’ Day
is one of possible venues for our partner-farmers to
learn about such information and services.
Last October 2016, about 250 stakeholders including
sugar cane planters, representatives of key agencies
such as the Department of Agriculture and the
Department of Environment and Natural Resources,
Local Government officials, as well as members of
the multi-partite monitoring team participated in the
Farmers’ Day initiated by RBC.
The event featured the presentation on the use of
distillery slops farm fertilization that led to improved
yield and LKg/TC. Headed by one of the experts from
the University of the Philippines, Los Baños, the Model
Farm Program for each barangay was introduced.
The Program is a productivity improvement showcase
where small farmers are educated on how they can
improve their yield and LKg/TC.
CORpORaTe gOVeRnanCe & sUsTainaBiliTY

The RighT FundamenTals: SuStainability18
ANNUAL REPORT 2017 19
The Human Resources Group of RHI supports a
multidisciplinary approach to sustainability. That is why,
though the One Team, One RHI campaign, it seeks to
draw more attention to the importance of alignment
in organizational approaches and elements that drive
success and growth such as the Vision-Mission-Values,
culture, innovation, engagement, processes & controls,
productive interactions & communication, learning &
development, performance, and more.
Through different events, interventions and activities
done company-wide, employees are further introduced
to the benefit of working together and aligning efforts
toward a common goal. “Conversations with the PCEO”
gives RHI team members a deeper insight into “why
we do the things that we do” and where the company
is headed.
HUMAN RESOURCESOne Team, One RHI for an Inspired, Learning, Performing, & Nurturing Organization
Through formal (trainings, seminars) and informal (such
as the “RHI Imprints”) development interventions,
employees accumulate learnings relevant to their roles
in the Organization. A nurturing culture is promoted
where knowledge-sharing is to be a norm among
peers, between staff and team leaders, and more
so, among successor candidates all to keep RHI a
constantly “Growing Organization”.
Even usual employee relations programs are tweaked
to inject more meaning to inspire a deeper connection
between individual aspirations and company goals
such as the Heart’s Day Program: “A Different Shade of
Love” or the “Graduates Honoring” program.
Finally, through objective performance planning
and evaluation that links to relevant recognition and
rewards, employees see the direct impact of their
efforts, big or small, to the desired outcomes of the
Organization.
The year 2018 will see more of #OneTeamOneRHI and
its various sub-campaigns to communicate and build a
stronger RHI Employer Brand.
CORpORaTe gOVeRnanCe & sUsTainaBiliTY
...the One Team, One RHI campaign... seeks to draw
more attention to the importance of alignment in
organizational approaches and elements...

The RighT FundamenTals: SuStainability20
ANNUAL REPORT 2017 21
Board of dIrectorsPeDro e. roXasChairman
Pedro E. Roxas is 61 years old and is a Filipino. He has
been a member of the Board of Directors since 1982.
He was elected as Acting President & Chief Executive
Officer of the company on 23 October 2015.
He is also the Chairman of the operating subsidiaries
of the company, namely: Central Azucarera Don
Pedro, Inc. (CADPI), Central Azucarera de la Carlota,
Inc. (CACI), Roxol Bioenergy Corporation (RBC), San
Carlos Bioenergy, Inc. (SCBI), and RHI Agri-Business
Development Corporation (RHI-ADC); and of affiliate,
Hawaiian-Philippine Company (HPCo).
Mr. Roxas is also the Executive Chairman of Roxas
& Co., Inc. (RCI) and until 2016, was the President
& CEO of RCI; the President of Club Punta Fuego
Inc.; the President of Fundacion Santiago; Chairman
of the Philippine Sugar Millers Association, Inc.;
Independent Director of Philippine Long Distance
Telephone Company (PLDT) and the Manila Electric
Company (Meralco), Banco de Oro (BDO) Private
Bank, and CEMEX Holdings Philippines, Inc.; Director
of Brightnote Assets Corporation; Trustee of the
Philippine Business for Social Progress, and Roxas
Foundation, Inc.; Vice Chairman of the Asean Sugar
Alliance; and a Member of the Polo and Equestrian
Directorate of Manila Polo Club.
Mr. Roxas was educated at Portsmouth Abbey School,
Rhode Island, USA, and at the University of Notre
Dame in Indiana, USA where he obtained his degree in
Business Administration.
Manuel V. PangilinanVice Chairman
Manuel V. Pangilinan is 71 years old and is a
Filipino. He was elected to the Board of Directors
on December 3, 2013 and is the Vice-Chairman
of the Board of Directors. He is the Chairman of
the Compensation Committee and a member of
the Executive. Mr. Pangilinan founded First Pacific
Company Limited in 1981 and served as Managing
Director until 1999. He was appointed Executive
Chairman until June 2003 when he was named
as CEO and Managing Director. Within the First
Pacific Group, he holds the position of President
Commissioner of P. T. Indofood Sukses Makmur Tbk,
the largest food company in Indonesia.
Mr. Pangilinan is the Chairman of PLDT, Inc. (PLDT),
Metro Pacific Investments Corporation (MPIC),
First Coconut Manufacturing Inc. (FCMI), Manila
Electric Company (Meralco), ePLDT, Inc., Smart
Communications, Inc. (Smart), PLDT Communications
and Energy Ventures, Inc. (formerly named Pilipino
Telephone Corporation), Maynilad Water Services, Inc.,
Metro Pacific Tollways Corporation, NLEX Corporation
(formerly Manila North Tollways Corporation), Philex
Mining Corporation, PXP Energy Corporation, Landco
Pacific Corporation, Medical Doctors, Inc. (Makati
Medical Center), Davao Doctors, Inc. and Colinas
Verdes Corporation (operating the Makati Medical
Center and Cardinal Santos Medical Center), Riverside
Medical Center Incorporated in Bacolod City, Our Lady
of Lourdes Hospital, Asian Hospital, Incorporated,
Central Luzon Doctors’ Hospital, De Los Santos
Medical Center, Metro Pacific Zamboanga Hospital
Corporation, and Megaclinic; Mediaquest Holdings, Inc.
and Associated Broadcasting Corporation (TV 5); and
the Vice Chairman of Roxas Holdings, Inc. On January
1, 2016, he assumed the position of President and Chief
Executive Officer of PLDT and Smart.
In 2006, the Office of the President of the Philippines
awarded Mr. Pangilinan the Order of Lakandula, rank
of Komandante in recognition of his contributions
to the country. He was named Management Man
of the Year 2005 by the Management Association
of the Philippines. Mr. Pangilinan was awarded the
First Honorary Doctorates Degree in Management
by Asian Institute of Management in 2016, Honorary
Doctorates in Science by Far Eastern University
in 2010, in Humanities by Holy Angel University in
2008, by Xavier University in 2007 and by San Beda
College in 2002 in the Philippines. He was formerly
Chairman of the Board of Trustees of the Ateneo de
Manila University and was a member of the Board of
Overseers of the Wharton School.
Mr. Pangilinan has received numerous prestigious
awards including Ten Outstanding Young Men of the
Philippines (TOYM) Award for International Finance
(1983), The Presidential Pamana ng Pilipino Award by
the Office of the President of the Philippines (1996),
Best CEO in the Philippines by the Institutional Investor
(2004), CEO of the Year (Philippines) by Biz News Asia
(2004), People of the Year by People Asia Magazine
(2004), Distinguished World Class Businessman Award
by the Association of Makati Industries, Inc. (2005),
Management Man of the Year by the Management
Association of the Philippines (2005), Order of
Lakandula (Rank of Komandante) by the Office of the
President of the Philippines (2006). He was voted as
Corporate Executive Officer of the Year (Philippines)
and Best Executive (Philippines) at the 2007 and 2008
Best-Managed Companies and Corporate Governance
Polls conducted by Asia Money. Mr. Pangilinan also
received the Best CEO Award from Finance Asia
Magazine (2012) and the Executive of the Year Award
from the Philippine Sports Writers Association (PSA)
(2014). In July 2015, Jaycees Philippines and the Asian
Institute of Management (AIM) conferred him the 2015
Ramon V. del Rosario (RVR) Lifetime Achievement
Award for his outstanding contributions to nation-
building and exemplary corporate citizenship.
In civic duties, Mr. Pangilinan sits as the Chairman of
the Philippine Business for Social Progress (PBSP),
PLDT-Smart Foundation Inc., One Meralco Foundation,
Inc., and Co-Chairman of the Philippine Disaster
Resilience Foundation (PDRF), and is a Director of
the Philippine Business for Education (PBED). He
is Chairman of the Board of Trustees of San Beda
College, as well as Co-Chairperson of the Board of
Trustees of Stratbase Albert del Rosario Institute. He is
Co-Chairman of the U.S.-Philippine Society.
In sports, Mr. Pangilinan is the Chairman of the MVP
Sports Foundation Inc., the Chairman Emeritus of the
Samahang Basketbol ng Pilipinas and the Chairman
of the Amateur Boxing Association of the Philippines
(ABAP).
Mr. Pangilinan graduated Cum Laude from the
Ateneo de Manila University, with a Bachelor of
Arts degree in Economics. He received his MBA
degree from the Wharton School at the University
of Pennsylvania. In Manila, he worked for Philippine
Investment Management Consultants Inc. (PHINMA)
in the Philippines, and in Hong Kong with Bancom
International Limited and American Express Bank
before founding First Pacific in May 1981.
hubert D. tubioPresident & CEO
Hubert D. Tubio is 63 years old and is a Filipino. He
was elected as a member of the Board of Directors
on December 16, 2015 and as President and Chief
Executive Officer of the Group effective January 1,
2016. He is a member of the Board of Trustees of
the Philippine Sugar Research Institute (Philsurin)
and the Philippine Sugar Millers Association (PSMA);
and a member of the Board of Directors of Negros
College, Inc. Mr. Tubio has an extensive and varied
career occupying senior leadership roles in sugar,
telecommunications, airlines, trading, and international
accounting/auditing industries. He was the Chairman
of the Board of Directors of Bioeq Energy Holdings,
Inc., a vertically integrated bioenergy company. He
served as President and Chief Operating Officer of
Victorias Milling Co., Inc. from 2009 to 2014; President
of Philsurin; Member of the Board of Directors of
Globe Telecom; President of Consultancy by Technicus
Corporation - a subsidiary of Deutsche Telekom A.G. of
Germany; Consultant of PAL Holdings, Inc.; and Vice-
President of Jardine Davies, Inc.
Mr. Tubio is a Certified Public Accountant (CPA). A
consistent university scholar, he graduated Cum Laude
with a degree in Bachelor of Science in Business
Administration (BSBA), Major in Accounting, from the
University of the East. He ranked 10th in the Philippine
CPA Board Examinations conducted in October
1975. He is also recognized as the “Most Exalted
Alphan” of Tau Alpha Sigma --- an exclusive fraternity
for Accounting Honors at the University of the East
Manila, in 1972. He also belongs to the Top 10% of
the 36th Management Development Program of the
Asian Institute of Management in 1991 with Superior
Performance Award.
He is also an Awardee of the University of the East
– Business Management’s Diamond Jubilee Alumni
Achievers’ Award in 2006. He attended the Deutsche
Telekom Global Event in Bonn, Germany in January
2002; and served as JDI Corporate Observation Group
Leader for the team that visited the Louisiana Sugar
Industry, at Lafayette, Patouville and New Orleans,
Louisiana, and the Hawaiian sugar industry in Maui,
Hawaii, USA in November 1997. He also attended the
International Society of Sugar Cane Technologists
(ISCCT) Congress in Cali and Cartagena, Colombia,
South America in September 1995; and the Sugar
Production and Processes Hands-On Technical
Training of Moreton Sugar Company, Ltd. (Bundaberg
Sugar Group) in Queensland, Australia from July to
August 1993.
pROFiles

The RighT FundamenTals: SuStainability22
ANNUAL REPORT 2017 23
santiago r. eliZalDeDirector
Santiago R. Elizalde is 53 years old and is a Filipino.
He has been a member of the Board of Directors
since 2000 and is a member of the Compensation
Committee.
Mr. Elizalde is the Chairman of the 24 Hour Vendo
Machine Corporation, Vice-Chairman and member
of the Executive Committee of ELRO Commercial &
Industrial Corporation and Club Punta Fuego, Inc.
He is also the President & CEO of Roxaco Land
Corporation, President of CGB Condominium
Corporation and Fuego Hotels and Management
Corporation, Chairman of Roxas Foundation, Inc., and
a Director of CADPI, CACI, ELRO Land Corporation,
Punta Fuego Village Homeowners’ Association, Punta
Fuego Village Foundation, Terrazas de Punta Fuego
Village Homeowner’s Association, and Fundacion
Santiago. Mr. Elizalde obtained his Bachelor of Arts in
Economics from Denison University in Ohio, USA.
DaViD l. balangueDirector
David L. Balangue is 66 years old and is a Filipino.
He has been a member of the Board of Directors
since February 12, 2012. He is the Chairman of the
Audit Committee and is a member of Executive and
Corporate Governance Committees. Mr. Balangue is
an accounting and auditing professional whose career
spanned 38 years at SGV & Co., the Philippines’ largest
audit and accounting professional services firm. He is
a former Chairman & Managing Partner of the firm, after
being admitted to partnership in 1982.
Mr. Balangue holds a Bachelor’s Degree in Commerce,
major in Accounting, Magna Cum Laude, from Manuel
L. Quezon University and a Master of Management
degree, with distinction, from the Kellogg Graduate
School of Management of Northwestern University in
Evanston, Illinois, USA, as an SGV scholar where he
received a Distinguished Scholar Award and elected to
the Beta Gamma Sigma, an exclusive honors fraternity.
He placed second highest in the 1972 Philippine CPA
Board Examinations.
He served as President of the Manila Polo Club,
Inc. (2014-2015), Financial Executives Institute of the
Philippines (2006); Philippine Institute of Certified
Public Accountants (2005); and Management
Association of the Philippines (2004).
At present, he is the Chairman of NAMFREL, the
Philippine Center for Population and Development,
Inc. (since 2014) and Coalition Against Corruption
(since 2006); Member of the Board of Trustees of
Habitat for Humanity Philippine Foundation, Inc. (since
2012), Chairman/President of Makati Commercial
Estate Association, Inc. (since May 2010), President of
Makati Parking Authority (since 2012) and Chairman
of the Philippine Financial Reporting Standards
Council (since February 2010). He is an Independent
Director of Phinma Energy Corp., Philippine Bank of
Communications, Manulife Financial Plans, Inc., and
Holcim Philippines, Inc. Mr. Balangue has a regular
column at Philippine Daily Inquirer.
raY C. esPinosaDirector
Ray C. Espinosa is 61 years old and is a Filipino. He
was elected to the Board of Directors on December
3, 2013. Atty. Espinosa is an Associate Director
of First Pacific Company Limited and serves as
Head of Government and Regulatory Affairs, and
Communications Bureau for the Philippines.
Atty. Espinosa is a Director of PLDT Inc., Smart
Communications, Inc., Manila Electric Company
(Meralco), Metro Pacific Investments Corporation,
Meralco PowerGen Corporation, First Agri Holdings
Corporation and First Coconut Manufacturing
Inc., Voyager Innovations, Inc., Cignal TV, Inc. and
Mediaquest Holdings, Inc. He also serves as an
Independent Director of Lepanto Consolidated Mining
Company (Lepanto) and Maybank Philippines, Inc.
(Maybank Philippines). He is the Chairman of the
Finance Committee of Meralco, the Audit Committee
of Lepanto and the Risk Management Committee
of Maybank Philippines. Mr. Espinosa is the Chief
Corporate Services Officer of PLDT and Smart, the
General Counsel of Meralco and Head of PLDT’s
Regulatory Affairs and Policy Office. He is also a trustee
of the Beneficial Trust Fund of PLDT.
He is the Chairman of Philstar Daily, Inc., and
Businessworld Publishing, Inc. He is the Vice
Chairman of First Agri Holdings, Inc. and First Coconut
Manufacturing, Inc. He was the President and CEO
of Mediaquest Holdings, Inc. and ABC Development
Corporation (TV5), and ePLDT,Inc.; and the Vice
Chairman of Philweb Corporation in previous years.
Prior to joining the PLDT Group in 2000, Atty. Espinosa
was a law partner at SyCip Salazar Hernandez &
Gatmaitan, the largest law firm in the Philippines,
until June 2000 and was a member of the firm’s
Executive Committee. He was a law lecturer at the
Ateneo de Manila School of Law from 1983 to 1985
and in 1989. Atty. Espinosa finished his Bachelor of
Laws degree at the Ateneo de Manila University,
graduating Salutatorian, and his Master of Laws degree
at the University of Michigan Law School. He took up
Bachelor of Science in Pre-Medicine at the University
of Santo Tomas. After finishing his Master of Laws
degree, he worked as a foreign associate in Covington
& Burling, the largest law firm in Washington, D.C., USA,
from September 1987 to August 1988. Atty. Espinosa
placed first in the Philippine Bar Examinations of 1982,
and was a Fellow of the University of Michigan Law
School’s Clyde Alton Dewitt Scholarship Foundation.
He is a member of the Integrated Bar of the
Philippines, Philippine Bar Association, and Inter-Pacific
Bar Association. He is also a member of the Executive
Committee of LAWASIA Energy Section. Asia Law &
Practice, Euromoney and The Asia Pacific Legal 500
named Atty. Espinosa as one of the leading capital
market lawyers, and among the leading project finance
lawyers, in the Philippines from 1996 to 2002.
aleX erlito s. FiDerDirector
Alex Erlito S. Fider is 64 years old and is a Filipino.
He was elected to the Board of Directors on
December 3, 2013. Atty. Fider graduated from the
University of the Philippines with degrees in Economics
and Law.
He was admitted to the Philippine Bar in 1985 and
undertook specialized courses in Strategic Economics
and Corporate Governance in the Philippines and
Australia, respectively.
His legal experience spans three decades of
involvement in corporate transactions and projects.
His legal work extends to an array of corporate
and financial matters to companies involved in
public infrastructure, water, and power utilities,
telecommunications, mass media, banking and finance,
real estate development, and agriculture.
He is a specialist in the various fields of commercial,
civil, telecommunications and public utilities law. Atty.
Fider is a Director and Corporate Secretary of several
Philippine corporations, including Metro Pacific Tollways
Corporation, Metro Pacific Tollways Development
Corporation, NLEX Corporation (formerly Manila
North Tollways Corporation), Tollways Management
Corporation, Smart Communications, Inc. and Maynilad
Water Services, Inc. He is actively involved in the
Financial Executives Institute of the Philippines (FINEX)
and Institute of Corporate Directors of which he is a
Fellow.

The RighT FundamenTals: SuStainability24
ANNUAL REPORT 2017 25
ChristoPher h. YoungDirector
Christopher H. Young is 60 years old and is a British
citizen. He was elected as a member of the Board of
Directors on May 13, 2015 and as a member of the
Audit & Risk Committee on August 19, 2015. He is
presently a member of the Audit Committee.
Mr. Young is an Executive Director and the Chief
Financial Officer of First Pacific Company Limited,
a Hong Kong based investment management and
holding company with operations in the Asia Pacific.
He is also a Director of Rocket Internet SE and FPM
Power Holdings Limited, and a member of the Advisory
Board of PLDT, Inc. (PLDT), a major operating associate
of First Pacific. He also serves as Commissioner of PT
Indofood Sukses Makmur Tbk and a Trustee of
IdeaSpace Foundation, Inc.
He most recently served as the Chief Financial
Advisor of PLDT. He worked as Senior Audit
Manager at PricewaterhouseCoopers in London
and Hong Kong from 1979 until 1987, at which time
he joined First Pacific in Hong Kong as Group
Financial Controller. He joined Metro Pacific
Corporation in 1995 as Finance Director, a position
he held until he joined PLDT in November 1998.
Mr Young joined First Pacific’s Board in August
2017.
osCar J. hilaDoDirector
Oscar J. Hilado is 80 years old and is a Filipino. He
has been a member of the Board of Directors since
May 11, 2016. He is the Chairman of the Corporate
Governance Committee and a member of the Audit
and Compensation Committees. He is the Chairman of
the Board of Philippine Investment Management, Inc.
(PHINMA); Phinma Corp.; Phinma Energy Corporation;
Phinma Property Holdings Corp.; and Union Galvasteel
Corporation.
Mr. Hilado is also the Vice Chairman of Trans Asia
Power Generation Corporation and Trans-Asia
Petroleum Corporation and the Chairman of the
Executive Committee of Phinma Corp.
He is a Director of A. Soriano Corporation; First
Philippine Holdings Corporation; Philex Mining
Corporation; United Pulp and Paper Co., Inc.;
Beacon Property Ventures, Inc.; Manila Cordage
Company; Smart Communications, Inc.; Digital
Telecommunications Philippines, Inc. (DIGITEL);
Pueblo de Oro Development Corporation; Seven Seas
Resorts and Leisure, Inc.; Asian Eye Institute; Rockwell
Land Corporation; Araullo University, Inc.; Cagayan de
Oro College, Inc.; University of Iloilo, Inc.; University
of Pangasinan, Inc.; Southwestern University; PEN
Holdings, Inc.; Microtel Inns & Suites (Pilipinas), Inc.;
and Trans Asia Renewable Energy Corporation.
Mr. Hilado is an Honorary Consul of Ecuador. He was
awarded the MAP Management Man of the Year in 1991.
He was a Smith Mundt/Fullbright scholar at the Harvard
Graduate School of Business where he obtained his
Master’s Degree in Business Administration in 1962.
He is a Certified Public Accountant (CPA) with a
Bachelor of Science in Commerce degree from the
De La Salle College in Bacolod in 1958. He earned his
Doctorate in Business Management, Honoris Causa,
from the De La Salle University in 1992 and in 2003,
attained his Doctorate of Law, Honoris Causa, from the
University of St. La Salle.
CYnthia l. Dela PaZCorporate Secretary
Cynthia L. Dela Paz is 55 years old and is a Filipino.
She has been the Corporate Secretary of the Group
since February 15, 2017.
Atty. Dela Paz is a senior partner at Picazo Buyco
Tan Fider & Santos. She has been in the practice of
corporate law and taxation for the last 27 years. She
has been a Director of Tax Management Association
of the Philippines (TMAP) for the last 10 years.
Atty. Dela Paz holds a law degree from the University
of the Philippines and graduated from the same
university with a degree in Psychology.
Board coMMIttees*ID- Independent Director
eXeCutiVe CoMMitteeChairman:
Mr. Pedro E. Roxas
Members:
Mr. Manuel V. Pangilinan
Mr. David L. Balangue (ID)
auDit CoMMitteeChairman: Mr. David L. Balangue (ID)
Members:
Mr. Christopher H. Young
Mr. Oscar J. Hilado
CoMPensation CoMMitteeChairman:
Mr. Manuel V. Pangilinan
Members:
Mr. Santiago R. Elizalde
Mr. Oscar J. Hilado
CorPorate goVernanCe CoMMitteeChairman:
Mr. Oscar J. Hilado
Members:
Mr. Pedro E. Roxas
Mr. David L. Balangue (ID)

The RighT FundamenTals: SuStainability26
ANNUAL REPORT 2017 27
Board of advIsors
ViCente s. PéreZ, Jr.Advisor
Vicente S. Pérez, Jr. is 59 years old and is a Filipino.
He was elected as a member of the Board of Advisors
on March 25, 2009. Mr. Pérez is an avid environment
advocate and renewable energy investor. He is CEO
of Alternergy, a wind and mini-hydro power developer,
and Chairman of Merritt Partners, an energy advisory
firm, and Chairman of Solar Pacific, an off-grid island
solar PV developer.
He has been an independent director of regional
companies in Australia, the Philippines and Singapore.
He is an independent director of ST Telemedia, the
Temasek holding company for telecom, data centers
and mobile technology, and is an Independent Board
Adviser of Banco de Oro, the Philippines’ largest
commercial bank. He is a member of the Advisory
Boards of Coca-Cola FEMSA Philippines, Geneva-
based Pictet Clean Energy Fund, and the Yale Center
for Business and Environment.
His philanthropy involvements are focused on the
environment. Mr. Pérez is chairman of the National
Advisory Council of WWF-Philippines and treasurer
of the WWF-International board, and a trustee or
adviser of the Asian Conservation Foundation, Bhutan
Foundation, Solar Energie Foundation and Solar Car
Challenge Foundation.
Mr. Pérez was Philippine Energy Minister from 2001 to
2005. He boosted energy self- sufficiency, promoted
clean indigenous energy, and crafted an ambitious
renewable policy framework. He served briefly in early
2001 as Deputy Minister for Trade and Industry.
Prior to 2001, Mr. Pérez had 17 years’ experience first
in Latin American debt restructuring at Mellon Bank in
Pittsburgh, and later in debt trading, capital markets,
and private equity in emerging countries at Lazard in
London, New York and Singapore. At 35, he became
General Partner at New York investment bank Lazard
Frères as head of its Emerging Markets Group. He was
Managing Director of Lazard Asia in Singapore from
1995 until 1997.
Mr. Pérez founded Next Century Partners in 1997,
a private equity firm based in Singapore. In 2000,
he founded Asian Conservation Company which
acquired El Nido Resorts, an award- winning eco-
tourism destination in Palawan. In 2006, he invested
in Northwind Power, the first commercial wind farm in
Southeast Asia.
He has consulted for the Asian Development Bank
(ADB), International Finance Corporation (IFC) and
numerous firms on renewable energy. With his various
involvements, the media has dubbed him as the
Philippine “renewable czar”.
Mr. Pérez obtained an MBA from the Wharton Business
School of the University of Pennsylvania in 1983 and
a Bachelor’s Degree in Business Economics from the
University of the Philippines in 1979. He was a 2005
World Fellow at Yale University, where he lectured an
MBA class on renewable power in emerging countries.
senen C. baCaniAdvisor
Senen C. Bacani is 72 years old and is a Filipino.
He was formerly a member of the Board of Directors
and was elected as a member of the Board of Advisors
on December 11, 2013. Mr. Bacani is the President of
Ultrex Management & Investments Corp.; Chairman
& President of La Frutera, Inc.; Chairman of Trully
Natural Food Corporation; a Director of Swift Foods,
Inc.; a Private Sector Representative of APEC Policy
Partnership on Food Security, ABAC Philippines;
Director of the Philippine Chamber of Agriculture
& Food, Inc.; Member of the Board of Advisors of
East-West Seed Philippines, Inc.; Director of Icebox
Logistics Services, Inc.; Director of Franklin Baker
Co. of the Philippines; and a Member of the National
Competitiveness Council.
He is also a Member of the Board of Trustees of the
Philippine Rice Research Institute, and the Vice-
Chairman of the Technical Advisory Committee of the
PCARRD (DOST). Mr. Bacani is also involved in various
non-government and people’s organizations.
He obtained his degree in Bachelor of Science in
Commerce at the De La Salle University, graduating
Summa Cum Laude and Class Valedictorian, and his
Masters in Business Administration at the University of
Hawaii, USA. He passed the CPA Board Exams in 1966.
corporate offIcers
PeDro e. roXasChairman
Manuel V. PangilinanVice Chairman
hubert D. tubioPresident & CEO
See page 20.
pROFiles pROFiles
The RHI Management Team led by PCEO Hubert D. Tubio (center) with EVP/CFO Celso T. Dimarucut (second from right), EVP/COO for Sugar Arcadio S. Lozada, Jr.
(second from left), EVP/COO for Ethanol Luis O. Villa-Abrille (first from right) and SVP for Commercial Operations George T. Cheung (first from left).

The RighT FundamenTals: SuStainability28
ANNUAL REPORT 2017 29
luis o. Villa-abrille Executive Vice President/Chief Operating OfficerEthanol Business Unit
FlorenCio M. MaMauag, Jr. Vice PresidentLegal and Corporate Affairs
Luis O. Villa-Abrille is 69 years old and is a Filipino.
He is currently the Executive Vice President and Chief
Operations Officer for RHI’s Bioethanol Business Unit.
He was appointed as President & COO of CACI on
March 9, 2015 and as President & COO of SCBI on May
11, 2015.
Mr. Villa-Abrille was formerly the President & COO of
Roxol, and the Executive Vice-President for Business
Florencio M. Mamauag, Jr. is 58 years old and is a
Filipino. He was the Assistant Corporate Secretary,
Vice President for Legal and Corporate Affairs,
Compliance Officer, and Corporate Information
Officer (CIO). He was also the Corporate Secretary
and VP-Legal of Central Azucarera Don Pedro, Inc.,
Central Azucarera de la Carlota, Inc., Roxol Bioenergy
Corporation, Najalin Agri-Ventures, Inc., San Carlos
Bioenergy Inc., RHI Agribusiness Development
Corporation and the other subsidiaries of the
company.
Atty. Mamauag worked as an Associate Counsel in
private law offices and as a State Corporate Attorney
Development of the company. He was also formerly
the Vice-President & Resident Manager of Green
Future Innovations, Inc., the President & COO of
SCBI, and the Director for Operations of Bronzeoak
Philippines, Inc., among others.
He obtained his BS Mechanical Engineering degree
at the University of Sto. Tomas and is a licensed
Mechanical Engineer.
at the Department of Justice, Office of the Government
Corporate Counsel, before joining the company on
September 2, 1996. He also worked as an Associate
Auditor at the Sycip, Gorres, Velayo & Co. (SGV), the
country’s leading auditing and accounting firm.
He obtained his Bachelor of Laws degree at the San
Beda College in Manila. Atty. Mamauag is a CPA-
Lawyer, a bar placer, a Professor of Law, and a Bar
Reviewer in Labor Law at the College of Law of San
Beda College in Manila.
*Atty. Mamauag retired from the Company on
December 31, 2017.
george t. Cheung Senior Vice President Commercial Operations
George T. Cheung is 44 years old and is a Filipino.
He was appointed as Senior Vice President for
Marketing & Trading, which was later renamed
Commercial Operations, on January 5, 2015.
He has over 20 years of experience in the field of
agricultural and energy commodities, specializing
in sugar, fuel ethanol and thermal coal. He has
held senior commercial, general management and
business development roles in the Philippines, Hong
Kong, Taiwan and Mainland China for leading global
commodities companies like Cargill, ED&F Man,
Sucden, Wilmar and Trafigura, among others.He was
formerly a Managing Partner in Commodity Partners
Pte, Ltd., Head of Domestic Coal Trading of Trafigura
Investment China, Ltd., based in Shanghai, Associate
Director & General Manager-Sugar Division of Wilmar
Sugar Pte. Ltd/Yihai Commercial Eagle Trading,
General Manager at the Greater China Region of ED&F
Man, a global supplier of sugar, and a Trading Manager
of the Sugar Division in Hong Kong of Cargill.
Mr. Cheung obtained his MBA from Duke University
in Durham, North Carolina, USA and has Bachelors
in Agricultural Sciences degree from the University
of British Columbia, major in Food Science and
Agricultural Economics.
arCaDio s. loZaDa, Jr. Executive Vice President/Chief Operating OfficerSugar Business Unit
Arcadio S. Lozada, Jr. is 63 years old and is a Filipino.
He is currently the Executive Vice President and Chief
Operations Officer for RHI’s Sugar Business Unit.
He was appointed as Executive Vice-President and
Group Head for Operations of the company, and as
President & COO of CADPI on January 1, 2014. He
was formerly the Vice-President for Manufacturing of
Victorias Milling Company, Inc., a Technical Manager
of Bronzeoak Philippines, Inc., and an Engineering
Manager at the Central Azucarera de Tarlac, among
others.
Mr. Lozada is a licensed Mechanical Engineer and has
completed a short course in raw sugar manufacturing
at the Nicholls State University in Louisiana, USA.
Celso t. DiMaruCut Executive Vice President/Chief Financial Officer
Celso T. Dimarucut is 56 years old and is a Filipino.
He was appointed as EVP-CFO and Group Head of
Finance effective December 1, 2015.
Prior to joining the company, Mr. Dimarucut served
as Senior Executive Vice President and Chief
Finance Officer of Landco Pacific Corporation and its
subsidiaries; Senior Vice President and Group Chief
Finance Officer of Mediaquest Holdings, Inc. and its
subsidiaries; Senior Vice President and Group Chief
Finance Officer of ePLDT, Inc. and Subsidiaries; First
Vice President and Group Controller of PLDT Group;
First Vice-President and Group Financial Controller
for domestic subsidiaries of Metropolitan Bank & Trust
Company; and Finance Head of Pilipino Telephone
Corporation (Piltel), and later, as Comptroller of
Philippine Long Distance Telephone Company after
Piltel’s integration to Smart Communications, Inc. where
he managed the overall financial reporting functions of
the PLDT Group.
Mr Dimarucut has more than 10 years of professional
audit and business advisory experience gained from
SyCip, Gorres Velayo & Co. and Prasetio Utomo & Co.
(Jakarta, Indonesia). He graduated Cum Laude at the
Polytechnic University of the Philippines with a degree
of BS Commerce Major in Accounting. He is a Certified
Public Accountant.
FreDeriCk e. reYes Vice PresidentHuman Resources
Frederick E. Reyes is 56 years old and is a Filipino. He
is the Vice President for Human Resources. He was
appointed as Assistant Vice President and Deputy
Head of Human Resources on February 1, 2014
and was promoted to VP & Deputy Head of Human
Resources on January 5, 2015.
Mr. Reyes was formerly the Director for Human
Resources Services of Manila Water Company, Inc.
He has a 29-year experience in HR Operations having
been in Vitarich in charge of Training, QC & Employee
Relations. He joined Globe Telecom during its transition
to become a “wireless” telephone company in charge
of Training and Development from 1990 thru 1997, and
also in Manila Water during its “privatization” years
in 1997 thru 2012. Mr. Reyes obtained his degree in
Industrial Engineering from the University of Sto. Tomas
and is a licensed Industrial Engineer.

The RighT FundamenTals: SuStainability30
ANNUAL REPORT 2017 31
esteban h. CosColluela Vice President/General ManagerCentral Azucarera de la Carlota, Inc.
Esteban H. Coscolluela is 65 years old and is a Filipino.
He was appointed as Vice President/General Manager
for Central Azucarera de la Carlota, Inc. on 11 May 2016.
He was a former Director and Executive Committee
Chairman of PNOC Coal Corporation. He was also a
former VP at Union Bank.
He occupied various leadership roles in planters’
associations, farmers’ cooperatives, and the Chamber
of Commerce and Industry, in Negros Occidental.
Mr. Coscolluela also served as Mayor of Murcia in
Negros Occidental. He graduated with a degree in BS
Management at the University of St. La Salle. He is an
MBA Graduate at the Asian Institute of Management.
FernanDo h. CorPuZVice President/General ManagerCentral Azucarera Don Pedro, Inc.
Fernando H. Corpuz is 62 years old and is a Filipino.
He was appointed as Vice President/General Manager
for Central Azucarera Don Pedro, Inc. on May 11, 2016.
He was formerly with the Sugar Regulatory
Administration, where he worked as Head for
Research, Development and Extension Office; Head
for Industrial Research and Development; and Manager
for Factory Operations Department.
He was also the Resident Comptroller at the Republic
Sugar Development Corporation. He graduated with a
degree in BS Sugar Technology at the University of the
Philippines Los Baños.
earl eriC nestor h. FerrerVice PresidentInformation Communications Technology
Earl Eric Nestor H. Ferrer is 49 years old and is a
Filipino. He was appointed as VP-ICT effective April 17,
2017. He graduated from De La Salle University with a
degree in B.A. Computer Science, Major in Information
Technology.
He was formerly Vice President for Global IT of
International Container Terminal Services, Inc. (ICTSI),
where he managed the IT operations of ICTSI ports
in 29 locations. His past roles included working as
National IT Manager of DHL Express Corporation, IT
Director of SGV & Co., and IT Head of Rockwell Land
Corporation, Air 21, and James Martin & Company.
*Mr. Ferrer resigned from RHI on January 10, 2018.
kathrina estrella l. sebastian Assistant Vice President, TreasuryChief Risk Officer & Chief Credit Officer
Kathrina Estrella L. Sebastian is 43 years old and
is a Filipino. She was appointed as Assistant Vice
President - Head of Treasury and Chief Risk Officer
and Chief Credit Officer on December 16, 2015.
Ms. Sebastian was previously the Head of
Development Organizations and the Relationship
Manager/Associate Director of Financial Institutions
of Standard Chartered Bank. She also worked for
Citibank, N.A. and G & S Transport Corporation. Ms.
Sebastian obtained her degree in Bachelor of Science
in Management at the Ateneo De Manila University and
her MBA in International Business at the Manchester
Business School, United Kingdom.
VeroniCa C. CorteZ Assistant Vice PresidentFinance
Veronica C. Cortez is 38 years old and is a Filipino. She
was appointed Assistant Vice President of Finance on
February 10, 2016. She has over 10 years of experience
in external auditing. She worked with SyCip Gorres
Velayo & Co. (SGV) as Senior Director from September
2009 to 2015.
She started her career with SGV as an Associate
and moved to become Senior Associate, Associate
Director and then Director. She also worked as a
Senior Associate in the Resource Sharing Program of
Ernst & Young Houston, Texas Office.
Ms. Cortez graduated with a degree in BS
Accountancy from San Sebastian College Recoletos de
Cavite and is a Certified Public Accountant.
DaisY PerPetua a. boAssistant Vice PresidentQuality Assurance/Environmental Management System/Industrial Engineering
Daisy Perpetua A. Bo is 54 years old and is a Filipino.
She was appointed as Assistant Vice President for QA/
Safety/EMS/IE on May 11, 2016.
Ms. Bo was formerly a QA Manager at Alaska Milk
Corporation. She also worked previously at Coca
Cola Export Corporation as Area Quality Manager for
the Visayas and Mega Manila and as Concentrate
Plant QA Manager. She was also a former Product
Support Business Team Leader at Avon Products
Manufacturing.
She graduated with a degree in BS Chemistry from the
University of Santo Tomas, and took some MBA units
at the De La Salle University. She is a licensed chemist
since 1987.

The RighT FundamenTals: SuStainability32
ANNUAL REPORT 2017 33
Ma. haZel l. rabara-retarDoAssistant Corporate SecretaryAssistant Vice President, Corporate GovernanceDeputy Compliance Officer
Jose roJo g. alislaVice President/General Manager RHI Agribusiness Development Corporation
Paul eDwin V. laZaroAssistant Vice PresidentInternal Audit
Ma. Hazel L. Rabara-Retardo is 37 years old and is a
Filipino. She was appointed as Assistant Vice President
for Corporate Governance and Deputy Compliance
Officer on September 20, 2016.
Prior to joining RHI, Atty. Rabara was Vice President -
Legal & Administrative Affairs/Corporate Secretary of
Advanced Merchant Payments Lending Corporation,
an affiliate of Amplifi Capital (HK) Ltd. and AMP Credit
Technologies Ltd. She also worked as Court
Jose Rojo G. Alisla is 53 years old and is a Filipino. He was appointed as Vice
President/General Manager of RHI Agribusiness Development Corporation on
March 15, 2017. He joined the company on January 5, 2015 as VP for
Agri-Industrial Research & Development and Farm Operations on January 5,
2015.
Mr. Alisla was formerly the Construction Services Manager of PICOP, Project
Development Officer on Agriculture, R&D, and Environment at the Provincial
Government of Negros Occidental and the Office of the Presidential Adviser
for Visayas, and Chief of Staff to the Sugar Regulatory Administrator before
he joined the company. He obtained his Bachelor of Science degree in Civil
Engineering at the University of the Philippines and his MBA at the University of
St. La Salle University in Bacolod City.
*Mr. Alisla resigned from RHI on October 15, 2017.
Paul Edwin V. Lazaro is 38 years old and is a Filipino. He was appointed as
Assistant Vice President for Internal Audit on January 5, 2015.
Mr. Lazaro was formerly Internal Audit Group Head of Convergys Philippines
and Senior Manager for Controls Assurance in the same company. He also
worked with Philip Morris Philippines and Ford Motors and also became the
Regional Auditor for World CAT (PUMA). He obtained his Bachelor of Science
in Accountancy at the University of Sto. Tomas and his MBA at the Ateneo
Graduate School of Business.
*Mr. Lazaro resigned from RHI on November 1, 2017.
Attorney V at the Office of the Presiding Justice Acosta
of the Court of Tax Appeals. Atty. Rabara also worked
as an associate in the Tan Venturanza Valdez Law
Office where she was assigned as Corporate Secretary
of various private and publicly-listed companies.
She obtained her Bachelor of Laws degree and
Bachelor of Arts Major in Political Science degree at
the University of the Philippines in Diliman, Quezon
City.
tiMothY t. bennettPresidentHawaiian-Philippine Company
Timothy T. Bennett is 66 years old and is an American.
He is the President and General Manager of RHI’s
sugar affiliate, Hawaiian-Philippine Company (HPCo) in
Silay, Negros Occidental since 2003.
He was previously Senior Vice President and Director,
and Head of Sugar Divisions of Jardine Davies,
Inc. where he managed the company’s three sugar
operating units: HPCo, Bogo Medelin Milling Co., Inc.,
and HPCo Agridev Corporation.
He also held various roles at the Hamakua Sugar Co.,
Theo Davies Hamakua Sugar Co., and Laupahoehoe
Sugar Co. He is the President of the Philippine Sugar
Research Institute, Inc. since 2015 and is a Member of
the Board of Trustees of the Philippine Sugar Millers
Association, Inc. since 1989. Mr. Bennett graduated with
a Bachelors Degree in Business Administration at the
Colorado College in Colorado, USA.
INDEPENDENT AUDITOR’S REPORT
The Board of Directors and StockholdersRoxas Holdings, Inc.
Opinion
We have audited the consolidated financial statements of Roxas Holdings, Inc. and its subsidiaries (the Group), which comprise the consolidated statement of financial position as atSeptember 30, 2017, and the consolidated statement of income, consolidated statement of comprehensive income, consolidated statement of changes in equity and consolidated statement ofcash flows for the year then ended, and notes to the consolidated financial statements, including a summary of significant accounting policies.
In our opinion, the accompanying consolidated financial statements present fairly, in all material respects, the consolidated financial position of the Group as at September 30, 2017, and itsconsolidated financial performance and its consolidated cash flows for the year then ended in accordance with Philippine Financial Reporting Standards (PFRSs).
Basis for Opinion
We conducted our audit in accordance with Philippine Standards on Auditing (PSAs). Our responsibilities under those standards are further described in the Auditor’s Responsibilities for the Auditof the Consolidated Financial Statements section of our report. We are independent of the Group in accordance with the Code of Ethics for Professional Accountants in the Philippines (Code ofEthics) together with the ethical requirements that are relevant to our audit of the consolidated financial statements in the Philippines, and we have fulfilled our other ethical responsibilities inaccordance with these requirements and the Code of Ethics. We believe that the audit evidence we have obtained is sufficient and appropriate to provide a basis for our opinion.
Other Matter
The consolidated financial statements of the Group as at September 30, 2016 and for the years ended September 30, 2016 and 2015, were audited by another auditor who expressed anunmodified opinion on those statements on December 1, 2016.
Key Audit Matters
Key audit matters are those matters that, in our professional judgment, were of most significance in our audit of the consolidated financial statements of the current period. These matters wereaddressed in the context of our audit of the consolidated financial statements as a whole, and in forming our opinion thereon, and we do not provide a separate opinion on these matters. Foreach matter below, our description of how our audit addressed the matter is provided in that context.
We have fulfilled the responsibilities described in the Auditor’s Responsibilities for the Audit of the Consolidated Financial Statements section of our report, including in relation to these matters.Accordingly, our audit included the performance of procedures designed to respond to our assessment of the risks of material misstatement of the consolidated financial statements. The resultsof our audit procedures, including the procedures performed to address the matters below, provide the basis for our audit opinion on the accompanying consolidated financial statements.
Accounting for Completeness of Quedan
The Group’s raw sugar business follows the quedan system, which is unique to the Philippine sugar industry. A quedan is a negotiable instrument which shows ownership of a specified amount ofraw sugar in a warehouse or sugar central. It is a negotiable instrument in the sugar industry. Accordingly, the Group’s physical possession or delivery of raw sugar may not necessarily indicateownership, or sales or purchase transaction, respectively. We considered accounting for quedan as a key audit matter due to the volume of the transactions covered by this unique system, whichimpacts sales and inventory which are material and significant to the consolidated financial statements.
The disclosures about quedan accounting are included in Notes 9 and 28 to the consolidated financial statements.
Audit Response
With the involvement of our internal specialist, we obtained an understanding of the Group’s quedanning system and tested the relevant controls on the information system and manualprocesses. We observed the inventory count procedures of the Group to establish the physical existence of raw sugar as of count date and reviewed the rollforward procedures to arrive at thephysical quantity as of reporting date. We reviewed the reconciliation of the physical quantity and quedan accountability report to test the quantity reported, which are supported by quedans, asthe Group’s inventory and those which are held in trust for the planters and traders.
Impairment Testing of Goodwill
Under PFRSs, the Group is required to test the goodwill annually or more frequently if events or changes in circumstances indicate that the carrying value may be impaired. As at September 30,2017, the Group’s goodwill that is attributable to its investment in San Carlos Bioenergy, Inc., the cash generating unit (CGU), amounted to P=1.08 billion, which is considered significant to theconsolidated financial statements. In addition, management’s assessment process requires estimation of value-in-use based on the expected future cash flows of the CGU. Such processinvolves significant management judgment about future market conditions and estimation based on assumptions, such as forecasted bioethanol price, forecasted sales volume, expected grossprofit, operating expenses and discount rate.
The disclosures about goodwill are included in Notes 5 and 6 to the consolidated financial statements.
Audit Response
We involved our internal specialist in evaluating the methodology and the discount rate used. We evaluated management’s key assumptions used in preparing the cash flow forecast such asforecasted bioethanol price, forecasted sales volume, and expected gross profit by comparing them against the CGU’s historical performance and current industry outlook.
We obtained and evaluated management’s sensitivity analyses to ascertain the impact of reasonably possible changes in key assumptions and we performed our own independent sensitivitycalculations to quantify the downside changes to management’s models required to result in impairment. We also reviewed the Group’s disclosures about those assumptions to which theoutcome of the impairment test is most sensitive; specifically those that have the most significant effect on the determination of the recoverable amount of goodwill.
The RighT FundamenTals: SuStainability34
ANNUAL REPORT 2017 35
∂ Evaluate the appropriateness of accounting policies used and the reasonableness of accounting estimates and related disclosures made by management.
∂ Conclude on the appropriateness of management’s use of the going concern basis of accounting and, based on the audit evidence obtained, whether a material uncertainty exists relatedto events or conditions that may cast significant doubt on the Group’s ability to continue as a going concern. If we conclude that a material uncertainty exists, we are required to drawattention in our auditor’s report to the related disclosures in the consolidated financial statements or, if such disclosures are inadequate, to modify our opinion. Our conclusions are basedon the audit evidence obtained up to the date of our auditor’s report. However, future events or conditions may cause the Group to cease to continue as a going concern.
∂ Evaluate the overall presentation, structure and content of the consolidated financial statements, including the disclosures, and whether the consolidated financial statements representthe underlying transactions and events in a manner that achieves fair presentation.
∂ Obtain sufficient appropriate audit evidence regarding the financial information of the entities or business activities within the Group to express an opinion on the consolidated financialstatements. We are responsible for the direction, supervision and performance of the audit. We remain solely responsible for our audit opinion.
We communicate with those charged with governance regarding, among other matters, the planned scope and timing of the audit and significant audit findings, including any significantdeficiencies in internal control that we identify during our audit.
We also provide those charged with governance with a statement that we have complied with relevant ethical requirements regarding independence, and to communicate with them allrelationships and other matters that may reasonably be thought to bear on our independence, and where applicable, related safeguards.
From the matters communicated with those charged with governance, we determine those matters that were of most significance in the audit of the consolidated financial statements of thecurrent period and are therefore the key audit matters. We describe these matters in our auditor’s report unless law or regulation precludes public disclosure about the matter or when, inextremely rare circumstances, we determine that a matter should not be communicated in our report because the adverse consequences of doing so would reasonably be expected to outweighthe public interest benefits of such communication.
The engagement partner on the audit resulting in this independent auditor’s report is Aileen L. Saringan.
SYCIP GORRES VELAYO & CO.
Aileen L. SaringanPartnerCPA Certificate No. 72557SEC Accreditation No. 0096-AR-4 (Group A), August 18, 2016, valid until August 18, 2019Tax Identification No. 102-089-397BIR Accreditation No. 08-001998-58-2015 February 27, 2015, valid until February 26, 2018PTR No. 5908758, January 3, 2017, Makati City
December 6, 2017
Valuation of Land Stated at Fair Value
The Group carries its parcels of land, which are accounted for as property, plant and equipment at revaluation method and investment properties at fair value method in its consolidated financialstatements as of reporting date. As of September 30, 2017, the carrying value of land amounted to P=5.09 billion, representing 20% of the Group’s consolidated assets. Management obtains theservices of external appraisers to determine the land values whose calculations involve certain assumptions such as sales prices of similar properties and adjustments to sales price based oninternal and external factors. In addition, this requires significant management judgment and estimates. Thus, we considered this as key audit matter.
The disclosures relating to these parcels of land are included in Notes 12 and 13 to the consolidated financial statements.
Audit Response
We compared the property-related data in the appraisal reports against the Group’s records. We involved our internal specialist in reviewing the scope, methodology and the assumptions usedby the Group’s external appraisers. We evaluated the competence, capabilities and qualifications of the external appraisers by considering their qualifications, experience and reportingresponsibilities. We compared the assumptions used, specifically the sales price of comparable properties, against relevant external information. We also discussed with the external appraisersthe nature and magnitude of the adjustment factors.
Assessment of Contingent Liabilities and Estimation of Provisions from Claims
The Group is involved in certain claims by regulatory bodies and other parties. The inherent uncertainty over the outcome of these claims is brought about by the difference in the interpretationsand implementation of the relevant regulations. The assessment of whether the provision should be recognized and the estimation of the potential liability resulting from these assessmentsrequire significant judgment by management. As of September 30, 2017, total provisions recognized by the Group amounted to P=96.6 million.
The disclosures on management judgment on assessment of contingent liabilities and estimation of provisions and amounts recognized are included in Notes 5, 16 and 28, respectively, to theconsolidated financial statements.
Audit Response
We inquired of the Group’s legal counsels and management about the status and potential exposures of the significant claims and obtained representation from the Group management. We alsoinspected relevant correspondences with the regulatory bodies and other relevant parties, and reviewed the minutes of meetings of the Board of Directors and Audit Committee. We involved ourinternal specialist in the evaluation of management’s assessment on whether provision should be recognized and the estimation of such amount.
Accounting for investment in Hawaiian-Philippine Company (HP Co.)
The Company has a 45% investment in HP Co., an associate, with carrying value of P=606.8 million as of September 30, 2017. The investment is accounted for using the equity method. Weconsider the accounting for this investment as a key audit matter because it contributed P=67.8 million to the consolidated net income. HP Co. also operates in the sugar industry business; thus issubject to the same risks as the Group.
The disclosures on the investment in HP Co., are included in Note 11 to the consolidated financial statements.
Audit Response
We sent instructions to the statutory auditors of HP Co. to perform an audit on the relevant financial information of HP Co. for the purpose of the Group’s consolidated financial statements. Theinstructions contained a discussion on their scope of work, risk assessment procedures, audit strategy and reporting requirements. We performed procedures to assess HP Co. statutory auditors’competence. We discussed with HP Co. statutory auditors about their key audit areas, planning and execution of audit procedures, significant areas of estimation and judgment, and results oftheir work for the year ended September 30, 2017. We reviewed the working papers of the statutory auditor of HP Co., focusing on the procedures performed on quedan accounting. We alsoobtained the financial information of HP Co. as of and for the year ended September 30, 2017 and recomputed the Group’s share in net income for the year ended September 30, 2017.
Other Information
Management is responsible for the other information. The other information comprises the information included in the SEC Form 20-IS (Definitive Information Statement), SEC Form 17-A andAnnual Report for the year ended September 30, 2017, but does not include the consolidated financial statements and our auditor’s report thereon. The SEC Form 20-IS (Definitive InformationStatement), SEC Form 17-A and Annual Report for the year ended September 30, 2017 are expected to be made available to us after the date of this auditor’s report.
Our opinion on the consolidated financial statements does not cover the other information and we will not express any form of assurance conclusion thereon.
In connection with our audit of the consolidated financial statements, our responsibility is to read the other information identified above when it becomes available and, in doing so, considerwhether the other information is materially inconsistent with the consolidated financial statements or our knowledge obtained in the audit, or otherwise appears to be materially misstated.
Responsibilities of Management and Those Charged with Governance for the Consolidated Financial Statements
Management is responsible for the preparation and fair presentation of the consolidated financial statements in accordance with PFRSs, and for such internal control as management determinesis necessary to enable the preparation of consolidated financial statements that are free from material misstatement, whether due to fraud or error.
In preparing the consolidated financial statements, management is responsible for assessing the Group’s ability to continue as a going concern, disclosing, as applicable, matters related to goingconcern and using the going concern basis of accounting unless management either intends to liquidate the Group or to cease operations, or has no realistic alternative but to do so.
Those charged with governance are responsible for overseeing the Group’s financial reporting process.
Auditor’s Responsibilities for the Audit of the Consolidated Financial Statements
Our objectives are to obtain reasonable assurance about whether the consolidated financial statements as a whole are free from material misstatement, whether due to fraud or error, and toissue an auditor’s report that includes our opinion. Reasonable assurance is a high level of assurance, but is not a guarantee that an audit conducted in accordance with PSAs will always detect amaterial misstatement when it exists. Misstatements can arise from fraud or error and are considered material if, individually or in the aggregate, they could reasonably be expected to influencethe economic decisions of users taken on the basis of these consolidated financial statements.
As part of an audit in accordance with PSAs, we exercise professional judgment and maintain professional skepticism throughout the audit. We also:
∂ Identify and assess the risks of material misstatement of the consolidated financial statements, whether due to fraud or error, design and perform audit procedures responsive to thoserisks, and obtain audit evidence that is sufficient and appropriate to provide a basis for our opinion. The risk of not detecting a material misstatement resulting from fraud is higher thanfor one resulting from error, as fraud may involve collusion, forgery, intentional omissions, misrepresentations, or the override of internal control.
∂ Obtain an understanding of internal control relevant to the audit in order to design audit procedures that are appropriate in the circumstances, but not for the purpose of expressing anopinion on the effectiveness of the Group’s internal control.

The RighT FundamenTals: SuStainability36
ANNUAL REPORT 2017 37
ROXAS HOLDINGS, INC. AND SUBSIDIARIES
CONSOLIDATED STATEMENTS OF INCOMEFOR THE YEAR ENDED SEPTEMBER 30, 2017
(WITH COMPARATIVE FIGURES FOR THE YEARS ENDED SEPTEMBER 30, 2016 AND 2015)(Amounts in Thousands, except Basic and Diluted Earnings per Share)
Years Ended September 30Note 2017 2016 2015
REVENUE 21Sale of goods P=10,666,777 P=11,764,540 P=7,815,439Sale of services 280,756 285,694 392,957
10,947,533 12,050,234 8,208,396
COST OF SALES 22 (9,490,646) (10,976,738) (7,164,185)
GROSS INCOME 1,456,887 1,073,496 1,044,211
GENERAL AND ADMINISTRATIVE EXPENSES 23 (1,007,948) (896,199) (1,000,955)
SELLING EXPENSES 23 (57,858) (69,440) (62,983)
INTEREST EXPENSE 14, 15 (444,257) (382,770) (271,355)
SHARE IN NET EARNINGS OF AN ASSOCIATE 11 67,777 212,258 134,424
OTHER INCOME 25 93,795 89,505 84,360
INCOME (LOSS) BEFORE INCOME TAX 108,396 26,850 (72,298)
INCOME TAX BENEFIT (EXPENSE) 26Current (34,775) (23,051) (82,068)Deferred 46,419 97,792 172,919
11,644 74,741 90,851
NET INCOME P=120,040 P=101,591 P=18,553
NET INCOME ATTRIBUTABLE TO:Equity holders of the Parent Company P=119,777 P=101,244 P=10,832Non-controlling interests 263 347 7,721
P=120,040 P=101,591 P=18,553
EARNINGS PER SHARE ATTRIBUTABLE TO EQUITY HOLDERSOF THE PARENT COMPANY 27
Basic P=0.08 P=0.07 P=0.01Diluted 0.08 0.07 0.01
See accompanying Notes to Consolidated Financial Statements.
ROXAS HOLDINGS, INC. AND SUBSIDIARIES
CONSOLIDATED STATEMENT OF FINANCIAL POSITIONAS AT SEPTEMBER 30, 2017
(WITH COMPARATIVE FIGURES AS AT SEPTEMBER 30, 2016)(Amounts in Thousands)
September 30
Note 2017 2016
ASSETS
Current AssetsCash and cash equivalents 7 P=571,377 P=704,522Trade and other receivables 8 2,258,083 1,331,026Inventories 9 2,539,526 1,601,818Other current assets 10 829,203 846,985 Total Current Assets 6,198,189 4,484,351
Noncurrent AssetsInvestment in an associate 11 606,768 648,868Property, plant and equipment: 12 At cost 10,303,421 10,331,821 At revalued amount 4,746,047 4,379,780Investment properties 13 349,267 320,812Goodwill 6 1,079,615 1,079,615Retirement assets - net 17 62,129 106,835Deferred tax assets 26 270,839 253,037Other noncurrent assets 10 279,898 52,905 Total Noncurrent Assets 17,697,984 17,173,673
P=23,896,173 P=21,658,024
LIABILITIES AND EQUITY
Current LiabilitiesShort-term borrowings 14 P=4,608,359 P=2,914,339Current portion of long-term borrowings 15 1,234,803 379,954Trade and other payables 16 1,188,567 1,071,901Income tax payable 1,605 1,751 Total Current Liabilities 7,033,334 4,367,945
Noncurrent LiabilitiesLong-term borrowings - net of current portion 15 4,820,532 6,055,566Retirement liabilities – net 17 316,758 327,952Deferred tax liabilities 26 1,180,141 1,131,642Other noncurrent liabilities 6 1,300 1,300 Total Noncurrent Liabilities 6,318,731 7,516,460 Total Liabilities 13,352,065 11,884,405
Equity Attributable to the Equity Holders of the Parent CompanyCapital stock 18 1,564,599 1,439,442Additional paid-in capital 2,826,554 2,425,550Treasury stock 18 (52,290) (52,290)Other equity items and reserves 18 3,419,147 3,281,436Retained earnings 2,733,738 2,613,961
10,491,748 9,708,099
Non-controlling Interests 52,360 65,520 Total Equity 10,544,108 9,773,619
P=23,896,173 P=21,658,024
See accompanying Notes to Consolidated Financial Statements.

The RighT FundamenTals: SuStainability38
ANNUAL REPORT 2017 39
ROXAS HOLDINGS, INC. AND SUBSIDIARIES
CONSOLIDATED STATEMENTS OF CHANGES IN EQUITYFOR THE YEAR ENDED SEPTEMBER 30, 2017
(WITH COMPARATIVE FIGURES FOR THE YEARS ENDED SEPTEMBER 30, 2016 AND 2015)(Amounts in Thousands)
Equity Attributable to the Equity Holders of the Parent Company
NoteCapital Stock
(Note 18)Additional
Paid-in CapitalTreasury Stock
(Note 18)
Other EquityItems andReserves(Note 18)
RetainedEarnings Total
Non-controllingInterests Total Equity
Balances as at September 30, 2016 P=1,439,442 P=2,425,550 (P=52,290) P=3,281,436 P=2,613,961 P=9,708,099 P=65,520 P=9,773,619Net income – – – – 119,777 119,777 263 120,040Appraisal increase on land, net of tax 18 – – – 114,842 – 114,842 1,719 116,561Remeasurement gain on retirement assets
and liabilities, net of tax 17 – – – 22,830 – 22,830 46 22,876Share in remeasurement gain on retirement liability
of an associate, net of tax 11 – – – 39 – 39 – 39Total comprehensive income – – – 137,711 119,777 257,488 2,028 259,516Issuances of shares from conversion
of debt securities 18 125,000 398,750 – – – 523,750 – 523,750Acquisition of non-controlling interest – – – – – – (15,188) (15,188)Employee stock option 20 – 2,020 – – – 2,020 – 2,020Exercise of employee stock option 20 157 234 – – – 391 – 391Balances as at September 30, 2017 P=1,564,599 P=2,826,554 (P=52,290) P=3,419,147 P=2,733,738 P=10,491,748 P=52,360 P=10,544,108
Balances as at September 30, 2015 P=1,169,289 P=1,573,993 (P=52,290) P=3,145,022 P=2,515,315 P=8,351,329 P=81,371 P=8,432,700Net income – – – – 101,244 101,244 347 101,591Appraisal increase on land, net of tax 18 – – – 181,462 – 181,462 – 181,462Remeasurement gain (loss) on retirement assetsand liabilities, net of tax 17 – – – (42,018) – (42,018) 204 (41,814)
Share in remeasurement loss on retirement liabilityof an associate, net of tax 11 – – – (3,030) – (3,030) – (3,030)
Total comprehensive income – – – 136,414 101,244 237,658 551 238,209Issuances of shares from stock rights offering,
net of transaction costs 18 266,754 846,544 – – – 1,113,298 – 1,113,298Acquisition of non-controlling interest 4 – – – – (2,598) (2,598) (16,402) (19,000)Exercise of employee stock option 20 3,399 3,573 – – – 6,972 – 6,972Employee stock option 20 – 1,440 – – – 1,440 – 1,440Balances as at September 30, 2016 P=1,439,442 P=2,425,550 (P=52,290) P=3,281,436 P=2,613,961 P=9,708,099 P=65,520 P=9,773,619
Balances as at September 30, 2014 P=1,168,976 P=574,913 (P=768,860) P=3,162,299 P=2,751,827 P=6,889,155 P=38,696 P=6,927,851Net income – – – – 10,832 10,832 7,721 18,553Remeasurement loss on retirement assets
and liabilities, net of tax 18 – – – (17,277) – (17,277) – (17,277)Total comprehensive income – – – (17,277) 10,832 (6,445) 7,721 1,276Issuances of treasury stock, net of transaction costs 18 – 963,561 716,570 – – 1,680,131 – 1,680,131Cash dividends 18 – – – – (247,344) (247,344) – (247,344)Acquisition of non-controlling interest 18 – – – – – – 34,954 34,954Employee stock option 20 – 35,053 – – – 35,053 – 35,053Exercise of employee stock option 20 313 466 – – – 779 – 779Balances as at September 30, 2015 P=1,169,289 P=1,573,993 (P=52,290) P=3,145,022 P=2,515,315 P=8,351,329 P=81,371 P=8,432,700
See accompanying Notes to Consolidated Financial Statements.
ROXAS HOLDINGS, INC. AND SUBSIDIARIES
CONSOLIDATED STATEMENTS OF COMPREHENSIVE INCOMEFOR THE YEAR ENDED SEPTEMBER 30, 2017
(WITH COMPARATIVE FIGURES FOR THE YEARS ENDED SEPTEMBER 30, 2016 AND 2015)(Amounts in Thousands)
Years Ended September 30Note 2017 2016 2015
NET INCOME P=120,040 P=101,591 P=18,553
OTHER COMPREHENSIVE INCOME (LOSS) 18Items not to be reclassified to profit or lossAppraisal increase on land, net of tax 12 116,561 181,462 –Remeasurement gain (loss) on retirement assets and liabilities, net of tax 17 22,876 (41,814) (17,277)Share in remeasurement gain (loss) on retirement liability of an associate, net of tax 11 39 (3,030) –
TOTAL COMPREHENSIVE INCOME P=259,516 P=238,209 P=1,276
TOTAL COMPREHENSIVE INCOME (LOSS) ATTRIBUTABLE TO:Equity holders of the Parent Company P=257,488 P=237,658 (P=6,445)Non-controlling interests 2,028 551 7,721
P=259,516 P=238,209 P=1,276
See accompanying Notes to Consolidated Financial Statements.

The RighT FundamenTals: SuStainability40
ANNUAL REPORT 2017 41
ROXAS HOLDINGS, INC. AND SUBSIDIARIES
NOTES TO CONSOLIDATED FINANCIAL STATEMENTS
1. Corporate Information
Roxas Holdings, Inc. (RHI or the Parent Company), doing business under the name and style of CADP Group, was organized in the Philippines and registered with the Philippine Securitiesand Exchange Commission (SEC) on October 30, 1930 for the purpose of operating mill and refinery facilities to manufacture sugar and allied products. The corporate life of the ParentCompany was extended on May 6, 2016 for another 50 years until November 1, 2030.
In July 1996, the Parent Company offered its shares to the public through an initial public offering. On August 8, 1996, the shares of stock of the Parent Company were listed in the PhilippineStock Exchange (PSE).
As at September 30, 2015, the Parent Company is 31% owned by Roxas and Company, Inc. (RCI), a publicly listed company incorporated and domiciled in the Philippines. The remaininginterest amounting to 27% and 24% of the total shares are owned by FP Natural Resources Holdings B.V. (FPNRH), a Hong Kong based company and First Agri Holdings Corporation (FAHC),a Philippine affiliate of FPNRH, respectively. FPNRH and FAHC are both subsidiaries of First Pacific Company, Ltd. (First Pacific).
The Parent Company completed its stock rights offering in May 2016 for 266,753,974 outstanding common shares of RHI, with par value of P=1.00 a share, on a pre-emptive basis to holdersof common shares of the capital stock of RHI as at May 4, 2016 (the "Record Date") at an offer price of P=4.19 per Rights Share (the “Offer Price”) (see Note 18). As a result the equity interestof FAHC in RHI increased from 24% to 33% while the equity interest of RCI decreased from 31% to 22%.
On February 1, 2017, the Board of Directors (BOD) approved the issuance of convertible debt securities amounting to P=523,750,000 to FPNRH, convertible to 125,000,000 million commonshares of RHI at the option of the holder and bears annual interest at 3%.
On February 15, 2017, the shareholders approved the amendment of the Parent Company’s articles of incorporation to increase the authorized capital stock from 1,500,000,000 to2,000,000,000 divided into 2,000,000,000 with par value of P=1.00 per share. On the same day, the shareholders approved the subsequent application of the convertible note assubscription to 125,000,000 common shares arising from the increase in authorized capital stock at a conversion rate of P=4.19 for every common share.
On July 14, 2017, the SEC approved the Parent Company’s application for increase in authorized capital stock using the convertible debt securities as payment for subscription. Accordingly,FPNRH interest on the Parent Company increased from 27% to 32%. As of September 30, 2017, the ultimate parent company of RHI is First Pacific.
The corporate office of the Parent Company is located at the 14th Floor, Net One Center, 26th cor. 3rd Avenue, Bonifacio Global City, Taguig, Metro Manila while the manufacturing plantsof its operating subsidiaries are in Barrio Lumbangan, Nasugbu, Batangas, Barrio Consuelo, La Carlota City, Negros Occidental and San Carlos Ecozone, San Carlos City, Negros Occidental.
Approval of the Consolidated Financial StatementsThe consolidated financial statements of RHI and subsidiaries, collectively referred to herein as “the Group”, as at September 30, 2017 and 2016 and for each of the three years in the periodended September 30, 2017, as reviewed and recommended for approval by the Group’s Audit and Risk Committee on December 4, 2017, were approved and authorized for issue by theParent Company’s BOD on December 6, 2017.
2. Basis of Preparation and Statement of Compliance
The consolidated financial statements of the Group have been prepared on a historical cost basis, except for retirement assets, land under property, plant and equipment which is measuredat revalued method and investment properties that are measured at fair value. The consolidated financial statements have been presented in Philippine Peso, which is the functionalcurrency of the Parent Company and its subsidiaries. All amounts are rounded to the nearest thousands, except for number of shares and unless otherwise indicated.
The consolidated financial statements of the Group have been prepared in compliance with Philippine Financial Reporting Standards (PFRS) issued by the Philippine Financial ReportingStandards Council and adopted by the Philippine SEC, including the SEC provisions.
The financial reporting framework includes PFRS, Philippine Accounting Standards (PAS) and Philippine Interpretations from International Financial Reporting Interpretations Committee(IFRIC), including the SEC pronouncements.
3. Summary of Changes in Accounting Policies
The accounting policies adopted are consistent with those of the previous financial year, except for the adoption of the following amendments and improvements to standards effectiveOctober 1, 2016:
∂ Amendments to PFRS 10, Consolidated Financial Statements, PFRS 12, Disclosure of Interests in Other Entities, and PAS 28, Investments in Associates and Joint Ventures - InvestmentEntities: Applying the Consolidation Exception, clarify that the exemption in PFRS 10 from presenting consolidated financial statements applies to a parent entity that is a subsidiaryof an investment entity that measures all of its subsidiaries at fair value. They also clarify that only a subsidiary of an investment entity that is not an investment entity itself and thatprovides support services to the investment entity parent is consolidated. The amendments also allow an investor (that is not an investment entity and has an investment entityassociate or joint venture) to retain the fair value measurement applied by the investment entity associate or joint venture to its interests in subsidiaries when applying the equitymethod. The Group continues to measure its investments in associate through equity method.
∂ Amendments to PAS 27, Separate Financial Statements - Equity Method in Separate Financial Statements, allow entities to use the equity method to account for investments insubsidiaries, joint ventures and associates in their separate financial statements. Entities already applying PFRS and electing to change to the equity method in its separate financialstatements will have to apply that change retrospectively. These amendments do not have any impact on the Group’s consolidated financial statements.
∂ Amendments to PFRS 11, Joint Arrangements - Accounting for Acquisitions of Interests in Joint Operations, require a joint operator that is accounting for the acquisition of an interestin a joint operation, in which the activity of the joint operation constitutes a business (as defined by PFRS 3), to apply the relevant PFRS 3 principles for business combinationsaccounting. The amendments also clarify that a previously held interest in a joint operation is not remeasured on the acquisition of an additional interest in the same joint operationwhile joint control is retained. In addition, a scope exclusion has been added to PFRS 11 to specify that the amendments do not apply when the parties sharing joint control, includingthe reporting entity, are under common control of the same ultimate controlling party.
The amendments apply to both the acquisition of the initial interest in a joint operation and the acquisition of any additional interests in the same joint operation. These amendmentsdid not have any impact to the Group’s consolidated financial statements.
∂ PFRS 14, Regulatory Deferral Accounts, allows an entity, whose activities are subject to rate-regulation, to continue applying most of its existing accounting policies for regulatorydeferral account balances upon its first-time adoption of PFRS. Entities that adopt PFRS 14 must present the regulatory deferral accounts as separate line items on the statement offinancial position and present movements in these account balances as separate line items in the statement of income and other comprehensive income (OCI). The standard requiresdisclosures on the nature of, and risks associated with, the entity’s rate-regulation and the effects of that rate-regulation on its financial statements. Since the Group is an existingPFRS preparer, this standard did not apply.
ROXAS HOLDINGS, INC. AND SUBSIDIARIES
CONSOLIDATED STATEMENTS OF CASH FLOWSFOR THE YEAR ENDED SEPTEMBER 30, 2017
(WITH COMPARATIVE FIGURES FOR THE YEARS ENDED SEPTEMBER 30, 2016 AND 2015)(Amounts in Thousands)
Years Ended September 30Note 2017 2016 2015
CASH FLOWS FROM OPERATING ACTIVITIESIncome (loss) before income tax P=108,396 P=26,850 (P=72,298)Adjustments for: Depreciation and amortization 12 950,839 927,513 797,235 Interest expense 15 444,257 382,770 271,355 Share in net earnings of an associate 11 (67,777) (212,258) (134,424) Retirement benefits 17 65,951 48,733 44,861 Unrealized gain on fair value adjustment on investment properties 13 (13,406) (27,529) Interest income 25 (3,384) (3,401) (2,558) Employee stock option 20 2,020 1,440 35,053 Net unrealized foreign exchange losses (gains) 25 (187) (389) 183 Gain from disposal of property, plant and equipment (18) (2,481) Operating income before changes in working capital 1,486,691 1,141,248 939,407Decrease (increase) in: Trade and other receivables (1,029,549) 91,247 18,701 Inventories (937,709) (100,992) (803,885) Other current assets (230,042) (243,284) (72,573)Increase (decrease) in trade and other payables 118,185 (858,193) 472,932Net cash generated from (used in) operations (592,424) 30,026 554,582Income taxes paid, including final taxes (34,921) (36,771) (123,240)Interest received 3,385 3,401 2,558Retirement benefits paid 17 (193) (3,251) (2,085)Net cash flows provided by (used in) operating activities (624,153) (6,595) 431,815
CASH FLOWS FROM INVESTING ACTIVITIESAdditions to: Property, plant and equipment 12 (1,140,984) (911,749) (1,112,456) Investment properties 13 (83) (3,500)Proceeds from: Dividends received 11 212,408 132,468 86,505 Disposal of property and equipment 9,448 7,068 36,267Increase (decrease) in other noncurrent assets 17,752 (38,515) (3,672)Acquisition of:
Non-controlling interest 4 (15,188) (19,000) –Subsidiaries, net of cash absorbed 6 – – (1,673,376)
Net cash flows used in investing activities (916,564) (829,811) (2,670,232)
CASH FLOWS FROM FINANCING ACTIVITIESNet availments of short-term borrowings 1,694,020 1,045,738 2,549,501Payments of: Long-term borrowings 15 (380,185) (1,364,691) (1,351,132) Interest (430,591) (383,193) (296,952) Dividends (247,344)Proceeds from: Convertible debt securities 523,750 – – Exercise of stock option 20 391 6,972 779 Issuances of common shares from stock rights offering,
net of transaction costs 18 1,113,298 – Availments of long-term borrowings 15 – 920,000 – Issuances of treasury shares, net of transaction costs 18 – – 1,680,131Net cash flows provided by financing activities 1,407,385 1,338,124 2,334,983
NET INCREASE (DECREASE) IN CASH (133,332) 501,718 96,566
EFFECT OF FOREIGN EXCHANGE RATE CHANGES ON CASH 187 389 (183)
CASH AND CASH EQUIVALENTS AT BEGINNING OF YEAR 704,522 202,415 106,032
CASH AND CASH EQUIVALENTS AT END OF YEAR 7 P=571,377 P=704,522 P=202,415
See accompanying Notes to Consolidated Financial Statements.

The RighT FundamenTals: SuStainability42
ANNUAL REPORT 2017 43
∂ Amendments to PFRS 4, Insurance Contracts - Applying PFRS 9, Financial Instruments, with PFRS 4, address concerns arising from implementing PFRS 9, the new financial instrumentsstandard before implementing the forthcoming insurance contracts standard. They allow entities to choose between the overlay approach and the deferral approach to deal with thetransitional challenges. The overlay approach gives all entities that issue insurance contracts the option to recognize in other comprehensive income, rather than profit or loss, thevolatility that could arise when PFRS 9 is applied before the new insurance contracts standard is issued. On the other hand, the deferral approach gives entities whose activities arepredominantly connected with insurance an optional temporary exemption from applying PFRS 9 until the earlier of application of the forthcoming insurance contracts standard orJanuary 1, 2021.
The overlay approach and the deferral approach will only be available to an entity if it has not previously applied PFRS 9. The amendments are not applicable to the Group sincenone of the entities within the Group have activities that are predominantly connected with insurance or issue insurance contracts.
• Amendments to PAS 28, Measuring an Associate or Joint Venture at Fair Value (Part of Annual Improvements to PFRS 2014 - 2016 Cycle), clarify that an entity that is a venture capitalorganization, or other qualifying entity, may elect, at initial recognition on an investment-by-investment basis, to measure its investments in associates and joint ventures at fair valuethrough profit or loss. They also clarify that if an entity that is not itself an investment entity has an interest in an associate or joint venture that is an investment entity, the entity may,when applying the equity method, elect to retain the fair value measurement applied by that investment entity associate or joint venture to the investment entity associate’s or jointventure’s interests in subsidiaries. This election is made separately for each investment entity associate or joint venture, at the later of the date on which (a) the investment entityassociate or joint venture is initially recognized; (b) the associate or joint venture becomes an investment entity; and (c) the investment entity associate or joint venture first becomesa parent. The amendments should be applied retrospectively, with earlier application permitted.
• Philippine Interpretation based on International Financial Reporting Interpretations Committee (IFRIC) 22, Foreign Currency Transactions and Advance Consideration, clarifies that indetermining the spot exchange rate to use on initial recognition of the related asset, expense or income (or part of it) on the derecognition of a nonmonetary asset or nonmonetaryliability arising from advance consideration, the date of the transaction is the date on which an entity initially recognizes the nonmonetary asset or nonmonetary liability arising fromthe advance consideration. If there are multiple payments or receipts in advance, then the entity must determine a date of the transactions for each payment or receipt of advanceconsideration. The interpretation may be applied on a fully retrospective basis. Entities may apply the interpretation prospectively to all assets, expenses and income in its scopethat are initially recognized on or after the beginning of the reporting period in which the entity first applies the interpretation or the beginning of a prior reporting period presentedas comparative information in the financial statements of the reporting period in which the entity first applies the interpretation. The adoption of this amendment is not expected tohave any significant impact on the Group’s consolidated financial statements.
Effective beginning on or after January 1, 2019
∂ PFRS 16, Leases, replaces PAS 17, Leases, the current leases standard, and the related Interpretations. Under the new standard, lessees will no longer classify their leases as eitheroperating or finance leases in accordance with PAS 17. Rather, lessees will apply the single-asset model. Under this model, lessees will recognize the assets and related liabilitiesfor most leases on their statements of financial position, and subsequently, will depreciate the lease assets and recognize interest on the lease liabilities in their statement ofcomprehensive income. Leases with a term of twelve months or less or for which the underlying asset is of low value are exempted from these requirements.
The accounting by lessors is substantially unchanged as the new standard carries forward the principles of lessor accounting under PAS 17. Lessors, however, will be required todisclose more information in their financial statements, particularly on the risk exposure to residual value.
Entities may early adopt PFRS 16 but only if they have also adopted PFRS 15. When adopting PFRS 16, an entity is permitted to use either a full retrospective or modified retrospectiveapproach, with options to use certain transition reliefs. The Group is currently assessing the impact of PFRS 16 and plans to adopt the new standard on the required effective dateonce adopted locally.
4. Summary of Significant Accounting and Financial Reporting Policies
Basis of ConsolidationThe consolidated financial statements include the financial statements of the Parent Company and its subsidiaries, which it controls as at September 30 of each year. The Parent Companyhas control over the investee when the Parent Company is exposed, or has rights, to variable returns from its involvement with the investee and has the ability to affect those returns throughits power over the investee.
Presented in the next page is the list of the subsidiaries.
Percentage of Ownership Principal Place of2017 2016 2015 Nature of Business Business
Central Azucarera Don Pedro, Inc. (CADPI) 100.00% 100.00% 100.00% Production and selling of raw andrefined sugar, molasses
and related products
Taguig City andNasugbu, Batangas
Central Azucarera de la Carlota, Inc. (CACI) 100.00% 100.00% 100.00% Production and selling of rawsugar and molasses
Taguig City and NegrosOccidental
CADP Insurance Agency, Inc. (CIAI) 100.00% 100.00% 100.00% Insurance agency Makati CityRoxol Bioenergy Corp. (RBC) (1) 100.00% 100.00% 100.00% Production and selling
of bioethanol fuel and trading ofgoods such as sugarand related products
Negros Occidental
CADP Port Services, Inc. (CPSI) 100.00% 100.00% 100.00% Providing ancillary services Makati CityRHI Agri-Business Development Corporation (RABDC) (2) 100.00% 100.00% 100.00% Agricultural business Makati CityRoxas Pacific Bioenergy Corporation (RPBC) 100.00% 100.00% 100.00% Holding company for bioethanol
investmentsNegros Occidental
RHI Pacific Commercial Corp. (RHIPCC) (2) 100.00% 100.00% 100.00% Selling arm of productsof RHI Group
Makati City
San Carlos Bioenergy, Inc. (SCBI) (3) 93.35% 93.35% 93.35% Productionand selling of bioethanol fuel
Negros Occidental
Najalin Agri Ventures, Inc. (NAVI) 95.82% 86.91% 77.27% Agricultural and industrialdevelopment
Negros Occidental
Roxas Power Corporation (RPC) 50.00% 50.00% 50.00% Sale of electricity Nasugbu, BatangasNortheastern Port Storage Corporation (NPSC) (4) 100.00% – – Owning the depot and storage
facilities used by SCBINegros Occidental
(1) Direct ownership of 20.53% and indirect ownership through CADPI of 79.47%(2) As at September 30, 2017, RHIPCC has not yet started commercial operations(3) Acquired in April 2015 through RPBC (see Note 6)(4) Indirect ownership through RPBC (see Note 6)
In March 2016, NAVI reacquired 63,248 common shares from the non-controlling shareholders for a total consideration of P=19.0 million effectively reducing the non-controlling interest byP=16.4 million, which represents 9.64% decrease in ownership of non-controlling shareholders in NAVI. Consequently, equity interest of the Parent Company in NAVI increased to 86.91%.The excess of the fair value of the consideration paid over the amount by which the non-controlling interest is reduced amounting to P=2.6 million was recognized directly in equity attributableto the equity holders of the Parent Company.
In November 2016, NAVI reacquired 55,696 shares from non-controlling shareholders for a total consideration of P=13.6 million. As at September 30, 2017, there are only 22,656 remainingshares from the non-controlling shareholders which represent 4.18% of the total shares.
On February 1, 2012, the BOD of RHI approved a resolution to shorten the corporate life of CPSI, CIAI and RPC effective September 30, 2012. On the same date, the BOD also approved themerger of CCSI, CFSI and JOMSI, which are non-operating subsidiaries and collectively referred to as “Absorbed Companies”, with CADPI. This decision was in line with the Group’s moveto rationalize its operations. On April 14, 2014, the SEC issued the Certificate of Filing of Articles and Plan of Merger approving the merger of CCSI, CFSI and JOMSI with CADPI, as thesurviving entity. In 2015, management changed its intention and decided to continue the corporate existence of RPC and requested the cancellation of the application for its businessclosure from the Bureau of Internal Revenue. As at September 30, 2017, the applications for the business closure of CPSI and CIAI are still pending approval from the pertinent governmentagencies.
∂ PAS 1, Presentation of Financial Statements - Disclosure Initiative (Amendments), intend to assist entities in applying judgment when meeting the presentation and disclosurerequirements in PFRS. They clarify the following:
- That entities shall not reduce the understandability of their financial statements by either obscuring material information with immaterial information; or aggregating materialitems that have different natures or functions.
- That specific line items in the statement of income and other comprehensive income and the statement of financial position may be disaggregated.- That entities have flexibility as to the order in which they present the notes to financial statements.- That the share of OCI of associates and joint ventures accounted for using the equity method must be presented in aggregate as a single item, and classified between those
items that will or will not be subsequently reclassified to profit or loss.
These amendments did not have significant impact on the Group’s consolidated financial statements.
∂ PAS 16, Property, Plant and Equipment, and PAS 38, Intangible Assets - Clarification of Acceptable Methods of Depreciation and Amortization (Amendments), clarify the principle inPAS 16 and PAS 38 that revenue reflects a pattern of economic benefits that are generated from operating a business (of which the asset is part) rather than the economic benefitsthat are consumed through use of the asset. As a result, a revenue-based method cannot be used to depreciate property, plant and equipment and may only be used in very limitedcircumstances to amortize intangible assets. These amendments did not have a significant impact on the Group’s consolidated financial statements.
∂ PAS 16 and PAS 41, Agriculture: Bearer Plants, change the accounting requirements for biological assets that meet the definition of bearer plants. Under the amendments, biologicalassets that meet the definition of bearer plants will no longer be within the scope of PAS 41. Instead, PAS 16 will apply. After initial recognition, bearer plants will be measured underPAS 16 at accumulated cost (before maturity) and using either the cost model or revaluation model (after maturity). The amendments also require that produce that grows on bearerplants will remain in the scope of PAS 41 measured at fair value less costs to sell. For government grants related to bearer plants, PAS 20, Accounting for Government Grants andDisclosure of Government Assistance, applies. The amendments are applied retrospectively and did not have significant impact on the Group’s consolidated financial statements.
∂ Annual Improvements to PFRS (2012 to 2014 cycle)The Annual Improvements to PFRS (2012 to 2014 cycle) did not have a material impact on the Group’s consolidated financial statements.
New Accounting Standards, Interpretations and Amendments to Existing Standards Effective Subsequent to September 30, 2017The standards, interpretations, amendments and improvements to the standards that are issued, but not yet effective, up to date of issuance of the consolidated financial statements aredisclosed below.
The Group intends to adopt these, if applicable, when these become effective. Unless otherwise specified, these will not have an impact on the Group’s consolidated financial statements.
Effective January 1, 2017
∂ Amendment to PFRS 12, Clarification of the Scope of the Standard (Part of Annual Improvements to PFRS: 2014 - 2016 Cycle)
The amendments clarify that the disclosure requirements in PFRS 12, other than those relating to summarized financial information, apply to an entity’s interest in a subsidiary, a jointventure or an associate (or a portion of its interest in a joint venture or an associate) that is classified (or included in a disposal group that is classified) as held for sale.
• Amendments to PAS 7, Statement of Cash Flows, Disclosure Initiative
The amendments to PAS 7 require an entity to provide disclosures that enable users of financial statements to evaluate changes in liabilities arising from financing activities, includingboth changes arising from cash flows and non-cash changes (such as foreign exchange gains or losses). On initial application of the amendments, entities are not required to providecomparative information for preceding periods. Early application of the amendments is permitted.
Application of amendments will result in additional disclosures in the 2018 consolidated financial statements of the Group.
∂ Amendments to PAS 12, Income Taxes, Recognition of Deferred Tax Assets for Unrealized Losses
The amendments clarify that an entity needs to consider whether tax law restricts the sources of taxable profits against which it may make deductions on the reversal of thatdeductible temporary difference. Furthermore, the amendments provide guidance on how an entity should determine future taxable profits and explain the circumstances in whichtaxable profit may include the recovery of some assets for more than their carrying amount.
Entities are required to apply the amendments retrospectively. However, on initial application of the amendments, the change in the opening equity of the earliest comparativeperiod may be recognized in opening retained earnings (or in another component of equity, as appropriate), without allocating the change between opening retained earnings andother components of equity. Entities applying this relief must disclose that fact. Early application of the amendments is permitted. This amendment did not have significant impacton the Group’s consolidated financial statements.
Effective January 1, 2018
∂ PFRS 15, Revenue from Contracts with Customers, establishes a new five-step model that will apply to revenue arising from contracts with customers. Under PFRS 15, revenue isrecognized at an amount that reflects the consideration to which an entity expects to be entitled in exchange for transferring goods or services to a customer. The principles inPFRS 15 provide a more structured approach to measuring and recognizing revenue. The new revenue standard is applicable to all entities and will supersede all current revenuerecognition requirements under PFRS. Either a full or modified retrospective application is required for annual periods beginning on or after January 1, 2018. The Group did not earlyadopt PFRS 15. The Group is currently assessing the impact of adopting PFRS 15.
∂ PFRS 9, Financial Instruments (2014 or final version), reflects all phases of the financial instruments project and replaces PAS 39 and all previous versions of PFRS 9. The standardintroduces new requirements for classification and measurement, impairment, and hedge accounting. PFRS 9 is effective for annual periods beginning on or after January 1, 2018,with early application permitted. Retrospective application is required, but providing comparative information is not compulsory. Early application of previous versions of PFRS 9 ispermitted if the date of initial application is before February 1, 2015. The Group did not early adopt PFRS 9. The adoption of PFRS 9 will have an effect on the classification andmeasurement of the Group’s financial assets and impairment methodology for financial assets, but will have no impact on the classification and measurement of the Group’s financialliabilities. The Group is currently assessing the impact of adopting PFRS 9.
∂ PAS 40, Investment Property, Transfers of Investment Property, clarify when an entity should transfer property, including property under construction or development into, or out ofinvestment property. The amendments state that a change in use occurs when the property meets, or ceases to meet, the definition of investment property and there is evidence ofthe change in use. A mere change in management’s intentions for the use of a property does not provide evidence of a change in use. The amendments should be appliedprospectively to changes in use that occur on or after the beginning of the annual reporting period in which the entity first applies the amendments. Retrospective application is onlypermitted if this is possible without the use of hindsight. The Group did not early adopt PAS 40. The adoption of PAS 40 is not expected to have any significant impact on the Group’sconsolidated financial statements.
∂ Amendments to PFRS 2, Share-based Payment - Classification and Measurement of Share-based Payment Transactions, address three main areas: the effects of vesting conditionson the measurement of a cash-settled share-based payment transaction; the classification of a share-based payment transaction with net settlement features for withholding taxobligations; and the accounting where a modification to the terms and conditions of a share-based payment transaction changes its classification from cash settled to equity settled.
On adoption, entities are required to apply the amendments without restating prior periods, but retrospective application is permitted if elected for all three amendments and if othercriteria are met. Early application of the amendments is permitted. The adoption of this amendment is not expected to have any significant impact on the Group’s consolidatedfinancial statements.

The RighT FundamenTals: SuStainability44
ANNUAL REPORT 2017 45
Classification of Financial Instruments. Financial instruments are classified as liabilities or equity in accordance with the substance of the contractual arrangement. Interest, dividends, gainsand losses relating to a financial instrument or a component that is a financial liability, are recognized as expense or income. Distributions to holders of financial instruments classified asequity are charged directly to equity, net of any related income tax benefits.
The Group classifies its financial assets in the following categories: FVPL financial assets, loans and receivables, held-to-maturity (HTM) investments and available-for-sale (AFS) financialassets. The Group classifies its financial liabilities as either financial liabilities at FVPL or other financial liabilities. The classification of financial instruments depends on the purpose forwhich these were acquired and whether these are quoted in an active market. The Group determines the classification of its financial assets and liabilities at initial recognition and, whereallowed and appropriate, re-evaluates such designation at every reporting date.
The Group does not have financial instruments classified as financial assets or liabilities at FVPL, HTM investments and AFS financial assets as at September 30, 2017 and 2016.
Loans and Receivables. Loans and receivables are non-derivative financial assets with fixed or determinable payments and maturities that are not quoted in an active market. These arenot entered into with the intention of immediate or short-term resale and are not designated as AFS financial assets or financial assets at FVPL.
Subsequent to initial measurement, loans and receivables are carried at amortized cost using the effective interest method, less any impairment in value. Any interest earned on loans andreceivables is recognized as part of “Interest income” recognized in profit or loss on an accrual basis. Amortized cost is calculated by taking into account any discount or premium onacquisition and fees that are integral part of the effective interest rate. The periodic amortization is also included as part of “Interest income” recognized in profit or loss. Gains or lossesare recognized in profit or loss when loans and receivables are derecognized or impaired, as well as through the amortization process.
Loans and receivables are included in current assets if maturity is within 12 months from the reporting date. Otherwise, these are classified as noncurrent assets.
Classified as loans and receivables are cash in banks, trade and other receivables, except for advances to planters, as at September 30, 2017 and 2016 (see Notes 7, 8 and 19). Tradereceivables with average credit terms of 15 to 90 days are recognized and carried at original invoice amount less any allowance for impairment losses.
Other Financial Liabilities. Other financial liabilities pertain to financial liabilities that are not held for trading and are not designated at FVPL upon the inception of the liability. These includeliabilities arising from operating (e.g. trade and other payables, excluding statutory liabilities and provision for probable losses) and financing (e.g. short and long-term borrowings, due torelated parties, dividend payable) activities.
Borrowings are recognized initially at fair value, net of transaction costs incurred, and are subsequently stated at amortized cost. Any difference between the proceeds (net of transactioncosts) and the redemption value is recognized in profit or loss over the term of the borrowings using the effective interest method.
Borrowings are classified as current liabilities unless the Group has an unconditional right to defer settlement of the liability for at least 12 months after the end of reporting year.
Trade and other payables are recognized in the year in which the related money, goods or services are received or when a legally enforceable claim against the Group is established. Theseare measured at amortized cost, normally equal to nominal amount.
Other financial liabilities are recognized initially at fair value and are subsequently carried at amortized cost, taking into account the impact of applying the effective interest method ofamortization (or accretion) for any related premium (or discount) and any directly attributable transaction costs.
This category includes trade and other payables (excluding statutory liabilities and provision for probable losses) and short-term and long-term borrowings as at September 30, 2017 and2016 (see Notes 14, 15, 16 and 19).
Derecognition of Financial Assets and Liabilities. A financial asset (or, where applicable, a part of a financial asset or part of a group of similar financial assets) is derecognized when:
∂ the rights to receive cash flows from the asset expired;
∂ the Group retains the right to receive cash flows from the asset, but has assumed an obligation to pay them in full without material delay to a third party under a “pass-through”arrangement; or
∂ the Group has transferred its rights to receive cash flows from the asset and either (a) has transferred substantially all the risks and rewards of the asset, or (b) has neither transferrednor retained substantially all the risks and rewards of the asset, but has transferred control of the asset.
Where the Group has transferred its rights to receive cash flows from an asset and has neither transferred nor retained substantially all the risks and rewards of the asset nor transferredcontrol of the asset, the asset is recognized to the extent of the Group’s continuing involvement in the asset. Continuing involvement that takes the form of a guarantee over the transferredasset is measured at the lower of original carrying amount of the asset and the maximum amount of consideration that the Group could be required to pay.
A financial liability is derecognized when the obligation under the liability is discharged or cancelled or has expired.
When an existing financial liability is replaced by another from the same lender on substantially different terms, or the terms of an existing liability are substantially modified, such anexchange or modification is treated as a derecognition of the original liability and the recognition of a new liability, and the difference in the respective carrying amounts is recognized inprofit or loss.
A modification is considered substantial if the present value of the cash flows under the new terms, including net fees paid or received and discounted using the original effective interestrate, is different by at least 10% from the discounted present value of remaining cash flows of the original liability.
The fair value of the modified financial liability is determined based on its expected cash flows, discounted using the interest rate at which the Group could raise debt with similar terms andconditions in the market. The difference between the carrying value of the original liability and fair value of the new liability is recognized in profit or loss.
On the other hand, if the difference does not meet the 10% threshold, the original debt is not extinguished but merely modified. In such case, the carrying amount is adjusted by the costsor fees paid or received.
Impairment of Financial Assets. The Group assesses at the end of each reporting year whether a financial asset or a group of financial assets is impaired.
The Group first assesses whether objective evidence of impairment exists individually for financial assets that are individually significant, and individually or collectively for financial assetsthat are not individually significant. Objective evidence includes observable data that comes to the attention of the Group about loss events such as, but not limited to, significant financialdifficulty of the counterparty, a breach of contract, such as a default or delinquency in interest or principal payments, or the increasing probability that the borrower will enter bankruptcy orother financial reorganization. If it is determined that no objective evidence of impairment exists for an individually assessed financial asset, whether significant or not, the asset is includedin the group of financial assets with similar credit risk and characteristics and that group of financial assets is collectively assessed for impairment. Assets that are individually assessed forimpairment and for which an impairment loss is recognized are not included in a collective assessment of impairment. The impairment assessment is performed at the end of each reportingyear. For the purpose of a collective evaluation of impairment, financial assets are grouped on the basis of such credit risk characteristics such as customer type, payment history, past duestatus and term.
The Parent Company has control over RPC because it has the power to cast the majority of votes through its representatives in the BOD, has rights to variable returns from RPC and has theability to affect those returns.
The consolidated financial statements are presented in Philippine Peso, which is the functional and presentation currency of the Parent Company. Each entity determines its own functionalcurrency, which is the currency that best reflects the economic substance of the underlying events and circumstances relevant to that entity, and items included in the consolidated financialstatements of each entity are measured using that functional currency.
The financial statements of the subsidiaries are prepared for the same reporting year as the Parent Company. The Group is using uniform accounting policies for like transactions and otherevents in similar circumstances. All significant intercompany balances and transactions including inter-group unrealized profits and losses, are eliminated in preparing the consolidatedfinancial statements.
The financial statements of the subsidiaries are included in the consolidated financial statements from the date when the Parent Company obtains control and continue to be consolidateduntil the date when such control ceases. The results of operations of the subsidiaries acquired or disposed of during the year are included in profit and loss from the date of acquisition orup to the date of disposal, as appropriate.
Changes in the controlling equity ownership (i.e., acquisition of non-controlling interest or partial disposal of interest over a subsidiary) that do not result in a loss of control are accountedfor as equity transactions.
Any excess or deficit of consideration paid over the carrying amount of the non-controlling interests is recognized in equity of the Group in transactions where the non-controlling interestsare acquired or sold without loss of control. This is recognized as part of “Other equity items”. If the Group loses control over a subsidiary, it: (a) derecognizes the assets (including goodwill)and liabilities of the subsidiary; (b) derecognizes the carrying amount of any non-controlling interests; (c) derecognizes the cumulative translation differences recorded in equity; (d) recognizesthe fair value of the consideration received; (e) recognizes the fair value of any investment retained; (f) recognizes any surplus or deficit in profit or loss; (g) reclassifies the parent’s share ofcomponents previously recognized in OCI to profit or loss or retained earnings, as appropriate, as would be required if the Group had directly disposed of the related assets or liabilities.
Non-controlling interests represent the portion of profit or loss and net assets of NAVI, RPC and SCBI not held by the Group, directly or indirectly, and are presented separately in theconsolidated statement of comprehensive income and within the equity section of the consolidated statement of financial position and consolidated statement of changes in equity,separately from the Parent Company’s equity. Total comprehensive income is attributed to the portion held by the Group and to the non-controlling interests even if this results in the non-controlling interests having a deficit.
Business Combination and GoodwillBusiness combinations are accounted for using the acquisition method. The cost of an acquisition is measured as the aggregate of the consideration transferred, measured at fair value onacquisition date and the amount of any non-controlling interest in the acquiree. For each business combination, the acquirer measures the non-controlling interest in the acquiree at itsproportionate share in the acquiree’s identifiable net assets. Acquisition-related costs incurred are expensed and included in general and administrative expenses. The excess of the costof acquisition over the fair value of the Parent Company’s share of the identifiable net assets acquired is recorded as goodwill. If the cost of acquisition is less than the fair value of theParent Company’s share of the net assets of the subsidiary acquired, the difference is recognized directly in profit or loss.
If the business combination is achieved in stages, the acquisition date fair value of the acquirer’s previously held equity interest in the acquiree is remeasured to fair value at the acquisitiondate through profit or loss.
Any contingent consideration to be transferred by the acquirer will be recognized at fair value at the acquisition date. Subsequent changes to the fair value of the contingent considerationwhich is deemed to be an asset or liability will be recognized in accordance with PAS 39 either in profit or loss or as a change to other comprehensive income. If the contingent considerationis classified as equity, it should not be remeasured. Subsequent settlement is accounted for within equity. In instance where the contingent consideration does not fall within the scope ofPAS 39, it is measured in accordance with the appropriate PFRS.
Goodwill is initially measured at cost being the excess of the aggregate of the consideration transferred and the amount recognized for non-controlling interest over the net identifiableassets acquired and liabilities assumed. If this consideration is lower than the fair value of the net assets of the subsidiary acquired, the difference is recognized in profit or loss. If the initialaccounting for business combination can be determined only provisionally by the end of the year by which the combination is effected because either the fair values to be assigned to theacquiree’s identifiable assets, liabilities or contingent liabilities or the cost of the combination can be determined only provisionally, the Group accounts the combination using provisionalvalues. Adjustments to these provisional values as a result of completing the initial accounting should be made within 12 months from the acquisition date. The carrying amount of anidentifiable asset, liability or contingent liability that is recognized as a result of completing the initial accounting should be calculated as if its fair value at the acquisition date had beenrecognized from that date and goodwill or any gain recognized should be adjusted from the acquisition date by an amount equal to the adjustment to the fair value at the acquisition dateof the identifiable asset, liability or contingent liability being recognized or adjusted.
After initial recognition, goodwill is measured at cost less any accumulated impairment losses. For the purpose of impairment testing, goodwill acquired in a business combination is, fromthe acquisition date, allocated to each of the Group’s cash-generating units that are expected to benefit from the combination, irrespective of whether other assets or liabilities of theacquiree are assigned to those units. Where goodwill forms part of a cash-generating unit and part of the operation within that unit is disposed of, the goodwill associated with the operationdisposed of is included in the carrying amount of the operation when determining the gain or loss on disposal of the operation. Goodwill disposed of in this circumstance is measured basedon the relative values of the operation disposed of and the portion of the cash-generating unit retained.
When the Group acquires a business, it assesses the financial assets and liabilities assumed for appropriate classification and designation in accordance with the contractual terms, economiccircumstances and pertinent conditions as at the acquisition date.
Common Control Transactions. Where there are business combinations in which all the combining entities within the Group are ultimately controlled by the same ultimate parent before andafter the business combination and that the control is not transitory (“business combinations under common control”), the Group accounts such business combinations under the acquisitionmethod of accounting, if the transaction was deemed to have substance from the perspective of the reporting entity. In determining whether the business combination has substance,factors such as the underlying purpose of the business combination and the involvement of parties other than the combining entities such as the non-controlling interest, are being considered.
In cases where the business combination has no substance, the Parent Company accounts for the transaction similar to a pooling of interests. The assets and liabilities of the acquiredentities and that of the Group are reflected at their carrying amounts. The difference in the amount recognized and the fair value of the consideration given, is accounted for as an equitytransaction (i.e., as either a contribution or distribution of equity). Further, when a subsidiary is transferred in a common control transaction, the difference in the amount recognized andthe fair value of consideration received, is also accounted for as an equity transaction.
Cash and cash equivalentsCash includes cash on hand and in banks that earn interest at the respective bank deposit rates. Cash equivalents are short-term, highly liquid investments that are readily convertible toknown amounts of cash with original maturities of three months or less from the date of acquisition and are subject to an insignificant risk of changes in value.
Financial Instruments
Date of Recognition. The Group recognizes a financial asset or a financial liability in the consolidated statement of financial position when the Group becomes a party to the contractualprovisions of the instrument. All regular way purchases and sales of financial assets are recognized on the trade date, i.e., the date that the Group commits to purchase the asset. Regularway purchases or sales are purchases or sales of financial assets that require delivery of the assets within the period generally established by regulation or convention in the market place.
Initial Recognition of Financial Instruments. Financial instruments are recognized initially at fair value of the consideration given (in the case of an asset) or received (in the case of a liability).Transaction costs are included in the initial measurement of all financial assets and liabilities, except for financial instruments measured at fair value through profit or loss (FVPL). Fair valueis determined by reference to the transaction price or other market prices. If such market prices are not readily determinable, the fair value of the consideration is estimated as the sum ofall future cash payments or receipts, discounted using the prevailing market rate of interest for similar instruments with similar maturities.
Day 1 Difference. Where the transaction price in a non-active market is different from the fair value from other observable current market transactions in the same instrument or based on avaluation technique whose variables include only data observable from the market, the Group recognizes the difference between the transaction price and fair value (a day 1 difference) inprofit or loss unless it qualifies for recognition as some other type of asset. For each transaction, the Group determines the appropriate method of recognizing a day 1 difference amount.

The RighT FundamenTals: SuStainability46
ANNUAL REPORT 2017 47
Property, Plant and EquipmentProperty, plant and equipment are carried at historical cost less accumulated depreciation, amortization and any impairment in value, except for land, which is stated at revalued amount.
The initial cost of property, plant and equipment comprises its purchase price, including import duties and nonrefundable purchase taxes and any directly attributable costs of bringing theasset to its working condition and location for its intended use. Cost also includes the cost of replacing part of such asset when the recognition criteria are met, and the estimated presentvalue of the cost of dismantling and removing the asset and restoring the site. Borrowing costs incurred during the construction of a qualifying asset is likewise included in the initial costof property, plant and equipment.
Subsequent costs are included in the asset’s carrying amount or recognized as a separate asset, as appropriate, only when it is probable that future economic benefits associated with theitem will flow to the Group and the cost of the items can be measured reliably. All other repairs and maintenance are charged to profit or loss in the year incurred.
Construction in progress pertains to properties under construction and are stated at cost. Cost includes costs of construction, labor, borrowings and other direct costs. Construction inprogress is depreciated only from such time as the relevant assets are completed and put into operational use. Construction in progress are reclassified to the appropriate fixed assetcategory upon completion.
The net appraisal increment resulting from the revaluation of land is presented as “Revaluation increment on land,” net of related deferred tax, in the consolidated statement of changes inequity as part of other equity items and reserves. Any resulting decrease is directly charged against the related revaluation increment to the extent that the decrease does not exceed theamount of the revaluation in respect of the same asset. All other decreases are charged to profit or loss. Valuations are performed frequently enough to ensure that the fair value of landdoes not differ significantly from its carrying amount.
The portion of revaluation increment on land, net of related deferred tax, realized upon disposal of the property is transferred to retained earnings.
Depreciation and amortization are calculated using the straight-line method to allocate the cost over the estimated useful lives, as follows:
Asset Category Number of YearsBuildings and building improvements 25Land improvements 10Machinery and equipment: Factory machinery and installations 17 to 25 Safety equipment 5Office furniture, fixtures and equipment 3 to 5Depot and storage facilities 15Transportation equipment 3 to 6
Depreciation and amortization commence when an asset is in its location or condition capable of being operated in the manner intended by management. Depreciation and amortizationcease at the earlier of the date that the item is classified as held for sale (or included in a disposal group that is classified as held for sale) in accordance with PFRS 5, Noncurrent Assets Heldfor Sale and Discontinued Operations, and the date the asset is derecognized.
Major repairs and maintenance that qualified for capitalization are depreciated and amortized over the remaining useful life of the related asset.
The asset’s estimated useful lives and depreciation and amortization method are reviewed periodically to ensure that these are consistent with the expected pattern of economic benefitsfrom items of property, plant and equipment.
Fully depreciated property and equipment are retained in the books until these are no longer in use.
When an asset is disposed of, or is permanently withdrawn from use and no future economic benefits are expected from its disposal, the cost and accumulated depreciation, amortizationand impairment are derecognized. Gains and losses on retirement or disposal are determined by comparing the proceeds with carrying amount of the asset and are recognized in profit orloss.
Software CostSoftware cost, which is presented as part of “Other noncurrent assets,” is initially measured at cost. Following initial recognition, software cost is carried at cost less accumulated amortizationand any impairment losses. The software cost is amortized on a straight-line basis over its estimated economic useful life of three years and assessed for impairment whenever there is anindication that the software cost may be impaired. The amortization commences when the software cost is available for use. The period and the method of amortization for the softwarecost are reviewed at each financial year end.
Gains and losses arising from derecognition of software cost are measured as the difference between the net disposal proceeds and the carrying amount of the asset and are recognized inprofit or loss.
Investment PropertiesInvestment properties are measured initially at cost, including transaction costs. Subsequent to initial recognition, investment properties are stated at fair value. Gains or losses arisingfrom changes in fair value of investment properties are included in profit or loss in the year in which these arise.
The fair value of investment property is the price at which the property could be exchanged between knowledgeable, willing parties in an arm’s-length transaction. Fair value specificallyexcludes an estimated price inflated or deflated by special terms or circumstances such as typical financing, sale and leaseback arrangements, special considerations or concessions grantedby anyone associated with the sale. The fair value of investment property should reflect market conditions at the end of the reporting year.
Derecognition of an investment property will be triggered by a change in use or by sale or disposal. Gain or loss arising on disposal is calculated as the difference between any disposalproceeds and the carrying amount of the related asset, and is recognized in profit or loss.
Transfers are made to investment property when, and only when, there is change in use, evidenced by cessation of owner-occupation or commencement of an operating lease to anotherparty. Transfers are made from investment property when, and only when, there is a change in use, evidenced by commencement of owner-occupation or commencement of developmentwith a view to sell.
Impairment of Nonfinancial AssetsThe carrying amounts of investment in an associate, property, plant and equipment, and other nonfinancial assets are reviewed for impairment whenever events or changes in circumstancesindicate that the carrying amount may not be recoverable, except for goodwill acquired in a business combination which is reviewed for impairment annually. An impairment loss isrecognized for the amount by which the asset’s carrying amount exceeds its recoverable amount. The recoverable amount is the higher of an asset’s fair value less costs to sell and value-in-use. For the purposes of assessing impairment, assets are grouped at the lowest levels for which there are separately identifiable cash flows (cash-generating units). Nonfinancial assetsother than goodwill that suffered impairment are reviewed for possible reversal of the impairment at each reporting date.
Impairment losses are recognized in profit or loss under the expense category consistent with the function of the impaired asset. Impairment loss recognized during interim period in respectto goodwill or investment, cannot be reversed at year end.
An assessment is made at each reporting date as to whether there is any indication that previously recognized impairment losses may no longer exist or may have decreased. If suchindication exists, the recoverable amount is estimated. A previously recognized impairment loss is reversed only if there has been a change in the estimates used to determine the asset’srecoverable amount since the last impairment loss was recognized. If that is the case, the carrying amount of the asset is increased to its recoverable amount. That increased amountcannot exceed the carrying amount that would have been determined, net of depreciation and amortization, had no impairment loss been recognized for the asset in prior years. Suchreversal is recognized in profit or loss unless the asset is carried at revalued amount, in which case the reversal is treated as an appraisal increase. After such a reversal, the depreciationand amortization are adjusted in future periods to allocate the asset’s revised carrying amount, less any residual value, on a systematic basis over its remaining useful life.
If there is objective evidence that an impairment loss on loans and receivables has been incurred, the amount of loss is measured as the difference between the asset’s carrying amountand the present value of estimated future cash flows (excluding future credit losses that have not been incurred) discounted at the financial asset’s original effective interest rate (i.e., theeffective interest rate computed at initial recognition). The carrying amount of the asset is reduced through the use of an allowance account. The amount of impairment loss is recognizedin profit or loss.
Loans and receivables, together with the related allowance, are written off when there is no realistic prospect of future recovery and all collateral has been realized. If, in a subsequentperiod, the amount of the impairment loss decreases and the decrease can be related objectively to an event occurring after the impairment was recognized, the previously recognizedimpairment loss is reversed. Any subsequent reversal of an impairment loss is recognized in profit or loss, to the extent that the carrying amount of the asset does not exceed its amortizedcost at the reversal date.
Offsetting Financial Instruments. Financial assets and liabilities are offset and the net amount reported in the consolidated statement of financial position if there is a currently enforceablelegal right to offset the recognized amounts and there is an intention to settle on a net basis, or to realize the asset and settle the liability simultaneously. The Group assesses that it has acurrently enforceable right if the right is not contingent on a future event, and is legally enforceable in the normal course of business, event of default and event of insolvency or bankruptcyof the Group and all of the counter parties.
Fair Value MeasurementThe Group uses valuation techniques that are appropriate in the circumstances and for which sufficient data are available to measure fair value, maximizing the use of relevant observableinputs and minimizing the use of unobservable inputs.
All assets and liabilities for which fair value is measured or disclosed in the consolidated financial statements are categorized within the fair value hierarchy, described as follows, based onthe lowest level input that is significant to the fair value measurement as a whole:
Level 1 - Quoted (unadjusted) market prices in active market for identical assets or liabilities.
Level 2 - Valuation techniques for which the lowest level input that is significant to the fair value measurement is directly or indirectly observable.
Level 3 - Valuation techniques for which the lowest level input that is significant to the fair value measurement is unobservable.
For assets and liabilities that are recognized in the consolidated financial statements on a recurring basis, the Group determines whether transfers have occurred between levels in thehierarchy by re-assessing categorization (based on the lowest level input that is significant to the fair value measurement as a whole) at the end of each reporting year.
For the purpose of fair value disclosures, the Group has determined classes of assets and liabilities on the basis of the nature, characteristics and risks of the asset or liability and the levelof the fair value hierarchy as explained in the foregoing.
Further information about the assumptions made in measuring fair value is included in the following notes to the consolidated financial statements:
∂ Note 5, “Significant Judgments, Accounting Estimates and Assumptions - Determining the Revaluation Value of Land and Determining the Fair Value of Investment Properties”∂ Note 12, “Property, Plant and Equipment”∂ Note 13, “Investment Properties”∂ Note 30, “Fair Value Measurement”
InventoriesInventories are valued at the lower of cost and net realizable value (NRV).
Raw and Refined Sugar, Molasses and Alcohol. Cost is determined using the weighted average method. Production cost is allocated using the NRV of each of the joint products(i.e., raw sugar, refined sugar and molasses). The cost of alcohol includes direct materials and labor and a proportion of manufacturing overhead costs with unit cost determined using themoving average method. NRV is the estimated selling price in the ordinary course of business, less the estimated costs to complete the production and the estimated costs necessary tomake the sale.
Materials and Supplies. Cost is determined using the moving average method. NRV is the current replacement cost.
Provision for inventory losses and obsolescence is provided for slow moving, obsolete, defective and damaged inventories based on physical inspection and management assessment.
Other Current AssetsThis account consists of creditable withholding taxes (CWT), input value-added tax (VAT) and prepayments.
CWT. CWT represents the amount withheld by the Group’s customers in relation to its income. CWT can be utilized as payment for income taxes provided that these are properly supportedby certificates of creditable tax withheld at source subject to the rules on Philippine income taxation.
VAT. Revenue, expenses, assets and liabilities are recognized net of the amount of VAT, except where the VAT incurred on a purchase of assets or services is not recoverable from thetaxation authority, in which case the VAT is recognized as part of the cost of acquisition of the asset or as part of the expense item as applicable. Receivables and payables are stated withthe amount of VAT included. For sale or purchase of services, related VAT is deferred until the related receivable or payable from the transaction has been collected or paid.
The net amount of VAT recoverable from taxation authority is presented as part of “Other current and noncurrent assets” in the consolidated statement of financial position. The net amountof VAT payable to taxation authority is included in “Trade and other payables” in the consolidated statement of financial position.
Prepayments. Prepayments are expenses paid in advance and recorded as asset before these are utilized. Prepayments are apportioned over the period covered by the payment andcharged to appropriate expense accounts in profit or loss when incurred. Prepayments that are expected to be realized for no more than 12 months after the financial reporting year areclassified as current assets. Otherwise, these are classified as noncurrent assets.
Investment in an AssociateInvestment in an associate initially recognized at cost, is subsequently accounted for using the equity method.
An associate is an entity in which the Group has significant influence but not control, over the financial and operating policies. Significant influence is presumed to exist when the Groupholds between 20% and 50% of the voting rights of the entity.
The share of its associate’s post-acquisition profits or losses is recognized in profit or loss, and its share of post-acquisition movements in reserves is recognized in equity. The ParentCompany’s share in net appraisal increase resulting from the revaluation of land of an associate is presented as “Share in revaluation increment on land of an associate,” net of relateddeferred tax, in the consolidated statement of changes in equity. The cumulative post-acquisition movements are adjusted against the carrying amount of the investment.
When the share of losses in an associate equals or exceeds its interest in the associate, including any other unsecured receivables, the Group does not recognize further losses, unless ithas incurred obligations or made payments in behalf of the associate. Unrealized gains on transactions between the Group and its associate are eliminated to the extent of the interest inthe associate. Unrealized losses are also eliminated unless the transaction provides evidence of an impairment of the asset transferred. The financial statements of the associate areprepared for the same reporting year of the Parent Company. Adjustments, where necessary, are made to ensure consistency with the policies adopted by the Group.

The RighT FundamenTals: SuStainability48
ANNUAL REPORT 2017 49
Capitalization of borrowing costs is suspended during extended period in which the Group suspends active development of a qualifying asset and ceases when substantially all the activitiesnecessary to prepare the qualifying asset for its intended use are complete. An asset is normally ready for its intended use when the physical construction of the asset is complete eventhough routine administrative work might still continue.
LeasesThe determination of whether the arrangement is, or contains a lease is based on the substance of the arrangement at inception date of whether the fulfillment of the arrangement isdependent on the use of a specific asset or assets or the arrangement conveys a right to use the asset. A reassessment is made after inception on the lease only if one of the followingapplies: (a) there is a change in contractual terms, other than a renewal or extension of the arrangement; (b) a renewal option is exercised or extension granted, unless the term of therenewal or extension was initially included in the lease term; (c) there is a change in the determination of whether fulfillment is dependent on a specified asset; or (d) there is substantialchange to the asset.
Where a reassessment is made, lease accounting commences or ceases from the date when the change in circumstances gave rise to reassessment for scenarios (a), (c) or (d) and at thedate of renewal or extension period for scenario (b).
Operating Lease - The Group as a Lessee. Leases where the lessor retains substantially all the risks and benefits of ownership of the asset are classified as operating lease. Operatingleases are recognized as an expense on a straight-line basis over the lease term.
For income tax reporting purposes, operating lease payment under operating lease agreements is treated as deductible expense in accordance with the terms of the lease agreements.
Operating Lease - The Group as a Lessor. Leases where the Company does not transfer substantially all the risks and benefits of ownership of the assets are classified as operating leases.Initial direct costs incurred in negotiating operating leases are added to the carrying amount of the leased asset and amortized over the lease term on the same basis as the rental income.Contingent rents are recognized as revenue in the year in which these are earned.
Employee Benefits
Short-term Employee Benefits. The Group recognizes a liability, net of amounts already paid, and an expense for services rendered by employees during the reporting year. A liability isalso recognized for the amount expected to be paid under short-term cash bonus or profit sharing plans if the Group has a present legal or constructive obligation to pay this amount as aresult of past service provided by the employee, and the obligation can be estimated reliably.
Short-term employee benefits liabilities are measured on an undiscounted basis and are expensed as the related service is provided.
Retirement Benefits. The retirement benefits cost is determined using the projected unit credit method, which reflects services rendered by employees to the date of valuation andincorporates assumptions concerning employees’ projected salaries.
The retirement benefits cost comprises of the service cost, net interest on the retirement liability or plan asset and remeasurements of retirement liability or plan asset.
The Group recognizes service costs, comprising of current service costs, past service costs, gains and losses on curtailments and non-routine settlements; and interest cost or income inprofit or loss.
Net interest on the retirement liability or plan asset is the change during the year in the retirement liability or plan asset that arises from the passage of time, which is determined by applyingthe discount rate based on government bonds to the retirement liability or plan asset.
Past service costs are recognized in profit or loss on the earlier of the date of the plan amendment or curtailment, and the date that the Group recognizes restructuring-related costs.
Remeasurements comprising actuarial gains and losses, return on plan assets and any change in the effect of the asset ceiling (excluding net interest on retirement liability or asset) arerecognized immediately in other comprehensive income in the year in which these arise. Remeasurements are not reclassified to profit or loss in subsequent years.
The plan assets are generally funded through payments to trustee-administered funds as determined by periodic actuarial calculations. Plan assets are not available to the creditors of theGroup, nor can be paid directly to the Group. The fair value of the plan assets is based on the market price information. When no market price is available, the fair value of plan assets isestimated by discounting expected future cash flows using a discount rate that reflects both the risk associated with the plan assets and the maturity or expected disposal date of thoseassets (or, if they have no maturity, the expected period until the settlement of the related obligations). If the fair value of the plan assets is higher than the present value of the retirementliability, the measurement of the resulting retirement plan asset is limited to the present value of economic benefits available in the form of refunds from the plan or reductions in futurecontributions to the plan.
The retirement liability or asset is the aggregate of the present value of the retirement liability and the fair value of plan assets on which the obligations are to be settled directly. The presentvalue of the retirement liability is determined by discounting the estimated future cash outflows using interest rate on government bonds that have terms to maturity approximating theterms of the related retirement liability.
Actuarial valuations are made with sufficient regularity so that the amounts recognized in the consolidated financial statements do not differ materially from the amounts that would bedetermined at the reporting date.
Termination Benefits. Termination benefits are payable when employment is terminated before the retirement date, or when an employee accepts voluntary redundancy in exchange forthese benefits. The Group recognizes termination benefits when it is demonstrably committed to either: terminating the employment of current employees according to a detailed formalplan without possibility of withdrawal; or providing termination benefits as a result of an offer made to encourage voluntary redundancy. Benefits falling due more than 12 months after endof reporting year are discounted to present value.
Related Party Relationship and TransactionsRelated party relationship exists when one party has the ability to control, directly, or indirectly through one or more intermediaries, or exercise significant influence over the other party inmaking financial and operating decisions. Such relationships also exist between and/or among entities which are under common control with the reporting entity, or between, and/or amongthe reporting entity and its key management personnel, directors or its stockholders. In considering each possible related party relationship, attention is directed to the substance of therelationship, and not merely to the legal form.
Foreign Currency-Denominated Transactions and TranslationsItems included in the consolidated financial statements of each of the Group’s entities are measured using the functional currency.
Transactions denominated in foreign currencies are recorded using the exchange rate at the date of the transaction. Outstanding monetary assets and liabilities denominated in foreigncurrencies are translated using the closing rate of exchange at the end of reporting year. Foreign exchange differences are credited or charged directly in profit or loss.
Income Taxes
Current Tax. Current tax assets and liabilities for the current and prior years are measured at the amount expected to be recovered from or paid to the taxation authorities. The tax rate andthe tax laws used to compute the amount are those that are enacted or substantively enacted at the end of the reporting year.
Deferred Tax. Deferred tax is provided on all temporary differences at the end of reporting year between the tax bases of assets and liabilities and their carrying amounts for financialreporting purposes.
EquityCapital Stock and Additional Paid-in Capital. Capital stock is measured at par value for all shares issued. Incremental costs directly attributable to the issue of new shares are shown inequity as a deduction from proceeds. The excess of proceeds from issuance of shares over the par value of shares are credited to additional paid-in capital. The Parent Company alsorecognizes a corresponding increase in additional paid-in capital when services are rendered in an equity-settle share-based payment transaction.
Treasury Stock. Where the Parent Company purchases its own capital stock (treasury stock), the consideration paid, including any directly attributable incremental costs (net of relatedtaxes), is deducted from equity until the shares are cancelled, reissued or disposed of. Where such shares are subsequently sold or reissued, any consideration received, net of any directlyattributable incremental transactions costs and the related taxes, is included in equity attributable to the equity holders of the Parent Company.
Retained Earnings. Retained earnings represent the cumulative balance of net income or loss, dividend distributions, effects of the changes in accounting policy and other capitaladjustments.
Dividend Distribution. Dividend distribution to the Parent Company’s and subsidiaries’ stockholders and the non-controlling interests is recognized as a liability and deducted from equityin the year in which the dividends are declared as approved by the BOD of respective entities. Dividends that are approved after the reporting year are dealt with as an event after thereporting year.
Other Comprehensive Income (Loss)Other comprehensive income (loss) comprises items of income and expenses (including items previously presented as other equity reserves under the consolidated statement of changesin equity) that are not recognized in profit or loss for the year in accordance with PFRS. These are presented as part of other equity reserves in the consolidated statement of changes inequity. Other comprehensive income (loss) includes revaluation increment on land, cumulative remeasurement loss on net retirement assets and liabilities, effect of change in equity interestin subsidiaries and cumulative loss on remeasurement loss of retirement assets of an associate.
Employee Stock Option (ESOP)Regular employees (including directors) receive remuneration in the form of share-based payment transactions, whereby employees render services in exchange for rights over shares(“equity-settled transactions”).
The cost of equity-settled transactions with employees is measured by reference to the fair value of the stock options at the date at which these are granted. The fair value of the stockoptions is determined using an option-pricing model, further details of which are presented in Note 20. In valuing equity-settled transactions, no account is taken of any performanceconditions, other than conditions linked to the price of the shares of RHI (“market conditions”), if applicable.
The cost of equity-settled transactions is recognized, together with a corresponding increase in equity, over the period until employees become fully entitled to the award (“vesting date”).The cumulative expense recognized for equity-settled transactions at each reporting date until the vesting date reflects the extent to which the vesting period has expired and the bestestimate of the number of awards that will ultimately vest. The change or credit for a year represents the movement in cumulative expense recognized as at the beginning and end of thatyear.
No expense is recognized for awards that do not ultimately vest, except for awards where vesting is conditional upon a market condition, which are treated as vesting irrespective of whetheror not the market condition is satisfied, provided that all other performance conditions are satisfied.
Where the terms of an equity-settled award are modified, an expense, at a minimum, is recognized as if the terms had not been modified. An expense is recognized for any increase in thevalue of the transactions as a result of the modification, as measured at the date of modification. Where an equity-settled award is cancelled, it is treated as if it had vested on the date ofcancellation, and any expense not yet recognized for the award is recognized immediately. However, if a new award is substituted for the cancelled award, and designated as a replacementaward on the date that it is granted, the cancelled and new awards are treated as if these were modifications of the original award, as described in the previous paragraph.
The dilutive effect of outstanding stock option is reflected as additional share dilution in the computation of earnings per share (see Note 27).
Revenue RecognitionRevenue comprises the fair value of the sale of goods and services in the ordinary course of the Group’s activities. Revenue is shown net of output VAT, returns and discounts.
The Group recognizes revenue when the amount of revenue can be reliably measured, it is probable that future economic benefits will flow into the entity and specific criteria have beenmet for each of the Group’s activities as described below. The amount of revenue is not considered to be reliably measured until all contingencies relating to the sale have been resolved.
Sale of Raw Sugar. Sale of raw sugar is recognized upon (a) endorsement and transfer of quedans for quedan-based sales and (b) shipment or delivery and acceptance by the customersfor physical sugar sales.
Sale of Refined Sugar and Alcohol. Sale of refined sugar and alcohol is recognized upon shipment or delivery and acceptance by the customers.
Sale of Molasses. Sale of molasses is recognized upon transfer of molasses warehouse receipts, which represents ownership title over the molasses inventories.
Bill and Hold Sales. Bill and hold sales are recognized when all criteria are met:
a. It is probable that delivery will be made;b. The item is on hand, identified and ready for delivery to the buyer at the time the sale is recognized;c. The buyer specifically acknowledges the deferred delivery instructions; andd. The usual payment terms apply.
Revenue from Tolling Services. Revenue from tolling services is recognized when the equivalent refined sugar is produced from raw sugar owned by tollees.
Rental Income. Rental income from operating leases is recognized on a straight line basis over the lease term.
Interest Income. Interest income is recognized on a time proportion basis using the effective interest method.
Other Income. Other income is recognized when the earning process is complete and the flow of economic benefit is reasonably assured.
Cost and Expense RecognitionCost and expenses are recognized in profit or loss upon receipt of goods, utilization of services, or at the date the cost and expenses are incurred.
Cost of Sales. Cost of sales includes direct materials and labor costs, and those related indirect cost incurred upon processing of the Group’s products and rendering of its tolling services.It is recognized as expense when related goods are sold or the related services are rendered.
Selling, General and Administrative Expenses. Selling expenses are costs incurred to sell or distribute goods. General and administrative expenses are costs of administering the businesssuch as salaries and wages of administrative department, outside services, rental, utilities and general office expenses. These expenses are recognized when incurred.
Borrowing CostsBorrowing costs that are directly attributable to the acquisition, construction of a qualifying asset, which necessarily takes a substantial period of time to prepare for its intended use areincluded in the cost of that asset. Such borrowing costs are capitalized as part of the cost of the asset when it is probable that these will result in future economic benefits to the Group andthe costs can be measured reliably. Other borrowing costs are recognized as expense when incurred.

The RighT FundamenTals: SuStainability50
ANNUAL REPORT 2017 51
Determining the Classification of Lease Arrangements. Management exercises judgment in determining whether substantially all the significant risks and benefits of ownership of the assetsheld for lease are retained by the Group. Lease contracts in which the Group retains substantially all the risks and benefits incidental to ownership of the leased item are accounted for asoperating leases. Otherwise, these are considered as finance leases.
∂ Operating Lease - The Group as a Lessee. The Group, has various property being leased covering several heavy handling equipment, service vehicles and office space of RHI, whereit has determined that the risks and benefits of ownership over these properties are retained with the lessors. Accordingly, these lease agreements are accounted for as operatingleases (see Note 28).
Rent expense amounted to P=210.8 million, P=184.4 million and P=117.0 million, respectively, included in “Cost of goods sold” and “General and administrative expenses” accounts, in2017, 2016 and 2015, respectively (see Notes 22 and 23).
∂ Operating Lease - The Group as a Lessor. Leases where the Group does not transfer substantially all the risks and benefits of ownership of the asset are classified as operatingleases. Rent income is recognized on a straight-line basis over the lease term of the lease, as applicable (see Note 13).
Rent income included under “Other income” account amounted to P=8.6 million, P=13.1 million and P=6.6 million in 2017, 2016 and 2015, respectively (see Note 25).
Determining the Classification of Properties. Management determines the classification of a property depending on its use. The Group classifies its owner-occupied properties as property,plant and equipment. Properties held to earn rentals or for capital appreciation are classified as investment properties. The change of use of properties will trigger a change in classificationand measurement of these properties.
The Group classified and accounted the land of NAVI, SCBI, CADPI and the Parent Company held for rent or capital appreciation as investment properties. As at September 30, 2017 and2016, the carrying amount of investment properties amounted to P=349.3 million and P=320.8 million, respectively (see Note 13).
Estimates and AssumptionsThe key assumptions concerning the future and other key sources of estimation uncertainty at the end of reporting period that have a significant risk of causing a material adjustment to thecarrying amounts of assets and liabilities within the next fiscal years are discussed below.
Estimating Impairment Losses on Receivables. The provision for impairment losses on receivables is estimated based on two methods: specific identification and collective assessment.The amounts calculated using each of these methods are combined to determine the total amount to be provided. First, specific accounts are evaluated based on information that certaincustomers may be unable to meet their financial obligations. In these cases, the Group applies judgment, in recording specific allowances against amounts due to reduce receivable amountsexpected to be collected, based on the best available facts and circumstances, including but not limited to, the length of relationship with the customer and the customer’s current creditstatus based on third party credit reports and known market factors. These specific allowances are re-evaluated and adjusted as additional information received impacts the amountsestimated. Second, a collective assessment of historical collection, write-off, experience and customer payment terms is determined. The amount and timing of recorded expenses for anyyear could therefore differ based on the judgments or estimates made. An increase in the Group’s allowance for impairment of receivables would increase its general and administrativeexpenses and decrease its current assets.
As at September 30, 2017 and 2016, trade and other receivables amounted to P=2,258.1 million and P=1,331.0 million, respectively (see Note 8). Allowance for impairment losses of trade andother receivables amounted to P=76.0 million and P=86.5 million as at September 30, 2017 and 2016, respectively (see Note 8).
Determining the NRV of Inventories. The Group’s estimates of the NRV of inventories are based on the most reliable evidence available at the time the estimates are made of the amountthat the inventories are expected to be realized. These estimates consider the fluctuations of price or cost directly relating to events occurring after the end of the reporting period to theextent that such events confirm conditions existing at the end of the reporting period. When the circumstances that previously caused inventories to be written down below cost no longerexist or when there is a clear evidence of an increase in NRV because of change in economic circumstances, the amount of the write-down is reversed so that the new carrying amount isthe lower of the cost and the revised NRV.
As at September 30, 2017 and 2016, the inventories carried at lower of cost or NRV amounted to P=2,539.5 million and P=1,601.8 million, respectively (see Note 9). Allowance for inventorylosses and obsolescence amounted to P=30.1 million and P=30.0 million as at September 30, 2017 and 2016, respectively (see Note 9).
Allocating the Cost to Molasses Inventory. Management uses judgment to measure and allocate cost to the molasses inventory. When the costs of conversion of each product are notseparately identifiable, these are allocated among the products on a rational and consistent basis. The allocation is based on the NRV of cane products at the completion of production.
As at September 30, 2017 and 2016, portion of molasses inventory amounting to P=5.9 million and P=31.5 million, respectively, pertains to allocated cost from the total production costs ofmilled raw and refined sugar (see Note 9).
Estimating the Provision for Unrecoverable Creditable Withholding Taxes. Provision for unrecoverable creditable withholding taxes is maintained at a level considered adequate to providefor potentially unrecoverable claims. The Group, on a continuing basis, makes a review of the status of the claims, designed to identify those to be provided with any impairment loss. Inthese cases, management uses judgment based on the best available facts and circumstances. The amount and timing of recorded loss for any period would differ based on the judgmentsor estimates made.
As at September 30, 2017 and 2016, carrying amount of creditable withholding taxes amounted to P=597.5 million and P=506.3 million, respectively (see Note 10).
Determining the Revaluation Value of Land. The land is carried at revalued amount, which approximates its fair value at the date of the revaluation. The valuation of land is performed byPhilippine SEC accredited appraisers. The fair value was arrived at using the Market Data Approach based on the gathered available market evidences. Revaluations are made on a regularbasis to ensure that the fair value does not differ materially from its carrying value.
Land carried at revalued amount as at September 30, 2017 and 2016 amounted to P=4,746.0 million and P=4,379.8 million, respectively (see Note 12). Appraisal increase, net of tax, amountedto P=116.6 million, P=181.5 million and nil in 2017, 2016, and 2015, respectively.
Estimating Useful Lives of Property, Plant and Equipment. The useful life of each of the items of property, plant and equipment is estimated based on the year over which the asset isexpected to be available for use. Such estimation is based on a collective assessment of practices of similar businesses, internal technical evaluation and experience with similar assets.The estimated useful life of each asset is reviewed periodically and updated if expectations differ from previous estimates due to physical wear and tear, technical or commercialobsolescence and legal or other limits on the use of the asset. It is possible, however, that future results of operations could be materially affected by changes in the amounts and timing ofrecorded expenses brought about by the changes in the factors mentioned in the foregoing. A change in the estimated useful life of any item of property, plant and equipment would impactthe recorded cost and expenses and noncurrent assets.
The carrying amount of the depreciable property, plant and equipment as at September 30, 2017 and 2016 amounted to P=9,849.6 million and P=9,794.0 million, respectively (see Note 12).
Determining the Fair Value of Investment Properties. The fair value of the investment properties was determined by Philippine SEC accredited appraisers using Market Data Approach basedon gathered available market evidences. The latest appraisal reports were made on various dates in 2017.
Investment properties stated at fair value amounted to P=349.3 million and P=320.8 million as at September 30, 2017 and 2016, respectively (see Note 13). The unrealized gain on fair valueadjustment of investment properties amounted to P=13.4 million, P=27.5 million and nil in 2017, 2016 and 2015 respectively, recorded under “Other income” in the consolidated statement ofincome (see Note 25).
Assessing Impairment of Nonfinancial Assets. The Group assesses at the end of each reporting year whether there is any indication that the nonfinancial assets listed below (except goodwill)may be impaired. If such indication exists for nonfinancial assets other than goodwill, the Group estimates the recoverable amount of the asset, which is the higher of an asset’s fair valueless costs to sell and its value-in-use. In determining fair value, an appropriate valuation model is used, which can be based on quoted prices or other available fair value indicators. Goodwillis tested for impairment at least on an annual basis or more frequently if events or changes in circumstances indicate that it may be impaired. For goodwill, annual impairment test requiresestimation of value in use of the cash generating unit to which goodwill relates. In estimating the value-in-use, the Group is required to make an estimate of the expected future cash flowsfrom the cash generating unit and also to choose an appropriate discount rate in order to calculate the present value of those cash flows.
Deferred tax liabilities are recognized for all taxable temporary differences, including asset revaluations. Deferred tax liability is not recognized when it arises from the initial recognition ofan asset or liability in a transaction that is not a business combination and, at the time of the transaction, affects neither the accounting profit or loss nor taxable profit or loss. However,deferred tax liabilities are not provided on non-taxable temporary differences associated with investments in domestic subsidiaries and associates. Deferred tax assets are recognized forall deductible temporary differences, carryforward benefits of unused tax credits (excess of minimum corporate income taxes or MCIT over regular corporate income taxes or RCIT) andunused tax losses (net operating loss carryover or NOLCO), to the extent that it is probable that sufficient future taxable profit will be available against which the deductible temporarydifferences and carryforward benefits of unused tax credits and unused tax losses can be utilized.
The carrying amount of deferred tax assets is reviewed at the end of each reporting year and reduced to the extent that it is no longer probable that sufficient future taxable profit will beavailable to allow all or part of the deferred tax assets to be utilized. Unrecognized deferred tax assets are reassessed at the end of each reporting year and are recognized to the extentthat it has become probable that sufficient future taxable profit will allow the deferred tax asset to be recovered.
Deferred tax assets and liabilities are measured at the tax rate that are expected to apply to the period when the asset is realized or the liability is settled, based on tax rates (and tax laws)that have been enacted or substantively enacted at the end of reporting year.
Deferred tax assets and liabilities are offset if a legally enforceable right exists to set off the deferred tax assets against the deferred tax liabilities and the deferred taxes relate to the sametaxable entity and the same taxation authority.
Deferred tax relating to items recognized outside profit or loss is recognized outside profit or loss. Deferred tax items are recognized in relation to the underlying transaction either in othercomprehensive income or directly in equity.
Provisions and ContingenciesProvision are recognized when the Group has a present legal or constructive obligation as a result of past events; it is more likely than not that an outflow of resources will be required tosettle the obligation; and the amount can be reliably estimated. Restructuring provisions comprise lease termination penalties and employee termination payments. Provisions are notrecognized for future operating losses.
Where there are a number of similar obligations, the likelihood that an outflow will be required in settlement is determined by considering the class of obligations as a whole. A provision isrecognized even if the likelihood of an outflow with respect to any one item included in the same class of obligations may be small.
Provisions are measured at the present value of the expenditures expected to be required to settle the obligation using a pre-tax rate that reflects current market assessments of the timevalue of money and the risks specific to the obligation. The increase in the provision due to passage of time is recognized as interest expense.
Provisions are reviewed at the end of each reporting year and adjusted to reflect the current best estimate.
Contingent liabilities are not recognized in the consolidated financial statements. These are disclosed in the notes to consolidated financial statements unless the possibility of an outflowof resources embodying economic benefits is remote. A contingent asset is not recognized in the consolidated financial statements but disclosed in the notes to consolidated financialstatements when an inflow of economic benefits is probable.
Earnings per ShareThe Group presents basic and diluted earnings per share. Basic earnings per share is calculated by dividing the profit attributable to equity holders of the Parent Company by the weightedaverage number of common shares outstanding during the year, excluding common shares purchased by the Parent Company and held as treasury shares. Diluted earnings per share iscalculated in the same manner, adjusted for the effects of all the dilutive potential common shares.
Segment ReportingFor purposes of management reporting, the Group’s operating businesses are organized and managed separately on a per company basis, but are grouped into strategic business units(SBU) defined along the Group’s core main product lines, namely: sugar and alcohol.
Operating segments are components of the Group: (a) that engage in business activities from which these may earn revenue and incur expenses (including revenue and expenses relatingto transactions with other components of the Group); (b) whose operating results are regularly reviewed by the Group’s senior management, its chief operating decision maker, to makedecisions about resources to be allocated to the segment and assess its performance; and (c) for which discrete financial information is available.
Events after the Reporting DatePost year-end events that provide additional information about the Group’s financial position at the end of reporting year (adjusting events) are reflected in the consolidated financialstatements when material. Post year-end events that are non-adjusting events are disclosed in the notes to consolidated financial statements when material.
5. Significant Judgments, Accounting Estimates and Assumptions
The preparation of the consolidated financial statements requires the Group to exercise judgment, make estimates and use assumptions that affect the reported amounts of assets, liabilities,income and expenses and related disclosures. The Group makes estimates and uses assumptions concerning the future. The resulting accounting estimates will, by definition, seldomequal the related actual results. Future events may occur which will cause the assumptions used in arriving at the estimates to change. The effects of any change in estimates are reflectedin the consolidated financial statements as these become reasonably determinable.
Judgments, estimates and assumptions are continuously evaluated and are based on historical experience and other factors, including expectations of future events that are believed to bereasonable under the circumstances.
The Group believes the following represent a summary of significant judgments, estimates and assumptions that have a significant risk of causing a material adjustment to the carryingamount of assets and liabilities, as well as to the related revenues and expenses, within the next fiscal year, and related impact and associated risk in the consolidated financial statements.
JudgmentsIn the process of applying the Group’s accounting policies, management exercised judgment on the following items, apart from those involving estimations, which has the most significanteffect on the amounts recognized in the consolidated financial statements.
Determining the Operating Segments. Determination of operating segments is based on the information about components of the Group that management uses to make decisions aboutoperating matters. Operating segments use internal reports that are regularly reviewed by the Parent Company’s chief operating decision maker, which is defined to be the Parent Company’sBOD, in order to allocate resources to the segment and assess its performance. The Parent Company reports separate information about an operating segment that meets any of thefollowing quantitative thresholds: (a) its reported revenue, including both sales to external customers and intersegment sales or transfers, is 10% or more of the combined revenue, internaland external, of all operating segments; (b) the absolute amount of its reported profit or loss is 10% or more of the greater, in absolute amount, of (i) the combined reported profit of alloperating segments that did not report a loss and (ii) the combined reported loss of all operating segments that reported a loss; and (c) its assets are 10% or more of the combined assets ofall operating segments.
Management assessed that the Group’s operating businesses are organized and managed separately according to core main product lines, namely: sugar and alcohol. Consequently,reportable operating segments as at and for the years ended September 30, 2017, 2016 and 2015 are sugar, alcohol and others (see Note 31).
Determining the Existence of Control in Investee Companies. Control is presumed to exist when the Parent Company owns, directly or indirectly through subsidiaries, more than half of thevoting power of an entity unless, in exceptional circumstances, it can be clearly demonstrated that such ownership does not constitute control. The Parent Company has the power to castthe majority of votes through its representatives in the BOD. Management has determined that despite having only 50% ownership in RPC and no equity ownership yet in NPSC, the ParentCompany has control over RPC and NPSC by virtue of its rights to variable returns from the subsidiary and ability to affect those returns.

The RighT FundamenTals: SuStainability52
ANNUAL REPORT 2017 53
7. Cash and Cash Equivalents
This account consists of:
2017 2016Cash on hand P=1,040 P=612Cash in banks 520,334 636,044Cash equivalents 50,003 67,866
P=571,377 P=704,522
Cash in banks and cash equivalents earn interest at the respective bank deposit rates.
Interest income earned from cash in bank and cash equivalents amounted to P=0.8 million, P=1.0 million, and P=1.1 million in 2017, 2016, and 2015, respectively (see Note 25).
8. Trade and Other Receivables
This account consists of:
Note 2017 2016Trade P=2,013,752 P=889,411Due from: Planters and cane haulers 130,792 246,978 Employees 63,274 59,005Related parties 19 57,821 37,525Dividend 11, 19 – 102,492Others 68,435 82,125
2,334,074 1,417,536Allowance for impairment losses (75,991) (86,510)
P=2,258,083 P=1,331,026
Trade receivables are unsecured, noninterest-bearing with credit terms ranging from 15 to 120 days.
Due from planters and cane haulers pertain to interest-bearing cash advances, which will be settled in the form of raw sugar from the planters and through services to be rendered by thecane haulers, respectively. Interest income amounted to P=2.6 million, P=2.4 million and P=1.5 million in 2017, 2016 and 2015, respectively (see Note 25).
Due from employees include housing and educational loans which are collected through salary deduction, and advances for business purposes subject to liquidation.
Other receivables mainly include claims from former stockholder of SCBI which are noninterest-bearing and normally settled within one year.
Details and movements of allowance for impairment losses on trade and other receivables are presented in the next page.
2017
Note Trade
Due fromPlanters andCane Haulers
Due fromEmployees Others Total
Balance at beginning of year P=39,176 P=37,743 P=733 P=8,858 P=86,510Provision (reversal) 23 – (9,322) 65 – (9,257)Write-off (1,262) – – – (1,262)Reclassifications (19,182) 18,051 1,131 – –Balance at end of year P=18,732 P=46,472 P=1,929 P=8,858 P=75,991
2016
Note Trade
Due fromPlanters andCane Haulers
Due fromEmployees Others Total
Balance at beginning of year P=39,246 P=16,428 P=116 P=24,889 P=80,679Provision (reversal) 23 – 8,409 – (2,578) 5,831Reclassifications (70) 12,906 617 (13,453) –Balance at end of year P=39,176 P=37,743 P=733 P=8,858 P=86,510
9. Inventories
This account consists of:
2017 2016At NRV: Materials and supplies P=541,014 P=545,547 Alcohol 46,153 –At cost: Refined sugar 1,324,000 594,941 Molasses 335,046 361,095 Raw sugar 283,887 – Alcohol – 100,235 Others 9,426 –
P=2,539,526 P=1,601,818
Raw sugar quantities reported as inventories are supported by quedans held by the Group. The Group also has raw sugar quantities, which are also supported by quedans, held in trust forthird parties (see Note 28). A quedan is a negotiable instrument which evidences the ownership of specified quantity in a warehouse or sugar central.
Cost of inventories valued at NRV is shown below:
2017 2016Materials and supplies P=571,051 P=575,532Alcohol 46,227 –
P=617,278 P=575,532
Determining the recoverable amounts of the nonfinancial assets which involves the determination of future cash flows expected to be generated from the continued use and ultimatedisposition of such assets, requires the use of estimates and assumptions that can materially affect the consolidated financial statements. Future events could indicate that these nonfinancialassets and goodwill may be impaired. Any resulting impairment loss could have a material adverse impact on the financial condition and results of operations of the Group.
While the Group believes that its assumptions are appropriate and reasonable, significant changes in these assumptions may materially affect its assessment of recoverable values and maylead to future additional impairment changes.
Nonfinancial assets that are subject to impairment testing when impairment indicators are present such as obsolescence, physical damage, significant changes to the manner in which theasset is used, worse than expected economic performance, a drop in revenue or other external indicators, are as follows:
Note 2017 2016Property, plant and equipment 12 P=10,303,421 P=10,331,821Investment in an associate 11 606,768 648,868
There are no indications of possible impairment on the nonfinancial assets. Accordingly, the Group has not recognized any impairment losses on nonfinancial assets in 2017, 2016 and 2015.
Goodwill which relates to the Group’s acquisition of SCBI in 2015 amounted to P=1,079.6 million as of September 30, 2017 and 2016 (see Note 6).
The recoverable amount has been determined based on the value-in-use calculations using cash flow projections from financial budgets covering as approved by management a five-yearperiod of projection. The projected cash flows were based on expectations on future outcomes taking into account past experiences, adjusted for anticipated revenue growth based onmanagement’s future plans. The discount rate used is 8.8% and 9.9% in 2017 and 2016, respectively. Based on this impairment assessment, management has determined that there was noimpairment of goodwill in 2017 and 2016 since the value-in-use exceeds the carrying value of the identifiable assets of the cash-generating unit. An increase by 0.85% in the discount ratewould result in impairment of goodwill.
Based on management’s assessment, the recoverable amount of the goodwill is higher than the carrying value, thus no impairment loss was noted on the goodwill on SCBI with carryingamount of P=1,079.6 million as of September 30, 2017 and 2016 (see Note 6).
Determining Retirement Benefits and Liability. The determination of the cost of retirement benefits and related retirement liability is dependent on the selection of certain assumptions usedby the actuary in calculating such amounts. Those assumptions, which include among others, discount rates and future salary increase rate are described in Note 17.
Actual results that differ from the assumptions are accumulated and are recognized as other comprehensive income and accumulated in equity. While management believes that theassumptions are reasonable and appropriate, significant differences in the Group’s actual experience of significant changes in the assumptions may materially affect the retirement liability.
As at September 30, 2017 and 2016, retirement assets amounted to P=62.1 million and P=106.8 million, respectively, while retirement liabilities amounted to P=316.8 million and P=328.0 millionas at September 30, 2017 and 2016, respectively (see Note 17). Net retirement benefits expense amounted to P=66.0 million, P=48.7 million and P=44.9 million in 2017, 2016 and 2015,respectively (see Note 17).
Assessing Realizability of Deferred Tax AssetsThe Group reviews the carrying amounts at the end of each reporting year and reduces the amount of deferred tax assets to the extent that it is no longer probable that sufficient futuretaxable profit will be available to allow all or part of the deferred tax assets to be utilized.
Total deferred tax assets amounted to P=472.7 million and P=461.2 million as at September 30, 2017 and 2016, respectively (see Note 26).
Deferred tax assets were not recognized on certain deductible temporary differences with income tax effect amounting to P=12.8 million and P=3.1 million as at September 30, 2017 and 2016,respectively (see Note 26). Management believes that it may not be probable that future taxable profit will be available in the near future against which the deferred tax assets can beutilized.
Evaluation of Provisions and ContingenciesThe Group provides for present obligations (legal or constructive) where it is probable that there will be an outflow of resources embodying economic benefits that will be required to settlesaid obligations. An estimate of the provision is based on known information at the end of reporting period, net of any estimated amount that may be reimbursed to the Group. If the effectof the time value of money is material, provisions are discounted using a current pre-tax rate that reflects the risks specific to the liability. The amount of provision is being re-assessed atleast on an annual basis to consider new relevant information.
The Group is involved in various other labor disputes, litigations, claims and tax assessments that are normal to its business. Based on the opinion of the Group’s legal counsels on theprogress and legal grounds of certain claims and assessments, the Group has recognized outstanding provision for probable losses amounting to P=96.6 million and P=22.0 million as atSeptember 30, 2017 and 2016, respectively (see Notes 16 and 28).
6. Business Combination
In April 2015, the Group entered into a Sale and Purchase Agreement (SPA) for the acquisition of 93.35% equity interest in SCBI through RPBC, a wholly owned subsidiary, for a totalconsideration of P=1,737.6 million. The total consideration includes the purchase of the receivable of the former stockholders of SCBI from NPSC amounting to P=122.0 million. All closingconditions have been substantially met in May 2015. In 2016, after finalizing the goodwill, total consideration was adjusted to P=1,679.9 million.
The SPA also provides the transfer of assets of NPSC to RPBC, whether through merger with, acquisition of NPSC or direct asset sale, without additional consideration to the Group.Consequently, the Group effectively acquired the business of NPSC without holding equity interest yet. The assets of NPSC mainly include depot and storage facilities, which are includedin the consolidated statements of financial position. In 2017, deeds of assignment covering the shares held by NPSC’s previous stockholders were executed in favor of RPBC.
The carrying amount and fair value of the identifiable assets and liabilities acquired and goodwill resulting from the business combination as of September 30, 2016 and 2017 below. Thegoodwill primarily relates to expected synergy arising from acquisition.
CarryingAmount Fair Value
Cash P=6,521 P=6,521Trade and other receivables 233,166 233,166Inventories 138,452 138,452Other current assets 63,335 63,335Property, plant and equipment 2,522,492 2,696,701Investment property 69,142 96,601Other noncurrent assets 17,587 17,587Total assets 3,050,695 3,252,363Loans payable 1,689,378 1,689,378Notes payable 135,000 13,000Trade and other payables 671,353 671,353Deferred interest 193,841 148,836Redeemable preferred stock 38,850 38,850Retirement liability 17,530 17,530Deferred tax liabilities 29,950 38,200Total liabilities 2,775,902 2,617,147Net assets acquired P=274,793 P=635,216
Total consideration (1,679,877)Share of non-controlling interest (34,954)Goodwill (P=1,079,615)

The RighT FundamenTals: SuStainability54
ANNUAL REPORT 2017 55
12. Property, Plant and Equipment
Details and movements of property, plant and equipment, valued at cost, are shown below:
2017
MachineryOffice
Furniture, Depot andBuildings and and Fixtures and Storage Transportation ConstructionImprovements Equipment Equipment Facilities Equipment in Progress Total
CostBalances at beginning of year P=3,357,857 P=16,277,444 P=739,017 P=173,387 P=155,045 P=537,797 P=21,240,547Additions 20,162 248,520 32,565 1,750 3,254 613,510 919,761Retirement and disposals – (17,919) – – (1,375) – (19,294)Reclassifications 490,463 78,175 (1,660) – 117,641 (684,619) –Adjustments 6,823 (31,152) (16,701) 13,870 (13) (12,837) (40,010)Balances at end of year 3,875,305 16,555,068 753,221 189,007 274,552 453,851 22,101,004Accumulated Depreciation
and AmortizationBalances at beginning of year 1,519,967 8,600,074 664,667 52,199 71,819 – 10,908,726Depreciation and amortization 184,766 689,746 17,933 16,000 17,578 – 926,023Retirement and disposals – (9,252) – – (574) – (9,826)Reclassifications 377,291 (438,440) (3,399) – 64,548 – –Adjustments (2,622) (7,777) (16,927) – (14) – (27,340)Balances at end of year 2,079,402 8,834,351 662,274 68,199 153,357 – 11,797,583Net Carrying Amount P=1,795,903 P=7,720,717 P=90,947 P=120,808 P=121,195 P=453,851 P=10,303,421
2016
MachineryOffice
Furniture, Depot andBuildings and and Fixtures and Storage Transportation Construction
Improvements Equipment Equipment Facilities Equipment in Progress TotalCostBalances at beginning of year P=3,325,550 P=15,276,447 P=676,391 P=173,387 P=102,910 P=769,964 P=20,324,649Additions 4,775 187,208 49,905 – 34,506 656,453 932,847Retirement and disposals – (16,949) – – – – (16,949)Reclassifications 27,532 830,738 12,721 – 17,629 (888,620) –Balances at end of year 3,357,857 16,277,444 739,017 173,387 155,045 537,797 21,240,547Accumulated Depreciation
and AmortizationBalances at beginning of year 1,380,340 7,872,589 651,315 52,199 50,534 – 10,006,977Depreciation and amortization 139,627 739,847 13,352 – 21,285 – 914,111Retirement and disposals – (12,362) – – – – (12,362)Balances at end of year 1,519,967 8,600,074 664,667 52,199 71,819 – 10,908,726Net Carrying Amount P=1,837,890 P=7,677,370 P=74,350 P=121,188 P=83,226 P=537,797 P=10,331,821
Construction in progress mainly pertains to the on-going plant improvements and rehabilitation of milling and refinery equipment, which are to be completed in 2018. As at September 30,2017 and 2016, the Group has contractual commitment for the on-going construction projects amounting to P=394.1 million and P=8.3 million, respectively.
The Group has no borrowing cost capitalized in 2017 and 2016. Unamortized capitalized borrowing cost as at September 30, 2017 and 2016 amounted to P=259.4 million and P=293.6 millionwith corresponding deferred tax of P=77.8 million and P=88.1 million, respectively (see Note 26). The capitalized borrowing cost is amortized over the estimated useful lives of the qualifyingassets to which it relates.
The amount of depreciation and amortization is allocated as follows:
Note 2017 2016 2015Cost of sales 22 P=879,086 P=858,215 P=752,067General and administrative expenses 23 71,753 69,298 45,168
P=950,839 P=927,513 P=797,235
Depreciation and amortization in 2017, 2016 and 2015 includes amortization of software cost of P=24.8 million, P=13.4 million and P=2.3 million, respectively.
As at September 30, 2017 and 2016, fully depreciated property, plant and equipment with an aggregate cost of P=1,494.6 million and P=1,553.6 million, respectively, are still being used inoperations.
Land at appraised values and its related cost are as follows:
Note 2017 2016Balance at beginning of year P=4,379,780 P=4,050,586Additions 214,468 –Appraisal increase 18 166,516 312,001Reclassification 13 (14,717) 17,193Balance at end of year P=4,746,047 P=4,379,780
At cost P=841,279 P=625,533
In 2017, reclassification pertains to land which was owner-occupied but was held for lease and classified as investment property starting in 2017. In 2016, reclassification pertains to landpreviously held for lease and classified as investment property but was owner-occupied starting in 2016.
As at September 30, 2017 and 2016, the revaluation of land is based on the appraised values using a market data approach, as determined by Philippine SEC accredited independentappraisers. Market data approach considers the sales and listings and other market data of comparable properties registered within the vicinity of the property being valued. Factors suchas location, size, shape of lot, highest and best use estimate were also taken into consideration in order to estimate the fair value of the property. The revalued amount has been categorizedas level 2 (directly or indirectly observable inputs). The latest appraisal reports were made on various dates in 2017.
Certain property, plant and equipment with a carrying amount of P=8,183.2 million as at September 30, 2017 and 2016 were mortgaged and used as collateral to secure the loan obligationswith the local banks (see Note 15).
Details and movements of allowance for inventory losses and obsolescence are as follows:
2017Alcohol
and MolassesMaterials and
Supplies TotalBalance at beginning of year P=– P=29,985 P=29,985Provisions 74 52 126Balance at end of year P=74 P=30,037 P=30,111
2016Alcohol
and MolassesMaterials and
Supplies TotalBalance at beginning of year P=1,381 P=22,750 P=24,131Provisions (reversal) (1,381) 7,235 5,854Balance at end of year P=– P=29,985 P=29,985
Provisions for inventory losses and obsolescence amounting to P=0.1 million and P=5.9 million, are presented as “Others” under “Cost of goods sold” and “General and AdministrativeExpenses” in 2017 and 2016, respectively (see Notes 22 and 23).
Cost of inventories recognized as expense and presented as “Direct materials used” under “Cost of sales” amounted to P=5,194.7 million, P=6,245.4 million and P=3,207.3 million in 2017, 2016and 2015, respectively (see Note 22).
10. Other Assets
Current portion of this account consists of:
2017 2016Creditable withholding taxes P=597,480 P=506,331Advances to suppliers 103,682 32,073Input VAT 70,395 264,494Prepayments 18,211 25,142Refundable deposits 14,315 12,636Others 25,120 6,309
P=829,203 P=846,985
Input VAT, which includes deferred input VAT, arises from other purchases of capital goods and services for operations.
Noncurrent portion of other assets consist of:
2017 2016Input VAT P=256,661 P=–Refundable deposits 16,842 35,770Others 6,395 17,135
P=279,898 P=52,905
Noncurrent portion of input VAT mostly arises from construction services relating to the Ethanol Plant.
11. Investment in an Associate
The Parent Company has 45.09% ownership interest in Hawaiian-Philippine Company (HP Co.), an entity incorporated in the Philippines, which is engaged in manufacturing and trading ofraw and refined sugar, molasses and other sugar by-products.
Movements in investment in an associate are as follows:
2017 2016Acquisition cost Note P=127,933 P=127,933Accumulated share in net earnings: Balance at beginning of year 322,648 345,350
Dividends declared (109,916) (234,960) Share in net earnings 67,777 212,258 Balance at end of the year 280,509 322,648Cumulative share in remeasurement loss on retirement liability: Balance at beginning of year 18 (9,205) (6,175) Share in remeasurement loss 18 39 (3,030) Balance at end of the year (9,166) (9,205)Share in revaluation increment of land 18 207,492 207,492
P=606,768 P=648,868
Cash dividends declared by HP Co. are as follows:
Date ApprovedAmount
per Share Total AmountStockholders of
Record Date Date PaidFebruary 10, 2017 P=3.85 P=243,768 February 28, 2017 April 6, 2017September 29, 2016 3.59 227,306 October 31, 2016 November 10, 2016February 11, 2016 2.42 153,224 February 29, 2016 April 7, 2016October 2, 2015 2.22 140,562 October 31, 2015 November 12, 2015
Dividends declared attributable to the Parent Company amounted to P=109.9 million and P=235.0 million in 2017 and 2016, respectively. Dividend receivable amounted to P=102.5 million as atSeptember 30, 2016 (see Note 8).
The associate has no contingent liabilities or capital commitments as of September 30, 2017 and 2016.
Summarized financial information of HP Co. are as follows:
2017 2016Current assets P=1,000,976 P=799,763Noncurrent assets 1,388,505 1,325,835Current liabilities (1,044,500) (674,682)Noncurrent liabilities (406,395) (419,578)Net assets 938,586 1,031,338Revenue 2,136,579 2,381,952Net income 150,314 470,743Other comprehensive income - remeasurement loss on retirement benefit obligation 86 (6,720)

The RighT FundamenTals: SuStainability56
ANNUAL REPORT 2017 57
∂ prohibition on any material change in ownership or control of its business or capital stock or in the composition of its top level management; and
∂ prohibition on declaration or payment of dividends or any other capital or other asset distribution to its stockholders, unless the required financial ratios are maintained.
As at September 30, 2017 and 2016, the Group is in compliance with the foregoing loan covenants.
The maturities of the long-term borrowings are as follows:
2017 2016Less than one year P=1,234,803 P=379,954Between one to two years 2,667,717 968,130Between two to five years 1,840,221 4,113,361Between five to eight years 330,626 991,877
P=6,073,367 P=6,453,322
16. Trade and Other Payables
This account consists of:
Note 2017 2016Trade P=549,474 P=488,783Accruals for: Payroll and other employee benefits 38,935 7,777 Interest 37,987 30,781 Others 147,926 240,923Due to: Related parties 19 103,724 98,936 Planters 19,630 4,985Provision for probable losses 23, 28 96,572 22,000Payable to government agencies for taxes and statutory contributions 29,953 30,058Customers’ deposits 12,957 7,513Others 151,409 140,145
P=1,188,567 P=1,071,901
Trade payables are noninterest-bearing and generally settled within 30 to 60 days.
Other accruals primarily pertain to purchased molasses and biomass fuel, which were already received but not yet billed by the suppliers.
Payables to government agencies contributions for taxes and statutory and other payables are noninterest-bearing and are normally settled throughout the year.
Customers’ deposits represent noninterest-bearing cash deposits from customers, which will be applied against future deliveries of refined sugar.
Other payables include advances from previous related parties of SCBI to fund SCBI’s working capital requirements totaling P=128.9 million as at September 30, 2017 and 2016, which arenoninterest-bearing, unsecured and payable on demand.
Rollforward of provision for probable losses in September 30, 2017 and 2016 are as follows:
Note 2017 2016Beginning balance P=22,000 P=–Addition 23 74,572 22,000Ending balance P=96,572 P=22,000
17. Retirement Benefits
The Parent Company and its subsidiaries, namely: CACI, CADPI and SCBI, have individual and separate non-contributory defined benefit plan covering all qualified employees. RBCestimates its retirement benefits under R. A. No. 7641, Philippine Retirement Pay Law. A defined benefit plan is a retirement plan that defines an amount of retirement benefit to beprovided, usually as a function of one or more factors such as age, years of service or compensation. The plans are generally funded through payments to trustee-administered funds asdetermined by periodic actuarial calculations.
Retirement BenefitsNet retirement benefits expense recognized in the consolidated statements of income included in salaries and wages and employee benefits under “Cost of sales” and “General andadministrative expenses” account are as follows:
2017 2016 2015Current service cost P=54,102 P=46,332 P=41,067Net interest cost 11,849 6,158 1,614Past service cost – (6,966) –Adjustment due to curtailment – 3,209 2,180
P=65,951 P=48,733 P=44,861
The remeasurement losses (gains) recognized in the consolidated statements of comprehensive income are as follows:
2017 2016 2015Remeasurement losses (gains) on:
Defined benefit obligation due to: Changes in financial assumptions (P=36,468) P=24,776 P=1,529Experience adjustments (3,893) (15,883) (10,866)Changes in demographic assumptions 2,221 – 982
(38,140) 8,893 (8,355)Return on plan assets 5,894 47,766 33,036
(32,246) 56,659 24,681Deferred tax 9,370 (14,845) (7,404)
(P=22,876) P=41,814 P=17,277
Retirement Assets and LiabilitiesRetirement assets and liabilities recognized in the consolidated statements of financial position are as follows:
2017 2016Retirement liabilities (1) (P=316,758) (P=327,952)Retirement assets (2) 62,129 106,835Net retirement liabilities (P=254,629) (P=221,117)(1) Pertain to net retirement liabilities of CADPI, RBC and SCBI.(2) Pertain to net retirement assets of the Parent Company and CACI.
13. Investment Properties
Movements in investment properties are as follows:
Note 2017 2016At fair value: Balance at beginning of year P=320,812 P=311,110 Fair value adjustment 25 13,406 27,529 Reclassifications 12 14,717 (17,193) Others 332 (634)
P=349,267 P=320,812
Investment properties pertain to land of the Parent Company, NAVI, CADPI and SCBI held for rental and capital appreciation.
Rent income from the lease of agricultural land of NAVI amounted to P=6.8 million, P=7.7 million and P=6.3 million in 2017, 2016 and 2015, respectively (see Note 25). Direct operating expensesamounted to P=0.7 million, P=0.6 million and P=0.7 million in 2017, 2016 and 2015, respectively, which mainly pertain to real property taxes.
The fair value of investment properties is based on the appraised value of the property using a market data approach, as determined by a professionally qualified independent appraiser.Market data approach considers the sales and listings and other market data of comparable properties registered within the vicinity of the property being valued. Factors such as location,size, shape of lot, highest and best use estimate were also taken into consideration in order to estimate the fair value of the property. The fair value measurement for land has beencategorized as Level 2 (directly or indirectly observable inputs). The latest appraisal reports were made on various dates in 2017.
14. Short-term Borrowings
This account consists of unsecured short-term loans obtained from various local banks for the working capital requirements of the Group. The short-term borrowings are payable within 30to 90 days and bear interest ranging from 3.50% to 5.75% in 2017 and 2.75% to 3.75% in 2016.
In 2016, short-term loans amounting to P=1,400.0 million were reclassified as noncurrent liabilities, based on the approved 6-year Term Loan Facility dated September 30, 2016 amountingto P=1,800.0 million (see Note 15). On December 1, 2016, the P=1,400.0 million was availed against the 6-year Term Loan Facility to refinance the short-term loans.
Total interest expense arising from short-term borrowings amounted to P=164.1 million, P=169.0 million and P=29.2 million in 2017, 2016 and 2015, respectively (see Note 15).
15. Long-term Borrowings
The Group obtained various loans from local banks. Outstanding long-term borrowings are as follows:
Outstanding BalanceFacility Terms Collateral 2017 2016P=2,645.0 million dated
August 5, 2014Payable in equal quarterly amortization for seven years beginning
November 2016 and bears fixed interest of 4.50% for threeyears subject to repricing thereafter
Suretyship agreement andmortgage trustindenture (MTI)
P=2,314,375 P=2,645,000
P=1,227.0 million datedSeptember 10, 2014
Quarterly principal repayment amounting to P=49.0 million startingSeptember 2017 until June 2021 and a lump sum payment ofthe remaining balance on September 10, 2021 and bears fixedinterest of 4.50% subject to change as agreed by the parties
Suretyship agreement andMTI
1,178,000 1,227,000
P=1,400.0 million datedDecember 1, 2016 (Note 14)
Quarterly principal repayment amounting to P=66.7 million startingDecember 2017 until December 2022 and bears floatinginterest
Clean loan 1,400,000 –
P=800.0 million datedAugust 12, 2016
Quarterly principal repayment amounting to P=100.0 million startingNovember 2017 until December 2019 with one year graceperiod and bears fixed interest rate of 4.50% subject to changeas agreed by the parties
Suretyship agreement andMTI
800,000 800,000
P=380.0 million dated May 27,2014
Quarterly principal repayment amounting to P=13.6 million startingDecember 2017 until June 2021 and a lump sum payment of theremaining balance on September 10, 2021 and bears fixedinterest of 4.50% subject to change as agreed by the parties
Suretyship agreement andMTI
P=380,000 P=380,000
P=1,500.0 million datedFebruary 14, 2008 amendedon February 6, 2012
Payable in 15 equal consecutive quarterly installment beginningNovember 5, 2014 until May 5, 2018 and bears fixed interest of5.5%
Suretyship agreement andMTI
236 500
P=800.0 million datedFebruary 5, 2016 (Note 14)
Quarterly principal repayment amounting to P=38.1 million startingDecember 2017 until December 2022 and bears floatinginterest
Clean loan – 800,000
P=1,000.0 million datedSeptember 28, 2016(Note 14)
Quarterly principal repayment amounting to P=28.6 million startingDecember 2017 until December 2022 and bears floatinginterest
Clean loan – 600,000
Others 756 8226,073,367 6,453,322
Unamortized transaction costs (18,032) (17,802)6,055,335 6,435,520
Current portion (1,234,803) (379,954)Noncurrent portion P=4,820,532 P=6,055,566
Interest ExpenseInterest ranges from 3.00% to 5.79%, 3.00% to 5.50%, and 2.75% to 7.50% in 2017, 2016 and 2015, respectively. Interest expense arises from the following borrowings:
Note 2017 2016 2015Long-term P=273,717 P=213,742 P=242,170Short-term 14 164,080 169,028 29,185Convertible debt 18, 19 6,460 – –
P=444,257 P=382,770 P=271,355
Suretyship Agreements and MTIThe Group entered into various suretyship agreements and MTI with local bank creditors that secure the Group’s obligations in solidarity against all the properties of RHI, CADPI, CACI andRBC, including 28,549,365 HP Co. shares. Property, plant and equipment with a carrying amount of P=8,183.2 million were mortgaged and used as collateral to secure the loan obligationswith the local bank creditors (see Note 12). Carrying amount was determined by a professionally qualified independent appraiser in June 2016.
Loan CovenantsThe foregoing loan agreements, except for the Omnibus Loan and Security Agreement (OLSA) dated December 21, 2006, are subject to certain covenants, such as but not limited to:
∂ maintenance of debt service coverage ratio (DSCR) of at least 1.25 times and debt-to-equity ratio of not more than 70:30;
∂ prohibition on purchase of additional equipment, except in pursuance of its sugar expansion and ethanol project, unless the required financial ratios are maintained;

The RighT FundamenTals: SuStainability58
ANNUAL REPORT 2017 59
The schedule of projection of benefit payments expected to be paid out of the retirement fund is as follows:
Period 2017 2016Less than one year P=39,066 P=35,962Between one and five years 273,146 248,996Over five years 2,158,186 2,079,918
P=2,470,398 P=2,364,876
As at September 30, 2017 and 2016, the average duration of the defined benefit obligation at the end of reporting period is 14.4 years and 15.2 years, respectively.
18. Equity
a. Capital stock and treasury stock
Details of capital stock and treasury stock follow:
2017 2016 2015Number
of SharesAmount
(in Thousands)Number
of SharesAmount
(in Thousands)Number
of SharesAmount
(in Thousands)Authorized common shares “Capital A” at P=1.0 par valueBalance at beginning of year 1,500,000,000 P=1,500,000 1,500,000,000 P=1,500,000 1,500,000,000 P=1,500,000Additions 500,000,000 500,000 – – – –Balance at end of year 2,000,000,000 P=2,000,000 1,500,000,000 P=1,500,000 1,500,000,000 P=1,500,000
Issued common shares “Class A”Balance at beginning of year 1,439,442,161 P=1,439,442 1,169,288,884 P=1,169,289 1,168,976,425 P=1,168,976Issuances 125,156,985 125,157 270,153,277 270,153 312,459 313Balance at end of year 1,564,599,146 1,564,599 1,439,442,161 1,439,442 1,169,288,884 1,169,289Treasury stockBalance at beginning of year (17,643,480) (52,290) (17,643,480) (52,290) (259,424,189) (768,860)Issuances – – – – 241,780,709 716,570Balance at end of year (17,643,480) (52,290) (17,643,480) (52,290) (17,643,480) (52,290)
Issued and outstanding 1,546,955,666 P=1,512,309 1,421,798,681 P=1,387,152 1,151,645,404 P=1,116,999
In May 2016, the Parent Company issued 266,753,974 common shares from stock rights offering at P=4.19 a share Offer Price amounting to P=1,117.7 million, net of transaction costs ofP=4.4 million (see Note 1). The net proceeds from the stock rights offering were used to partially pay the loan obligations of RPBC and to acquire certain equipment for sugar millingand refining facilities of the Group.
The reacquired shares of RHI under its Share Buy Back Program totaled 259,424,189 shares at cost of P=768.9 million. In 2015, RHI issued 241,780,709 treasury shares at P=7.0 ashare aggregating to P=1,692.5 million. The transaction costs incurred in relation to the issuances of treasury shares amounted to P=12.4 million, which were accounted for as areduction in additional paid-in capital. There were no reacquisitions and issuances of treasury shares in 2017 and 2016.
On July 14, 2017, the Parent Company’s application for increase in authorized capital stock using the convertible debt securities as payment for subscription was approved by SEC.On November 9, 2017, the PSE approved the listing of these newly subscribed 125,000,000 common shares.
b. Other equity items and reserves
Details follow:
Note 2017 2016 2015Equity reserves:
Revaluation Increment on Land 12Balance at beginning of year P=2,657,525 P=2,476,063 P=2,476,063Appraisal increase, net of tax 114,842 181,462 –Balance at end of year 2,772,367 2,657,525 2,476,063
Cumulative Remeasurement Loss on Net Retirement Assets and Liabilities 17Balance at beginning of year (196,091) (154,073) (136,796)Remeasurement gain (loss), net of tax 22,830 (42,018) (17,277)Balance at end of year (173,261) (196,091) (154,073)
Share in Revaluation Increment on Land of an Associate 11 207,492 207,492 207,492Cumulative Share in Remeasurement Loss on Retirement Liability
of an Associate 11Balance at beginning of year (9,205) (6,175) (6,175)Share in remeasurement loss on retirement liability of an associate 39 (3,030) –Balance at end of year (9,166) (9,205) (6,175)
Total equity reserves 2,797,432 2,659,721 2,523,307Other equity items
Excess of Consideration Received over Carrying Amount of Net Assets of aSubsidiary Transferred to the Parent Company 577,148 577,148 577,148
Effect of Change in Equity Interest in Subsidiaries 44,567 44,567 44,567Total other equity items 621,715 621,715 621,715Total other equity items and reserves P=3,419,147 P=3,281,436 P=3,145,022
Following the Reorganization Program as approved by the SEC on December 11, 2001, RHI was transformed into a diversified holding and investment corporation, while its subsidiary,CADP Group Corporation (CADPGC), emerged as a holding and investment company with specific focus on sugar milling and refining business. In 2008, RHI increased its equityownership in CADPGC from 89.28% to 89.36% when CADPGC re-acquired portion of its shares of stock. On December 11, 2008, RHI acquired CADPGC’s sugar-related operatingsubsidiaries (CADPI, CACI, CADPI, CFSI, CCSI, JOMSI, NAVI) and an associate (HP Co.), including certain assets and liabilities of CADPGC. On January 23, 2009, RHI sold its investmentin CADPGC to Roxas & Company, Inc. Effective June 29, 2009, upon approval by the SEC on June 23, 2009, CADPGC, as the surviving entity, merged with Roxas & Company, Inc.through a share swap, wherein 11.71 CADPGC’s shares of stock were exchanged for every share of stock of Roxas & Company, Inc. On the same date, the SEC approved the changein corporate name of CADPGC to RCI.
The acquisition by RHI on December 11, 2008 of the sugar-related operating subsidiaries and an associate from CADPGC was made for a total consideration of P=3,838.0 million,which represents the cost of CADPGC’s investments in subsidiaries and an associate amounting to P=4,101.0 million, reduced by the net liabilities transferred by CADPGC amountingto P=263.0 million. As a result, RHI increased its effective equity ownership in the sugar-related operating subsidiaries and recognized the effect of the change in equity ownershipin subsidiaries and an associate in view of the reduction of non-controlling interests in subsidiaries of P=44.6 million and presented as a separate component of the total consolidatedequity.
On January 23, 2009, following the acquisition of the sugar-related operating subsidiaries and an associate from CADPGC, RHI sold its investment in CADPGC to RCI for a totalconsideration of P=3,927.3 million. The excess of consideration received from RCI over the carrying amounts of net assets of CADPGC amounted to P=577.1 million. This is presentedas a separate component of equity under “Other equity reserves”.
Components of net retirement liabilities:
2017 2016Present value of defined benefit obligation (P=569,065) (P=560,012)Fair value of plan assets 314,436 338,895
(P=254,629) (P=221,117)
The movements in net retirement assets (liabilities) are as follows:
2017 2016
Net Retirement AssetsNet Retirement
Liabilities Net Retirement AssetsNet Retirement
LiabilitiesBalance at beginning of year P=106,835 (P=327,952) P=113,932 (P=232,908)Remeasurement gain (loss) recognized in other comprehensive income (40,710) 72,956 (6,631) (50,028)Retirement benefits expense (3,996) (61,955) (3,717) (45,016)Benefits paid from Group funds – 193 3,251 –Balance at end of year P=62,129 (P=316,758) P=106,835 (P=327,952)
Changes in the Present Value of the Defined Benefit Obligation
2017 2016
Net Retirement AssetsNet Retirement
Liabilities Net Retirement AssetsNet Retirement
LiabilitiesBalance at beginning of year P=86,952 P=473,060 P=78,611 P=429,918Current service cost 6,027 48,075 5,577 40,755Remeasurement losses (gains) due to: Changes in financial assumptions (5,623) (30,845) 4,480 20,296 Experience adjustments 458 (4,351) (472) (15,411) Changes in demographic assumptions – 2,221 – –Benefits paid (1,391) (29,253) (8,577) (16,018)Interest cost 3,760 19,975 3,773 20,837Past service cost – – – (6,966)Adjustment due to curtailment – – 3,560 (351)Balance at end of year P=90,183 P=478,882 P=86,952 P=473,060
Changes in the Fair Value of Retirement Plan Assets
2017 2016
Net Retirement AssetsNet Retirement
Liabilities Net Retirement AssetsNet Retirement
LiabilitiesBalance at beginning of year P=193,785 P=145,110 P=192,543 P=197,010Return on plan assets (45,874) 39,980 (2,625) (45,141)Benefits paid (1,391) (29,061) (5,326) (16,018)Interest income on plan asset 5,791 6,096 9,193 9,259Balance at end of year P=152,311 P=162,125 P=193,785 P=145,110
The expected return on plan assets were determined based on a reputable fund trustee’s yield rate for risk portfolio similar to that of the fund with consideration to the funds’ pastperformance.
The categories of the plan assets are as follows:
2017 2016Cash 39.2% 7.7%Receivables 17.3% 20.1%AFS financial assets 14.0% 32.8%Investments in properties 0.1% 26.2%Investments in government securities 29.4% 13.2%
100.0% 100.0%
As at September 30, 2017 and 2016, plan assets include investments in 27.4 million shares of stock of the Parent Company with a fair value amounting to P=120.4 million and P=90.0 million,respectively.
The principal assumptions used in determining the retirement assets and liabilities of the Group are shown below:
Discount Rate Salary Increase Rate2017 2016 2017 2016
RHI 4.8% 4.8% 4.0% 4.0%CADPI 4.2% 4.7% 4.0% 4.0%CACI 4.3% 4.8% 4.0% 4.0%RBC 4.8% 4.9% 4.0% 4.0%SCBI 5.0% 4.8% 5.0% 5.0%
As at September 30, 2017, the Group’s discount and salary increase rate are as follows:
Discount Rate Salary Increase RateRHI 4.9% 4.0%CADPI 4.9% 4.0%CACI 4.9% 4.0%RBC 5.2% 4.0%SCBI 5.1% 4.0%
The Group does not expect to contribute to their respective retirement funds in 2018.
The sensitivity analysis based on reasonably possible changes of the assumptions as at September 30, 2017 and 2016 is presented below.
Change Effect on Retirement Assets/Liabilitiesin Assumption 2017 2016
Discount rate +1.0% (P=46,724) (P=48,545)-1.0% 54,176 56,502
Salary Rate +1.0% 54,124 56,050-1.0% (47,527) (49,078)
Each sensitivity analysis on the significant actuarial assumptions was prepared by remeasuring the retirement liability at the end of each reporting date after adjusting one of the currentassumptions according to the applicable sensitivity increment or decrement (based on changes in the relevant assumption that were reasonably possible at the valuation date) while allother assumptions remained unchanged. The corresponding change in the retirement liability was expressed as a percentage change from the base retirement liability.

The RighT FundamenTals: SuStainability60
ANNUAL REPORT 2017 61
Related Party Relationship Nature of Transaction Year
Transactionsduring the
Year
Dividend Receivable (see Note 8)
TradeReceivables
Net AmountDue from
Related Parties(see Note 8)
Net AmountDue to Related
Parties(see Note 16)
CACI Retirement Fund,Inc. (CACIRFI)
Retirement Fundof CACI
Noninterest-bearing advancespayable on demand
2017 P=138 P= P= P=138 P=28,1462016 (5,806) 28,146
Roxas Foundation, Inc. Affiliate Noninterest-bearing advancespayable on demand
2017 252 252 2016
HP Co Associate Sale of raw sugar 2017 381,483 2,106 2016 146,119
Purchase of molasses 2017 236,418 2016 157,420
Purchase of bagasse 2017 12,856 2016 54,211
Purchase of raw sugar 2017 125,383 2016
Dividend income 2017 109,916 2016 234,960 102,492
FPNHR Stockholder Interest-bearing convertible debtsecurities (Note 1) 2017 523,750 – –
Interest expense 2017 6,460 – 6,4602017 P= P=2,106 P=57,821 P=103,7242016 102,492 37,525 98,936
a. The Group made advances to RHIRFI, CADPIRFI and CACIRFI for a portion of the retirement payments made to the Group’s qualified retired employees under defined benefit plan.As at September 30, 2017 and 2016, advances to RHIRFI, CADPRFI and CACIRFI are included in “Trade and other receivables” account.
b. Due to related parties, which are presented as part of “Trade and other payables” account, represents noninterest-bearing payable arising from advances and rent of office spacefrom CADPRFI.
c. RCBC, a creditor of CADPI and CACI, owns 34.5 million shares or 2.99% interest in RHI as at September 30, 2016. As at September 30, 2017, RCBC no longer holds any interest inRHI.
d. As at September 30, 2017 and 2016, total amount of trade and non-trade receivables and payables with related parties eliminated during consolidation amounts to P=14,652.2 millionand P=8,225.2 million, respectively, while revenue and expense eliminated amounts to P=3,477.0 million, P=2,572.5 million and P=2,565.2 million as at September 30, 2017, 2016 and2015, respectively.
Outstanding balances of transactions with related parties at yearend are unsecured and settlements are made in cash. The Group did not recognize any provision for impairment loss in 2017, 2016and 2015. This assessment is undertaken each financial year by reviewing the financial position of the related party and the market in which the related party operates.
Key management personnel compensation:
Note 2017 2016 2015Salaries and wages and other short-term benefits P=92,519 P=138,199 P=174,186Employee stock option 20 1,917 712 12,981
P=94,436 P=138,911 P=187,167
20. Employee Stock Option Plans (ESOP)
The BOD of the Company approved the establishment of its first and second ESOP on May 8, 2013 and January 16, 2014, respectively. The ESOPs cover all employees of the Company andits subsidiaries, namely: CACI, CADPI and RBC, who have rendered at least six months of service at the time of grant, subject for approval by the Senior Vice President, Human Resource,and the designated administrator. Employees are given the option to purchase the shares allocable to them over an exercise period of five years from the effectivity date of ESOP. Theshare options vest each year over the five-year term of ESOP. The offer price of the shares is based on the average quoted price during the 30-trading days prior to exercise date less a 15%discount. About 35.0 million and 30.0 million common shares of the Company’s unissued shares have been initially reserved under the first and second ESOP, respectively.
Movements of the number of share options for the first and second ESOP are as follows:
First ESOP Second ESOP2017 2016 2017 2016
Balance at beginning of year 16,110,376 25,484,628 24,460,832 36,256,323Forfeited or expired (302,908) (6,142,744) (1,507,107) (11,478,188)Exercised (156,985) (3,231,508) (317,303)Balance at end of year 15,650,483 16,110,376 22,953,725 24,460,832
Exercisable at end of year 11,409,605 10,109,015 11,145,620 6,340,876
In 2017, the Company issued 156,985 and nil common shares pertaining to the exercise of stock option of employees under First ESOP and Second ESOP, respectively, and amounting toP=0.4 million (see Note 18). In 2016, the Company issued 3.2 million and 317,303 common shares pertaining to the exercise of stock option of employees under First ESOP and Second ESOP,respectively, and amounting to P=7.0 million (see Note 18). The weighted-average share price at the date of exercise for share options under the First ESOP was P=3.44.
The fair value of the First and Second ESOP was estimated at the date of grant using Black Scholes-Merton model with the following inputs as follows:
First ESOPOptions Vesting After
Year One Year Two Year Three Year Four Year FiveSpot price P=2.80 P=2.80 P=2.80 P=2.80 P=2.80Strike price P=2.49 P=2.49 P=2.49 P=2.49 P=2.49Expected volatility 38.83% 39.10% 36.59% 39.61% 42.46%Risk-free rate 2.71% 2.98% 3.29% 3.60% 3.36%Dividend rate as a percentage of spot price 0.00% 0.00% 0.00% 0.00% 0.00%
Second ESOPOptions Vesting After
Year One Year Two Year Three Year Four Year FiveSpot price P=6.90 P=6.90 P=6.90 P=6.90 P=6.90Strike price P=5.32 P=5.32 P=5.32 P=5.32 P=5.32Expected volatility 33.46% 39.77% 39.71% 37.65% 39.95%Risk-free rate 2.86% 2.82% 3.15% 3.90% 3.38%Dividend rate as a percentage of spot price 0.00% 0.00% 0.00% 0.00% 0.00%
c. Track record of registration
On March 16, 1994, the Parent Company registered with the SEC its 1,000.0 million shares, consisting of 600.0 million Class “A” shares and 400.0 million Class “B” shares at a parvalue of P=1.0 a share equivalent to P=1,000,000,000, and representing the entire capital stock of the Parent Company. Moreover, the SEC licensed the sale or offer for sale of theParent Company’s 477,750,000 shares (inclusive of its present subscribed capital stock of 382,200,000 shares), out of which 95,550,000 shares were sold at P=3.0 a share.
On September 4, 1995, the SEC licensed the sale or offer for sale of 174,400,000 shares in an initial public offering at an offer price between P=5.0 to P=8.0 a share. The said sharesconsist of 100.0 million shares from the Parent Company’s registered but unlicensed and unissued capital stock for primary offering and 74,400,000 shares owned by sellingshareholders for secondary offering.
On January 28, 1997, the Parent Company declared stock dividend at the rate of 30% payable to stockholders of record as at February 28, 1997.
On November 24, 1999 and December 15, 1999, the Parent Company declared stock dividend at the rate of 30%, consisting of 225,322,500 common shares at P=1.0 a share, payableto stockholders of record as at February 15, 2000.
On January 30, 2003, the SEC approved the Parent Company’s increase in authorized capital stock from P=1,000,000,000 to P=1,500,000,000, divided into 1,500,000,000 commonshares. Of the total increase in authorized capital stock, 192,779,459 common shares at par value of P=1.0 a share or total of 192,779,459 common shares, were fully paid throughthe declaration of stock dividend at the rate of 20% to stockholders of record as at February 28, 2003.
On April 3, 2003, the PSE approved the listing of additional 192,779,459 common shares, at a par value of P=281.0 a share, representing the 20% stock dividend declaration discussedin the foregoing. Moreover, the Parent Company’s listed shares were reduced by 188 common shares representing fractional shares arising from the 30% stock dividend declaredin 1997 and 30% stock dividends declared in 2000, which were paid for in cash.
On February 15, 2017, the shareholders approved the amendment of the Parent Company’s articles of incorporation to increase the authorized capital stock from 1,500,000,000 to2,000,000,000 divided into 2,000,000,000 with par value of P=1.0 per share. On the same day, the shareholders approved the subsequent conversion of the convertible note to beissued out of the increase in authorized capital stock at a conversion rate of P=4.19 for every common share, or a total of 125,000,000 new common shares.
On July 14, 2017, the Parent Company’s application for increase in authorized capital stock was approved by SEC. On November 9, 2017, the PSE approved the listing of these newlysubscribed 125,000,000 common shares.
d. Retained earnings
Retained earnings not available for dividend declaration
Note 2017 2016Deferred tax assets 26 P=472,159 P=619,522Accumulated earnings of subsidiaries 302,827 240,100Cumulative unrealized gain on changes in fair value of investment properties,
net of tax 26 158,064 134,377Treasury stock 52,290 52,290
P=985,340 P=1,046,289
Accumulated earnings of the subsidiaries are not yet available for dividend distribution to the Parent Company’s stockholders, unless received as cash dividends from the subsidiariesand an associate.
Dividend declarationCash dividends declared and paid by the Parent Company are as follows:
Date Approved Amount per Share Total AmountStockholders of
Record Date Date PaidAugust 19, 2015 P=0.12 P=138,198 September 4, 2015 September 25, 2015December 17, 2014 0.12 109,146 December 22, 2014 January 15, 2015
e. Share prices
The principal market for the Parent Company’s shares of stock is the PSE. The high and low trading prices of the Parent Company’s shares of stock for each quarter within the threefiscal years are presented in the next page.
Quarter High LowOctober 1, 2016 through September 30, 2017 First P=3.04 P=2.98 Second 3.00 2.87 Third 3.83 3.67 Fourth 4.19 4.10October 1, 2015 through September 30, 2016 First 5.86 4.43 Second 6.19 4.00 Third 4.65 4.01 Fourth 3.98 3.19October 1, 2014 through September 30, 2015 First 6.94 6.75 Second 6.80 6.66 Third 6.39 6.24 Fourth 5.78 5.47
19. Related Party Transactions and Balances
In the normal course of business, the Group has transactions with related parties as follows:
Related Party Relationship Nature of Transaction Year
Transactionsduring the
Year
Dividend Receivable (see Note 8)
TradeReceivables
Net AmountDue from
Related Parties(see Note 8)
Net AmountDue to Related
Parties(see Note 16)
CADP Retirement Fund,Inc. (CADPRFI)
Retirement Fundof CADPI
Noninterest-bearing advancespayable on demand
2017 P=24,354 P= P= P=57,425 P=14,1182016 (4,991) 37,525 15,790
RHI Retirement Fund,Inc. (RHIRFI)
Retirement Fundof RHI Noninterest-bearing advances
payable on demand2017 6 6 55,0002016 (716) 55,000
(Forward)

The RighT FundamenTals: SuStainability62
ANNUAL REPORT 2017 63
The amount of personnel costs are allocated as follows:
Note 2017 2016 2015Cost of sales 22 P=413,685 P=349,365 P=354,885General and administrative expenses 23 399,888 305,323 389,742
P=813,573 P=654,688 P=744,627
25. Other Income
This account consists of:
Note 2017 2016 2015Storage, handling and insurance fees P=36,956 P=36,563 P=51,878Sales of scrap 20,913 3,124 15,301Unrealized gain on fair value adjustment of investment properties 13 13,406 27,529 –Rent income 8 8,575 13,075 6,649Interest income 7, 8 3,384 3,401 2,558Others 10,561 5,813 7,974
P=93,795 P=89,505 P=84,360
Other income - others in 2017 mainly pertains to sale of woodchips and reversals of various accruals.
26. Income Taxes
a. The components of the recognized net deferred tax assets and liabilities represent the tax effects of the following temporary differences:
2017 2016
NoteNet DeferredTax Assets(1)
Net DeferredTax Liabilities(2)
Net DeferredTax Assets(1)
Net DeferredTax Liabilities(2)
Deferred tax assets on: NOLCO P=153,762 P=48,246 P=158,541 P=55,863 Retirement liabilities 17 90,959 279 94,480 215 Various accruals 41,451 13,759 45,408 8,544 Unamortized past service cost 29,308 – 36,232 – Allowances for: Impairment losses of receivables 8 26,150 – 24,160 – Inventory losses and obsolescence 9 9,011 – 7,870 – Impairment loss on CWT – – 3,663 – Excess MCIT 33,725 5,845 6,613 1,110 Employee stock option 13,910 4,271 12,678 3,560 Customer’s deposits 2,064 – 2,243 –
400,340 72,400 391,888 69,292Deferred tax liabilities on: Unamortized capitalized interest 12 (73,153) (4,678) (83,094) (4,974) Revaluation increment on land, depreciable assets, and asset transferred to subsidiaries (51,154) (1,227,815) (48,209) (1,166,065) Unamortized transaction cost (4,947) (462) (5,128) (595) Retirement assets 17 (247) (18,530) (2,420) (29,300) Deferred milling costs – (1,056) – –
(129,501) (1,252,541) (138,851) (1,200,934)Net deferred tax assets (liabilities) P=270,839 (P=1,180,141) P=253,037 (P=1,131,642) (1) Recognized net deferred tax assets of CADPI, CACI, RBC and RPBC(2) Recognized net deferred tax liabilities of RHI, NAVI and SCBI
Details of other deductible temporary differences for which no deferred tax assets were recognized as management believes that it may not be probable that sufficient future taxableprofits will be available against which the other deductible temporary differences can be utilized are as follows:
2017 2016NOLCO P=34,242 P=–Allowance for impairment losses of receivables 4,716 5,977Provision for inventory losses and obsolescence 3,752 3,752
P=42,710 P=9,729
b. Details of carry forward benefits arising from NOLCO and excess MCIT are as follows:
NOLCO
Year Incurred
Balance as atSeptember 30,
2016 Additions Applied
Balance as atSeptember 30,
2017 Available UntilRecognized:September 30, 2017 P= P=94,671 P= P=94,671 September 30, 2020September 30, 2016 512,664 21,518 491,146 September 30, 2019September 30, 2015 202,016 80,231 121,785 September 30, 2018
P=714,680 P=94,671 P=101,749 P=707,602
Excess MCIT
Year Incurred
Balance as atSeptember 30,
2016 Additions Applied
Balance as atSeptember 30,
2017 Available UntilRecognized:September 30, 2017 P= P=31,847 P= P=31,847 September 30, 2019September 30, 2016 1,599 1,599 September 30, 2019September 30, 2015 6,124 6,124 September 30, 2018
P=7,723 P=31,847 P= P=39,570
The weighted average fair value of the share options granted in 2013 (First ESOP) and 2014 (Second ESOP) amounted to P=0.9 and P=3.0, respectively. The volatility rate is determined as thehistorical volatility of the returns on the stock over a period similar to the vesting period of the option.
The weighted average remaining contractual life of the outstanding stock options is 1.25 years and 1.33 years as at September 30, 2017 and 2016, respectively.
The employee stock option expense recognized for employee services received amounted toP=5.3 million, P=1.4 million and P=35.1 million in 2017, 2016 and 2015, respectively, presented aspart of “Personnel costs” account (see Note 24).
21. Revenue
The components of revenue are as follows:
2017 2016 2015Sale of goods: Refined sugar P=4,192,991 P=3,843,345 P=2,518,987 Alcohol 3,602,242 4,201,952 2,592,835 Raw sugar 2,384,628 3,357,272 2,247,077 Molasses 474,805 353,756 418,204 Carbon dioxide 10,526 8,215 38,336
10,665,192 11,764,540 7,815,439Sale of services: Tolling fees 243,546 252,979 385,254 Power 16,366 30,966 7,703 Farm services 22,429 1,749 –
282,341 285,694 392,957P=10,947,533 P=12,050,234 P=8,208,396
22. Cost of Sales
Note 2017 2016 2015Direct materials used 9 P=5,194,664 P=6,245,422 P=3,207,261Planters’ subsidy and productivity assistance 28 1,034,022 1,343,626 1,025,722Depreciation and amortization 12 879,086 858,215 752,067Fuel and oil 710,647 991,840 771,189Personnel costs 24 413,685 349,365 354,885Repairs and maintenance 381,416 370,637 282,076Outside services 195,195 108,984 68,786Rent 28 182,840 156,534 102,568Materials and consumables 176,410 212,143 243,143Taxes and licenses 124,587 127,425 131,871Communication, light and water 107,041 98,156 130,425Others 9 91,053 114,391 94,192
P=9,490,646 P=10,976,738 P=7,164,185
23. Operating Expenses
General and Administrative Expenses
The components of general and administrative expenses are as follows:
Note 2017 2016 2015Personnel costs 24 P=399,888 P=305,323 P=389,742Taxes and licenses 117,571 92,986 180,950Outside services 113,797 117,003 102,782Provision for probable losses 16, 28 74,572 22,000 Depreciation and amortization 12 71,753 69,298 45,168Insurance 42,604 34,629 34,871Professional fees 32,539 31,802 36,839Rent 28 27,951 27,867 14,422Travel and transportation 22,545 29,334 27,523Communication, light and water 20,809 33,403 10,599Repairs and maintenance 14,566 14,982 10,798Materials and consumables 6,029 7,733 5,306Corporate social responsibility 5,161 7,024 13,427Provision for (reversal of provision for) impairment losses
on receivables 8 (9,257) 5,831 1,386Entertainment, amusement, recreation 3,860 4,082 3,394Organizational activities 15,337 13,273 11,833Others 9 48,223 79,629 111,915
P=1,007,948 P=896,199 P=1,000,955
Others mainly pertain to training and development, transfer cost and bank charges.
Selling Expenses
Selling expenses mainly pertains to delivery charges, sugar liens and dues and monitoring fees totaling P=57.9 million, P=69.4 million and P=63.0 million in 2017, 2016 and 2015, respectivelyrepresenting mandatory fees paid to various regulatory agencies prior to sale of sugar.
24. Personnel Costs
Personnel costs include:
Note 2017 2016 2015Salaries, wages, allowances and other employee benefits P=742,365 P=604,515 P=664,713Retirement benefits 17 65,951 48,733 44,861Employee stock option 20 5,257 1,440 35,053
P=813,573 P=654,688 P=744,627

The RighT FundamenTals: SuStainability64
ANNUAL REPORT 2017 65
28. Commitments and Contingencies
a. Milling Contracts
CACI and CADPI (the “Mills”) have milling contracts with the planters, which provide for a 35% and 65% sharing between the Mills and the planters, respectively, of sugar, molassesand other sugar cane by-products, excluding bagasse, produced every crop year.
In June 2015, milling contracts of CADPI with the planters were revised to provide for a 33% and 67% sharing between CADPI and the planters, respectively. This agreement iseffective until crop year 2016 to 2017. Renewal is upon mutual consent of both parties thereafter.
b. The Group has in its custody the following raw and refined sugar owned by third parties:
2017 2016
Total Volume(in Thousands)
(LKg*)
EstimatedMarket Value
(Amountsin Millions)
Total Volume(in Thousands)
(LKg*)
EstimatedMarket Value
(Amountsin Millions)
Raw sugar 426 P=511 40 P=64Refined sugar 443 841 254 559
*Equivalent to 50 kilogram bag unit.
The foregoing volume of sugar is not reflected in the consolidated statements of financial position since these are not considered as assets of the Group. These raw sugar held onbehalf of the third parties are also supported by quedans. The Group is accountable to the third parties for the value of trusted sugar or their sales proceeds.
c. Sales Contracts
CADPI and RBC entered into various sales contracts with its major customers for the sale of raw sugar, refined sugar and molasses. Outstanding sales contracts for refined sugaramounted to P=765.0 million for 335,773 lkg bags, P=575.6 million for 231,622 lkg bags and P=1,362.0 million for 679,258 lkg bags as at September 30, 2017, 2016 and 2015,respectively, and P=897.8 million for 19,240,000 liters liters, P=63.8 million for 1,051,000 liters and P=0.1 million for 500 liters for anhydrous alcohol as at September 30, 2017, 2016 and2015, respectively.
d. Crop Loan and Contract Growing Agreements
RABDC entered into crop loan and contract growing agreements with various planters for the scheduled delivery of sugar cane for the crop year 2016 to 2017. These agreementsare effective as at September 30, 2016. Advances made to planters related to these agreements as at September 30, 2017 and 2016 amounted to P=23.6 million and P=144.3 million,respectively, which are included as part of “Due from planters and cane haulers” under “Trade and other receivables” account (see Note 8).
e. Leases
The Group has various lease agreements for a period of one year covering heavy loading equipment and service vehicles with various trucking and heavy equipment servicecompanies, which are used in transloading, hauling and other milling operations. The lease agreements are renewable annually upon mutual consent of both parties.
Moreover, the Group, as a lessee, leases its office space from a third party for a period of five years until May 31, 2021, which is renewable upon mutual agreement of the parties.
Future minimum lease payments on its office space as at September 30, 2017 are as follow:
Within one year P=15,939After one year but not more than five years 48,845
P=64,784
Total rent expense from the related contracts amounted to P=210.8 million, P=184.4 million and P=117.0 million in 2017, 2016 and 2015, respectively.
f. Hauling Services Contracts
The Group has an agreement for hauling services for the transport of sugarcane from the plantations to milling facilities. Related hauling expenses, which are presented as part of“Planters’ subsidy and productivity assistance” account under “Cost of goods sold”, amounted to P=1,034.0 million, P=1,343.6 million and P=1,025.7 million in 2017, 2016 and 2015,respectively (see Note 22).
g. Emission Reduction Purchase Agreement (ERPA)
On January 14, 2009, RBC and World Bank Group signed a $3.2 million ERPA for the purchase of carbon emission credits under the Clean Development Mechanism of the KyotoProtocol. The ERPA will also avoid at least 50,000 metric tons of carbon dioxide each year with a crediting period of 10 years starting 2010. As part of the ERPA, portion of therevenue for the purchase of the credits will be used to finance the RBC’s community development projects.
h. Fuel Ethanol Supply Agreement (FESA)
SCBI has an existing FESA with Petron Corporation, wherein SCBI will exclusively supply fuel ethanol from the integrated ethanol distillery to Petron Corporation for a period of 10years until 2018. The pricing, delivery, acceptance and payment terms are set out in the FESA.
i. Unused Credit Lines
The Group has unused lines of credit with various local banks amounting to P=800.0 million and P=1,935.7 million as at September 30, 2017 and 2016, respectively.
j. Contingencies
The Group has several pending claims and assessments. The ultimate outcome of which, based on management’s and legal counsel’s opinion, will not have a material impact onthe consolidated statements of financial position and the consolidated statements of comprehensive income, except for certain disputed claims.
Outstanding provision for losses for disputed claims and assessments amounted to P=96.6 million and P=22.0 million as at September 30, 2017 and 2016, presented under “Trade andother payables” account (see Note 16).
c. The reconciliation between the income tax expense (benefit) computed at the applicable statutory tax rate and income tax expense (benefit) presented in the consolidated statementsof income is as follows:
2017 2016 2015Income tax expense (benefit) at statutory tax rate P=32,519 P=8,055 (P=21,689)Tax effects of: Net income subject to income tax holiday (ITH) (58,482) (23,482) (63,227) Share in net earnings of an associate (20,333) (63,677) (40,327) Nondeductible expenses 16,864 17,726 25,829 Interest subject to final tax (1,015) (361) (390) Effect of 5% statutory tax rate of SCBI 1,704 (10,873) (7,348) Unallowable interest expense 68 53 40Adjustments resulting from derecognition of deferred tax assets 8,604 – –Others 8,427 (2,182) 16,261
(P=11,644) (P=74,741) (P=90,851)
The current income tax expense of the Group in 2017, 2016 and 2015 pertains to RCIT, or MCIT, whichever is higher, except for RBC and SCBI, which are entitled to ITH and 5% grossincome tax, respectively.
d. Registration with the Board of Investments (BOI) of RBC
On October 24, 2008, the BOI approved the registration of RBC as a New Producer of Bioethanol (Anhydrous) and Potable (Hydrous) Ethanol on a Pioneer and Non-Pioneer Statusunder the Omnibus Investments Code of 1987 or Executive Order (E.O.) No.226. Under the terms of its registration, RBC is required to achieve certain production and sales volumefor both anhydrous and hydrous ethanol.
On October 22, 2014, the BOI approved the amendment of registration of RBC from a New Producer of Bioethanol (Anhydrous) under E.O. No. 226 to Renewable Energy (R.E.)Developer of Biomass Resources under the Republic Act (R.A.) No. 9513. The registration as a New Producer of Potable Ethanol is maintained under E.O. No. 226.
As a registered enterprise, RBC is entitled to certain tax incentives, which include, among others:
∂ ITH for the first seven years from the start of commercial operations;
∂ Duty-free importation of machinery, equipment and materials including control and communication equipment within the first ten years from the issuance of the BOI certificateof registration until October 23, 2018;
∂ Realty and other taxes on civil works, equipment, machinery, and other improvements actually and exclusively used for R. E. facilities shall not exceed one and a half (1.5%)of the original cost less accumulated depreciation or net book value;
∂ NOLCO during the first three years from the start of commercial operation shall be carried over as a deduction from gross income for the next seven consecutive taxable yearsimmediately following the year of such loss is unused;
∂ Corporate tax rate of 10% on its net taxable income after seven years of ITH;
∂ If RBC did not avail of the ITH, the plant, machinery and equipment that are reasonably needed and actually used for the exploration, development and utilization of R. E.resources may be depreciated using a rate not exceeding twice the rate which would have been used had the annual allowance been computed; and
∂ Zero percent value-added tax rate on its purchase of local supply of goods, properties and services needed for the development, construction and installation of its plantfacilities.
Under the terms of its registration, RBC is required to achieve certain production and sales volume for ethanol.
Total tax incentives availed of amounted to P=18.5 million, P=7.7 million and P=62.0 million in 2017, 2016 and 2015, respectively.
e. Income Tax Regime of SCBI
SCBI is registered with the Philippine Economic Zone Authority (PEZA) as an Agro-industrial Ecozone Enterprise under Registration Certificate No.09-01-AI dated September 23, 2009.
The following are the mutual covenants and undertaking of SCBI pursuant to Registration Agreement with the PEZA:
i. The registration as an Agro-Industrial Ecozone Enterprise entitles SCBI to conduct and operate its business inside the San Carlos Ecozone.
ii. The scope of SCBI’s registered activity is limited to the production of bioethanol fuel and its by-products, power/electricity, carbon dioxide, and carbon emission reduction(known as carbon credits) and importation of raw materials, machinery, equipment, tools, goods, wares, articles or merchandise directly used in its registered operations atthe San Carlos Ecozone.
iii. SCBI is not entitled to a separate ITH incentive. The incentives entitlement of SCBI is the remaining ITH period granted in its registration with the BOI until December 2014.Upon expiry of the ITH under BOI registration, SCBI is entitled to the 5% Gross Income Tax (GIT) incentive, in lieu of paying of all local and national internal revenue taxes,and other incentives under Article 77, Book VI of E.O. No. 226.
The PEZA approved SCBI’s amendment in its registered activity to include the production of syrup from sugarcane, which will be subjected to 5% gross income tax, until October 1,2015. The results of operations from said registered product thereafter is subjected to national taxes.
27. Earnings per Share
Earnings per share is computed as follows:
2017 2016 2015Basic Diluted Basic Diluted Basic Diluted
Net income attributable to the equity holders of the ParentCompany (a) P=119,777 P=119,777 P=101,244 P=101,244 P=10,832 P=10,832
Weighted average number of common shares outstandingfor basic EPS 1,449,038 1,449,038 1,421,798 1,421,798 1,151,645 1,151,645Average incremental number of shares under ESOP 29,867 – 18,716 – 34,784
Weighted average number of common shares adjustedfor effect of dilution (b) 1,449,038 1,478,905 1,421,798 1,440,514 1,151,645 1,186,429
Earnings per share (a/b) P=0.08 P=0.08 P=0.07 P=0.07 P=0.01 P=0.01

The RighT FundamenTals: SuStainability66
ANNUAL REPORT 2017 67
The tables below show the credit quality of financial assets which are neither past due nor impaired and an aging analysis of past due but not impaired accounts.
2017Neither past due nor impaired Past due but not impaired
High Standard Substandard Over 30 Over 90 Over 180 Grade Grade Grade Days Days Days Impaired Total
Cash and cash equivalents P=570,337 P=– P=– P=– P=– P=– P=– P=570,337Trade receivables 617,010 1,179,467 – 78,312 31,009 89,223 18,731 2,013,752Due from employees – 61,345 – – – – 1,929 63,274Due from related parties – 57,821 – – – – – 57,821Other receivables – – – – – 59,577 8,858 68,435
P=1,187,347 P=1,298,633 P=– P=78,312 P=31,009 P=148,800 P=29,518 P=2,773,619
2016Neither past due nor impaired Past due but not impaired
High Standard Substandard Over 30 Over 90 Over 180 Grade Grade Grade Days Days Days Impaired Total
Cash and cash equivalents P=703,910 P=– P=– P=– P=– P=– P=– P=703,910Trade receivables 19,489 35,801 – 211,483 178,075 405,387 39,176 889,411Dividend receivable 102,492 – – – – 102,492Due from employees – 16,079 – 11,302 30,891 – 733 59,005Due from related parties – 18,074 – 12,910 6,541 – – 37,525Other receivables – 52,556 – – 1,127 19,584 8,858 82,125
P=825,891 P=122,510 P=– P=235,695 P=216,634 P=424,971 P=48,767 P=1,874,468
Impairment assessmentThe main consideration for impairment assessment includes whether there are known difficulties in the cash flow of the counterparties. The Group assesses impairment in two ways:individually and collectively.
First, the Group determines allowance for each significant receivable on an individual basis. Among the items that the Group considers in assessing impairment is the inability to collectfrom the counterparty based on the contractual terms of the receivables. Receivables included in the specific assessment are the accounts that have been endorsed to the legal department,non-moving accounts receivable and other accounts of defaulted counterparties.
For collective assessment, allowances are assessed for receivables that are not individually significant and for individually significant receivables where there is no objective evidence ofindividual impairment. Impairment losses are estimated by taking into consideration the age of the receivables, past collection experience and other factors that may affect their collectibility.
Commodity price riskThe Group is exposed to commodity price risk from conventional physical sales and purchase of sugar and alcohol managed through volume, timing and relationship strategies. The Groupdoes not enter into commodity derivatives.
The Group’s sales commitments are contracted at fixed prices, and thus have no impact on the consolidated cash flows in the next 12 months.
Interest rate riskThe primary source of the Group’s interest rate risk relates to interest-bearing financial liabilities. The interest rates on these liabilities are disclosed in Notes 14 and 15.
The loans amounting to P=1,400.0 million and P=356.3 million as at September 30, 2017 and 2016, respectively, bear floating interest and expose the Group to interest rate risk.
The following table demonstrates the sensitivity analysis to a reasonably possible change in interest rates, with all other variables held constant, of the Group’s income before income tax(through the impact of floating rate borrowings) and equity in 2017 and 2016. The estimates are based on the outstanding interest bearing liabilities of the Group with floating interest rateas at September 30, 2017 and 2016.
2017 2016Increase (Decrease) Effect on Income before Tax Effect on Equity Effect on Income before Tax Effect on Equity
0.25% (P=3,500) (P=2,450) (P=890) (P=623)(0.25%) 3,500 2,450 890 623
Interest on financial liabilities with fixed interest rate is fixed until the maturity of the instrument (see Notes 14 and 15).
The other financial instruments of the Group that are not included in the foregoing tables are noninterest-bearing and are therefore not subject to interest rate risk.
Capital ManagementThe primary objective of the Group’s capital management is to ensure that it maintains strong credit and healthy capital ratios in order to support its business and maximize shareholdervalue.
The Group’s dividend declaration is dependent on availability of earnings and operating requirements. The Group manages its capital structure and makes adjustment to it, in light ofchanges in economic conditions. To maintain or adjust capital structure, the Group may adjust the dividend payment to shareholders, return capital to shareholders or issue new shares.No changes were made in the objectives, policies or processes for the years ended September 30, 2017 and 2016.
Management considers the total consolidated equity reflected in the consolidated statement of financial position as its capital. The Group monitors its use of capital using leverage ratios,specifically, debt-to-equity ratio. It also monitors its DSCR to ensure that there would be sufficient amount of cash flow available to meet annual interest and principal payments on debt.
The Group is required to maintain a maximum debt-to-equity ratio of 2.33:1 and minimum DSCR of 1.25:1 by its creditor banks. The Group has the following ratio:
2017 2016Total liabilities P=13,352,065 P=11,884,405Total equity 10,544,108 9,773,619Total liabilities and equity P=23,896,173 P=21,658,024
Debt-to-equity ratio 1.27:1.00 1.22:1.00
2017 2016Core earnings before interest, taxes, depreciation and amortization P=1,623,973 P=1,337,133Interest expense 444,257 382,770Principal repayments 379,900 160,143DSCR 1.97:1 2.47:1
29. Financial Instruments
Financial Risk Management Objectives and PoliciesThe Group’s principal financial instruments comprise cash and cash equivalents, trade and other receivables, and trade and other payables, which arise directly from its operations, andshort and long-term borrowings. The Group has other financial instruments such as restricted cash and dividends payable.
The main risks arising from the Group’s financial instruments are liquidity risk, credit risk and interest rate risk. The Group monitors the market price risk arising from all financial instruments.The Group’s operations are also exposed to commodity price risk, particularly from sugar prices. Risk management is carried out by senior management under the guidance and directionof the BOD of the Parent Company.
Liquidity riskLiquidity risk arises from the possibility that the Group may encounter difficulties in raising funds to meet maturing obligations.
The Group’s objective is to maintain sufficient cash and cash equivalents and the availability of funding through an adequate amount of committed credit facilities. Due to the dynamicnature of the business, the Group aims to maintain flexibility in funding by keeping track of daily cash flows and maintaining committed credit lines available.
The tables below summarize the maturity profile of the Group’s financial liabilities based on contractual undiscounted payments and the related financial assets used for liquiditymanagement.
2017
On DemandLess thanOne Year
Over Oneto Two Years
Over Twoto Four Years
Over Fourto Five Years
OverFive Years Total
Short-term borrowings* P=4,840,424 P=– P=– P=– P=– P=– P=4,840,424Trade and other payables** 767,466 294,576 – – – – 1,062,042Current portion of long-term borrowings* – 1,729,101 – – – – 1,729,101Noncurrent portion of long-term borrowings* – – 2,706,374 1,637,604 694,777 – 5,038,755
P=5,607,890 P=2,023,677 P=2,706,374 P=1,637,604 P=694,777 P=– P=12,670,322
Cash and cash equivalents P=570,337 P=– P=– P=– P=– P=– P=570,337Trade receivables*** 440,516 1,554,504 – – – – 1,995,020Due from employees*** 61,345 – – – – – 61,345Due from related parties 57,821 – – – – – 57,821Other receivables*** 59,577 – – – – – 59,577
P=1,189,596 P=1,554,504 P=– P=– P=– P=– P=2,744,100
*Includes expected future interest payments for short-term and long-term borrowings amounting to P=232.1 million and P=712.5 million, respectively. ** Excludes payables to government agencies amounting to P=30.0 million and provision for losses amounting to P=96.6 million.***Net of related allowances for impairment losses totaling P=29.5 million.
2016
On DemandLess thanOne Year
Over Oneto Two Years
Over Twoto Four Years
Over Fourto Five Years
OverFive Years Total
Short-term borrowings* P=3,137,939 P=– P=– P=– P=– P=– P=3,137,939Trade and other payables** 769,981 249,862 – – – – 1,019,843Current portion of long-term borrowings* – 603,536 – – – – 603,536Noncurrent portion of long-term borrowings* – 337,103 1,747,133 2,706,374 1,267,909 1,000,901 7,059,420
P=3,907,920 P=1,190,501 P=1,747,133 P=2,706,374 P=1,267,909 P=1,000,901 P=11,820,738
Cash and cash equivalents P=703,910 P=– P=– P=– P=– P=– P=703,910Trade receivables*** 516,194 334,041 – – – – 850,235Dividend receivable 102,492 – – – – – 102,492Due from employees*** 45,181 13,091 – – – – 58,272Due from related parties 21,956 15,569 – – – – 37,525Other receivables*** 44,797 28,470 – – – – 73,267
P=1,434,530 P=391,171 P=– P=– P=– P=– P=1,825,701
*Includes expected future interest payments for short-term and long-term borrowings amounting to P=223.6 million and P=623.9 million, respectively. ** Excludes payables to government agencies amounting to P=30.1 million and provision for losses amounting to P=22.0 million.***Net of related allowances for impairment losses totaling P=48.8 million.
Credit riskCredit risk is the risk that the Group will incur financial loss through default by counterparties in performing their obligations.
Concentration of credit risk with respect to trade receivables is limited due to the large number of customers comprising the Group’s customer base and their dispersion across differentgeographic areas. It has policies in place to ensure that sales of goods are made to customers with an appropriate credit history.
The Group has established a credit quality review process to provide early identification of possible change in the creditworthiness of counterparties, including regular collateral revisions.
Counterparty credit limits are established by the use of a credit risk classification system, which assigns each counterparty a qualitative risk rating. Risk ratings are subject to regular revision.The credit quality review process allows the Group to assess the potential loss as a result of the risks to which it is exposed and take corrective action.
Maximum exposure to credit risk without taking account of any collateral and other credit enhancements.
The table below shows the maximum exposure to credit risk of the Group shown at gross before the effect of mitigation through collateral agreements.
2017 2016Cash and cash equivalents P=570,337 P=703,910Trade receivables* 1,995,020 850,235Due from employees* 61,345 58,272Due from related parties 57,821 37,525Dividend receivable – 102,492Other receivables* 59,577 73,267
P=2,744,100 P=1,825,701
*Net of allowance for impairment losses totaling P=29.5 million and P=48.8 million in 2017 and 2016, respectively.
Collaterals and other credit enhancementsThe amount and type of collateral required depends on an assessment of the credit risk of the counterparty. Guidelines are implemented regarding the acceptability of types of collateraland valuation parameters. As at September 30, 2017 and 2016, the Group did not hold collateral from any counterparty.
Credit quality per class of financial assetsThe credit quality of receivables is managed by the Group through its Marketing Department. High grade accounts are those receivables from counterparties with whom collections aremade without much effort. Standard grade accounts consist of receivables from its distributors, related parties and employees with good financial condition and with relatively low defaults.Substandard grade accounts, on the other hand, are receivables from other counterparties with history of defaulted payments.

The RighT FundamenTals: SuStainability68
ANNUAL REPORT 2017 69
2015Sugar Alcohol Eliminations Consolidated
Revenue: External customers P=5,615,561 P=2,592,835 P= P=8,208,396 Inter-segment 2,565,211 (2,565,211) Cost of goods sold: Direct materials used 3,820,992 1,711,945 (2,325,676) 3,207,261 Planter’s subsidy and productivity assistance 1,025,722 1,025,722 Fuel and oil 437,052 334,137 771,189 Depreciation and amortization 619,211 130,330 2,526 752,067Interest expense 264,692 6,663 271,355Segment profit (loss) (30,845) 49,398 18,553
Other disclosures:Capital expenditures 700,922 411,534 1,112,456Investment in associate 259,907 414,693 674,600
30. Fair Value Measurement
The Group has assets and liabilities that are measured at fair value on a recurring basis in the consolidated statements of financial position after initial recognition. Recurring fair valuemeasurements are those that another PFRS requires or permits to be recognized in the consolidated statements of financial position at the end of each reporting period. These includeinvestment properties and land under property and equipment at revalued amount.
The Group does not have nonrecurring fair value measurements in the consolidated financial statements. The Group’s management determines the policies and procedures for recurringfair value measurement.
External valuers are involved for valuation of significant assets which are investment properties and land under property and equipment. Involvement of external valuers is decided uponannually by management. Selection criteria include market knowledge, reputation, independence and whether professional standards are maintained. Management decides, after discussionwith the Group’s external valuers, which valuation techniques and inputs to use for each case.
At each reporting date, management analyses the movements in the values of assets and liabilities which are required to be re-measured or re-assessed as per the Group’s accountingpolicies. For this analysis, management verifies the major inputs applied in the latest valuation by agreeing the information in the valuation computation to contracts and other relevantdocuments with relevant external sources to determine whether the change is reasonable.
The carrying amounts of the Group’s financial assets and liabilities approximate their fair values due to their short-term nature or the interest rates that they carry approximate the interestrate on comparable instruments in the market. For the long term loans, these are subject to both fixed and floating rates.
The following methods and assumptions are used to estimate the fair value of each class of financial instruments.
Cash and cash equivalents, trade receivables, due from planters and cane haulers, due to and from related parties, due from employees, other receivables, trade and other payable andshort-term borrowings, current portion of long-term borrowings and dividends payable. The carrying amounts of these instruments approximate fair values due to their short-term maturities.
Long-term borrowings. The carrying value of long-term borrowings as at September 30, 2017 and 2016 approximates its fair value as they carry interest rates of comparable instruments inthe market.
The following tables present fair value hierarchy of the Group’s financial liabilities, investment properties and land under property, plant and equipment:
Fair Value
Date of valuation: various dates in September 2017 Carrying Value
Significantobservable inputs
(Level 2)Assets measured at fair value
Land under property, plant and equipment (see Note 12) P=4,746,047 P=4,746,047Investment properties (see Note 13) 349,267 349,267
Fair Value
Date of valuation: various dates in September 2016 Carrying Value
Significantobservable inputs
(Level 2)Assets measured at fair value
Land under property, plant and equipment (see Note 12) P=4,379,780 P=4,379,780Investment properties (see Note 13) 320,812 320,812
31. Segment Reporting
The Group has two reportable segments: sugar and alcohol. The Group’s sugar segment consists of four operating subsidiaries: CADPI, CACI, NAVI and RABDC that manufacture and sellraw and refined sugar, molasses and provides tolling and farm operations services. The alcohol segment consists of two operating subsidiaries: RBC and SCBI that manufactures and sellsbio-ethanol fuel.
The Group has only one geographical segment as all of its assets are located in the Philippines. The Group operates and derives principally its revenue from domestic operations. Thus,geographical business information is not required.
The Group’s senior management regularly reviews the operating results of the business units to make decisions on resource allocation and assess performance. Segment revenue andsegment expenses are measured in accordance with PFRS. The presentation and classification of segment revenue and segment expenses are consistent with the consolidated statementsof income.
In 2017, 2016 and 2015, P=4,473.4 million (or 41%), P=4,167.9 million (or 35%) and P=3,238.3 million (or 40%), respectively, of the Group’s total revenue were derived from two customers.
The following tables present information about the Group’s operating segments:
2017Sugar Alcohol Eliminations Consolidated
Revenue: External customers P=7,219,779 P=3,727,754 P= P=10,947,533 Inter-segment 2,631,030 845,996 (3,477,026) Cost of goods sold:
Direct materials used 5,403,078 3,241,005 (3,449,419) 5,194,664Planters’ subsidy and productivity assistance 974,000 60,022 – 1,034,022
Fuel and oil 367,899 342,748 710,647Depreciation and amortization 640,631 238,455 879,086
Interest expense 502,305 4,329 (62,377) 444,257Segment profit (loss) 80,919 181,652 (142,531) 120,040
Other disclosures:Capital expenditures 718,473 415,756 1,134,229Investment in associate 259,907 – 346,861 606,768
2016Sugar Alcohol Eliminations Consolidated
Revenue: External customers P=7,848,282 P=4,201,952 P= P=12,050,234 Inter-segment 2,541,083 31,419 (2,572,502) Cost of goods sold: Direct materials used 6,219,498 2,596,195 (2,570,271) 6,245,422 Planters’ subsidy and productivity assistance 1,333,338 10,288 1,343,626 Fuel and oil 437,911 553,929 991,840 Depreciation and amortization 643,842 206,518 7,855 858,215Interest expense 305,306 77,464 382,770Segment profit (loss) 63,634 37,957 101,591
Other disclosures:Capital expenditures 709,507 223,340 932,847Investment in associate 259,907 388,961 648,868

The RighT FundamenTals: SuStainability70
Head Office
Affiliate
Share Information
Stock Code
Subsidiaries
ROXAS HOLDINGS, INC.14th Floor, Net One Center
26th Street Corner 3rd Avenue
Bonifacio Global City, Taguig
Metro Manila, 1634 Philippines
Tel. Nos.: (63 2) 771 7800 to 05
Website: www.roxasholdings.com.ph
HAWAIIAN-PHILIPPINE COMPANY (HPCo)Silay City, Negros Occidental
6116 Philippines
Roxas Holdings, Inc. Shares are listed at the Philippine Stock Exchange, Inc.
PSEi: roX
CENTRAL AZUCARERA DON PEDRO, INC.(CADPI)Brgy. Lumbangan, Nasugbu
Batangas, 4231 Philippines
CENTRAL AZUCARERA DE LA CARLOTA, INC. (CACI)Brgy. Roberto S. Benedicto, La Carlota City
Negros Occidental, 6130 Philippines
ROXOL BIOENERGY CORPORATION (RBC)La Carlota City, Negros Occidental
6130 Philippines
SAN CARLOS BIOENERGY, INC. (SCBI)Plant Site, San Carlos Ecozone
Barangays Punao & Palampas
San Carlos City, Negros Occidental
6127 Philippines
RHI AGRI-BUSINESS DEVELOPMENT CORPORATION (ADC)14th Floor, Net One Center
26th Street corner 3rd Avenue
Bonifacio Global City, Taguig
Metro Manila, 1634 Philippines
INforMatIoN for INvestorsPARENT FIRMS
AFFILIATE
SUBSIDIARIES
Atty. Jhoel P. RaquedanVice President-Group HeadLegal & Corporate Affairs
Roulee Jane F. CalayagHeadStakeholder Relations& Corporate Communications14th Floor, Net One Center
26th Street corner 3rd Avenue
Bonifacio Global City, Taguig
Metro Manila, 1634 Philippines
Tel. Nos.: (63 2) 771 7800 to 05
Website: www.roxasholdings.com.ph
Stock Transfer AgentBDO Trust & Investment Group15th-17th Floors, South Tower
BDO Corporate Center
7889 Makati Avenue, Makati City
Tel. No.: (63 2) 840 7000
External AuditorSGV and Co.6760 Ayala Avenue
Makati City
1276 Philippines
Tel. No.: (63 2) 891 0307
INvestor reLatIoNs

roXas HoLdINgs, INc.14th Floor, Net One Center
26th Street corner 3rd Avenue
Bonifacio Global City, Taguig
Metro Manila, 1634 Philippines
Tel. Nos.: (63 2) 771 7800 to 05
Website: www.roxasholdings.com.ph