SUSTAINABILITY REPORTING PRACTICES IN SMALL-TO …
73
UNIVERSITY OF TAMPERE School of Management SUSTAINABILITY REPORTING PRACTICES IN SMALL-TO-MEDIUM SIZED ENTERPRISES Business competence Master’s thesis May 2018 Supervisor: Hannele Mäkelä Charlene van der Walt
Transcript of SUSTAINABILITY REPORTING PRACTICES IN SMALL-TO …

UNIVERSITY OF TAMPERE
School of Management
SUSTAINABILITY REPORTING PRACTICES IN SMALL-TO-MEDIUM
SIZED ENTERPRISES
Business competence
Master’s thesis
May 2018
Supervisor: Hannele Mäkelä
Charlene van der Walt

ABSTRACT
University of Tampere School of Management, Business competence
Author: CHARLENE VAN DER WALT
Title: SUSTAINABILITY REPORTING IN SMALL-TO-MEDIUM
SIZED ENTERPRISES
Master’s Thesis: 67 pages, 3 appendix pages
Date: May 2018
Key words:
Sustainability reporting, GRI, SME sustainability reporting, Sustainability indicators
There is an abundance of literature on sustainability reporting although it has been claimed that
most focus is on MNEs and LEs. While SMEs are valuable in a country’s economy and in the
supply chains of MNEs, SMEs have been portrayed as being laggards in accounting for their
sustainability impacts. MNEs and SMEs operate in the same environment, but they operate in
different ways as they have different characteristic influences. The most notable difference is
size and limited resources, hindering effective sustainability reporting. Reporting frameworks
have been introduced to guide sustainability reporting, such as the well-known GRI framework,
The GRI framework and guidelines has been criticized as being too complex and costly for
SMEs. Therefore, it was claimed that SMEs need a concise set of sustainability indicators.
Thus, the purpose of the thesis is to gain more insight into the current state of SME sustainability
reporting, specifically investigating sustainability indicators reported by active SME reporters
applying the GRI-G4 guidelines. In the pursuit to explore the contemporary sustainability
reporting practices in SMEs, the study further questions whether there is a pattern of frequently
reported sustainability indicators by SMEs.
The data was collected from 52 SME reporting companies which incorporated the GRI-G4
framework in their sustainability reports and published their reports in the GRI Database. Each
report included a GRI Content Index which summarized all the sustainability indicators they
reported in their reports. Data was collected from the organizations and the indexes, inserted in
tables and charts, and analyzed. Content analysis was used to analyze the data.
It was found that half of reporting SMEs utilizes the GRI reporting framework. Although the
sustainable reporting rate in sustainable indicator disclosures was very low, it presented a slight
pattern in the most common indicators SMEs disclosed, but also limited the accuracy of the
results. Different common sustainability reporting themes were identified rather than specific
indicators due to many limitations which questioned the accuracy of the results which
encourage further research into SME sustainable reporting.

TABLE OF CONTENTS
LIST OF FIGURES ........................................................................................................................................... 1
LIST OF TABLES ............................................................................................................................................. 2
1 INTRODUCTION ............................................................................................................................................. 3
2 LITERATURE REVIEW ................................................................................................................................. 8 2.1 SUSTAINABILITY REPORTING ................................................................................................................................... 8
2.1.1 How it started to today ........................................................................................................................................ 9 2.1.2 The SME Conundrum ......................................................................................................................................... 13 2.1.3 Benefits of Sustainability Reporting ........................................................................................................... 17 2.1.4 Motivations for Sustainability Reporting ................................................................................................ 18 2.1.5 Limitations, Criticism and Challenges of Sustainability Reporting ............................................. 21 2.1.6 Reporting Instruments...................................................................................................................................... 22
2.2 GLOBAL REPORTING INITIATIVE (GRI) ............................................................................................................... 24 2.2.1 The GRI Sustainability Disclosure Database .......................................................................................... 25 2.2.2 Principles and Standard Disclosures .......................................................................................................... 26 2.2.3 Adherence Level ................................................................................................................................................... 29 2.2.4 Criticism ................................................................................................................................................................... 30
2.3 SME SUSTAINABILITY REPORTING ...................................................................................................................... 31
3 METHODOLOGY .......................................................................................................................................... 35 3.1 SAMPLE GROUP ........................................................................................................................................................ 35 3.2 DATA COLLECTION .................................................................................................................................................. 36 3.3 DATA ANALYSIS ....................................................................................................................................................... 38
4 RESULTS ........................................................................................................................................................ 40 4.1 INCREASE IN SUSTAINABILITY REPORTING ......................................................................................................... 40 4.2 SHARE OF REPORT TYPES PUBLISHED................................................................................................................. 41 4.3 TOTAL INDICATORS REPORTED ............................................................................................................................ 42 4.4 FREQUENCY OF INDICATORS REPORTED ............................................................................................................. 45
4.4.1 Economic Indicators .......................................................................................................................................... 46 4.4.2 Environmental Indicators ............................................................................................................................... 47 4.4.3 Social Indicators .................................................................................................................................................. 49
5 DISCUSSIONS ............................................................................................................................................... 53
6 CONCLUSIONS .............................................................................................................................................. 60
REFERENCES.................................................................................................................................................... 63
APPENDICES .................................................................................................................................................... 68 Appendix 1: General Data & Total Indicators Repored Data Collected ................................................ 68 Appendix 2: Frequency of Indicators Disclosed ................................................................................................ 70

1
LIST OF FIGURES
Figure 1: Growth in global CR reporting rates since 1993
Figure 2: Companies that include CR information in annual reports
Figure 3: Example of search filters
Figure 4: Growth in sustainability reporting
Figure 5: Share of report types published
Figure 6: Number of indicators reported by organizations
Figure 7: Intensity of indicators reported
Figure 8: Frequency of economic indicators disclosed
Figure 9: Frequency of environmental indicators disclosed
Figure 10: Frequency of social indicators disclosed

2
LIST OF TABLES
Table 1: G4 General Standard Disclosure Overview
Table 2: The Specific Standard Disclosure Indicators
Table 3: Illustration of the GRI Content Index
Table 4: EU classifications of SMEs
Table 5: SME & Large Organization Characteristics
Table 6: SME & MNE Innovative Capacities
Table 7: Averages of Indicators Disclosed
Table 8: Economic Indicator Reporting Rates
Table 9: Environmental Indicator Reporting Rates
Table 10: Social Indicator Reporting Rates

3
1 INTRODUCTION
Throughout the past few years, sustainability has shown as an upcoming feature in companies
and governments worldwide (Bos-Brouwers 2009; Bartels et al. 2013), positioned as a topic of
global importance (Tregidga & Milne 2006). In achieving a sustainable economy and world,
governments and businesses have raised concerns in sustainable development, in a manner
inclusive of economic growth, increased transparency, and building trust while making their
operations sustainable. (Bartels et al. 2013; GRI n.d. b) The concept of sustainable development
affects all organizations, both big and small. Sustainable development has been defined in many
ways, the most common phrased wording for sustainable development is “development that
meets the needs of the present without compromising the ability of future generations to meet
their own needs” (IISD n.d).
Sustainability development influences organizations universally by sustainability issues such
as rising energy prices, health and safety of employees, carbon emissions, or waste reduction.
Consequently, organizations are confronted to take responsibility for their business impacts or
in some cases face the consequences when continuing to adopt a ‘business as usual’ attitude.
(Hörisch et al. 2014) Environmental and social responsibility appears more clearly and
consistent within political and business agendas (Revell et al. 2009) where responsibility can
be communicated in the form of adherence to laws and regulations (Hörisch et al. 2014).
Responsibility can further be a compelled reaction to public pressure and be a proactive
initiative and strategy of the company (Hörisch et al. 2014). Recent increase of support for
urgent action has produced a new wave of sustainable expressions from businesses leaders, who
seem increasingly ready to accept that the advantage of acting immediately, may outweigh the
costs in the long run (Revell et al. 2009).
Sustainability reporting exhibits this action which links an organization’s strategy and devotion
to a sustainable global economy (GRI, n.d. b), one that unites profitability with social justice
and environmental protection (Bartels et al. 2013). Integrating sustainability information into
an organization’s reporting cycle helps organizations to identify, measure, comprehend and
convey their economic, environmental, and social performance and impacts, positive or
negative, caused by its everyday activities (GRI, n.d. b). “While it is an increasingly popular
practice, the uptake of sustainability reporting can be significantly boosted by policy,

4
regulation, and other initiatives from both the public and private sector” (Bartels et al. 2013
p.8).
According to a survey on corporate responsibility reporting initiated by KPMG, most of the
largest companies who are typically leaders in corporate responsibility reporting are using some
form of guidance or framework for their sustainability reporting. Additionally, it was reported
that the Global Reporting Initiative (GRI) framework was the most commonly applied
framework by these reporting companies. (King & Blasco 2017) In 2015, KPMG reported that
GRI remain the most popular voluntary reporting framework worldwide (King & Bartels 2015).
GRI͛s activity involves thousands of professionals and organizations from many different
sectors and regions, supporting organizations public and private, large and small (Bartels et al.,
2013).
GRI, in collaboration with KPMG International, United Nations Environment Programme
(UNEP) and The Centre for Corporate Governance in Africa (at the University of Stellenbosch
Business School) assessed the developments in sustainability reporting instruments 1
worldwide. Some of their findings indicated a surge in the number of reporting instruments.
Although mandatory reporting instruments dominated the total number of reporting
instruments, the growth in voluntary instruments are strong as well. “Governments and
regulators increasingly require or encourage companies to disclose sustainability information
in their reports, but almost one third of reporting instruments apply exclusively to large listed
companies” (Bartels et al. 2016, p.9). (Bartels et al. 2016)
Accordingly, many studies have brought attention to the fact that sustainable issues have mainly
focused on Large Enterprises (LE) and Multinational Enterprises (MNEs) (Hörisch et al. 2014;
Džupina & Mišún 2014; Williams & Schaefer 2012; Bos-Brouwers 2009, Revell et al. 2009).
One of the most common argument used for the focus on larger firms are their big impacts on
the economy, environment and society (Hörisch et al. 2014). Yet, consider for example in the
UK, it was estimated that Small-to-Medium Sized Enterprises (SMEs) are responsible for as
much as 60 percent of industrial carbon dioxide emissions according to the Marshall Report in
1998, and the Environmental Agency in 2003 estimated that SMEs are responsible for 60
1 Reporting instruments implies mandatory or voluntary, that requires or encourages organizations to report, or disclose on their sustainability related information (Bartels et al. 2016).

5
percent of commercial waste and 80 percent of pollution accidents (Revell et al. 2009).
According to another study by Arena and Azzone (2012), SMEs in France are responsible for
40 to 45 percent of all industrial air emissions, water and energy consumption, as well as 60 to
70 percent of industrial waste production.
Spurring the focus on LEs and MNEs further, they have more activities, more stakeholders
concerned with sustainability (public pressure), and are more in the public eye (higher levels of
visibility), thus a sensitive corporate reputation (Džupina & Mišún 2014; Hörisch et al. 2014).
SMEs in emerging economies are often employed as suppliers or sub-contracted by MNEs to
either manufacture their components and/or products, or provide services to their (local)
operations. In other words, most of the MNE’s impacts (economic, environmental and social)
occur through their supply chain and an extensive proportion of their impacts are produced
through SMEs in those chains. (Plugge & Wiemer 2008) Hörisch et al. (2014) claimed that
SMEs also contribute to economic and social security to numerous regions in developed
countries.
SMEs2 are individually small in size and economic power; nevertheless, they collectively
produce an important part of GDP3 and are commonly characterized as a backbone of all
economies (Muller et al. 2016; Džupina & Mišún 2014; Plugge & Wiemer 2008). Consider for
example, the European Commission reported that SMEs form the foundation of the EU28
economy, as a little under 23 million SMEs produced €3.9 trillion in value added and employed
90 million people in 2015. SMEs contributed to the non-financial business sector 4
tremendously, making up to 99.8 percent of all enterprises, 57.4 percent of value added, and
66,8 percent of employment. Furthermore, an extensive majority of the non-financial business
sector SMEs are micro enterprises, accounting for almost 93% of all enterprises. (Muller et al.
2016)
Likewise, given the tremendous majority of enterprises that fall into the SME category, they
collectively impose a significant impact on the global environment and society, accompanying
2 Small to medium-sized enterprises (SMEs) employ less than two hundred and fifty people and do not exceed fifty-million-euro annual revenue (European Commision 2017). 3 “Gross Domestic Product is the monetary value of all the finished goods and services produced within a country’s borders in a specific period.” (Investopedia n.d.) 4 Consists of all sectors of the economies of the EU28 or Member States, except for financial services, government services, education, health, arts and culture, agriculture, forestry and fishing (Muller et al. 2016, p.4.)

6
a commonly quoted estimate in all global pollution contribution of 70 percent (Hörisch et al.
2014; Arena & Azzone 2012; Plugge & Wiemer 2008; Revell et al. 2009). It is slightly
astonishing that SMEs have not been addressed more systematically (Hörisch et al. 2014;
Džupina & Mišún 2014), since SMEs represent such an important part of an economy
considering their crucial importance in sustainable development (Revell et al. 2009).
Accordingly, scholars and policy makers are increasingly acknowledging the fundamental role
that small organizations must play in solving sustainable problems (Revell et al. 2009).
Sustainability management tools5 have been promoted for both large and small organizations
to produce sustainability reports (Hörisch et al. 2014; Arena & Azzone 2012). SMEs continue
to face barriers which have been portraying them as laggards when incorporating sustainable
measures into their everyday business operations (Arena & Azzone 2012). Several factors
explain the limited application of sustainable tools whose most noticeable characteristics have
been identified as size, time, capital, knowledge, and skilled personnel which limits their
resources (Hörisch et al. 2014). Hörisch et al. (2014) further claimed that knowledge is a key
driver and difference between SMEs and large organizations as knowledge is required for the
implementation of sustainability management tools and corporate sustainability strategies.
Moreover, SMEs know and apply notably fewer tools than large organizations and therefore
knowledge also determines a company’s degree of applying sustainability tools (Hörisch et al.
2014).
GRI similarly imply that the management behavior of an organization’s activities across all
three dimensions (economic, environmental and social) indicate the seriousness in their
responsibilities. Therefore, GRI wants to develop a demonstration in indicators of an
organization’s triple bottom line. (Buhr et al. 2014) Indicators arise from values and create
values through which they also simplify, quantify, examine, and communicate the complex and
complicated information (Singh et al. 2009). However, Arena and Azzone (2012) stated that
the available instruments are unfit for SMEs due to their complexity and formal procedure
requirements. Thus, researching the reporting of these indicators can indicate how serious
SMEs are currently taking sustainable reporting, and supply an indication which indicators are
presently most commonly reported on by SMEs.
5 “Sustainability management tools can be defined as management instruments and systems that support companies to implement corporate sustainability.” (Hörisch et al. 2014, p.765)
7
Fundamentally, SMEs are viewed as the backbone of an economy and are valuable to global
supply chains, they exert considerable pressure on society and the environment. Since more
attention has been drawn to SMEs over the years, SMEs are still scrutinized for being laggards
in sustainability reporting as they face many barriers, and have also been studied less than large
organizations. Despite the moderate amount of literature addressing SMEs accountability for
sustainability issues, Williams and Schaefer (2012) voiced that even less attention has been
given to environmentally pro-active organizations. They recognized that the views of pro-active
organizations may be valuable since these organizations have previously dealt with some of the
traditional business barriers and embrace the challenges and opportunities ahead of many of
their peers (William & Schaefer 2012).
Consequently, the purpose of this thesis is shed light on the current state of SME sustainability
reporting, focusing on the indicators they report on. The research objective is to explore the
contemporary sustainability reporting practices in SMEs and question whether there is a pattern
in frequently reported sustainability indicators. The thesis seeks to answer the following
questions:
• Has sustainability reporting in SMEs developed over the years?
• Is there a link between the size of SMEs and the total number of sustainability indicators
they report?
• What indicators are reported in the sustainability reports of SMEs?
The thesis begins with a literature review to gain a basic understanding of sustainable reporting
and introduces the Global Reporting Initiative (GRI). It further summarizes Small-to-Medium
Sized Enterprises (SMEs) reporting, providing the ground to understand the concepts for the
significance of SME reporting. The literature review is written from a wider perspective to
provide an overall view to the purpose of the thesis. Section 3 describes the methodology
adopted by narrating the procedure followed in obtaining and recoding the research data. Next,
results section 4 explains the results obtained and provides an analysis for some of the results
produced. Section 5 discusses the results, states the limitations and provides recommendations
for future research. Finally, section 7 concludes the thesis by summarizing the findings of the
study.

8
2 Literature Review
2.1 Sustainability Reporting
The main objective of organizing contemporary economies in a capitalist market society is to
maximize economic growth (Bartels et al. 2016), yet in this pursuit for economic growth,
considerable damage is inflicted to society and the environment (Bebbington et al. 2014). To
quote Buhr & Gray (2012, p. 425): “All organizations, to a greater or lesser extent, draw their
resources from that environment and return their wastes and emissions to it. More subtly, but
no less crucially, the very principles of business (however we choose to define them)
profoundly affect how we as individuals and societies perceive and negotiate our relationships
with each other and with the planet and the natural world – of which (whether we remember
this or not) we are so much a part.” Managing and balancing social, environmental and
economic sustainability is a complexed challenge faced by organizations, both in the private
and public sectors (Buhr & Gray 2012; Bebbington et al. 2014), which will require changes in
practices as well as in ways of thinking (Bebbington & Fraser 2014)
In achieving a sustainable (or at least a less unsustainable) state, organizations play a key role
in the struggle to make sense of, and operationalize, the concept of sustainable development
(Tregidga & Milne 2006). As new beliefs are emerging that it can indeed pay to be green, since
academic and professional literatures have increasingly challenged the traditional economic
theory (Jones 2012), the concept of sustainable development has evolved into a pivotal
organizing theme (Bebbington et al. 2014). Referring to Bebbington’s (2014, p. 4)
interpretation of sustainable development, it “tend to focus on how to organize and manage
human activities in such a way that they meet physical and psychological needs without
compromising the ecological, social or economic base that enables these needs to be met”.
Definitions can vary according to different stakeholder groups (Džupina & Mišún 2014) and
has been defined in many ways. However, the notion of sustainability development has many
shared elements with other concepts such as Corporate Sustainability (CS), Triple Bottom Line,
and Corporate Social Responsibility (CSR). All these perceptions include the view of
improving and integrating social (people), environment (planet), and economic (profit)

9
responsibility of organizational operations, and interaction with their stakeholders on a
voluntary basis. (Bos-Brouwers 2009; Džupina & Mišún 2014)
Social, environmental and economic sustainability challenges pose many risks to (and many
opportunities for) the performance of organizations (Bebbington et al. 2014). Thus, sustainable
decisions made, hardly emerge out of financial information alone (GRI, n.d. b). Accordingly,
as sustainability became a crucial upset of scientists, governments, business leaders and the
public at large, the global sustainability challenges needed a joined-up response from different
actors, where reporting is key (Bartels et al. 2013; Revell, Stokes & Chen, 2009).
Reporting can be thought off as a ‘keyhole’ through which organizations pledge understanding
into their conception of sustainable development and their organization-environment
relationship (Tregidga & Milne 2006). Reporting is the fundamental link between set goals and
the data collected that shows what actions has been taken to attain those goals and what progress
is being made (Bartels et al. 2016). Regardless of the form of reporting, it is driven by objectives
and motivations, a calculated purpose to communicate a message to exhibit transparency,
responsibility, and accountability (Buhr et al., 2014)
Attempts to report on sustainable impacts have become considerably more common among
organizations (Bebbington et al. 2014). According to Schaltegger (2012 p.183), sustainability
reporting has received significant amount of attention throughout literature and has been in the
center of a large array of theoretical and empirical investigations. A potentially threating
concept to businesses in the past, seems to be exercised by business organizations with some
comfort presently. (Buhr et al. 2014)
2.1.1 How it started to today
Literature on social and environmental interaction with organizations has existed since the
1970s (Gurthie & Abeysekera 2006; Tregidga & Milne 2006), but reporting on the environment
was only seen as ‘a thing of the 1990s’ (Tregidga & Milne 2006). According to Jose and Lee
(2007), the corporate environmental movement involved two distinct stages which can be
characterized by different driving forces. The first movement was a compliance-based view as
legal and regulatory considerations were the initial driving forces. The second stage was a
competitive advantage-based view, driven by competitive advantage due to a better reputation

10
and technology, stakeholder expectations and sharper political acumen to influence public
policy. (Jose & Lee 2007)
The profession of social auditing and reporting began to gather support perhaps five years
behind the practice of environmental auditing and reporting (Buhr et al. 2014), growing to
become one of the most important and meaningful concepts for governments and businesses
(Buhr et al 2014; Tregida & Milne 2006). Buhr et al. (2014, p.55) stated that when social
reporting joined the ranks of traditional financial reporting and environmental reporting, so did
sustainability reporting materialize. Therefore, sustainability reports include environmental,
economic and social aspects of corporate performance and is sometimes referred to as triple
bottom line (TBL) or corporate social responsibility (CSR) reporting (Buhr et al. 2014).
Organizations started to present sustainability information in annual reports titled sustainability
reports or sustainable development reports around the year 2000 (Buhr et al. 2014) and it had
been steadily increasing over the years (Tilt 2001). Sustainability reporting incorporate the
formal and official form of earlier corporate reporting, additionally include information about
the social and environmental policies, impacts and performance, and the relationships between
these aspects (Schaltegger 2012; Buhr et al., 2014). KPMG reported in 2015 that companies
are improving at reporting environmental and social trends and risks that affects their business,
even though the quality of Corporate Responsibility (CR) reporting has declined slightly since
2013 (King & Bartels 2015).
In its current form, sustainable reporting by an organization is some consolidation of
communication on economic, environmental and social issues which might be in a stand-alone
report or it might be part of an annual report. Sustainable reporting can further be found in
various forms of communication such as print advertisements, press releases, securities filings,
employee newsletters and corporate websites. (Buhr et al. 2014) Corporate annual reports by
organizations can be perceived as a means to establish an image in the public domain through
voluntary reporting, providing a ‘snapshot’ of the mindset of corporate management and
presenting a ‘reality’ of corporate life (Gurthie & Abeysekera 2006). Similarly establishing
effects on how concepts and organizations are perceived; metaphors, imagery and symbolism
are utilized in a certain fashion today (Tregida & Milne 2006). Sustainability reports are
released by all types, sizes and sectors of companies and organizations, from everywhere in the
world (GRI, n.d. b).
11
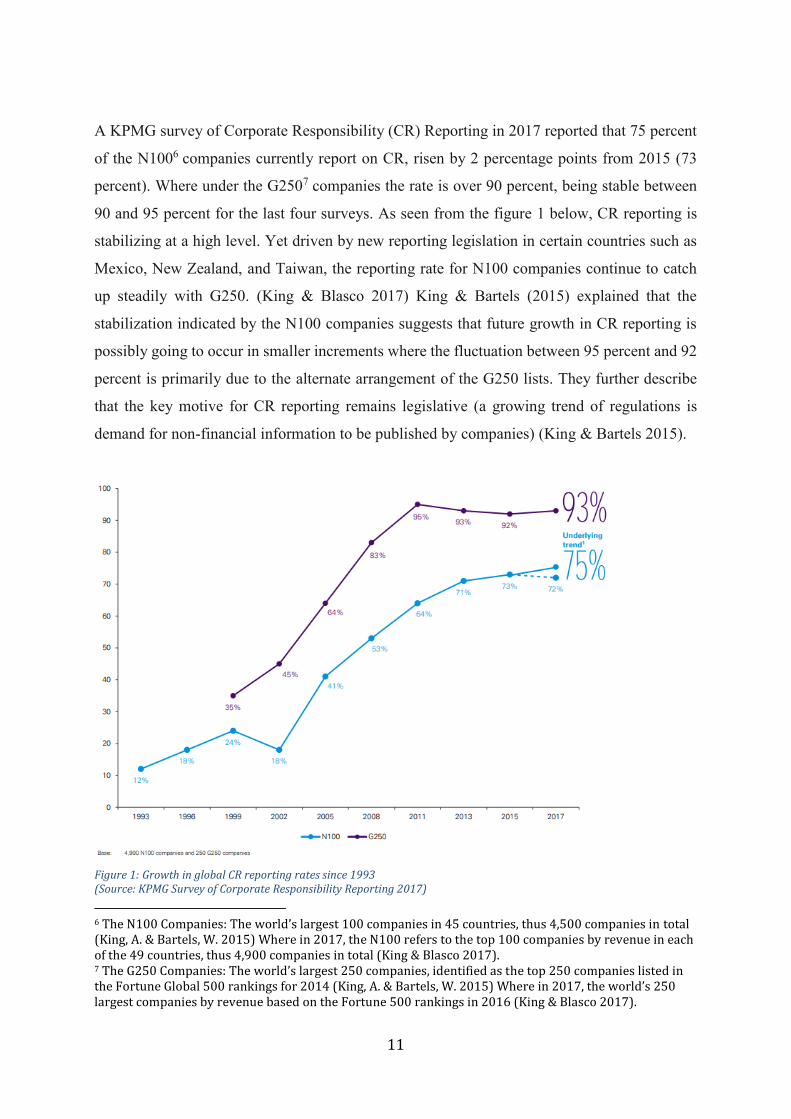
A KPMG survey of Corporate Responsibility (CR) Reporting in 2017 reported that 75 percent
of the N1006 companies currently report on CR, risen by 2 percentage points from 2015 (73
percent). Where under the G2507 companies the rate is over 90 percent, being stable between
90 and 95 percent for the last four surveys. As seen from the figure 1 below, CR reporting is
stabilizing at a high level. Yet driven by new reporting legislation in certain countries such as
Mexico, New Zealand, and Taiwan, the reporting rate for N100 companies continue to catch
up steadily with G250. (King & Blasco 2017) King & Bartels (2015) explained that the
stabilization indicated by the N100 companies suggests that future growth in CR reporting is
possibly going to occur in smaller increments where the fluctuation between 95 percent and 92
percent is primarily due to the alternate arrangement of the G250 lists. They further describe
that the key motive for CR reporting remains legislative (a growing trend of regulations is
demand for non-financial information to be published by companies) (King & Bartels 2015).
Figure 1: Growth in global CR reporting rates since 1993 (Source: KPMG Survey of Corporate Responsibility Reporting 2017)
6 The N100 Companies: The world’s largest 100 companies in 45 countries, thus 4,500 companies in total (King, A. & Bartels, W. 2015) Where in 2017, the N100 refers to the top 100 companies by revenue in each of the 49 countries, thus 4,900 companies in total (King & Blasco 2017). 7 The G250 Companies: The world’s largest 250 companies, identified as the top 250 companies listed in the Fortune Global 500 rankings for 2014 (King, A. & Bartels, W. 2015) Where in 2017, the world’s 250 largest companies by revenue based on the Fortune 500 rankings in 2016 (King & Blasco 2017).
12
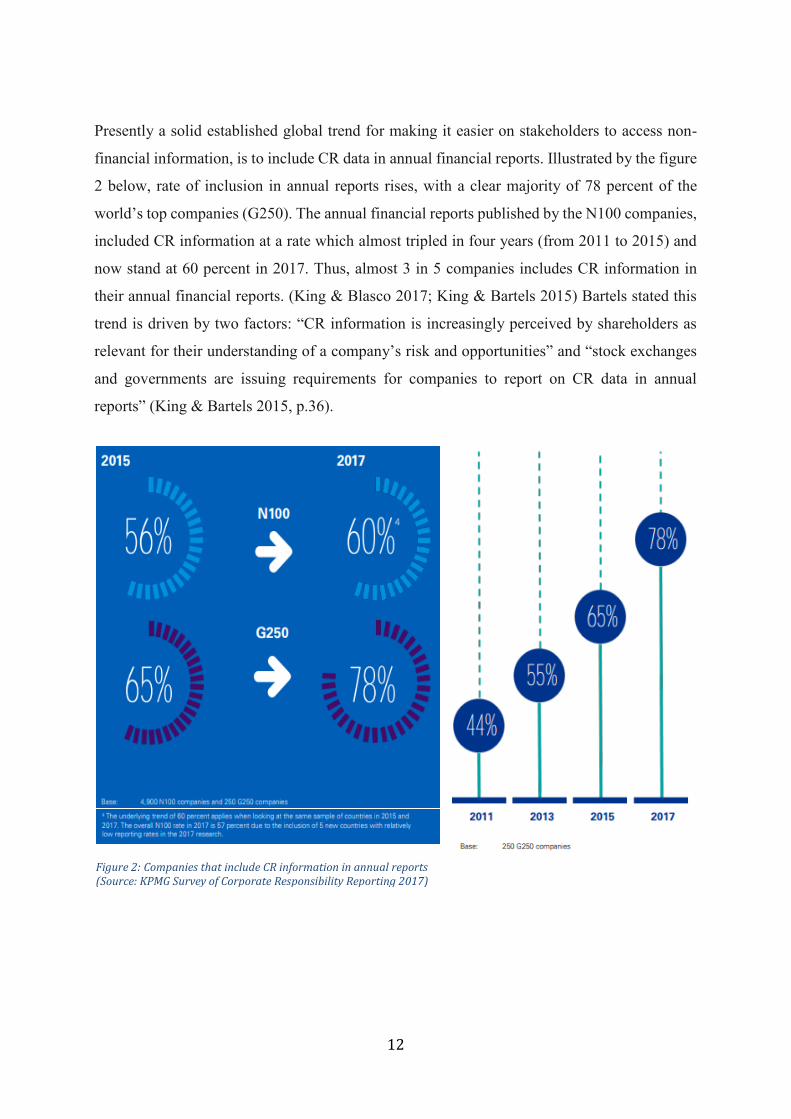
Presently a solid established global trend for making it easier on stakeholders to access non-
financial information, is to include CR data in annual financial reports. Illustrated by the figure
2 below, rate of inclusion in annual reports rises, with a clear majority of 78 percent of the
world’s top companies (G250). The annual financial reports published by the N100 companies,
included CR information at a rate which almost tripled in four years (from 2011 to 2015) and
now stand at 60 percent in 2017. Thus, almost 3 in 5 companies includes CR information in
their annual financial reports. (King & Blasco 2017; King & Bartels 2015) Bartels stated this
trend is driven by two factors: “CR information is increasingly perceived by shareholders as
relevant for their understanding of a company’s risk and opportunities” and “stock exchanges
and governments are issuing requirements for companies to report on CR data in annual
reports” (King & Bartels 2015, p.36).
Figure 2: Companies that include CR information in annual reports (Source: KPMG Survey of Corporate Responsibility Reporting 2017)

13
2.1.2 The SME Conundrum
Due to global value chains, there is a growing trend in the sustainability movement, such as
sustainable reporting, to continuously focus more on SMEs as MNEs, LEs and SMEs are part
of a holistic solution to create a more sustainable world (Plugge & Wiemer 2008). Like large
organizations (MNEs & Les), pressure on the environment and the society can be exerted by
SMEs, even though small in size but through their combined impact of many small activities
(Arena & Azzone 2012). SMEs play a critical role in global value chains, producing the bulk
of components in raw materials, goods and services utilized in a final product by a large
organization’s brand (Bartels et al. 2016; Plugge & Wiemer 2008). Thus, SMEs is an important
and hugely underestimated contributor to the world economy and impacts on the global
environment and society (Muller et al. 2016; Džupina & Mišún 2014; Hörisch et al. 2014,
p.766; Plugge & Wiemer 2008; Revell et al. 2009, p.275).
A clear majority of organizations fall into the SME category, roughly represents 99 percent of
all businesses (80 percent of all globally registered enterprises (Hörisch et al. 2014)) and
generate around 80 percent of job opportunities in the European Union (EU) (European
Commission 2017; Džupina & Mišún 2014). As expressed in the introduction, SMEs form the
foundation of the EU28 economy with a little below 23 million SMEs produced €3.9 trillion in
value added and employed 90 million people in 2015, contributing to the non-financial market
by up to 99.8 percent of all enterprises, where an extensive majority of the non-financial
business sector SMEs are micro enterprises, accounting for almost 93 percent of all enterprises.
(Muller et al. 2016). Hence, in the past it was mainly large organizations who reported on their
sustainability impacts, where SMEs were displayed as laggards who underplay their sustainable
impacts due to perceived costs (Revell et al. 2009).
It was voiced that there has been a scarcity of research into how SMEs partake in sustainability
concepts in general, for instance environmental and social performances (Williams & Schaefer
2012; Bos-Brouwers 2009). Even though SMEs and large organizations operate in the same
environment, SMEs face different problems than larger organizations when embracing
sustainable tools and producing sustainable reports, thus they operate in different ways (Arena
& Azzone 2012).

14
The most noticeable difference between large organizations and SMEs is their size 8 ,
consequently the number of employees and scale of operations (Hörisch et al. 2014). SMEs can
further be classified into three categories of enterprise size: micro, small, and medium (Muller
et al. 2016). Table 4 below, illustrates company size classification according to the European
Commission. Company size is more often used as a characteristic that affects a company’s CSR
in many studies (Džupina & Mišún 2014), where literature claims company size positively
affect application (Hörisch et al. 2014).
Table 4: EU Classification of SMEs
Company Category Employees Turnover Balance sheet total
Micro < 10 < €2 million < €2 million
Small < 50 < €10 million < €10 million
Medium -sized < 250 < €50 million < €43 million
(Source: Annual Report on European SMEs 2015/2016.)
Large organizations generally have higher scale of operations, resource availability (Hörisch et
al. 2014), the administrative systems, locus of control, corporate reputation and communication
motives in place (Bos-Brouwers 2009), and accordingly, are more probable to implement
sustainable management. Large organizations are also likely to accept the initial costs and
devote the necessary personnel to implement sustainable reporting due to the slack resources at
their disposal (Hörisch et al. 2014). SMEs typically engage less in voluntary sustainability
initiatives given their lower visibility, smaller scale of operations, and struggle with resource
poverty, low degree of formalization and low general reporting priorities (Hörisch et al. 2014;
Bos-Brouwers 2009). Other characteristic differences between large organizations and SMEs
are summarized in Table 5 below, where these characteristics also lead to innovative
differences. (Bos-Brouwers 2009, p.419)
8 “The size-class definition used in the report is the same utilized by the European Commission, used in the Structural Business Statistics (SBS) database maintained by Eurostat where the definition is solely based on the number of people employed” (Muller et al. 2016, p.4).

15
Table 5: SME & Large Organization Characteristics
SME Large Organizations
Dominant role of the entrepreneur/owner Delegated management control between
board of directors and shareholders
Resource poverty (capital, time,
knowledge and skilled personnel)
Economy of scale, resource abundance
Flexible organization capacities Bureaucratic rigidity
Focus on short-term Focus on mid to long term
Strong local/regional focus and customer
needs orientation
Strong (inter)national focus and looser ties
with customers
Low degree of formalization High degree of formalization
(Source: Bos-Brouwers 2009, p.419)
Unfortunately, some of these characteristics affect SMEs unfavorably for sustainable
innovation and draw together several factors and barriers faced by SMEs, which be motives for
SMEs lagging in understanding, managing and integrating sustainable issues into their
corporate strategies (Jansson et al. 2015; Revell et al. 2009). Many SMEs are limited in capacity
to tackle problems and incorporate sustainable innovation due to resource poverty in terms of
capital, knowledge and specialized/skilled personnel, and lack of sufficient time (Jansson et al.
2015; Džupina & Mišún 2014; Arena & Azzone 2012; Bos-Brouwers 2009; Plugge & Wiemer
2008). Hence, SMEs have frequently been found to have limited ability and willingness to
engage with voluntary sustainable issues (Arena & Azzone 2012; Williams & Schaefer 2012).
They have also been known to be ignorant of their sustainable impacts as they believe they have
no significant impacts, resistance to voluntary action due to the perceived cost, and skeptical
about the benefits of sustainability (Jansson et al. 2015; Williams & Schaefer 2012; Revell et
al. 2009).
SMEs depend significantly on interpersonal relationships with different stakeholder groups
such as customers, shareholders and employees (Džupina & Mišún 2014). Accordingly, SMEs
are hindered by financial and managerial resource constraints, as they are often reliant on a
small number of customers and employees (Williams & Schaefer 2012), but on the other hand,
networking capacities and behavioral innovative advantages show that SMEs are capable to
overcome these shortcomings (Bos-Brouwers 2009). Owner-managers mostly enjoy greater
freedom of decision-making than LEs, as well as owner-manager’s personal responsibility and
motivation are fundamental in strategic direction and in turn can lead to higher social and
environmental engagement (Williams & Schaefer 2012). On top of that, managers of SMEs
form very strong mutual help relations as they are very sensitive to their internal stakeholders

16
such as customers, employees and suppliers and can be satisfied with ‘satisfactory’ profits
rather than ‘maximum’ profits (Džupina & Mišún 2014, p.287).
Arena & Azzone 2012 stated that sustainable ‘proactive strategies’ has only been adopted by a
few SMEs where Bos-Brouwers 2009 further explained, SMEs focus on short-term conflicts
where sustainability innovations are long-term focused. To quote Arena and Azzone (2012,
p.670), “This is not solely due to scant interest in sustainability among SMEs, but also to a lack
of the operational tools required to make proactive strategies truly effective”. Even though the
degree of sustainable activities differs between large organizations and SMEs, Bos-Brouwers
(2009, p.421) noted that rather than question whether large organizations are more innovative
than SMEs, SMEs innovate differently from large organizations is more significant. An
overview of these differences is illustrated in table 6, where it can be generally perceived that
SMEs have behavioral advantages and disadvantageous resources in innovation (Bos-Brouwers
2009).
Table 6: SME & MNE Innovative Capacities
SMEs
Advantages Disadvantages
Flexibility of organization
• Less bureaucratic
• Responsiveness to changing
circumstances (technology and market)
• Internal communications faster and
more efficient
Owner/Manager
• Dynamic entrepreneurial
• Horizontal leadership style
• Direct role in innovation as ideas
generator
Owner/Manager
• Poor managerial skills (planning,
inadequate delegation, lack of functional
expertise or support)
• Dependency on persons for survival
• Lack of formalized planning
Financial
• Difficulties attracting venture capital
and bank investments
• Failure of innovation projects may be
financially disastrous
• High fixed costs for technological
investments and start-up
Labor
• Difficulties attracting skilled personnel
• Harder to update technological
knowledge
Large Companies
Advantages Disadvantages
Financial
• Less difficulties attracting venture
capital and bank investments
• Innovation risks averted by diversity in
production, sales and innovation
projects
Management
• Top management isolated from
customers and work floor
• Emphasis on short term cost-cutting
instead of long-term infrastructural
enhancements

17
Labor
• Less difficulties in attracting skilled
labor
Knowledge
• Participation in networks and
conference visits to update
(technological knowledge)
• Information management systems
Management
• Decentralized management style with
decision power on lower levels in the
organization
• Long-term strategic-management
capabilities
Labor
• No entrepreneurial fanatics tolerated
Flexibility of organization
• Bureaucratic highly formalized
organization structure
(Source: Bos-Brouwers et al. 2009 p.420)
CSR in large enterprises is mostly affiliated with strategies, policies, producers and results,
where SMEs seldom have codified social and environmental policies and seem to participate in
considerably less sustainable behaviors and issues (Williams & Schaefer 2012). Arena and
Azzone (2012) claimed that most tools available to support companies in generating
sustainability reports, apply to large organizations. On the contrary, Hörisch et al. (2014)
claimed that SME-friendly sustainable management tools have been outlined and proposed,
although it can be perceived that SMEs engage less in sustainable management compared to
large organizations, since SMEs are less likely to apply sustainable management tools9. As a
result, sustainability reporting practices among SMEs are not very common (Plugge & Wiemer
2008).
2.1.3 Benefits of Sustainability Reporting
Enabling organizations to be transparent about their risks and opportunities is a benefit of the
sustainability reporting process, which also ensures considerations for its impacts on these
sustainability issues, and helps build and maintain trust as increased transparency leads to better
decision making (GRI, n.d. b). Kalev and Wallace (2012) expressed that organizations have a
higher market value which adopts CSR policies and CSR factors that have been identified as
having a positive relationship with performance of the organizations are eco-efficiency,
customer satisfaction and reputation. Therefore, it was also rumored that organizations would
be in a beneficial situation to make profits from their operations and create shareholder value
9 “Sustainability management tools can be defined as management instruments and systems that support companies to implement corporate sustainability. They usually help companies to achieve a specific sustainability related objective, such as the provision of information form of a life cycle assessment.” (Ho et al. p.765-766)

18
as to organizations who ignore CSR policies are more prone to wreck shareholder value because
of higher employee turnover rates, loss of reputation or legal action (Kalev & Wallace 2012).
An effective sustainability reporting cycle that incorporate a regular data collection program,
communication, and response should benefit all reporting organizations, internally and
externally. Internal benefits can include elements such as understanding risk and opportunities,
comparing performance information between organizations and sectors, or influencing and
streamlining long term strategies and business plans. On the contrary, external benefits of
sustainability reporting can include brand loyalty, improving reputation, enabling external
stakeholders to comprehend the organization’s true value, or mitigate negative sustainable
impacts. (GRI n.d. c)
Revell et al (2009, p.275) further revealed numerous benefits from academic literature where
sustainability management can result in, “improved competitiveness, materials efficiency, staff
commitment, positive community relations, lower insurance premiums, cheaper finance, and
improved media coverage”. Additionally, financial savings, environmental improvements,
social betterment, and improved product quality are benefits which active CSR policy can bring
for SMEs, serving as a vital competitive advantage (Džupina & Mišún 2014).
Whilst there is no doubt of the potential, SMEs may not realize these benefits as a competitive
advantage or find it challenging to convert these benefits into a competitive advantage, as it has
been revealed that SMEs are mostly unaware or lack understanding about the related benefits
originating from sustainable activities (Hörisch et al. 2014; Williams & Schaefer 2012; Revell
et al. 2009). Consequently, seeking relevant information on their own are not probable and
additionally they might not be easily persuaded to consolidate voluntary networks (Hörisch et
al. 2014).
2.1.4 Motivations for Sustainability Reporting
There are several theories which may explain the motivation for organizations to comply with
sustainable regulations or partake in sustainable reporting (Schaltegger, 2012). Albino et al.
(2009) addressed three main categories of motivation, specifically legitimacy 10 ,
10 Legitimacy includes complying with legislation, establishing an environmental committee, conducting environ- mental audits and developing networks with the local communities (Albino et al. 2009)

19
competitiveness11, and social and ecological responsibility12. Where according to Buhr et al.
(2014) the most popular theoretical motivators are accountability, legitimacy, political
economy, stakeholder pressure13 and institutional theory.
Consistent with institutional theory which assumes that organizations are seeking stability,
Bebbington and Fraser (2014) noted that organizations are change resistant, that there needs to
be a disturbance before any change exists. Thus, they suggested that disturbances could include
for example, changes in government policies or commercial relationships within an
industry/economy. Even changes in technology and/or ways of working within an
industry/economy and relationships with stakeholders or social expectation about certain
events. Further, disturbances might emerge from the natural environment itself, for instance
raw material availability and location. Therefore, changes in some aspect of organizational life
might be led by any of these changes on their own or in concert with each other. (Bebbington
& Fraser 2014)
Jones (2012) noted a different rationale for sustainability change, the effectiveness to go beyond
compliance with laws and regulations, or in other words embrace over-compliance. Over-
compliance is linked with shareholder value creation (Buhr & Gray 2012), where it may also
provide the possibility for strategic competitive advantages such as raising rivals’ costs, early-
mover’s advantages, and the creation of ‘green goodwill’ (Clarkson 2012; Jones 2012). In
addition, an advantage to over-compliance can reduce the risks of future litigations and/or
obligations in lessen future expenditure (Jones 2012). It is further argued that regulation
compliance can trigger innovations, which can enhance cost efficiencies associated with the
production process, for instance, substitution of less costly materials or converting waste into
more valuable forms (Clarkson 2012). Therefore, compliance can be seen as beneficial, positive
and far-reaching in the long term (Buhr & Gray 2012).
11 Several benefits that can arise due to an increased competitiveness: increased efficiency in the use of resources, return on investment, increased sales, development of new markets, improved corporate image, product differentiation and enhanced competitive advantage (Albino et al. 2009) 12 Social responsibility, deriving from the concerns that companies have for social obligations and values (Albino et al. 2009), thus a more general concern for the public good (Williams & Schaefer 2012). 13 Different stakeholder groups such as customer, local communities, environmental interest groups and other, put great pressure on organizations, attempt to influence activities and reporting by way of measures such as antagonism, cooperation and collaboration (Rinaldi et al 2014; Williams & Schaefer 2012).

20
The maintenance and enhancement of an organization’s reputation is a powerful force that
likely motivates and drives ‘voluntary’ compliance as well. In turn, todays organizations pay a
great deal of attention to ‘rankings’ based on both perceptual and factual data, using an index
of some sort. Being ranked is viewed as a value-enhancing proposition, thusly, ranking in
reputation. (Ratnatunga & Jones 2012a) Rinaldi et al. (2014) further suggests ‘voluntary’
compliance is also driven by managers’ philosophical motives to release social and
environmental information, as in some countries or sectors, it is required by regulation for
organizations to publish social and environmental information.
Williams and Schaefer (2012) noted that the most significant motive for SMEs engaging in
sustainable issues were personal values 14 and beliefs. Personal experience strengthens or
weakens personal values and are gained by society or family education, where corporate values
are strongly influenced by personal characteristics together with the level of individual growth
of management (Džupina & Mišún 2014). Džupina & Mišún (2014) further argue that SMEs
are prepared to sacrifice some of their profits for the greater good and very often, they are
‘unknowingly socially responsible’ for the reason that sustainable initiatives originate from
businessmen’s personal values and beliefs. Therefore, Williams and Schaefer (2012) suggested
when trying to encourage SMEs towards greater sustainable engagement, key informants such
as local governments and business advice organizations should actively concentrate more on
personal values and a sense of being able to advance the value of sustainability in their
businesses rather than emphasizing on the business case and cost argument.
Regardless of the huge importance in manager values shown in previous research, Jansson et
al. (2015) observed that it is still unclear on the degree to which positive attitudes turn into
action. In a study among Swedish SMEs which examined the relationship between market
orientation (MO), entrepreneurial orientation (EO), owner-manager values and commitment to
sustainability, Jansson et al. (2015) found that management values, not related to sustainability
commitment and that the results favor MO, EO and sustainability practices to be related to
sustainable commitment in SMEs.
Besides in a cross-sector survey of 220 UK SMEs found that owner-managers started to accept
the responsibility to help solve sustainable problems, where they are willing accept tougher
14 Personal values are concepts or beliefs about proper standards of conduct to guide and evaluate preferred or desired behaviours, results and events (Williams & Schaefer 2012; Džupina & Mišún 2014)

21
regulations and taxation costs. These SMEs were further motivated by the ‘pull’ of potential
savings, new customers, higher staff retention and good publicity, rather than the ‘push’ of
legislation. They were also aware of the advantage, that strong early action outweighs costs and
bring opportunities. Therefore Revell et al. (2009) concluded that there are indications that
SMEs may be having a change of mindset towards a business case for sustainability even
though skepticism still lingers on the overall profitability. (Revell et al. 2009)
2.1.5 Limitations, Criticism and Challenges of Sustainability Reporting
No matter how well argued, there are undoubtedly limits to any organization’s sustainable
attempts (Buhr & Gray 2012). With thorough examination of sustainable reports and utterances,
it reveals a fixation on the organization itself first and the organization’s interactions with
society, economy and physical environment only second (Buhr et al. 2014). Sustainability
reports are being judged as prejudice and self-laudatory (only showing the good side), and
several authors call attention to the risk of window dressing or otherwise known as
greenwashing (Bos-Brouwers 2009). Utilizing window dressing or greenwashing, critics argue
that some organizations provide sustainability information as a public relations tool to win
and/or maintain their valuable stakeholders support, and at the same time playing down the
interests and needs of less powerful stakeholders (Bebbington et al. 2014).
The term ‘sustainability’ is interchangeably used in the business community with greater
regularity, but as Buhr et al. (2014) asked, what do organizations and their managers mean
when they report or express the term sustainability. Mentioned before, sustainability reporting
is considered to be synonymous to other non-financial reporting terms such as triple bottom
line reporting or corporate social responsibility (CSR) reporting (GRI n.d. b), and thus a
fundamental problem to the concept of sustainability, is that there is a vagueness to what it
entails (Džupina & Mišún 2014). To quote Buhr et al (2014, p.55), “The voluntary and
unregulated nature of reporting contributes to the confusion. There is no standardized
terminology that can be used unambiguously to interpret report content or reporting
developments.”
Another problem that plagues sustainability reports are standardization or uniformity (Jose &
Lee 2007). Bartels et al. (2016 p.3) reported that there is a “surge in sustainability reporting
instruments in place (almost 400 instruments in 64 countries)”, which shows an increased

22
commitment, but the “large number and variety of instruments can also pose challenges for
reporting organizations”. They also state that alignment and harmonization must be a key goal
for those responsible for developing reporting instruments (Bartels et al. 2016).
The current financial accounting information system also seem to provide an inadequate
framework for reporting on how environmental and social responsibilities are met by the
organization. An accounting strength to shareholders is quantifying in monetary terms,
however, it has been a weakness in matters of environmental and social performance, as impacts
cannot always be valued in monetary terms. (Ratnatunga & Jones 2012b) Nevertheless, like
current financial accounting information systems, conventional management accounting
systems and practices still have limitations that make it difficult to collect and utilize sustainable
data, where this can lead to missing, inaccurate, misinterpreted information, and consequently
sub-optimal decision-making. (Buhr & Gray 2012) To quote Coulson and O’Sullivan (2014,
p.124):” How to evaluate the impacts of social and environmental performance on profitability
remains a problem for product providers and their market constituents. Thus, a debate on the
degree to which profit may be sacrificed for ethics is questionable, …”.
Contrary to these criticisms, Tregidga and Milne (2006) argues that sustainable development is
now something that can be measured and managed through scorecards. More obviously, reports
on the organization’s environmental and social impacts no longer stands in opposition to
financial reports where theses sustainable development reports reinforce a view of the
environment through the lens of business as usual (Tregidga & Milne 2006). Regardless, there
are still many organizations that do not incorporate sustainability issues in their usual business
since most of the instruments are predominantly voluntary (Lodhia 2012). Lodhia (2012, p.5)
stated that the voluntary mechanisms have improved corporate performance but nearly not
significantly enough, that mandatory initiatives have a greater extent to change ‘the business as
usual’ approach. Both voluntary and mandatory initiatives have enabled sustainability to be a
critical part of corporate agenda (Lodhia 2012), but the publication of sustainability reports has
been a responsibility of motivation of the organizations themselves (Buhr et al. 2014).
2.1.6 Reporting Instruments
“As sustainability reporting becomes ever more integral to global action on environmental and
social problems, so too do the policies, regulations, standards and other instruments that require

23
or encourage organizations to report” (Bartels et al. 2016, p.3). According to Bartels et al.
(2016), reporting instruments that surpass national boundaries can refine comparability and
efficiency of reports in a globalized economy, and strong reporting standards incur a vital task
to enable effective assurance. It was further stated that there is a growing movement for national
policy and instruments to strengthen existing international CSR or reporting frameworks.
(Bartels et al. 2016)
Organizations are supported by numerous initiatives in developing sustainability strategies and
reporting by offering tools guidance and inspiration. There are various internationally-accepted
sustainability frameworks and additional instruments, where some have an extensive
sustainability breath, where others focus on a specific sector or a single issue (such as
greenhouse gas emissions or climate change). (Bartels et al. 2016) Additionally, there are
various voluntary initiatives and certification schemes in specific industries that highlights the
response of industries in managing sustainability affairs specific to sector operations (Lodhia
2012). Bartels et al. listed some the key frameworks and other instruments:
• Global Reporting Initiative (GRI)
• The International Integrated Reporting Council (IIRC)
• The sustainability Accounting Standards Board (SASB)
• United Nations Global Compact (UNGC)
• OECD Guidelines for Multinational Enterprises
• ISO 26000
• Carbon Disclosure Project (CDP)
• Greenhouse Gas Protocol (GHG Protocol) Corporate Standard
• International Labour Organization (ILO) Tripartite declaration of principles concerning
multinational enterprises and societal policy
• UN Guiding Principles on Business and Human Rights
• UN-supported Principles for Responsible Investment (PRI) Reporting Framework
• Climate Disclosure Standard Board (CDSB)
(Bartels et al. 2016)
It should be noted that the frameworks can be further distinguished among normative,
management and reporting frameworks. Normative frameworks aid organizations measure their
impacts and shape sustainability vision and management approach, for example the UN Global
24
Compact Principles and the OECD Guidelines. A management standard such as the ISO 26000
provides guidance for organizations on the definitions and concepts of CSR. Reporting
frameworks like the GRI’s Sustainability Reporting Standards equip organizations with
disclosure items and metrics. (Bartels et al. 2016) There has been no scarcity of codes and
guidelines with initiatives while experimentation has played a role in sustainability reporting
development, but according to Buhr et al (2014, p.62) the GRI guidelines has been the most
influential, published and regularly updated since 2000.
2.2 Global Reporting Initiative (GRI)
“GRI is an international independent non-profit organization that helps businesses,
governments and other organizations understand and communicate the impact of business on
critical sustainability issues” for instance climate change, human rights, governance, social
well-being, corruption and numerous others (Bartels et al., 2016, p. 25; GRI, n.d.a). GRI
originated in 1997 by the Coalition for Environmentally Responsible Economies (CERES) with
support from the United Nations Environmental Program (UNEP), involving an extensive
multi-stakeholder governance and a comprehensive global consultation process (Lodhia 2012).
The participation and expertise from reporting organizations and information users globally
(GRI, n.d. a), provides credibility and international acceptance (Lodhia 2012). GRI also have
the benefit of strategic partnerships with the Organization for Economic Co-operation and
Development (OECD), the UN Global Compact, UNEP, and the International Organization for
Standardization (ISO) (Bartels et al., 2013).
The GRI mission is to empower decision-makers to act towards a more sustainable world (GRI,
n.d. a). Arena & Azzone (2012), voiced that GRI is the best know framework15 for voluntary
sustainable reporting and considered the most influential standard16. Referred to as triple
bottom line reporting, GRI is built on a global set of voluntary guidelines for reporting on
economic, environmental and social matters, set in international conventions and evolve
15 “Frameworks are defined as a set of principles or guidelines provided to assist companies in their disclosure efforts” (Sew 2017). 16 “Standards have a similar function to frameworks but exist in the form of more formal documentation that spells out the requirements and specifications that can be used to ensure sustainability efforts are consistently achieved” (Sew 2017).

25
constantly with new developments and changes in global issues. GRI guidelines and standards
are freely available, with additional technical protocols and sector supplements. (Lodhia 2012)
GRI is seen as a giant in the sustainability reporting guidelines and sustainability reporting
frameworks, as it has been referenced in 42 countries, in thousands of published reports by
companies in all sectors, unlicensed authorities and non-profits, even in governments or market
instruments. (Bartels et al. 2016; GRI, n.d. b)
A KPMG survey of Corporate Responsibility (CR) Reporting in 2015 and 2017 reported that
the Global Reporting Initiative (GRI) remains the most popular voluntary reporting guidance
worldwide. Of all the CR reporters in the 49 countries surveyed, 63 percent referenced the GRI,
and the GRI application rate for Stand-alone CR reports is 72 percent. Yet King and Bartels
reported that the use of GRI declined among the world’s largest companies, the G250
companies using the GRI framework declined form 81 percent in 2013 to 74 percent in 2015
and now to 75 percent in 2017. They further speculated the decline might be due to the
introduction of the GRI G4 framework which could be deemed more complex than the previous
frameworks or companies are applying CR information in annual or integrated reports and are
moving away from applying GRI. (King & Blasco 2017; King & Bartels 2015)
2.2.1 The GRI Sustainability Disclosure Database
The GRI Sustainability Disclosure Database brings exposure for and grants access to
sustainability reporting for a variety of stakeholders to search and locate information needed
(GRI, n.d. d). It is an extensive archive of sustainability reports that stores and tracks critical
reporting and associated organizational data (GRI, 2017). Sustainability reports published from
1999 until present day contribute to an extensive pool of data (GRI, n.d. d), as any type of report
can be registered in the Database be it a sustainability, corporate responsibility, or integrated
report, as long as it is publicly available (GRI, 2017).
GRI’s Database stores and tracks analytical reporting and associated organizational data such
as an organization profile and their report profile. Each organization possesses its own
organization profile page. The organization profile offers information about the organization
such as its name and a logo, a description of the organization, the size17 of the organization,
17 Classified as SMEs, Large Enterprises, or MNEs based on the EU definition of size (GRI 2017).

26
organizational type18, sector and country it belongs to, etc. Each organization profile includes
all the sustainability reports an organization has published in the database, accompanying a
report profile which includes information such as the title of the report, the publication year19,
report type20, adherence level, etc. (GRI 2017, p.5-10).
Sustainability reports can be classified according to their use of the different versions of GRI
sustainability reporting guidelines. Different versions of the GRI guidelines applied in a report
is indicated as follow: GRI-G1 (2000 issued), GRI-G2 (2002 issued), GRI-G3 (2006 issued),
GRI-G3.1 (2011 issued), GRI-G4 (2013 issued), and GRI-Standards (issued in 2016 and
currently valid). GRI reports can also be classified as GRI-Referenced, which uses individual
GRI standards in their report content, or Citing-GRI, where explicit reference to the GRI
guidelines is made in the reports. Additionally, sustainability reports can be classified as Non-
GRI, as there is no reference to the GRI Guidelines or GRI Standards in these reports, although
information on economic, environmental, social and governance performances are still
reported. (GRI 2017) Some reports might be omitted from the database, specifically if the report
is not published online (GRI n.d. d)
GRI based or otherwise, the Database gives users access to all types of sustainability reports,
supplying valuable information related to the reporting organizations. GRI reports21 share is
around 65% of the reports tracked in the database. The remaining reports are not based on GRI
Guidelines or GRI Standards, nevertheless includes sustainability disclosures. (GRI n.d. d) The
GRI database also possesses an advanced search functionality which allows the filtering and
sorting of reports to search for a specific organization, or apply filters to help refine search
results (GRI 2017; GRI n.d. d).
2.2.2 Principles and Standard Disclosures
G4 Guidelines is presented in two different documents, Reporting Principles and Standard
Disclosures. Reporting principles are criteria used to guide decision making throughout the
18 Private company, state-owned company, cooperative, subsidiary, public institution, non-profit organization, partnership (GRI 2017). 19 Publication year is not the year or period the report covers but the calendar year the report was published (GRI 2017). 20 GRI reports which are based on the GRI Standards or previous frameworks for (GRI 2017). 21 GRI Reports are reports which use the GRI Sustainability Reporting Framework and have a GRI Content Index (GRI 2017, p.10).

27
reporting process, comprising of 10 reporting principles of which 4 principles are designed to
be used in combination to define report content and 6 principles to guide choices on ensuring
report quality. Standard disclosures are the GRI framework applied by an organization to
prepare sustainability reports, consisting of two distinct types of standard disclosures, General
and Specific Standard Disclosures. (GRI 2015; Rodriquez, 2014) The General Standard
Disclosure consists of 58 general standard disclosures, illustrated in table 1 (GRI 2015).
Table 1: G4 General Standard Disclosure Overview
STRATEGY & ANALYSIS G4-1* G4-2
ORGANIZATIONAL
PROFILE STANDARDS
G4-3*
G4-9*
G4-15*
G4-4*
G4-10*
G4-16*
G4-5*
G4-11*
G4-6*
G4-12*
G4-7*
G4-13*
G4-8*
G4-14*
IDENTIFIED MATERIAL
ASPECTS & BOUNTDARIES
G4-17*
G4-23* G4-18* G4-19* G4-20* G4-21* G4-22*
STAKEHOLDER
ENGAGMENT G4-24* G4-25* G4-26* G4-27*
REPORT PROFILE G4-28* G4-29* G4-30* G4-31* G4-32* G4-33*
GOVERNANCE
G4-34*
G4-40
G4-46
G4-52
G4-35
G4-41
G4-47
G4-53
G4-36
G4-42
G4-48
G4-54
G4-37
G4-43
G4-49
G4-55
G4-38
G4-44
G4-50
G4-39
G4-45
G4-51
ETHICS & INTEGRITY G4-56* G4-57 G4-58
LEGEND - * requires General Standard Disclosures for both ‘in accordance’ criteria options
(Source: GRI 2015, p.21)
Specific Standard Disclosure consist of Disclosure on Management Approach (DMA) to
narrate information on how an organization identifies, analyses, and responds to its actual and
potential impacts; and Indicators which provides “information on economic, environmental and
social performance or impacts of an organization’s related material Aspects22” (GRI 2015,
p.47). DMA contain sufficient information to explain an organization’s response to economic,
environmental, and social material Aspects and how these aspects are managed, but where
aspects are not identified as material, it does not need to be covered in the report (GRI 2015).
Indicators include 91 specific disclosures across three categories: 9 economic disclosures, 34
environmental disclosures, and 48 social disclosures where social indicators are divided into 16
disclosures in labor practices and decent work, 12 human rights disclosures, 11 society
disclosures, and 9 disclosures in product responsibility, as illustrated in table 2. (GRI 2015)
22 “Material Aspects are those that reflect the organization’s significant economic, environmental and social impact; or substantively influence the assessment and decisions of stakeholders.” (GRI 2015, p. 47)

28
Table 2: The Specific Standard Disclosure Indicators
CATERGORY ASPECTS ELEMENTS
ECONOMIC (EC) Economic Performance
Market Presence
Indirect Economic Impacts
Procurement Practices
EC1 EC2 EC3 EC4
EC5 EC6
EC7 EC8
EC9
ENVIRONMENTAL (EN) Materials
Energy
Water
Biodiversity
Emissions
Effluents and Waste
Products and Services
Compliance
Transport
Overall
Supplier Environmental Assessment
Environmental Grievance
Mechanisms
EN1 EN2
EN3 EN4 EN5 EN6 EN7
EN8 EN9 EN10
EN11 EN12 EN13 EN14
EN15 EN16 EN17 EN18 EN19
EN20 EN21
EN22 EN23 EN24 EN25 EN26
EN27 EN28
EN29
EN30
EN31
EN32 EN33
EN34
SOCIAL – LABOUR
PRACTICES AND
DECENT WORK (LA)
Employment
Labour/Management Relations
Occupation Health and Safety
Training and Education
Diversity and Equal Opportunity
Equal Remuneration for Women and
Men
Supplier Assessment for Labour
Practices
Labour Practices Grievance
Mechanisms
LA1 LA2 LA3
LA4
LA5 LA6 LA7 LA8
LA9 LA10 LA11
LA12
LA13
LA14 LA15
LA16
SOCIAL – HUMAN
RIGHTS
Investment
Non-discrimination
Freedom of Association and
Collective Bargaining
Child Labour
Forced or Compulsory Labour
Security Practices
Indigenous Rights
Assessment
Supplier Human Rights Assessment
Human Rights Grievance Mechanisms
HR1 HR2
HR3
HR4
HR5
HR6
HR7
HR8
HR9
HR10 HR11
HR12
SOCIAL - SOCIETY Local Communities
Anti-corruption
Public Policy
Anti-competitive Behaviour
Compliance
Supplier Assessment for Impacts on
Society
Grievance Mechanisms for Impacts on
Society
SO1 SO2
SO3 SO4 SO5
SO6
SO7
SO8
SO9 SO10
SO11

29
SOCIAL – PRODUCT
RESPONSIBILITY
Customer Health and Safety
Product and Service Labelling
Marketing Communications
Customer Privacy
Compliance
RP1 PR2
PR3 PR4 PR5
PR6 PR7
PR8
PR9
(Source: GRI 2015, p.22-23
2.2.3 Adherence Level
Not all the GRI standard disclosures need to be reported. The G4 Guidelines propose adherence
levels for organizations to prepare its sustainability report ‘in accordance’ with the framework,
independent of for its type, size, sector or location. The Core23 option incorporates the vital
elements of a sustainability report where in the Specific Standard Disclosure the organization
should disclose the Generic DMA and at least one Indicator for each identified material Aspect.
The Comprehensive 24 option builds on the Core option by requiring additional Standard
Disclosures and all Indicators should be disclosed for each material Aspect identified. Both
options focus on the process of identifying material Aspects which, reflect the significant
economic, environmental and social impacts of an organization; or influence the assessment
and decision of stakeholders substantively. It should be noted that the two ‘in accordance’
options (Core and Comprehensive) do not relate to the quality of the report or the performance
of the organizations, it relatively reflects compliance with the Guidelines in sustainability
reporting (GRI 2015). Another option available is where there is no explicit ‘in accordance’
option declared, but the report contains a complete G4 Content Index, it can be reflected as
undeclared (GRI 2017).
The adherence levels reflect the extent to which the GRI sustainability reporting framework
and GRI standard disclosures have been applied to a report (GRI 2017), whether reports
produced according to the Core, the Comprehensive or Undeclared adherence levels, a
complete GRI Content Index regarding the standards disclosed should be included in the report
(GRI 2015, p.13). The standard disclosures consist of General Standard Disclosures and
Specific Standard Disclosures where the GRI Content Index follow the illustration in table 3.
23 Core option: supply the background against which an organization communicates the impacts of its economic, environmental and social and governance performance (GRI 2015). 24 Comprehensive options: additional disclosures of the organization’s strategy and analysis, governance, and ethics and integrity (GRI 2015).

30
Table 3: Illustration of the GRI Content Index
GENERAL STANDARD DISCLOSURES
General
Standard
Disclosures
(Such as G4-4)
Page Omissions (for ‘In accordance’ –
Comprehensive)
In exceptional cases, provide
reason for omission if it is not
possible to disclose required
information.
External Assurance
Indicate if the Standard has been
externally assured and include the page
reference for the External Assurance
Statement.
SPECIFIC STANDARD DISCLOSURES
Material Aspects
List identified
material
aspects25
DMA and Indicators
List Specific Standards
related to each identified
material aspect.
Include page number or
link
Omission
In exceptional cases,
provide reason for
omission if it is not
possible to disclose
required information.
External Assurance
Indicate if the Standard has
been externally assured and
include the page reference
for the External Assurance
Statement.
(Source: GRI 2015, p.31-35)
2.2.4 Criticism
Guided by the influence of the GRI, thousands of the world’s organizations, large and small,
private and public, produce sustainability reports voluntarily. The GRI framework provides for
noticeably flexibility in sustainability reporting which might have accelerated sustainability
reporting in recent years. (Buhr et al. 2014) Claimed to be the most universally accepted
standard for CSR reporting (Lodhia 2012), GRI is not without critics. Concern being the
voluntary nature or enforceability of these guidelines (Bebbington et al. 2014; Lodhia 2012).
Due to the voluntary nature of these guidelines, it has been argued that guidelines are cherry
picked by organizations to report only on those indicators that present them in a favorable light
which links compliance to an organization’s self-interest instead to its accountability
requirements (Lodhia 2012).
Seeing that SMEs can exert considerable pressure on the environment and society just like large
organizations, and some SMEs do report on their sustainability impacts using the GRI
framework, Arena and Azzone (2012) pointed out the specific features that makes GRI hardly
applicable for SMEs. Firstly, they argue that the very large set of key sustainability indicators
(91 specific standard disclosures in total) make it a costly reporting process for SMEs due to
25 “The information reported for each identified material Aspect can be disclosed as DMA and as Indicator(s).” (GRI 2015, p.43) Material aspects are those that reflect the organization’s significant economic, environmental and social impacts or substantively influence the assessments and decisions of stakeholders.” (GRI 2015, p.47)

31
the amount of data to be collected and analysed. Secondly, the protocol defined in the GRI
Framework for each indicator is not immediately applicable by SMEs and finally, comparably
concise sustainability indicators are missing. Arena & Azzone (2012, p.671) further concluded
that “These problems are not specific of GRI, but arise from a certain inherent feature of the
international standards for sustainability reporting, …”. In a quest to design guidelines that any
company in any industry can apply, where the country and industry-specific nature of
sustainability reporting require customise frameworks to a company’s reality, large
organizations might easily apply these frameworks, but fundamentally SMEs face barriers such
as lack of expertise, skills, and resources which limits their capacity to prioritise key issues.
(Arena & Azzone 2012)
2.3 SME Sustainability Reporting
It ‘pays to be green’ is a concept supported by evidence, although many SMEs struggle to adopt
such strategies as only organizations with sufficient resources are able to actively undertake
sustainability strategies (Clarkson 2012). Hörisch et al. (2014, p.775) explained best, noting
that large enterprises possess large amounts of resources where it can commit numerous
managers and entire departments to sustainability management, while “most SMEs dedicate
one manger already wearing multiple hats to sustainability tasks”. Presently new tools and
approaches are being developed within the scope of a SME’s strategic and competitive activities
to manage social and environmental issues Rather than seeing a CSR strategy as an ad hoc
expense, it should be considered as part of the organization’s performance and competitiveness.
(Džupina & Mišún 2014)
Policies, theories, and instruments appropriate for MNEs does not necessarily conform within
an SME environment as there is some distinguishing features of SMEs that make their
sustainability engagement potentially different from large enterprises, and consequently
specification is necessary for SMEs (Williams & Schaefer 2012; Bos-Brouwers 2009).
According to Džupina and Mišún (2014) it is possible to generalize recommendations for SMEs
to adopt appropriate sustainable strategies, which match their vision, missions and corporate
values. Yet it is dangerous to accept homogeneity of SMEs, as their characteristics vary
essentially in size and history, and across regions, sectors, cultures and ownership structures
(Džupina & Mišún 2014; Williams & Schaefer 2012).

32
According to Williams and Schaefer (2012, p.176), a “useful distinction between different types
of SMEs may be their motivation for being in business” such as: high growth/high profit-
oriented entrepreneurs (gazelles), often thought of being uninterested in ethical considerations;
and ‘normal’ SME owners who desires a work-life balance, satisfied by ‘sufficient’ profits to
earn a living and motivated by ethical personal interests and values. Thus, SMEs’ engagement
with environmental and social issues varies significantly between firms and therefore guides
different approaches to sustainable strategies in organizations (Džupina & Mišún 2014;
Williams & Schaefer 2012).
Hörisch et al. (2014, p.774) identified knowledge to be a crucial factor in the application of
sustainability tools and implementation of corporate sustainable strategies. Their analysis
revealed that larger organizations apply significantly more sustainability management tools,
seeing as the factor by which larger organizations have greater access to knowledge through
human and financial resources, thus they know more tools. In the analysis of the differences in
application of sustainable tools between SMEs and large organizations, if a particular tool is
known, suitable for both organizations, there appears to be no substantial differences that the
particular tool would be applied. In realty, the main differences seem to be that SMEs are
usually unaware of the existing tool, or probably do not possess (or devote) the resources to
become informed. (Hörisch et al. 2014)
Williams and Schaefer (2012, p.179) recorded that SME mangers built a holistic general
understanding of environmental and social issues, “on a diverse range of mostly popular sources
such as the media and film, rather than information targeted at them as a business”. Thus, these
managers felt “they had limited knowledge in a technical sense” and only “related to the detail
regarding what needed to be done at a practical personal and business level” which they
perceive undermined their ability to make decisions” due to contradictions in detail (Williams
& Schaefer 2012, p.180). Therefore, it may be justified that access to knowledge might be the
most important driver for the application of sustainable management tools. It was further
explained that knowledge also affects the degree of applying sustainability management tools,
and plays a prominent role directing development and implementation of sustainable
management by practitioners and academics without considering size. (Hörisch et al. 2014)

33
Considering the still fairly limited supply of literature focusing on SME sustainable
implementation, Williams and Schaefer (2012) noticed that even less has paid attention at
sustainable pro-active organizations. Essentially, the views of pro-active sustainable reporting
organizations could be valuable as these organizations already seem to have overcome some of
the traditional barriers SMEs face and are embracing the challenges and opportunities ahead of
their peers (Williams & Schaefer 2012).
Existing findings indicated, that the basic social responsibility for SMEs is customer
satisfaction, product quality and employee responsibilities such as health and safety of workers,
education of employees, and employment policy and focus on ‘green’ production, reduction of
environmental externalities (Džupina & Mišún 2014). Revell et al. 2009 found active
involvement in recycling, energy efficiency, responsible buying and selling, and carbon
emission reduction in a high percentage of owner-managers. Compared to SMEs, MNCs focus
more on preserving natural resources, ‘green’ corporate policy and culture, and issues dealing
with profit and business ethics (such as profitability, ethical behavior, transparency, and
marketing ethics) (Džupina & Mišún 2014); where Jansson et al. (2015) added recycling,
offering green products and services, and having an environmental management system.
Plugge and Wiemer (2008) distinguished in their research on SME sustainability reporting that
material, water, energy and emissions aspects were easy for SMEs to report, as it was figures
that was already measured prior to their project. “Indicators related to the day-to-day business
of factories, such as injury logs and financial data, were generally easy to come by.” (Plugge &
Wiemer 2008, p.26). They further described that certain aspects were specifically difficult to
report and thus speculated, that it might be due to specific systems that needed to be set-up to
measure indicators (Plugge & Wiemer 2008).
Indicators are increasingly recognized as a powerful tool, “something that helps you understand
where you are, which way you are going and how far you are form where you want to be”
(Sustainable Measures 2010). It provides a communication tool on information in fields such
as environment, economic, social, or technological performance of counties and corporates.
(Singh et al. 2009). Singh et al. (2009) pointed out that sustainable development indicators are
adopted by countries and corporate because indicators perform many functions and has the
potential to assess and evaluate performance, present trends, and summarize, focus and
condense complex information to a manageable amount of meaningful information. Indicators

34
additionally provide information to formulate strategies as well as communicating ideas, values
and achievements to decision makers (United Nations 2007).
Arena and Azzone (2012) stated that the large set of key sustainability indicators featured in
the GRI framework make it hardly applicable for SMEs. They additionally explained that
available instruments are not fitting for SMEs due to their complexity, limited flexibility and
formal procedure. Therefore, they added that the specificities from sustainability reporting
frameworks make it difficult for SMEs to adopt large organization practices. Accordingly, to
quote Arena and Azzone (2012, p.670) further, “One key need, in this connection, is for a
standard set of generally accepted, understandable and reliable key sustainability indicators
(KSIs), that can help distinguish a proactive SME form its competitors”.
Mentioned before, in the past it was mainly MNEs that reported on their sustainability impacts
and a debate whether SMEs should account for their sustainability impacts the same way large
organizations do, is still ongoing (Bartels et al. 2016). More robust regulatory approaches are
called for by some authors where compliance with regulations is perceived as an encouragement
for initial sustainable engagement (Williams & Schaefer 2012). The overall idea is that SMEs
differ in their situations and capacity from larger organizations which explains why SMEs relate
differently to sustainability (Jansson et al. 2015). Therefore, policy makers and regulators are
faced with a dilemma as greater regulation for very small organizations is not clear-cut; a
decision to introduce instruments that mandate sustainability reporting by SMEs, as SMEs have
limited resources to report, voluntary instruments have limited impacts (Bartels et al. 2016;
Williams & Schaefer 2012).

35
3 METHODOLOGY
Content analysis was the method utilized in the thesis where the research design was
quantitative. The thesis based its analysis on the contemporary sustainability reporting practices
of SMEs. The study explored whether there is a pattern of frequently disclosed sustainability
indicators SMEs report in their current sustainability reports. It was also scrutinized whether
there is a correlation between the number of sustainability indicators SMEs disclosed and the
size of SMEs. But first it was explored if there was an increase in sustainability reporting by
SMEs as well as the share of SMEs that applied a sustainability reporting framework for their
reports.
3.1 Sample Group
The empirical material consisted of the sustainability reports by SMEs who published and
registered their reports in the GRI Disclosure Database and use the GRI-G4 guidelines as a
framework for their sustainability reports. Altogether 52 reports were analysed. Noted before,
GRI has been the most influential guidelines and are regularly updated. Therefore, the G4
guideline has been selected as it supports the tipple bottom line, recommending performance
indicators relating to the organization’s economic, social, and environmental performance.
(Buhr et al. 20016)
The SMEs and their sustainability disclosures studied represented different operational business
logics, regardless of country. Data was gathered form the organization’s most recent
sustainability report published and the report profile. Primarily the data gathered was economic,
environmental and social specific standard disclosed in the GRI Content Index produced in G4
sustainability reports. The procedure executed to gather information/data consisted of several
steps.

36
3.2 Data Collection
The GRI Disclosure Database26 was employed to collect information on SME sustainability
reports registered it in the Database. Specifically, the advanced search functionality available
in the GRI Database was utilized to narrow the search to a specific or desired criterion. The
GRI search field had the following advanced search filters available: size, sector, country,
region, report type, and report year, as illustrated in figure 3.
Figure 3: Example of Search Filters (GRI)
First the increase in SME sustainable reporting was explored by collecting data of the total
companies who published sustainable reports per year, from 2008 to 2017. The database
advanced search filters were set to SME, where the report year was changed for every year
analysed from 2008 to 2017. No other filters were selected as the increase in SME sustainable
reported were analysed regardless of sector, country or report type. Each year’s result produced
by the database for the total organisations of SMEs reported was noted in a table. The same
procedure was applied to gather information on MNEs and large enterprises as well, for analysis
purposes.
Second the share of SMEs who adopted the GRI-G4 report framework were scrutinized. The
database advanced search filters were set to SME, where the report year was first changed to
2015 and the report type changed to G4, Non-GRI, Citing-GRI, G3.1 and G3 individually. All
other search fields stayed blank where each report type produced a value of the total amount of
SMEs who published a sustainability report for 2015. The value was noted down and the same
procedure was done for the year 2016 and 2017.
Next the advanced search filters were set to report type G4 and report years 2017, 2016, and
2015 were selected for SMEs. Different operational business logics (GRI sector classifications)
26 Link: http://database.globalreporting.org/

37
were selected in the advanced search filters. Thus, each sector selected individually in the
Database, presented the total SMEs who published G4 reports between 2015 to 2017. Under
their respective sector classification, the SMEs who registered their G4 reports between 2015
to 2017 was listed in an excel spreadsheet.
Each organization resulted from the search was selected and their most recent report extracted
through a ‘Link to the sustainability report PDF’ in their company profile, since some of these
organizations could have many registered reports in their company profile. Whenever the most
recent report was not in English, or any of the reports published in 2017, 2016, and 2015, the
organization was removed from the list. The organizations who published English reports were
listed under their respective sectors, and information was gathered into four different
spreadsheets created to group data according to general information, economic indicators,
environmental indicators, and social indicators.
General information gathered of each organization included the country of the organization and
the year of the most recent report published. General information from the reports extracted,
recorded the adherence level (Core, Comprehensive or Undeclared) and the number of
employees. Further, each report should include a GRI Content Index which summarise the G4
standard disclosures that was reported in the report. Thus, the sustainability indicators
(economic, environmental and social indicators) listed in the GRI Content Index of the reports
was recorded, each in their own spreadsheets according to the three dimensions. Six companies
were removed from the data set as their reports were not complete or sufficient for the analysis.
Finally, the indicators recorded in their respective spreadsheets were totaled. They were totaled
according to the number of indicators reported per company. They were also totaled according
to the frequency of each indicator that was disclosed. The totaled amounts form the economic,
environmental and social indicator data groups were summarized in a separate spreadsheet
where charts were created for analysis.
Consequently, in the GRI sustainability reporting database there was a total of 134 sustainable
reports published by SMEs, but due to language barrier, the total number of reports to be
analyzed fell to 58. During the data collection, 6 reports were found not to have the sufficient
information for the data and these organizations were removed from the empirical material. The
total SME sustainability reports to be analyzed was 52. The reporting organizations analyzed

38
were quite diverse. The reports were from many different countries all over the world. The
sustainability reports were also from different business logics, where one report is from
example the consumer durables sector, and 7 reports from the food and beverage product sector.
The year these 52 reports were published was almost equally spread out from 2015 to 2017,
where 17 reports were published in 2017, 16 reports in 2016 and 19 reports in 2015. The
adherence levels for the 52 reports resulted with 2 sustainability reports reported ‘in
accordance’ to the Comprehensive option, followed by 5 ‘Undeclared’ reports, and the rest
pursuing the ‘in accordance’ Core option of 45 reports.
A detailed table of general information to the countries, sectors, published year and the
adherence level of these reports, is supplied in Appendix 1. The total employees as well as the
total indicators disclosed of these organizations were also included in the table, although the
organization names were not.
3.3 Data Analysis
First the increase in SME sustainable reporting was explored. Each year’s total amount of
sustainability reports produced by the GRI database for 2008 to 2017 was recorded to create a
line chart. The line chart included results from the total of LE and MNEs sustainability reports
registered in the GRI database, where comparisons were drawn from the SME results.
Second the share of SMEs who applied the GRI-G4 report framework were scrutinized. All the
values recorded for the different report types was used to produce a stacked bar chart for each
of the total reports published in 2015, 2016 and 2017. The chart was used to analyse the share
of reports who used a reporting framework in their sustainability reports, and the share that did
not. It was further analysed if the reports applying a reporting framework increased.
The total amount of indicators disclosed in an organization was compared to the size of the
organization. The size of an organization was determined according to the total employees it
employed. Total revenue or turnover could not be used as basis for size classification since
many SMEs do not disclose their financial records in public reports. The data was first
incorporated into a scatter chart for analysis. The graph was found to be inadequate and did not
show a clear picture of the results. Four organizations with the biggest number of employees

39
was seen as outliers and removed from the data where a new scatter chart was created for
analysis. A bar chart was also created where the total employees (thus size of the organization)
was arranged in chronological order and plotted against the total amount of indicators disclosed.
In the bar chart the four largest organizations were included.
The average indicators disclosed by the 20 largest organizations and 10 largest organizations
was calculated and recorded in a table. The same was calculated for the 20 and 10 smallest
organizations. The averages were calculated for the total economic, environment and social
indicators disclosed as well.
The frequency of an indicator disclosed was analysed using a chart for each dimension. The
social category was divided into its sub-categories for chart analysis. Each category had its
indicators listed in a rate of report table and calculated as follow: the indicators which received
a high reporting rate of 50 percent or more, since the average indicator disclosure rate per
company was computed to be 25 percent; and indicators who earned a low reporting rate of 20
percent and less. Due the quantity of indicators listed under high reporting rate, was found to
be insufficient for analysis, the rate was lowered to 40 percent and the extra indicators was
listed and scrutinized.

40
4 RESULTS
4.1 Increase in Sustainability Reporting
First the increase in SME sustainability reporting was analyzed by recording the total number
of sustainability reports that was published for a certain year and incorporated into a line chart.
Figure 4 shows the increase in sustainability reporting between 2008 and 2017. Information in
the figure entails the total number of organizations who published sustainability reports in the
GRI Database between 2008 and 2017; categorized each year according to the GRI’s respective
size classification Small-to-Medium Size Enterprises (SME), Large enterprises, and Multi-
National Enterprises (MNE).
Figure 4: Increase in Sustainability Reporting (last updated 11 May 2018)
As seen from figure 4 above, sustainability reporting by organizations has increased in all three
organization sizes (SME, Large and MNE), although in some more significant than others. 2017
has recorded a dip in all three organizational sizes as this might be due to the difference in the
date when a company has published the report and the date when an organization registered its
128 196 263400 487 540 599 654 658 554
9761264
1700
2454
2890
3243
35423714
4229
3433
380 479624
9871218
14011614
1849 1947
1540
2008 2009 2010 2011 2012 2013 2014 2015 2016 2017
To
tal
Org
an
iza
tio
ns
Year
Increase in Sustainability Reports
SME Large MNE

41
report in the database. Thus, it is speculated that reports published in the end of 2017 could still
be in the process of registering to the database in 2018.
4.2 Share of Report Types Published
Next the share of report types published for SMEs in the GRI Database were explored as
illustrated by figure 5. The figure shows the total amount of SME who published sustainability
reports in 2015, 2016, and 2017, which have been divided according to the report type they
have adopted such as GRI-G4 reports, Non-GRI reports27, Citing-GRI reports28, and GRI-G3
and G3.1 reports in the respective year.
Figure 5: Share of Report types published (last updated 11 May 2018)
27 Non-GRI as all sustainability reports do not fall under the categories of GRI Standards but discloses information on economic, environmental, social and governance performance, and there is no reference the report is being based on the GRI Guidelines or GRI standards. (GRI 2017, p.10) 28 Citing-GRI that make explicit reference to being based on the GRI guidelines but do not include a GRI Content Index (GRI 2017, p.10)
43.4%49.1%
36.5%
30.1%
39.4%
55.1%
10.6%
11.6%
8.7%
9.9%
6.0%
0
100
200
300
400
500
600
700
2015 2016 2017
To
tal
Re
po
rtin
g S
ME
s
Year
Share of G4 Reports
G3
G3.1
Citing GRI
Non-GRI
G4

42
Observed in Figure 5 almost 50 percent of SME organizations who published a report in 2016
adopted the G4 guidelines in their sustainability reports. The share of G4 guidelines adopted
reports by SMEs have slightly risen from 2015 to 2016, which could indicate that more SMEs
have trusted the GRI framework to help incorporate sustainability measures in their reporting,
or it could mean that the G3 and G3.1 share of reporting SMEs in 2015 converted to the G4
guidelines in 2016. It also must be acknowledged that in 2017 the share of G4 report type has
declined quite considerably. This can be due to the difference in the date the SMEs published
and register their reports, as explained above, and the result can be regarded as inaccurate. GRI
has also launched their most recent GRI framework in 2016, called the GRI-standards where
SMEs could convert their G4 reports to the GRI-Standards. Still, it should be recognized that
the total share in reports incorporating a reporting framework (G3, G3.1 and G4 in total) has
declined, where the Non-GRI share of reports has increased quite considerably, even though
2017 does not give an accurate picture in the share of report types, Non-GRI has quite a huge
start.
4.3 Total Indicators Reported
Figure 6 and 7 feature the total indicators reported by an organization compared to organization
size. Through the total number of indicators an organization discloses, it can assume the
intensity to which organizations engage in their sustainable management. Organization size was
determined by the total employees an organization employ. Figure 6 indicated the total number
of indicators reported by an organization in relation to the organization’s size (total employees).
Figure 7 plots the same data but in a different manner where the organization size is illustrated
in a chronological order and a total number of indicators disclosed for each organization size is
shown.

43
Figure 6: Number of indicators reported by organization (last updated 1 March 2018)
Observing the figure above, it does not seem that the size of organization correlate with the
extent of reported indicators in the sustainability reports. Undoubtedly there is no inclination
of a regression line which would indicate larger organizations (total employees) report on more
sustainable indicators. Further detected is that some of the smallest organizations report more
indicators than some of the larger organizations. To confirm the impression of size does not
matter, the data was plotted in another chart as illustrated by figure 7 below.
0
10
20
30
40
50
60
70
80
0 500 1000 1500 2000 2500
TO
TA
L I
ND
ICA
TO
RS
DIS
CL
OSE
D
ORGANIZATION SIZE (TOTAL EMPLOYEES)
Intensity of Indicators Reported by Orgnizaiton

44
Figure 7: Intensity of indicators reported (last updated 1 March 2018)
Figure 7 above confirms the opinion derived from figure 6, disclosure of sustainable indicators
does not seem to be linked to organization size. Although, when considering averages (as shown
in table 7), there is a slight inclination that size does matter, but it must be considered whether
a difference in 3 or 4 out of 91 indicators is such a huge difference. Rather the biggest concern
should be that the average of the total indicators disclosed is at a low of 23 (25%) out of 91
indicators, where the average by dimension is a staggering low at: 22 percent for a total of 9
economic indicators; 26 percent for a total of 34 environmental indicators; and 25 percent for
a total of 48 indicators reported.
812
437
62626
868
2913
1627
1710
2353
1933
295
1312
1922
2813
1218
818
1048
874
66
1423
1138
2711
2026
4533
2440
3823
14
0 10 20 30 40 50 60 70 80
1
15
48
90
97
106
126
153
176
183
201
231
265
295
372
400
418
423
511
713
1318
1730
1895
2042
4253
8000
Total Indicators Disclosed
Org
an
iza
tio
n S
ize
(T
ota
l E
mp
loy
ee
s)Intensity of Indicators Reported

45
Table 7: Averages of indicators disclosed
Averages by the total indicators disclosed (rounded to the next higher
number)
Largest 10
organizations
28 Smallest 10
organizations
24
Largest 20
organizations
27 Smallest 20
organizations
24
Total average
23
Total average by Dimension:
Total average of Economic indicator disclosed 2
Total average of Environmental indicator disclosed 9
Total average of Social indicator disclosed 12
4.4 Frequency of Indicators Reported
Figure 8, 9, and 10 demonstrates the frequency of economic, environmental, and social
indicators disclosed in sustainability reports produced by SMEs. Figure 10 discloses the
frequency of social indicators reported, separated into its sub-categories: labor practices and
decent work, human rights, society, and product responsibility. Table 8, 9, and 10 represents
the different category’s reporting frequencies, listing the highest reporting frequencies and the
lowest reporting frequencies. Since a total of 52 companies were analyzed, the high reporting
rate of 50 percent and more for indicators was found to be a frequency of 26 disclosures or
more. As there were only a few indicators who received a frequency of 26 and more, for a more
accurate analysis of the frequency of indicators disclosed, the high rate of reporting indicators
was adjusted and lowered to 40 percent. Therefore, the frequency has lowered to 20 disclosures
and more. On the other hand, the low reporting rate of 20 percent and less for indicators was
found to be a frequency of 10 disclosures and less.

46
4.4.1 Economic Indicators
Figure 8: Frequency of Economic Inidcators Disclosed
Table 8: Economic Indicator Reporting Rate
FREQUENCY INDICATOR
HIGH (50% AND MORE)
30 EC1 Direct economic value generated and distributed
LOW (20% AND LESS)
5 EC6 Proportion of senior management hired form the local
community at significant locations of operations
7 EC5 Rations of standard entry level wage by gender compared to
local minimum wage at significant locations of operation
7 EC7 Development and impact of infrastructure investments and
services supported
8 EC8 Significant indirect economic impacts, including the extent
of impacts
10 EC4 Proportion of spending on local suppliers at significant
locations of operation
(GRI, 2015, p.48-51)
The economic dimension “concern the organization’s impact on economic conditions of
stakeholders” and the indicators emphasize “the flow of capital among different stakeholders,
and the main economic impacts of the organization throughout society (GRI 2015, p.48). Out
of the 52 organizations analyzed, 35 percent (18) of the organizations did not disclose any
economic performance indicators as many of them disclosed that it is not part of their policy to
disclose their financial information to the public. Although through the rest of the reports, it is
clear from the figure 8 which indicator is reported on the most. The most common economic
30
11
11
10
7
5
7
8
16
0 5 10 15 20 25 30 35
EC1
EC2
EC3
EC4
EC5
EC6
EC7
EC8
EC9
Frequency of Disclosure
Eco
no
mic
In
dic
ato
rs
Economic Indicators

47
indicator reported is EC1 as 30 out of 52 (58 percent) companies reported on direct economic
value generated and distributed. Worth noting was the next most common indicator reported
on was EC9, with 16 out of 52 (31 percent) organization reported on the proportion of spending
on local suppliers at significant locations of operation. The rest of the indicators did not get
much attention, with 11 (21percent) or less companies reporting on the rest of the indicators
and 56 percent (5 out of 9) of the indicators fell in the low reporting rate. The three lowest
indicators reported on was EC6 at 10 percent, EC5 and EC7 with 13 percent each.
4.4.2 Environmental Indicators
Figure 9: Frequency of Environmental Indicaros Disclosed
Table 9: Environmental Indicator Reporting Rate
FREQUENCY INDICATOR
HIGH (50% AND MORE)
39 EN3 Energy consumption within the organization
33 EN23 Total weight of waste by type and disposal method
30 EN15 Direct greenhouse gas (GHG) emissions, scope 1
27 EN8 Total water withdrawal by source
177
395
1823
727
101010
67
530
2312
1316
411
1833
121
39
524
1412
156
7
0 5 10 15 20 25 30 35 40 45
EN1
EN3
EN5
EN7
EN9
EN11
EN13
EN15
EN17
EN19
EN21
EN23
EN25
EN27
EN29
EN31
EN33
Frequency of Disclosure
En
vir
on
me
nta
l In
dic
ato
r
Environmental Indicators

48
ADJUSTED (40% AND MORE)
24 EN29
Monetary value of significant fines and total number of non-
monetary sanctions for non-compliance with environmental
laws and regulations
23 EN6 Reduction of energy consumption
23 EN16 Energy indirect greenhouse gas (GHG) emissions, scope 2
LOW (20% AND LESS)
1 EN25
Weight of transported, imported, exported, or treated waste
deemed hazardous under the terms of the Basel conversation
annex I, II, III, and VIII, and percentage of transported waste
shipped internationally
3 EN26
Identity, size, protected status, and biodiversity value of
water bodies and related habitats significantly affected by the
organization’s discharges of water and runoff
4 EN20 Emissions of ozone-depleting substances (ODS)
5 EN4 Energy consumption outside of the organization
5 EN14
Total number of IUCN red list species and national
conservation list species with habitats in areas affected by
operations, by level of extinction risk
5 EN28 Percentage of products sold and their packaging materials
that are reclaimed by category
6 EN12
Description of significant impacts of activities, products, and
services on biodiversity in protected areas and areas of high
biodiversity value outside protected areas
6 EN33 Percentage of new suppliers that were screened using
environmental criteria
7 EN2 Percentage of materials used that are recycled input materials
7 EN7 Reductions in energy requirements of products and services
7 EN13 Habitat protected or restored
7 EN34
Number of grievances about environmental impacts filed,
addressed, and resolved through formal grievance
mechanisms
9 EN27 Extent of impact mitigation of environmental impacts of
products and services
10 EN9 Water sources significantly affected by withdrawal of water
10 EN10 Percentage and total volume of water recycled and reduced
10 EN11
Operational sites owned, leased, managed in, or adjacent to,
protected areas and areas of high biodiversity value outside
projected areas
(GRI 2015, p.52-63)
The environmental category involves an “organization’s impact on living and non-living
natural systems, including land, air, water and ecosystems” (GRI 2017, p.52). Off all 34
environmental indicators, it can clearly be seen there are a few favorable indicators reported
on. The indicators on which more than 50 percent of the companies reported on was: EN3 with

49
the highest rate of 75 percent; then EN23 with the second highest reporting rate of 63 percent;
EN15 with 57 percent reported rate; and EN8 at a rate of 52 percent. Unmistakably EN25 and
EN26 were the indicators that got the least attention from organizations with EN20 not far
behind. There were quite a few environmental indicators that fell under the low report rate, 16
out of 34 indicators, thus 47 percent of the total environmental indicators.
4.4.3 Social Indicators
The social section involves the “impacts the organization has on the social system within which
it operates” (GRI 2017, p.64). The social category is divided into labor practices and decent
work, human rights, society, and product responsibility sub-categories, where most of the
content is “based on internationally recognized universal standards or other relevant
international references” (GRI 2017, p.64). The most notable social indicators reported was in
the labor practices and decent work sub-category. The three indicators most reported was LA6
resulted in a 75 percent reporting rate, LA9 a 62 percent reporting rate, and LA1 a 54 percent
reporting rate. Another high reporting rate of 52 percent was received by PR5 indicator under
the sub-category, product responsibility. Like environmental indicators, many of the social
indicators have a low reporting rate. Off all the 48 social indicators available, 21 indicators fell
under the low reporting rate, thus 44 percent of the total indicators available for social
disclosure in sustainable reports.
Many of the companies who reported gave their attention to the labor practices and decent work
social indicators. This can be observed from figure 10 and table 10 below, as 5 labor practices
and decent work indicators received a 40 percent reporting rate or over, compared to human
rights, society, and production responsibility which only received one in each sub-section.
Human rights sub-section received the least attention as 67 percent (8 out of 12) of its indicators
fell in the low reporting rate criteria, closely followed by society sub-section, encountering 64
percent (7 out of 11) of its indicators in the low reporting rate. Thus, human rights and society
make up 71 percent of the total low reporting rate indicators collectively.

50
2819
139
2339
129
3212
1420
1211
614
0 5 10 15 20 25 30 35 40
LA1
LA3
LA5
LA7
LA9
LA11
LA13
LA15
Frequency of Disclosure
La
bo
r P
ract
ice
s a
nd
De
cen
t W
ork
3
9
14
9
21
15
7
7
3
12
6
10
0 5 10 15 20 25 30 35 40
HR1
HR2
HR3
HR4
HR5
HR6
HR7
HR8
HR9
HR10
HR11
HR12
Frequency of Disclosure
Hu
ma
n R
igh
ts20
6
10
15
12
4
7
18
8
5
4
0 5 10 15 20 25 30 35 40
SO1
SO2
SO3
SO4
SO5
SO6
SO7
SO8
SO9
SO10
SO11
Frequency of Disclosure
So
cie
ty
14
13
18
11
27
4
9
8
14
0 5 10 15 20 25 30 35 40
PR1
PR2
PR3
PR4
PR5
PR6
PR7
PR8
PR9
Frequency of Disclosure
Pro
du
ct R
esp
on
sib
ilit
y
Social Indicators
Figure 10: Frequency of indicators disclosed

51
Table 10: Social Indicators Reporting Rate
FREQUENCY INDICATOR
HIGH (50% AND MORE)
39 LA6
Type of injury and rates of injury, occupational diseases, lost
days, and absenteeism, and total number of work-related
fatalities, by region and by gender
32 LA9 Average hours of training per year per employee by gender,
and by employee category
28 LA1 Total number and rates of new employee hires and employee
turnover by age group, gender and region
27 PR5 Results of surveys measuring customer satisfaction
ADJUSTED (40% AND MORE)
23 LA5
Percentage of total workforce represented in formal joint
management-worker health and safety committees that help
monitor and advise on occupational health and safety
programs
21 HR5
Operations and suppliers identified as having significant risk
for incidents of child labor, and measures taken to contribute
to the effective abolition of child labor
20 SO1 Percentage of operations with implemented local community
engagement, impact assessment, and development programs
20 LA12
Composition of governance bodies and breakdown of
employees per employee category according to gender, age
group, minority group membership, and other indicators of
diversity
LOW (20% AND LESS)
3 HR1
Total number and percentage of significant investment
agreements and contracts that include human rights clauses
or that underwent human rights screening
3 HR9 Total number and percentage of operations that have been
subject to human rights reviews or impact assessment
4 SO6 Total value of political contributions by country and
recipient/beneficiary
4 SO11 Number of grievances about impacts on society filed,
addressed, and resolved
4 PR6 Sale of banned disputed products
5 SO10 Significant actual and potential negative impacts on society
in the supply chain and actions taken
6 LA15 Significant actual and potential negative impacts for labor
practices in the supply chain and actions taken
6 HR11 Significant actual and potential negative human rights
impacts in the supply chain and actions taken
6 SO2 Operations with significant actual and potential negative
impacts on local communities
7 HR7
Percentage of security personnel trained in the organization’s
human rights policies or procedures that are relevant to
operations
7 HR8 Total number of incidents of violation involving rights of
indigenous peoples and actions taken
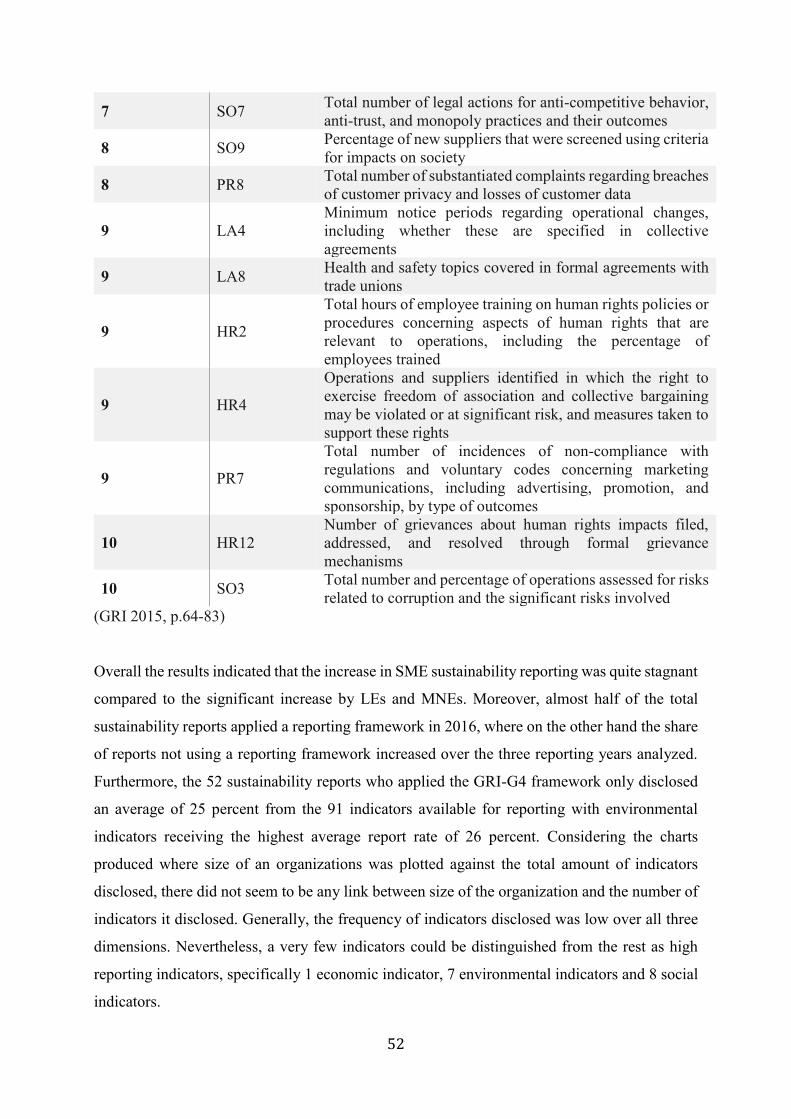
52
7 SO7 Total number of legal actions for anti-competitive behavior,
anti-trust, and monopoly practices and their outcomes
8 SO9 Percentage of new suppliers that were screened using criteria
for impacts on society
8 PR8 Total number of substantiated complaints regarding breaches
of customer privacy and losses of customer data
9 LA4
Minimum notice periods regarding operational changes,
including whether these are specified in collective
agreements
9 LA8 Health and safety topics covered in formal agreements with
trade unions
9 HR2
Total hours of employee training on human rights policies or
procedures concerning aspects of human rights that are
relevant to operations, including the percentage of
employees trained
9 HR4
Operations and suppliers identified in which the right to
exercise freedom of association and collective bargaining
may be violated or at significant risk, and measures taken to
support these rights
9 PR7
Total number of incidences of non-compliance with
regulations and voluntary codes concerning marketing
communications, including advertising, promotion, and
sponsorship, by type of outcomes
10 HR12
Number of grievances about human rights impacts filed,
addressed, and resolved through formal grievance
mechanisms
10 SO3 Total number and percentage of operations assessed for risks
related to corruption and the significant risks involved
(GRI 2015, p.64-83)
Overall the results indicated that the increase in SME sustainability reporting was quite stagnant
compared to the significant increase by LEs and MNEs. Moreover, almost half of the total
sustainability reports applied a reporting framework in 2016, where on the other hand the share
of reports not using a reporting framework increased over the three reporting years analyzed.
Furthermore, the 52 sustainability reports who applied the GRI-G4 framework only disclosed
an average of 25 percent from the 91 indicators available for reporting with environmental
indicators receiving the highest average report rate of 26 percent. Considering the charts
produced where size of an organizations was plotted against the total amount of indicators
disclosed, there did not seem to be any link between size of the organization and the number of
indicators it disclosed. Generally, the frequency of indicators disclosed was low over all three
dimensions. Nevertheless, a very few indicators could be distinguished from the rest as high
reporting indicators, specifically 1 economic indicator, 7 environmental indicators and 8 social
indicators.

53
5 DISCUSSIONS
The idea that SMEs should account for their environmental and social value they add and
destroy like their larger counterpart, and not only focus on short-term economic profits, received
traction over the years (Arena & Azzone 2012). SMEs have been portrayed as laggards in
sustainability reporting research materials where on the other hand it has also been reported that
SMEs in various regions have begun to publish sustainability reports. GRI has followed this
movement through many projects where it was established that SMEs found sustainable
reporting more valuable than expected (Rodriguez 2014). Therefore, the purpose of this thesis
is to shed light on the current state of SME sustainability reporting, focusing on the indicators
they report on. The study explored if there is a pattern of common indicators SMEs disclose in
their sustainability reports, and questioned if the size of these SMEs could contribute to the
extent of indicators an organization disclose in its sustainability report. Each sustainability
report analyzed in this thesis conformed to the GRI framework of which the focal point of the
GRI guidelines is to include non-financial reporting on economic, environmental and social
dimensions to a wider range of stakeholders. Reports can be perceived as an important
mechanism to communicate a significant message to stakeholders and create an image of
sustainability.
Although, first the development in SME sustainability reporting was scrutinized through the
total reports registered in the GRI database, and by exploring the share of reports utilizing a
sustainability reporting framework. Noted before that SMEs lag behind when it comes to
sustainability reporting and taking responsibility for their impacts (Arena & Azzone 2012). The
results indicated that SMEs have been lagging and still are when it comes to producing
sustainability reports. However, an increase in sustainability reporting in all three size
classifications was shown, the increase in total sustainability reports produced by LE and MNEs
have been quite significant compared to SMEs.
First it is quite surprising that the increase in SME sustainability reporting is not more
substantial. Especially considering the magnitude and importance SMEs play in a country and
for its economy, where SMEs are an important source in global supply chains (Bartels et al.
2016; Plugge & Wiemer 2008) and roughly represents eighty percent of all globally registered
enterprises (Hörisch et al. 2014). Hörisch et al. (2014) explained, that larger organizations are
54
more engaged in implementing sustainable management as they are driven by higher levels of
visibility, to media, NGOs, and governmental scrutiny, but also face high levels of pressure
from stakeholders to respond to demands and in turn apply sustainability management. SMEs
experience less public and stakeholder scrutiny which may be the reason why SMEs get away
with fewer reasons to incorporate sustainability measures. Yet, it must be kept in mind that
SMEs are not required to report on their business impacts and that most sustainability measures
are voluntary.
Revell et al. (2009) concluded in their study that owner-managers are motivated by the ‘pull’
of potential savings, new customers, higher staff retention and good publicity rather than the
push’ of legislation. Nevertheless, it can be perceived that the ‘push’ of legislation has a greater
effect on producing sustainability reports than ‘pull’ potentials. Thus, the stagnant increase in
SME sustainability reporting can suggest that mandatory reporting legislations and regulations
might be the only means for rapid increase in reporting rates. On the other hand, SME
sustainability is not necessarily reported in an officially published form of report, but could also
be included in low degree of formalization, in forms or mediums such as websites, pamphlets,
non-official reports, advertisements, etc.
Except, a sustainability report presents a useful framework to which an organization can be
assessed. When the share of SMEs utilizing a sustainability reporting framework against the
total SME reports published in a certain year was explored, it was found that the share of
SMEs implementing the GRI-G4 framework fluctuated. The results indicated that more than
50 percent of SMEs that published sustainability reports in 2015, incorporated a GRI
reporting framework, while in 2016, almost 50 percent of SMEs that published sustainability
reports incorporated the GRI-G4 framework. In contrast, the share of Non-GRI report types
increased considerably over the 3 years analyzed, where in 2017, securing over 50 percent
report rate of the total sustainability reports published by SMEs. Non-GRI reports discloses
economic, environmental, social and governance performance, but these sustainability reports
do not fall under the GRI standards as there is also no reference of the report being based on
the GRI guidelines (GRI 2017).
The decline of SME sustainability reports incorporating a framework might have been due to
many reasons. Although, this could be an indication that SMEs might want to report on
sustainable issues but they are struggling to incorporate the GRI framework. Since there is
55
sustainability reports published by SMEs, it seems that more reports are being published without
incorporating a reporting framework than with. However, the GRI framework has also been
criticized providing considerable flexibility in reporting (Buhr et al. 2014), organizations cherry
picking the information they want to disclose in their reports. Take for example the GRI-G4
guidelines with its three adherence levels. If an organization reports ‘in accordance’ to the Core
option, for each identified material Aspect, a DMA and at least one Indicator should be
disclosed. Compared to the Comprehensive option, for each identified material Aspect, a DMA
and all the Indicators should be disclosed, where ‘Undeclared’ reports have no explicit ‘in
accordance’ option declared but incorporate a complete G4 Content Index. (GRI 2015) Hardly
surprising that 87 percent of the SME sustainability reports analyzed incorporated the ‘in
accordance’ Core option of the GRI-G4 guidelines.
The GRI framework has been further criticized that their extensive set of sustainability
indicators make it a costly process for the indicator data to be collected and analyzed, and that
it is not necessarily suitable for SMEs (Arena & Azzone 2012). Arena & Azzone (2012, p.671)
further concluded that “These problems are not specific of GRI, but arise from a certain inherent
feature of the international standards for sustainability reporting, …”. Therefore, considering
the flexibility of the GRI framework, it needs to be questioned whether this is the reason why
SMEs choose to report, as they are given the freedom to not focus on an extensive set of
indicators.
Arena and Azzone (2012) pointed out, the GRI framework has a very large set of key
sustainability indicators, 91 specific standard disclosures to be exact. Literature claims that
company size affects sustainability application (Džupina, & Mišún 2014 & Hörisch et al. 2014),
where Hörisch et al. (2014) went further and identified knowledge to be a crucial factor in
sustainable application. From the studied SMEs, it can be assumed that knowledge might be
thought of as the key to applying sustainability reporting and that size seems not to be linked to
an organization engagement in sustainability reporting. An average of the 20 largest SMEs
disclosed 30 percent (27) of the 91 indicators, where the average of the 20 smallest SMEs
disclosed 26 percent (24) of the 91 indicators. The difference in 3 indicators from 91 indicators
is presumed not to be of a great concern. The troublesome fact is that the average of the total
indicators disclosed by the studied organizations was 25 percent (23 indicators), considering
the statements from Buhr et al. (2014) and Hörisch et al. (2014), an organization’s seriousness
in their responsibilities and how strongly an organization engages is sustainability management,

56
can be seen from the application of such tools and their activities across all three sustainable
dimensions.
The intensity to which SMEs disclose indicators across all three sustainable dimensions;
economic, environmental, and social, was substantively low according to the results. It is of no
surprise that the average for economic indicator disclosure is low, as only 18 of the 51
organizations used for analysis, did not report on economic indicator since these SMEs do not
disclose any financial information in public reports. Yet an average low for both environmental
indicators and social indicators was recorded at 26 and 25 percent respectively. In the low
intensity of disclosing sustainable indicators and identifying knowledge as a crucial factor in
applying sustainability measures, it appears that knowledge can be seen as one of the biggest
barrier to overcome. However, knowledge is not the only barrier SMEs face when incorporating
sustainability measures, capital, time and skilled personnel are all crucial elements in an
organization when incorporating sustainable elements into business. All these elements might
be interlinked, as Arena & Azzone (2012) explains, many SMEs do not have the adequate skills
to implement sustainability practices and important resources, such as time and money prevent
them from acquiring the knowledge and skills needed to develop sustainable practices where at
the same time, lack of expertise limits their capacity to prioritize time and resources required.
In the study, very little indicators received a high reporting rate in all three categories of the
GRI Framework. Only 1 Economic indicator, and 4 indicators in each Environmental and Social
category had been disclosed by more than 50 percent of the organization studied. Thus, barely
10 percent of all the indicators available to be reported was disclosed by 50 percent of the
organizations analyzed. It was expected that there would have been a more diverse selection of
indicators disclosed by the reporting organizations as the criteria for the high reporting rate was
already set at 50 percent, if none of the indicators received a reporting of more than 75 percent.
Most of the indicators disclosed, 46 percent of all the indicators, fell in the 50 – 20 percent
reporting rate rage. Consequently, in the pursuit of a clear pattern in sustainability reporting
indicators disclosed, was not so clear-cut as anticipated. The few indicators which received the
highest reporting rate did not cover 25 percent of the Aspects available to report in the GRI
Framework, where the society and human rights sub-category in the social category did not
even get one indicator in the rankings.

57
Although, the 9 most common indicators reported were comprised of the following Aspects:
economic performance (EC1) in the Economic category; energy (EN3), water (EN8), emissions
(EN15), and effluent and waste (EN23) in the Environmental category; and employment (LA1),
occupational health and safety (LA6), training and education (LA9), and product and service
labeling (PR5) in the Social category. These Aspects and indicators could be a definite starting
point for those wanting to embark sustainability reporting. When the high reporting rate was
adjusted to 40 percent, 3 more Environmental indicators and 4 more Social indicators joined
the rankings. This supplied a more diverse view in the social Aspects reported of the most
common indicators supporting sustainable reporting with diversity and equal opportunity
(LA12), child labor (HR5), and local community (SO1). Occupational health and safety (LA5),
energy (EN6), and emissions (EN16) were Aspects that were already included in 50 percent
reporting rate, but their indicators differ. Another Aspect included to the adjusted reporting rate
is compliance (EN29) from the Environmental category.
On the other hand, 46 percent (42 out of 91) of all the indicators disclosed were reported only
by 20 percent of the organizations. Therefore, it can be observed that 80 percent of the total
organizations did not report on almost half of the total suggested indicators supplied by the GRI
framework. It can be assumed, due to the low degree of reporting for these indicators, they are
perceived as irrelevant to the specific organizations sustainable reports, and that those
organizations who did disclose these specific indicators was an important aspect in the sector
these SMEs operated in. It can also be assumed that some of these indicators might have been
too complex and information difficult to come by for SME reporting. The reasons for SMEs not
reporting on these specific sustainability indicators may spark different opinions, yet when only
the results are considered, it shows a clear pattern of indicators which can be assumed as
immaterial when wanting to introduce a general set of topics to which all SMEs can relate and
report.
The general observation was that despite the many barriers SMEs face and despite the low
degree of sustainability reporting, SMEs are supplying sustainability reports. Even though the
low reporting rate, some level of sustainable management is genuinely better than none.
Williams and Schaefer (2012) claimed that pro-active sustainability reporting SMEs could
supply valuable information as they already seem to have overcome some of the traditional
barriers SMEs face. In the analysis of pro-active sustainably reporting SMEs, it highlighted
some key sustainability reporting themes. Some of these themes were already mentioned in a

58
study by Plugge and Wiemer (2008) in SME sustainability reporting, where they have noted
that SMEs found these aspects easy to report on since some of the indicators were already being
measured, thus also known, prior to incorporating sustainability reporting. This could be a
starting point in building a sustainability reporting framework specifically tailored to SMEs and
in turn improving SME sustainability reporting by making it uncomplicated and effortless to
implement. In the hope of instigating a concise set of general sustainable indicators to be
recommended for SME sustainability reporting, the thesis has encountered too many limitations
which questions the accuracy of the results, but could be a lead to many future research.
First, it must be noted, since the information gathered utilized content analysis, it limits the
gathered data to be of a quantitative nature rather than a qualitative, and therefore it fails to
explain the quality of the sustainability reports. Considering the low degree and intensity in
SME reporting, the quality of the reports disclosed is essential for future research in SME
sustainability reporting. Through the quantitative research it illustrated what the study’s
research sample SMEs focused on the most in their sustainability reports, but with qualitative,
it can be seen to what degree SMEs report in their economic, environmental, and social impacts,
performances and management.
The results were also limited by the small sample size. Considering the extremely huge
magnitude of SMEs in economies, roughly represented by 80 percent of all globally registered
enterprises, the sample size was only of 52 organizations. There were a few more reports
available for analysis, although more than half of the total reports were in different languages
than English, which might have produced more accurate results for the study. Also, it must be
noted that any remarks and conclusions made regarding SMEs, could only be done considering
the very small sample size, and not for SMEs in general.
Further, the sample size did not take the country, sector, and all the different reporting types
into consideration, therefore the results only show a general indication what SMEs reported in
according to the GRI-G4 reporting framework, therefore the results cannot speak for the SME
group as a whole. Accordingly, the sample group should be expanded to increase the reliability
of the results. Comparing whether a general set of indicators can be implemented across
different sectors and regions for ease of first-time reporting. Further comparing and assembling
a general set of indicators applicable according the SMEs incorporating a different reporting
framework or none at all.

59
Further, the quality of the results is directly dependent on the quality of the GRI Content Indexes
supplied in the reports, and therefore the results are determined by the completeness and
reliability of the indicators supplied in these indexes. Consequently, understanding the motives
and drive why some indicators are disclosed in reports and especially why others are omitted,
is a key to understanding why these voluntary indicators were reported on. Additionally, the
previous reports and first-time reporters were not considered. This could shed light on the extent
first-time reporting organizations report, and in the case of companies who have supplied
reports regularly, if reports show the same information or has the reporting company progressed
in its reporting. But of the utmost important, collecting information on reporting companies that
have quit reporting on their sustainability issues or quit reporting according to a sustainability
framework, and the reasons why.

60
6 CONCLUSIONS
SME sustainability reporting has increased over the years, but not nearly what is expected since
their huge presence in economies. Hardly surprisingly SMEs are portrayed as laggards
compared to the magnitude of increase in MNE and LE sustainability reporting. Large
organizations and SMEs might operate in the same environment, but they operate in different
ways as they tend to articulate different principle of responsibilities. Additionally, characteristic
differences in SMEs frustrate them when sustainable measures are attempted. Researchers has
identified many barriers SMEs face in incorporating sustainable measures, but the most
significant barrier is identified as lack of resources, such as time, money, skilled personnel and
knowledge.
Attempts to assist sustainability reporting from institutions such as the GRI has been
controversial. GRI boasts with a reporting framework that accompanies an extensive set of key
reporting indicators to standardize sustainability reporting for all sorts of organizations,
although the GRI framework have been criticized being too complex, costly and time
consuming for SMEs. From the results the SMEs incorporating the GRI reporting framework
and not is 50/50, while there is a slight inclination that more SMEs are not incorporating a
reporting framework. Yet the GRI framework has also been scrutinized for being flexible in
sustainability reporting, too flexible that organizations are cherry picking the information they
want to disclose and not necessarily have to. However, whether this flexibility be a reason for
increase in SME sustainability reporting, could be a valuable contribution in SME sustainability
reporting utilizing frameworks for future research.
Despite GRI’s extensive set of key sustainable indicators and the flexibility in incorporating
them into sustainability reports, the average total number of indicators disclosed by SMEs was
calculated to be 23 out of 91 indicators, thus an average of 25 percent. The low average rate in
indicator disclosure by SMEs could be a confirmation that the GRI framework is too complex,
costly, or time consuming. It can also indicate that SMEs are in need for a concise set of
indicators, making reporting more effortless and uncomplicated. Additionally, a key barrier to
SME sustainability reporting is knowledge. The extent of indicators disclosure seems to be
linked to knowledge or ease of disclosure, irrespective of the of the size of the organizations,

61
even in the SME size group. Therefore, the low rate in sustainability indicator reporting further
suggest for a concise set of indicators.
Due to the small sample size, and flexibility and low rate of indicator disclosure in companies,
the intensity to which SMEs disclosed indicators across all three sustainable dimensions was
equally low. This complicated the aim to discern an accurate pattern for a full set of common
indicators disclosed. Even though only a few indictors received a high rate of disclosure, it gives
some indication to which indicators SMEs find significant and straightforward to report. The
indicators were also of the kind for which information was already available and/or easy to
come by. These indicators fell into economic performance, energy, water, emissions, effluent
and waste, employment, diversity and equal opportunity, occupational health and safety,
training and education, child labor, local community, product and service labelling, and the
compliance spectrum. Because the thesis applied only quantities measures and did not regard
quality of the indicators disclosed, only the scope to which an indicator applies could be
suggested and therefore further research is in the qualitative nature in these sustainable
indicators is essential to suggest a set of general indicators a SME can incorporate into their
sustainability reports.
There has also been a notable number of sustainability indicators which did not receive much
attention from SMEs. It could be concluded that these indicators are irrelevant to SME
sustainability reporting, although it has been reported and may be deemed important due to the
organizations specific sector or circumstances. The thesis did not consider the sectors in which
the SMEs operate. Accordingly, there is much room for further research into SME sustainability
reporting, the framework they apply and the indicators they disclose. This could for example
lead to an uncomplicated and accurate set of sustainability indicators specifically tailored for
SMEs to utilize as a reporting framework breaking the barriers so many SMEs face in
sustainable management.
In a constantly changing world, where sometimes even large organizations struggle to keep
their head above water, the Global Head from KPMG Sustainability Services, José Luis Blasco
warned in their 2017 CR reporting survey, he wanted to get three important messages across:
“Firstly, get ready for more reporting regulation because it is on the way. Secondly, be clear
that reporting integration is the new normal and ‘non-financial’ is the new financial. Finally,
remember that from here on in, it’s all about reporting your impacts not just statistics.” (Blasco

62
& King 2017) Therefore the question lies, where does this leave SMEs in the whole spectrum
of sustainability?

63
REFERENCES
Literature
Albino, V., Balice, A. & Dangelico, R.S. 2009. ‘Environmental Strategies and Green Product
Development: An Overview on Sustainability-Driven Companies’, Business Strategies
and the Environment, vol. 18, no. 2, pp. 83-96. Available from: Wiley Online Library
[29 January 2016]
Arena, M. & Azzone, G. 2012. ‘A process-based operational framework for sustainability
reporting in SMEs.’ Journal of Small business and Enterprise Development, vol. 19, no.
4, pp. 669-686. Available from: Emerald Insight < https://
doi.org/10.1108/14626001211277460 > [8 March 2017]
Bebbington, J. & Fraser, M. 2014. Organizational Change and Sustainability Accounting. In:
Bebbington, J., Unerman, J., & O’Dwyer, B. eds. Sustainability accounting and
accountability. [Ebook] 2nd edition. Abingdon: Routledge, pp. 141-154. Available from:
ProQuest Ebook Central. [18 May 2017]
Bebbington, J., Unerman, J., & O’Dwyer, B. 2014. Introduction to sustainability accounting
and accountability. In: Bebbington, J., Unerman, J., & O’Dwyer, B. eds. Sustainability
accounting and accountability. 2nd edition. Abingdon: Routledge, pp. 3-14. Available
from: ProQuest Ebook Central. [18 May 2017]
Bos-Brouwers, H.E.J. 2009 ‘Corporate Sustainability and Innovation in SMEs: Evidence of
Themes and Activities in Practice.’ Business Strategy and the Environment, vol. 19, no.
7, pp. 417-435. Available from: Wiley Online Library [20 April 2017]
Buhr, N. & Gray, R., 2012. Environmental Management, Measurement, and Accounting:
Information for Decision and Control? In: Bansal, P. & Hoffman, J.A., eds. The Oxford
Handbook of Business and the Natural Environment. Oxford: Oxford University Press,
pp.
425-440.
Buhr, N., Gray, R., & Milne, M.J. 2014. Histories, Rationales, Voluntary Standards and
Future Prospects. In: Bebbington, J., Unerman, J., & O’Dwyer, B. eds. Sustainability
accounting and accountability. [Ebook] 2nd edition. Abingdon: Routledge, pp. 51-71.
Available from: ProQuest Ebook Central. [18 May 2017]
Clarkson, P. M. 2012. The Valuation Relevance of Environmental Performance: Evidence
from the Academic Literature. In: Jones, S. & Ratnatunga, J. eds. Contemporary issues
in Sustainability accounting, assurance and reporting. Bingley: Emerald Publishing
Limited, pp. 11-42. Available from: ProQuest Ebook Central. [18 May 2017]
Cooper, S. & Owen, D. 2014. Independent Assurance of Sustainability Reports. In: Bebbington,
J., Unerman, J., & O’Dwyer, B. eds. Sustainability accounting and accountability.
[Ebook] 2nd edition. Abingdon: Routledge, pp. 72-85. Available from: ProQuest Ebook
Central. [18 May 2017]

64
Coulson, A.B., & O’Sullivan, N. 2014. Environmental and Social Assessment in Finance. In:
Bebbington, J., Unerman, J., & O’Dwyer, B. eds. Sustainability accounting and
accountability. [Ebook] 2nd edition. Abingdon: Routledge, pp. 124-140. Available from:
ProQuest Ebook Central. [18 May 2017]
Dey, C. & Gibbon, J. 2014. External Accounts. In: Bebbington, J., Unerman, J., & O’Dwyer,
B. eds. Sustainability accounting and accountability. [Ebook] 2nd edition. Abingdon:
Routledge, pp. 108-123. Available from: ProQuest Ebook Central. [18 May 2017]
Džupina, M. & Mišún, J. 2014. ‘A Comparative Study of Principles of Corporate Social
Responsibility in Small and Medium-Sized Enterprises and Multinational Enterprises.’
Economic Review, vol. 43, no. 3, pp. 284-294. Available from:
<https://old.euba.sk/veda-a-vyskum/utvary-riadene-prorektorkou-pre-vedu-a-
doktorandske-studium/ekonomicke-rozhlady/aktualne-vydanie/preview-
file/er3_2014_dzupina_misun_fulltext-17713.pdf.> [20 April 2017]
Guthrie, J. & Abeysekera, I. 2006. ‘Content analysis of social, environmental reporting: what
is new? ͛’ Journal of Human Resource Costing and Accounting, vol. 10, no. 2, pp. 114-
126. Available from: Emerald Insight < https:// doi.org/10.1108/14013380610703120 >
[29 January 2016]
Gurthie, J. & Farneti, F., 2008. ‘GRI Sustainability Reporting by Australian Public Sector
Organizations’ Public Money & Management, vol. 28, no. 6, pp. 361-366. Available
from: Routledge <https://doi.org/10.1111/j.1467-9302.2008.00670.x> [29 January
2016]
Hörisch, J., Johnson, M.P., & Schaltegger, S. 2014. ‘Implementation of Sustainability
Management and Company Size: A Knowledge-Based View.’ Business Strategy and
the Environment, vol. 24, no. 8, pp. 765-779. Available from: Wiley Online Library [20
April 2017]
Jansson, J., Nilsson, J., Modig, F., and Vall, G.H. 2015. ‘Commitment to Sustainability in Small
and Medium-Sized Enterprises: The Influence of Strategic Orientations and
Management Values.’ Business Strategy and the Environment, vol. 26, no. 1, pp. 69-83.
Available from: Wiley Online Library [8 March 2017]
Jones, S. 2012. Sustainability Reporting and Assurance: State of Practice. In: Jones, S. &
Ratnatunga, J. eds. Contemporary issues in Sustainability accounting, assurance and
reporting. Bingley: Emerald Publishing Limited, pp. 1-10. Available from: ProQuest
Ebook Central. [18 May 2017]
Jose, A. & Lee, S.M. 2007. ‘Environmental Reporting of Global Corporations: A Content
Analysis based on Website Disclosures’. Journal of Business Ethics, vol. 72, no. 4, pp.
307-321. Available from: ProQuest [29 January 2016]
Kalev, P. S. & Wallace, D. 2012. Performance of Socially Responsible Investment Funds. In:
Jones, S. & Ratnatunga, J. eds. Contemporary issues in Sustainability accounting,
assurance and reporting. Bingley: Emerald Publishing Limited, pp. 43-70. Available
from: ProQuest Ebook Central. [18 May 2017]

65
Lodhia S. K. 2012. The Need for Effective Corporate Social Responsibility/Sustainability
Regulation. In: Jones, S. & Ratnatunga, J. eds. Contemporary issues in Sustainability
accounting, assurance and reporting. Bingley: Emerald Publishing Limited, pp. 139-
152. Available from: ProQuest Ebook Central. [21 September 2017]
Ratnatunga, J. & Jones, S. 2012a. A Methodology to Rank the Quality and Comprehensiveness
of Sustainability Information Provided in Publicly Listed Company Reports. In: Jones,
S. & Ratnatunga, J. eds. Contemporary issues in Sustainability accounting, assurance
and reporting. Bingley: Emerald Publishing Limited, pp. 227-266. Available from:
ProQuest Ebook Central. [18 May 2017]
Ratnatunga, J. & Jones, S. 2012b. An Inconvenient Truth about Accounting: The Paradigm
Shift Required in Carbon Emissions Reporting and Assurance. In: Jones, S. &
Ratnatunga, J. eds. Contemporary issues in Sustainability accounting, assurance and
reporting. Bingley: Emerald Publishing Limited, pp. 71-114. Available from: ProQuest
Ebook Central. [18 May 2017]
Ratnatunga, J., Wahyuni, D. & Jones, S. 2012. The Carbon Economy and Emissions Reporting.
In: Jones, S. & Ratnatunga, J. eds. Contemporary issues in Sustainability accounting,
assurance and reporting. Bingley: Emerald Publishing Limited, pp. 153-182. Available
from: ProQuest Ebook Central. [18 May 2017]
Revell A., Stokes D. & Chen H. 2009. ‘Small Businesses and the Environment: Turning Over
a New Leaf?’ Business Strategy and the Environment, vol. 19, no. 5, pp. 273-288.
Available from: Wiley InterScience [20 April 2017]
Rinaldi, L., Unerman, J. & Tilt, C. 2014. The Role of Stakeholder Engagement and Dialogue
within the sustainability accounting and reporting process. In: Bebbington, J., Unerman,
J., & O’Dwyer, B. eds. Sustainability accounting and accountability. [Ebook] 2nd
edition. Abingdon: Routledge, pp. 86-107. Available from: ProQuest Ebook Central.
[18 May 2017]
Schaltegger, S. 2012. Sustainability Reporting Beyond Rhetoric: Linking Strategy, Accounting
and Communication. In: Jones, S. & Ratnatunga, J. eds. Contemporary issues in
Sustainability accounting, assurance and reporting. Bingley: Emerald Publishing
Limited, pp. 183-196. Available from: ProQuest Ebook Central. [18 May 2017]
Singh, R.K., Murty, H.R., Gupta, S.K. & Dikshit, A.K. 2009. ‘An overview of sustainability
assessment methodologies.’ Ecological Indicators, vol. 9, no. 2, pp. 189-212. Science
Direct, Elsevier < https://doi.org/10.1016/j.ecolind.2008.05.011 > [20 January 2018]
Tilt, C.A. 2001. ‘The content and disclosure of Australian corporate environmental policies.’
Accounting, Auditing & Accountability Journal, vol. 14, no. 2, pp. 190-212. Available
from: Emerald Insight < https:// doi.org/10.1108/09513570110389314 > [29 January
2016]
Tregidga, H. & Milne, M.J. 2006. ‘From Sustainable Management to Sustainable Development:
a Longitudinal Analysis of a Leading New Zealand Environmental Reporter’, Business
Strategy and the Environment, vol. 15, no. 4, pp. 219-241. Available from: Wiley Online
Library [29 January 2016]

66
Williams, S. & Schaefer, A. 2012. ‘Small and Medium-Sized Enterprises and Sustainability:
Managers’ Values and Engagement with Environmental and Climate Change Issues.’
Business Strategy and the Environment, vol. 22, no. 3, pp. 173-186. Available from
Wiley Online Library [20 April 2017]
WWW -pages
Bartels, W., Fogelberg, T., Hoballah, A., & van der Lugt, C.T. 2016. Carrots & Sticks –
Global trends in sustainability reporting, regulation and policy. [online] Available at:
<https://www.carrotsandsticks.net> [12 September 2017]
Bartels, W., Fogelberg, T., Lemmet, S., Malan, D. & van der Lugt, C.T. 2013. Carrots &
Sticks: Sustainability reporting policies worldwide – today’s best practice, tomorrow’s
trends. [online] Available at: < https://www.carrotsandsticks.net/wp-
content/uploads/2016/03/Carrots-Sticks-2013.pdf> [Accessed 12 September]
European Commission 2017. What is an SME? [online] Available at: <
http://ec.europa.eu/growth/smes/business-friendly-environment/sme-definition_en>
[20 September 2017]
GRI 2017. Sustainability Disclosure Database: Data Legend. [online] Available at:<
https://www.globalreporting.org/SiteCollectionDocuments/GRI-Data-Legend-
Sustainability-Disclosure-Database-Profiling.pdf > [27 September 2017]
GRI 2015. G4 Sustainability Reporting Guidelines: Reporting Principles and Standard
Disclosures. [online] Available at: <
https://www.globalreporting.org/resourcelibrary/GRIG4-Part1-Reporting-Principles-
and-Standard-Disclosures.pdf> [27 September 2017]
GRI (n.d.) a About GRI. GRI. [online] Available at: <
https://www.globalreporting.org/information/about-gri/Pages/default.aspx> [19
September 2017]
GRI (n.d.) b About Sustainable Reporting. GRI. [online] Available at: <
https://www.globalreporting.org/information/sustainability-
reporting/Pages/default.aspx> [19 September 2017]
GRI (n.d.) c Benefits of reporting. [online] Available at:
<https://www.globalreporting.org/information/sustainability-
reporting/Pages/reporting-benefits.aspx> [19 September 2017]
GRI (n.d.) d Sustainability Disclosure Database. [online] Available at:<
https://www.globalreporting.org/services/Communication/Sustainability_Disclosure_
Database/Pages/default.aspx> [19 September 2017]
IISD n.d. Sustainable Development. International Institute for Sustainable Development
[online] Available at: < http://www.iisd.org/topic/sustainable-development> [19
September 2017]

67
Investopedia n.d. Gross Domestic Product – GDP. [online] Available at: < https://www.investopedia.com/terms/g/gdp.asp> [27 May 2018]
King, A. and Blasco, J.L. 2017. The road ahead: The KPMG Survey of Corporate
Responsibility Reporting 2017. KPMG [online] Available at: <
https://home.kpmg.com/xx/en/home/insights/2017/10/the-kpmg-survey-of-corporate-
responsibility-reporting-2017.html> [5 May 2018]
King, A. & Bartels, W. 2015. Currents of Change: The KPMG Survey of Corporate
Responsibility Reporting 2015. KPMG [online] Available at: <
https://home.kpmg.com/xx/en/home/insights/2015/11/kpmg-international-survey-of-
corporate-responsibility-reporting-2015.html> [5 May 2018]
Muller, P., Devnani, S., Julius, J., Gagliardi, D., and Marzocchi, C., 2016. Annual Report on
European SMEs 2015/2016: SME Recovery continues. European Commission [online]
Available at: < https://ec.europa.eu/jrc/sites/jrcsh/files/annual_report_-
_eu_smes_2015-16.pdf> [20 September 2017]
Plugge, L. &Wiemer, J. 2008. Small, Smart and Sustainable: Experiences of SME Reporting in
Global Supply Chains. [online] Global Reporting Initiative Available at: <
https://www.globalreporting.org/resourcelibrary/Small-Smart-Sustainable.pdf> [3
October 2017]
Rodriguez, E.T. 2014. Ready to Report: Introducing Sustainability Reporting for SMEs. GRI
[online] Available at: < https://www.globalreporting.org/resourcelibrary/Ready-to-
Report-SME-booklet-online.pdf> [24 September 2017]
Sew, R. 2017. Sustainability. We know it matters, but how do we measure it? [online] World
Economic Forum. Available at: https://www.weforum.org/agenda/2017/09/struggling-
to-measure-sustainability/ [Accessed 26 February 2018]
Sustainable Measures 2010. Sustainability Indicators [online] Available at:
<http://www.sustainablemeasures.com/node/89> [5 May 2018]
United Nations 2007. Indicators of Sustainable Development: Guidelines and Methodologies.
3rd Edition United Nations Publication [online] Available at:
<http://www.un.org/esa/sustdev/natlinfo/indicators/guidelines.pdf> [5 May 2018]

68
APPENDICES
Appendix 1: General Data & Total Indicators Reported Data Collected
Sector Country Report
year
Adherence
Level
Number of
Employees
Indicators reported
Total Economic Environmental Social
Agriculture 5 out of 12 organizations Canada 2017 Core 1730 11 1 5 5
Singapore 2017 Core 13884 14 2 2 10
Peru 2017 Undeclared 68 26 3 4 19
Indonesia 2015 Core 13 12 6 3 3
India 2015 Core 473 6 0 2 4
Automotive 7 out of 8 organizations India 2015 Core 223 13 0 3 10
India 2015 Core 231 12 0 4 8
India 2015 Core 48 6 1 2 3
India 2015 Core 201 5 0 2 3
India 2015 Core 26 7 0 2 5
India 2017 Core 420 8 0 4 4
India 2015 Core 1002 11 0 4 7
Aviation 2 out of 5 organizations Australia 2016 Core 372 18 2 8 8
Germany 2016 Core 176 53 5 19 29
Chemicals 5 out of 8 organizations Sweden 2016 Core 1760 20 2 10 8
U.S.A. 2016 Core 164 23 0 10 13
Belgium 2017 Core 141 17 0 8 9
India 2015 Core 97 8 0 5 3
Canada 2017 Core 265 22 0 7 15
Computers 1 out of 1 organizations India 2015 Undeclared 97 68 9 20 39
Consumer Durables 1 out of 3 organizations India 2017 Core 4253 40 4 16 20
Equipment 3 out of 15 organizations Turkey 2016 Core 713 23 2 10 11

69
India 2015 Core 511 6 0 2 4
Turkey 2016 Core 295 13 1 5 7
Food and Beverage Products 7 out of 27 organizations UAE 2015 Core 298 12 0 1 11
U.S.A. 2015 Core 550 14 0 9 5
Peru 2016 Core 200 29 4 5 20
Australia 2016 Core 1644 27 0 15 12
Sweden 2017 Core 403 10 3 4 3
Belgium 2015 Core 106 13 0 4 9
Denmark 2017 Comprehensive 423 74 2 26 46
Forest and Paper Products 3 out of 7 organizations Norway 2017 Core 2042 33 0 14 19
U.S.A. 2016 Undeclared 8000 23 4 10 9
Australia 2015 Core 107 16 3 7 6
Healthcare Products 2 out of 6 organizations India 2017 Core 400 18 3 4 11
Switzerland 2016 Core 126 27 4 15 8
Household and Personal Products 2 out of 5 organizations U.S.A. 2016 Undeclared 153 10 0 7 3
Taiwan 2015 Comprehensive 90 26 5 10 11
Metal Products 5 out of 7 organizations India 2015 Core 98 29 4 13 12
Zimbabwe 2017 Core 183 19 1 13 5
India 2016 Core 394 8 2 4 2
India 2015 Core 292 28 4 13 11
Switzerland 2017 Core 183 33 5 13 15
Mining 3 out of 3 organizations Canada 2016 Core 15 43 5 22 16
U.S.A. 2016 Core 1984 45 4 19 22
Canada 2017 Core 1318 38 2 14 22
Retailers 1 out of 6 organizations New Zealand 2016 Core 1895 26 1 7 18
Technology Hardware 1 out of 3 organizations Taiwan 2017 Core 5009 38 2 20 16
Textiles and Apparel 4 out of 12 organizations Indonesia 2015 Core 1 8 3 3 2
Italy 2017 Core 255 19 1 8 10
South Africa 2016 Undeclared 418 48 4 15 29
Norway 2017 Core 2410 24 1 7 16

70
Appendix 2: Frequency of Indicators Disclosed
Economic Indicators Indicator EC1 EC2 EC3 EC4 EC5 EC6 EC7 EC8 EC9
Frequency disclosed
30 11 11 10 7 5 7 8 16
Environmental Indicators
Indicator EN1 EN2 EN3 EN4 EN5 EN6 EN7 EN8 EN9 EN10 EN11 EN12 EN13 EN14 EN15 EN16 EN17
Frequency disclosed
17 7 39 5 18 23 7 27 10 10 10 6 7 5 30 23 12
Indicator EN18 EN19 EN20 EN21 EN22 EN23 EN24 EN25 EN26 EN27 EN28 EN29 EN30 EN31 EN32 EN33 EN34
Frequency disclosed
13 16 4 11 18 33 12 1 3 9 5 24 14 12 15 6 7
Social Indicators
Indicator LA1 LA2 LA3 LA4 LA5 LA6 LA7 LA8 LA9 LA10 LA11 LA12 LA13 LA14 LA15 LA16
Frequency disclosed
28 19 13 9 23 39 12 9 32 12 14 20 12 11 6 14
Indicator HR1 HR2 HR3 HR4 HR5 HR6 HR7 HR8 HR9 HR10 HR11 HR12
Frequency disclosed
3 9 14 9 21 15 7 7 3 12 6 10
Indicator SO1 SO2 SO3 SO4 SO5 SO6 SO7 SO8 SO9 SO10 SO11
Frequency disclosed
20 6 10 15 12 4 7 18 8 5 4
Indicator PR1 PR2 PR3 PR4 PR5 PR6 PR7 PR8 PR9
Frequency disclosed
14 13 18 11 27 4 9 8 14