Sustainability Education and Environmental Worldviews ...
19
sustainability Article Sustainability Education and Environmental Worldviews: Shifting a Paradigm Simon Ling 1, *, Adam Landon 2 , Michael Tarrant 1 and Donald Rubin 3 1 Warnell School of Forestry and Natural Resources, University of Georgia, Athens, GA 30602, USA; [email protected] 2 Department of Fisheries, Wildlife, and Conservation Biology, University of Minnesota, Minneapolis, MN 55455, USA; [email protected] 3 Franklin College of Arts and Sciences, University of Georgia, Athens, GA 30602, USA; [email protected] * Correspondence: [email protected] Received: 9 September 2020; Accepted: 2 October 2020; Published: 7 October 2020 Abstract: Higher education institutions are tasked with education for sustainable development, of which the environment is a central pillar. Understanding the demographic factors that influence the establishment of environmental worldviews allows educators to better contextualize sustainability content and discussion. Identifying pedagogies capable of creating learning spaces within which worldviews can shift offers similar opportunities. Using a quasi-experimental design and model building, this study identifies important social psychological antecedents of environmental beliefs, assesses the effectiveness of outbound mobility pedagogy at changing those beliefs and identifies important predictors of the nature and magnitude of those changes. Sustainable outbound mobility courses were effective at increasing environmental worldview compared to a control group. At program commencement, political orientation and business majors were negatively associated with environmental worldview, while female gender was the reverse. For sustainability education courses, only gender was retained as a significant predictor of the nature and change of environmental worldview by the course’s end. These results suggest that the factors associated with environmental worldview upon commencement of a course do not necessarily predict the malleability of that worldview in higher education students. Keywords: sustainability education; environmental worldview; new ecological paradigm; outbound mobility; quasi-experimental 1. Introduction Universities in the U.S. recognize the benefits of study abroad and its potential for experiential learning and for nurturing undergraduates with global experience and perspectives. Over 341,000 U.S. students studied abroad for academic credit over the course of the 2018/2019 academic year [1]. Study abroad has been put forward as a potentially transformative experience for participants [2–4] with the ability to alter participants’ beliefs, attitudes and behaviors regarding sustainability and the triple bottom line of society, economics and the environment [5]. As one of the pillars of modern sustainability concepts, the environment is an integral component of sustainability education content. Therefore, the factors that influence the environmental worldview of students are of interest in the design of sustainability communication and education approaches. Knowledge thereof gives educators the ability to focus on content relevant to students. Knowledge of the socio-demographic factors influencing change in student environmental worldviews in response to programs designed to do so should also inform more effective curriculum design. Sustainability 2020, 12, 8258; doi:10.3390/su12198258 www.mdpi.com/journal/sustainability
Transcript of Sustainability Education and Environmental Worldviews ...

sustainability
Article
Sustainability Education and EnvironmentalWorldviews: Shifting a Paradigm
Simon Ling 1,*, Adam Landon 2, Michael Tarrant 1 and Donald Rubin 3
1 Warnell School of Forestry and Natural Resources, University of Georgia, Athens, GA 30602, USA;[email protected]
2 Department of Fisheries, Wildlife, and Conservation Biology, University of Minnesota,Minneapolis, MN 55455, USA; [email protected]
3 Franklin College of Arts and Sciences, University of Georgia, Athens, GA 30602, USA; [email protected]* Correspondence: [email protected]
Received: 9 September 2020; Accepted: 2 October 2020; Published: 7 October 2020�����������������
Abstract: Higher education institutions are tasked with education for sustainable development, ofwhich the environment is a central pillar. Understanding the demographic factors that influence theestablishment of environmental worldviews allows educators to better contextualize sustainabilitycontent and discussion. Identifying pedagogies capable of creating learning spaces within whichworldviews can shift offers similar opportunities. Using a quasi-experimental design and modelbuilding, this study identifies important social psychological antecedents of environmental beliefs,assesses the effectiveness of outbound mobility pedagogy at changing those beliefs and identifiesimportant predictors of the nature and magnitude of those changes. Sustainable outbound mobilitycourses were effective at increasing environmental worldview compared to a control group. At programcommencement, political orientation and business majors were negatively associated with environmentalworldview, while female gender was the reverse. For sustainability education courses, only genderwas retained as a significant predictor of the nature and change of environmental worldview by thecourse’s end. These results suggest that the factors associated with environmental worldview uponcommencement of a course do not necessarily predict the malleability of that worldview in highereducation students.
Keywords: sustainability education; environmental worldview; new ecological paradigm; outboundmobility; quasi-experimental
1. Introduction
Universities in the U.S. recognize the benefits of study abroad and its potential forexperiential learning and for nurturing undergraduates with global experience and perspectives.Over 341,000 U.S. students studied abroad for academic credit over the course of the 2018/2019academic year [1]. Study abroad has been put forward as a potentially transformative experiencefor participants [2–4] with the ability to alter participants’ beliefs, attitudes and behaviors regardingsustainability and the triple bottom line of society, economics and the environment [5].
As one of the pillars of modern sustainability concepts, the environment is an integralcomponent of sustainability education content. Therefore, the factors that influence the environmentalworldview of students are of interest in the design of sustainability communication and educationapproaches. Knowledge thereof gives educators the ability to focus on content relevant to students.Knowledge of the socio-demographic factors influencing change in student environmental worldviewsin response to programs designed to do so should also inform more effective curriculum design.
Sustainability 2020, 12, 8258; doi:10.3390/su12198258 www.mdpi.com/journal/sustainability

Sustainability 2020, 12, 8258 2 of 19
Thus, the identification of effective teaching practices and/or learning experiences has the potential toincrease the effectiveness of sustainability education efforts within higher education institutions.
The New Ecological Paradigm has emerged as one of the leading measures used to tap intoenvironmental beliefs since its introduction in 1978 (as the New Environmental Paradigm) andsubsequent revision in 2000 [6]. It has become an important component of testing approachesinvestigating how pro-environmental attitudes evolve and how they are related to behavior throughvalue-belief norm theory and the theory of planned behavior [7,8].
Using the New Ecological Paradigm as a measure of environmental worldview, this study firstexamines the demographic traits that influence students’ positions on its spectrum at the commencementof a higher education course. Second, changes in environmental worldview on sustainable educationaltravel of students versus a control group is tested. Finally, socio-demographic traits related to themagnitude and/or direction of change in student environmental worldviews are identified. The resultsof this work identify factors influential in the formation and evolution of students’ environmentalvalues with the aim of improving the design of pedagogical approaches aiming to foster criticalexamination and self-reflection of environmental worldviews.
1.1. New Ecological Paradigm
The New Ecological Paradigm [9] evolved from its predecessor the New EnvironmentalParadigm [10] and has arguably become the most widely applied and evaluated measure usedto assess and track changes in environmental worldview since its implementation [6,11]. Grounded inRokeach’s theory of values [12], the New Ecological Paradigm was assessed for internal consistency,dimensionality and validity on its inception [9] and has been constantly tested, and tinkered with,around the world. In 2018, Google Scholar listed 4384 citations since its publication [13].
The NEP (New Ecological Paradigm) measures the degree to which individuals express adherenceto eco-centric worldviews, at one end of the spectrum, and anthropocentric worldviews at the other.Dunlap et al. [9] conceptualize the NEP as examining five “facets”:
1. Reality of limits to growth.2. Anti-anthropocentrism.3. Fragility of nature.4. Rejection of exemptionalism.5. Possibility of eco-crises or ecological catastrophe.
Respondents with higher NEP scores identify more closely with concepts that see humans as partof natural systems. Respondents with lower scores identify more closely with concepts that placehumans apart from, or above, natural systems [10].
1.2. Criticisms of the NEP
Critiques of the NEP can be broadly grouped into three categories [11,14]. First, that the NEP lacksimportant theoretical elements of a pro-ecological worldview [15,16]. Lundmark [16] points out that inrelation to the “limits to growth” facet, the NEP fails to incorporate the social and economic aspects ofthe contemporary sustainability debate. Furthermore, Lundmark [16] points out that it is humanity’sexceptional abilities that allow us to perceive the dominant social paradigm as unsustainable, suggestingthat the simple antagonistic relationship between anthropocentrism and ecocentrism posited by theNEP may not be sufficient.
The second major criticism of the NEP is that it does not relate strongly to pro-environmentalbehavior [6]. Given that the measure was never intended to measure behaviors, this criticism hasgained little traction within the literature. The NEP may detect changes in the attitudes and motivesunderlying pro-environmental behavior, but not necessarily the ability to act upon them [6,8]. Using ameasure for a purpose for which it was never designed renders it invalid before the first respondentputs pen to paper [17].

Sustainability 2020, 12, 8258 3 of 19
A third major criticism of the measure, and the issue that has been raised most often, is that theNEP is not consistently unidimensional. Researchers have found anywhere from one to five factorsunderlying the NEP, which calls into question Dunlap et al.’s assertion of unidimensionality [14,18,19].
However, the analytic approaches used to criticize the NEP’s dimensionality are fundamentallysample dependent, residing within the realm of the scoring tradition of psychometric measurementtheory [20]. Thus, inconsistency in dimensionality should be expected, at least to some degree, when themeasure is deployed in a novel population. Dunlap himself recognizes this and has consistentlyrecommended the NEP’s dimensionality be investigated by factor analysis with each deployment tocontextualize findings and facilitate comparison [6].
Hawcroft and Milfont’s [14] comprehensive review and meta-analysis makes some valid criticismabout the inconsistency with which the NEP has been deployed and reported, noting drawbacksin edited versions of the NEP in which substantial numbers of items have sometimes been omitted.Furthermore, they draw attention to the inconsistency in reporting basic statistical and demographicinformation for the NEP and the sample within which it is being deployed. Perhaps most importantly,Hawcroft and Milfont report numerous studies that fail to either investigate or report the internalconsistency of the NEP scale within their sample.
1.3. Demographic Antecedents to the NEP
Demographic factors are known to influence environmental attitudes and beliefs. Early workin this area found age or birth cohort to be a strong, consistent predictor of environmentalism [21,22].More specifically, several demographic variables are known to be associated with the NEP.Dunlap et al. [9] found political liberalism to be strongly correlated with higher NEP (r = 0.32,p < 0.05), with other variables significant at the same level including age (r = −0.11), education (r = 0.10),political party (r = 0.22; Democrats scoring higher) and occupational sector (r = 0.13; primary industryworkers score lower).
Using the 2000 National Survey on Recreation and the Environment, Johnson, et al. [23] foundsignificant relationships to NEP scores at α = 0.05 for ethnicity (variable, depending on ethnicity),gender (higher in females), age (negative relationship), family size (negative relationship) and politicalorientation (higher in liberals). Casey and Scott [24] also found gender, level of education and ageinfluential on NEP scores in an Australian study drawing samples from 126 urban and rural locationsusing the same level of significance. More recently, Rexeisen [25] and Rexeisen and Al-Khatib [26]report gender as a significant moderator of change in NEP scores over time.
Dunlap and colleagues make no mention of gender in the NEP founding paper [9].However, gender has been long known as influential on environmental concern and attitudes withinthe broader literature and the literature specific to the NEP, although its influence is reported by someas weaker and less consistent than that of age or birth cohort [27–29].
1.4. The NEP in a Social Psychological Context
Conceptually, the NEP has been examined within the framework of the value-belief-normtheory of pro-environmental behavior (VBN), which in turn is based on the norm-activation model(NAM) of Schwartz [30], as well as in explorations of the theory of planned behavior (TPB) [31,32].Stern et al. [29,33] see the NEP as measuring grass-roots environmental beliefs, which are lessintransigent than norms, but more intransigent than values. In turn, values are underpinnedby an individual’s position in their social structure, their institutional constraints and their incentivestructure. In this scheme, an individual’s social setting frames their values, which then frame generalbeliefs and worldview, such as the NEP.
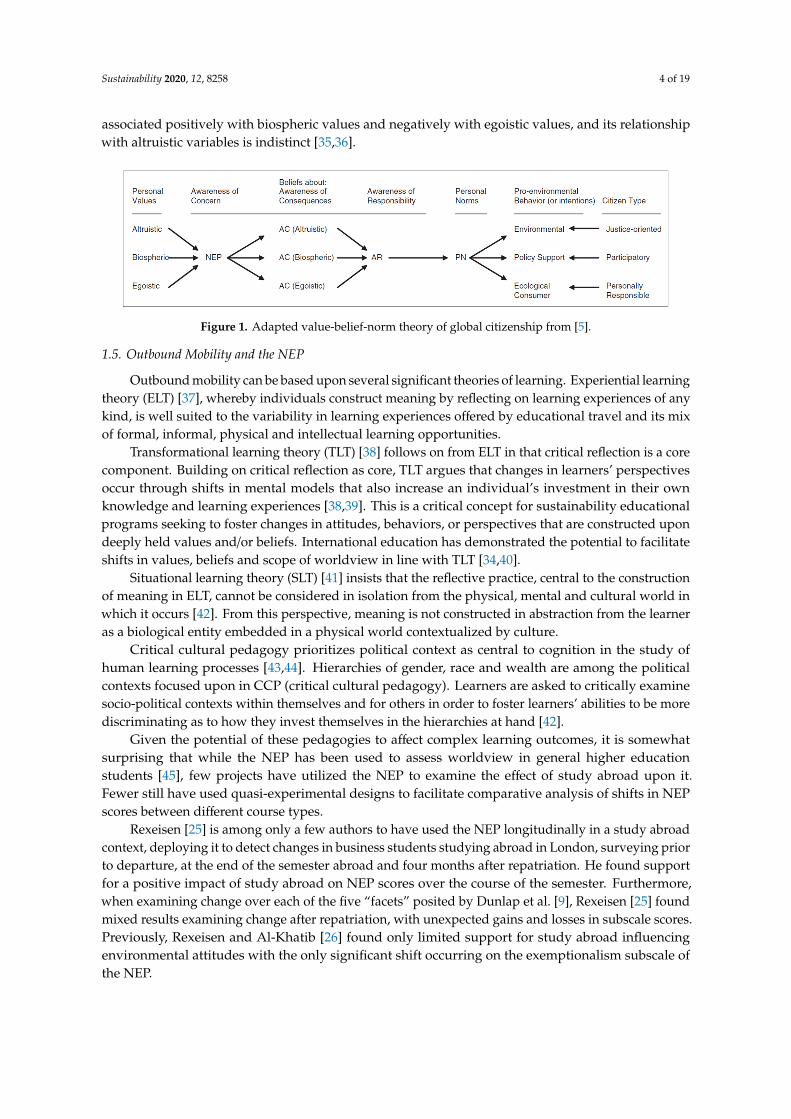
The NEP is conceptualized as dependent on the balance of personal values spread between threethemes (altruistic, biospheric and egoistic) and has been utilized to model multiple outcomes, such aspro-environmental behavior/intention (Figure 1) [5,8] and citizenship types [34]. Generally, the NEP is
Sustainability 2020, 12, 8258 4 of 19
associated positively with biospheric values and negatively with egoistic values, and its relationshipwith altruistic variables is indistinct [35,36].Sustainability 2020, 12, x FOR PEER REVIEW 4 of 20
Figure 1. Adapted value-belief-norm theory of global citizenship [from 5].
1.5. Outbound Mobility and the NEP
Outbound mobility can be based upon several significant theories of learning. Experiential learning theory (ELT) [37], whereby individuals construct meaning by reflecting on learning experiences of any kind, is well suited to the variability in learning experiences offered by educational travel and its mix of formal, informal, physical and intellectual learning opportunities.
Transformational learning theory (TLT) [38] follows on from ELT in that critical reflection is a core component. Building on critical reflection as core, TLT argues that changes in learners’ perspectives occur through shifts in mental models that also increase an individual’s investment in their own knowledge and learning experiences [38,39]. This is a critical concept for sustainability educational programs seeking to foster changes in attitudes, behaviors, or perspectives that are constructed upon deeply held values and/or beliefs. International education has demonstrated the potential to facilitate shifts in values, beliefs and scope of worldview in line with TLT [34,40].
Situational learning theory (SLT) [41] insists that the reflective practice, central to the construction of meaning in ELT, cannot be considered in isolation from the physical, mental and cultural world in which it occurs [42]. From this perspective, meaning is not constructed in abstraction from the learner as a biological entity embedded in a physical world contextualized by culture.
Critical cultural pedagogy prioritizes political context as central to cognition in the study of human learning processes [43,44]. Hierarchies of gender, race and wealth are among the political contexts focused upon in CCP (critical cultural pedagogy). Learners are asked to critically examine socio-political contexts within themselves and for others in order to foster learners’ abilities to be more discriminating as to how they invest themselves in the hierarchies at hand [42].
Given the potential of these pedagogies to affect complex learning outcomes, it is somewhat surprising that while the NEP has been used to assess worldview in general higher education students [45], few projects have utilized the NEP to examine the effect of study abroad upon it. Fewer still have used quasi-experimental designs to facilitate comparative analysis of shifts in NEP scores between different course types.
Rexeisen [25] is among only a few authors to have used the NEP longitudinally in a study abroad context, deploying it to detect changes in business students studying abroad in London, surveying prior to departure, at the end of the semester abroad and four months after repatriation. He found support for a positive impact of study abroad on NEP scores over the course of the semester. Furthermore, when examining change over each of the five “facets” posited by Dunlap et al. [9], Rexeisen [25] found mixed results examining change after repatriation, with unexpected gains and losses in subscale scores. Previously, Rexeisen and Al-Khatib [26] found only limited support for study abroad influencing environmental attitudes with the only significant shift occurring on the exemptionalism subscale of the NEP.
2. Purpose and Hypotheses
This study first seeks to identify the demographic antecedents to environmental worldview in higher education students. Second, it investigates the effects of different higher education pedagogies on environmental worldview across academic programs of between a few weeks and a semester in
Figure 1. Adapted value-belief-norm theory of global citizenship from [5].
1.5. Outbound Mobility and the NEP
Outbound mobility can be based upon several significant theories of learning. Experiential learningtheory (ELT) [37], whereby individuals construct meaning by reflecting on learning experiences of anykind, is well suited to the variability in learning experiences offered by educational travel and its mixof formal, informal, physical and intellectual learning opportunities.
Transformational learning theory (TLT) [38] follows on from ELT in that critical reflection is a corecomponent. Building on critical reflection as core, TLT argues that changes in learners’ perspectivesoccur through shifts in mental models that also increase an individual’s investment in their ownknowledge and learning experiences [38,39]. This is a critical concept for sustainability educationalprograms seeking to foster changes in attitudes, behaviors, or perspectives that are constructed upondeeply held values and/or beliefs. International education has demonstrated the potential to facilitateshifts in values, beliefs and scope of worldview in line with TLT [34,40].
Situational learning theory (SLT) [41] insists that the reflective practice, central to the constructionof meaning in ELT, cannot be considered in isolation from the physical, mental and cultural world inwhich it occurs [42]. From this perspective, meaning is not constructed in abstraction from the learneras a biological entity embedded in a physical world contextualized by culture.
Critical cultural pedagogy prioritizes political context as central to cognition in the study ofhuman learning processes [43,44]. Hierarchies of gender, race and wealth are among the politicalcontexts focused upon in CCP (critical cultural pedagogy). Learners are asked to critically examinesocio-political contexts within themselves and for others in order to foster learners’ abilities to be morediscriminating as to how they invest themselves in the hierarchies at hand [42].
Given the potential of these pedagogies to affect complex learning outcomes, it is somewhatsurprising that while the NEP has been used to assess worldview in general higher educationstudents [45], few projects have utilized the NEP to examine the effect of study abroad upon it.Fewer still have used quasi-experimental designs to facilitate comparative analysis of shifts in NEPscores between different course types.
Rexeisen [25] is among only a few authors to have used the NEP longitudinally in a study abroadcontext, deploying it to detect changes in business students studying abroad in London, surveying priorto departure, at the end of the semester abroad and four months after repatriation. He found supportfor a positive impact of study abroad on NEP scores over the course of the semester. Furthermore,when examining change over each of the five “facets” posited by Dunlap et al. [9], Rexeisen [25] foundmixed results examining change after repatriation, with unexpected gains and losses in subscale scores.Previously, Rexeisen and Al-Khatib [26] found only limited support for study abroad influencingenvironmental attitudes with the only significant shift occurring on the exemptionalism subscale ofthe NEP.

Sustainability 2020, 12, 8258 5 of 19
2. Purpose and Hypotheses
This study first seeks to identify the demographic antecedents to environmental worldview inhigher education students. Second, it investigates the effects of different higher education pedagogieson environmental worldview across academic programs of between a few weeks and a semester induration. Third, it examines what factors are significant predictors of the nature of any detected changein environmental worldview in the second step. Overall, the study intends to increase educators’understanding of the socio-political contexts within which environmental worldviews are generated,that they may better contextualize sustainability content and discussion and further understand theeducational contexts within which environmental worldview may be moderated. We hypothesize that:
Hypotheses 1 (H1). Demographic factors are related to the magnitude of student’s NEP scores at pretest in thefollowing manner.
Hypothesis 1a (H1a). Females are associated with higher NEP scores.
Hypothesis 1b (H1b). Liberal political beliefs are associated with higher NEP scores.
Hypothesis 1c (H1c). Business majors are associated with lower NEP scores.
Hypothesis 1d (H1d). Class standing is positively associated with higher NEP scores.
Hypothesis 1e (H1e). Number of sustainability-related courses is positively associated with higher NEP scores.
Hypothesis 2 (H2). Sustainability educational/outbound mobility programs are associated with greater gainsin NEP score pretest to posttest in comparison to other types of study abroad and home campus courses withinthe same time period, irrespective of course content.
Hypothesis 3 (H3). Demographic factors are related to the magnitude of change in student’s NEP scores frompretest to posttest in Sustainability Educational/outbound mobility programs.
3. Materials and Methods
3.1. Data Collection and Sample Demographics
The study was conducted at a large public university in the southeastern United States of America.Data were drawn from a metadataset (MDS) generated from matched surveys completed on the firstand last day of participating courses between 2008 and 2018. Surveyed students took courses onhome campus, on residential campus study abroad programs or on outbound mobility programs.Home campus was defined as the campus at which a student was registered. Residential campus studyabroad programs were defined as those where students were outside the U.S. and attending a foreignhigher education institution where courses were delivered in a traditional classroom setting. Outboundmobility programs were defined as those where students were outside the U.S. and undertaking highereducation classes delivered predominantly in the field rather than in classrooms. Not all measuresdeployed by the surveys were utilized every year.
For the purposes of this study, students were classified into two subcategories within the MDS;those that responded while undertaking outbound mobility programs were grouped into SustainableEducational Travel sensu stricto programs (SETss) and those that responded while participating inhome campus or residential campus study abroad programs were grouped into Other Programs (OP).Furthermore, when analyses were comparing SETss and OP subjects, data from years where measuresyielded data for both categories were employed (2013–2018). Demographic features for each sampleare presented in Table 1.

Sustainability 2020, 12, 8258 6 of 19
Table 1. Sample socio-demographic breakdown.
N %Female
%Freshman
%Sophomore
%Junior
%Senior
%Graduate
%Business
Major
%Politically
Right
MDS 3607 68.7 8.2 27.3 35.3 25.6 3.1 20.1 60.1SETss 2622 70.1 8.4 29.9 34.8 24.3 2.6 23.1 62.4
2013–18 SETss 1775 71.5 10.8 34.2 34.6 18.2 2.3 21.0 66.02013–18 OP 1027 64.9 7.6 20.3 37.8 29.9 4.5 11.6 54.1
Note: MDS = metadataset. SETss = Sustainable Educational Travel sensu stricto. OP = Other Programs. Percentagesexclude invalid responses.
3.2. Measures
The New Ecological Paradigm scale [9] was used to measure worldview. In line with Dunlap et al.’s [9]findings, the scale was treated as unidimensional providing Cronbach’s alpha was found to be sufficient.
Students were presented with 15 items, 8 worded positively and 7 negatively, representingbeliefs about the relationship between humans and their environment. Reverse coding was employedon negatively worded items prior to summation of the final NEP score. Higher scores reflect amore biocentric worldview (humans are a part of natural systems) and lower scores reflect a moreanthropocentric worldview (humans are above nature). A five-point Likert scale was employedto measure item responses where 1 = strongly disagree, 5 = strongly agree and 3 = neither agreenor disagree.
Known correlates of the NEP were utilized to check its concurrent validity. Three personal valuedimensions (Altruistic, Biospheric and Egoistic) [35] and the Environmental Citizenship scale [46] werecorrelated with the NEP scale.
Political orientation was assessed in two ways between 2008 and 2017; originally on a four-itemscale, with no neutral point, and later a 7-item scale that included a neutral point. For this study, theseresponses were recategorized as either left-wing or right-wing. Subjects who indicated no affiliationon the later 7-item scale were omitted from analyses. Dummy coding for political orientation was 0and 1 for left-wing and right-wing, respectively.
A gender variable was generated from a self-reported dichotomous item as male or female,dummy coded as 0 and 1, respectively. Major of study was reduced to a dichotomous variablerepresenting majors either outside or inside the school of business, dummy coded as 0 and 1,respectively. Class standing, i.e., first year, second year . . . graduate student, was coded 1 through 5.
To alleviate yearly cohort effects, raw NEP scores were converted to z-scores by year. This wasdone by year for SETss and OP collectively for years where data existed for both groups and across allyears for SETss subjects. The conversion was accomplished by calculating a subject’s distance from themean NEP score for the year in which they studied and converting it to units of standard deviations(for that year’s sample distribution). The directionality of distance from the mean was preserved.
NEP change scores were converted to z-scores within SETss subjects. Mean change in NEP andthe standard deviation for the sample distribution was calculated for each year. Each subject’s changescore was then converted into a distance from yearly mean change in NEP, retaining directionality,in units of yearly standard deviation.
The MDS was examined for outliers (greater than 4 standard deviations above or below the mean)and influential data with regards to paired NEP scores (n = 2502). Only one outlier, a respondent morethan 4 standard deviations below the mean NEP score at pretest and more than 6.5 standard deviationsabove the mean change in NEP score pretest to posttest, was removed from the sample, leaving asample of n = 2501.

Sustainability 2020, 12, 8258 7 of 19
3.3. Analysis
Analyses were conducted using the statistical software SPSS version 25.0 [47]. Prior to hypothesistesting, the reliability of the scale was assessed for the entire sample at pretest and posttest, as well asfor each of the subsamples (SETss and OP) at both points. Demographic variables known from theliterature to have some relationship to NEP scores (as above) were subjected to stepwise regression(α enter = 0.05, α remove = 0.10) to determine if any were significant contributors to variation in NEPz-scores at pretest. This was conducted for the entire metadataset and for the SETss subgroup.
Validation of Sustainable Educational Travel as an effective treatment for increasing NEP scoreswas conducted using a repeated measures ANOVA of Time (pretest and posttest) by Treatment (SET andOP) for years where NEP data for both SET and OP groups were present. For those years when NEPscores were obtained only for SETss students, differences in mean NEP score pretest to posttest acrossall SETss data were analyzed using a paired t-test.
Stepwise regression (α enter = 0.05, α remove = 0.10) of socio-demographic variables was used toidentify significant predictors of change scores in NEP pretest to posttest in SETss students, using thechange in NEP z-scores generated per the process outlined above.
4. Results
Summary statistics for the NEP at pretest and posttest are presented in Table 2. The increase invariation within the samples from pretest to posttest is of interest in contextualizing subsequent resultsand discussion thereof.
Table 2. Summary statistics for the New Ecological Paradigm.
n Minimum Maximum Mean Standard Deviation
MDS NEP Pretest 3607 26 75 52.19 6.839MDS NEP Posttest 3579 22 75 52.79 7.541
2013–18 NEP Pretest 2688 26 75 52.17 6.9192013–18 NEP Posttest 2671 22 75 52.68 7.623
Note: MDS = metadataset. 2013–18 are years where data for both Sustainable Educational Travel and OtherPrograms exist.
4.1. Validation of the NEP within the Sample
Principal components analysis for the NEP scale at pretest for the MDS yielded three factors withinitial eigenvalues above 1.00, with the first factor explaining 27.23% of the variance in the sample.After varimax rotation, eight items loaded most heavily onto the first factor, five onto the secondfactor and the remaining two onto the third factor (Table 3). As Table 4 shows, these results are notdramatically dissimilar to Dunlap et al.’s [9] findings. However, this does not detract from the standingcriticism that the NEP should not be considered unidimensional according to these (and many other)results. The item-factor structure did not change markedly for the NEP scale at posttest.
In the MDS, the NEP at pretest had corrected item-total correlations ranging from 0.13 to 0.56with an average of 0.37. Three items had corrected item-total correlations lower than 0.30 (items4, 6 and 14; Table 3). Removal of items 4 and 6 increased the coefficient alpha by 0.007 and 0.009,respectively. Removal of item 14 did not affect coefficient alpha at this resolution. These changes wereinconsequential to the point that the improvement gained by their removal is not worth the loss ofcomparability with other research using the NEP and they were retained for this purpose.
Reliability analysis of the NEP at pretest for the MDS yielded a coefficient α of 0.77 at pretest(n = 3607) and 0.81 at posttest (n = 3579) for both categories combined. Reliability of the NEP for theSETss group yielded 0.76 at pretest (n = 2622) and 0.81 posttest (n = 2619). The remainder of the sample(OP group) yielded 0.78 at pretest (n = 985) and 0.82 at posttest (n = 970) for coefficient α.

Sustainability 2020, 12, 8258 8 of 19
Table 3. Metadataset NEP (New Ecological Paradigm) pretest exploratory factor analysis (principalcomponents with varimax rotation).
Factor CITC *
Item Number 1 2 31. We are approaching the limit of the number of people the
earth can support. 0.72 −0.16 0.11 0.46
2. Humans have the right to modify the natural environment tosuit their needs. 0.04 0.37 0.64 0.31
3. When humans interfere with nature it often producesdisastrous consequences. 0.65 0.08 −0.08 0.41
4. Human ingenuity will ensure that we do NOT make the earthunlivable. 0.15 0.60 0.21 0.14
5. Humans are severely abusing the environment. 0.74 0.01 −0.14 0.536. The earth has plenty of natural resources if we just learn how
to develop them. 0.07 0.70 −0.02 0.13
7. Plants and animals have as much right as humans to exist. 0.56 0.30 −0.49 0.438. The balance of nature is strong enough to cope with the
impacts of modern industrial nations. −0.14 0.66 0.19 0.34
9. Despite our special abilities humans are still subject to thelaws of nature. 0.60 0.29 −0.16 0.33
10. The so-called “ecological crisis” facing humankind has beengreatly exaggerated. −0.20 0.49 0.47 0.44
11. The earth is like a spaceship with very limited roomand resources. 0.72 −0.18 0.16 0.45
12. Humans were meant to rule over the rest of nature. −0.08 0.22 0.76 0.3913. The balance of nature is very delicate and easily upset. 0.67 0.07 0.00 0.39
14. Humans will eventually learn enough about how natureworks to be able to control it. 0.05 0.48 0.36 0.23
15. If things continue on their present course, we will soonexperience a major ecological catastrophe. 0.77 −0.02 −0.16 0.56
Unrotated Eigenvalues 4.09 2.67 1.06Unrotated % of Variance 27.23 17.77 7.06
Note: Factor loadings greater than 0.30 are in bold type. * Corrected item-total correlations: values lower than 0.30are in bold type. N = 3607. Rotation method: Varimax with Kaiser normalization.
Table 4. Comparative factor structure for the NEP: Dunlap et al. versus SETss at pretest.
Dunlap et al. “Facets” Item Number Dunlap et al. Factors SETss Factor
Limits 1. We are approaching the limit . . . 3 16. The earth has plenty of . . . 2 2
11. The earth is like a spaceship . . . 3 1Anti Anthro 2. Humans have the right to modify . . . 4 3
7. Plants and animals have . . . 4 112. Humans were meant to rule . . . 4 3
Fragility 3. When humans interfere . . . . 1 18. The balance of nature is . . . 2 2
13. The balance of nature is . . . delicate . . . 1 1Anti Exempt 4. Human ingenuity will insure . . . 2 2
9. Despite our special abilities . . . 1 114. Humans will eventually . . . control . . . 2 2
Eco Crisis 5. Humans are severely abusing . . . 1 110. The so–called “ecological crisis” . . . 1 1
15. If things continue . . . 1 1
Note: Columns 1 and 2 are divided into Dunlap et al.’s five “facets” and the questions that pertain to them (for thefull wording refer to Table 3). Columns 3 and 4 are color-coded by factor for ease of comparison of Dunlap et al.’s4-factor results and the 3-factor results from this study.
Dunlap et al.’s [9] four factor structure was not supported by reliability analysis results of SETss NEPresponses (Table 4). In this sample only three factors emerge. However, three of Dunlap et al.’s “facets”

Sustainability 2020, 12, 8258 9 of 19
loaded in the same manner: Fragility, Anti-exemptionalism and Eco-crisis. Furthermore, at least oneitem from each facet loads most heavily on the first factor, also in line with Dunlap et al.’s findings.In the remaining “facets”, three items in our sample load most heavily onto the first factor rather thanthose with low eigenvalues, in contrast to Dunlap et al.’s results.
The NEP showed strong, positive correlations with both Biospheric Values (0.464, p < 0.01)and Environmental Citizenship (0.468, p < 0.01; Table 5). A moderate, negative correlation existedbetween NEP and Egoistic Values (0.297, p < 0.01). The Connectedness to Nature scale was moderatelycorrelated with the NEP (0.416, p < 0.01, n = 568) and is omitted from Table 5 as no correlations couldbe calculated with other variables as they were not assessed concurrently in any years.
Table 5. Pearson correlations for NEP and values at pretest and posttest.
NEP Altruistic Biospheric Egoistic Environmental Citizenship
NEP 1 0.211 ** 0.485 ** −0.250 ** 416 **(n = 3607) (n = 616) (n = 614) (n = 614) (n = 3079)
Altruistic 0.190 ** 1 0.442 ** 0.026 0.219 **(n = 616) (n = 1079) (n = 1076) (n = 1075) (n = 600)
Biospheric 0.464 ** 0.367 ** 1 −0.063 * 0.454 **(n = 613) (n = 1066) (n = 1079) (n = 1076) (n = 599)
Egoistic −0.297 ** 0.002 −0.082 ** 1 −0.119 **(n = 616) (n = 1068) (n = 1066) (n = 1080) (n = 599)
Environmental 0.468 ** 0.180 ** 0.549 ** −0.135 ** 1Citizenship (n = 3113) (n = 601) (n = 600) (n = 600) (n = 4036)
Note: * p < 0.05. ** p < 0.01. Bold italic text report posttest results, else = pretest results.
The return of moderate correlations in the expected direction to other values-based variables inaccordance with the knowledgebase supports the assertion that the NEP is functioning as intendedand can discriminate changes in values/beliefs underlying the scale within the sample. Given the largesample size, the fact that the factor structure revealed by exploratory principal components analysisis similar to Dunlap et al.’s [9] results and that the two items with concerning corrected item-totalcorrelations are not overly influential on coefficient alpha, the authors proceed as Dunlap et al. [9]recommend under such circumstances and accept the scale as unidimensional.
4.2. Hypothesis 1: Demographic Relationships to NEP at Pretest
Within the entire metadataset, stepwise regression yielded a model with Political Orientation(β = −0.61, SE = 0.043), Gender (β = 0.35, SE = 0.047) and Business Focus (β = −0.14, SE = 0.054) asimportant contributors to variation in NEP z-scores at pretest (n = 2001, F = 103.56, p < 0.001; Table 6).Demographic factors were found to have a significant association with NEP score at pretest, supportingH1 overall:
a. Identifying as female was associated with higher NEP scores at pretest.b. Liberal political beliefs were associated with higher NEP scores at pretest (and explained the
most variation in NEP scores at pretest).c. Business majors were associated with lower NEP scores at pretest.d. Class standing was not significantly associated with NEP scores at pretest.e. Number of sustainability-related courses was not significantly associated with NEP scores
at pretest.

Sustainability 2020, 12, 8258 10 of 19
Table 6. Stepwise regression of demographic factors on NEP z-score at pretest A (entire metadaset;n = 2001).
Model #. Variable Added Cumulative R* R2 Change F Change df1 df2 Sig. F Change
1. Political Orientation 0.320 0.102 227.628 1 1999 0.0002. Gender 0.363 0.029 67.432 1 1998 0.000
3. Business Focus 0.367 0.003 7.117 1 1997 0.008
Note: Independent variables entered: Gender, Political Orientation, Business Focus, Class Standing, Number ofHuman-Ecology Courses. *R is cumulative in this column as model # increases.
Within the subset of SETss subjects, stepwise regression yielded a model that included PoliticalOrientation (β =−0.65, SE = 0.05) and Gender (β = 0.41, SE = 0.05) as significant contributors to variationin NEP z-scores at Pretest (n = 1446, m = 52.19, d = 6.839, F = 126.83, p < 0.001). Variable selectionresults are presented in Table 7. Demographic factors have a significant association with NEP score atpretest within SETss students, supporting H1. Identifying as female is associated with higher NEPscores at pretest, while leaning to the political right is associated with lower NEP scores at pretest.Of these, Political Orientation contributed the most to explaining the variation in NEP scores forSETss students.
Table 7. Stepwise regression of demographic factors on NEP z-score at pretest B (Sustainable EducationalTravel group; n = 1446).
Model #. Variable Added Cumulative R* R2 Change F Change df1 df2 Sig. F Change
1. Political Orientation 0.338 0.114 186.447 1 1444 0.0002. Gender 0.387 0.035 59.641 1 1443 0.000
Note: Independent variables entered: Gender, Political Orientation, Business Focus, Class Standing, Number ofHuman-Ecology Courses. *R is cumulative in this column as model # increases.
4.3. Hypothesis 2: Sustainable Educational Travel Versus Other Programs
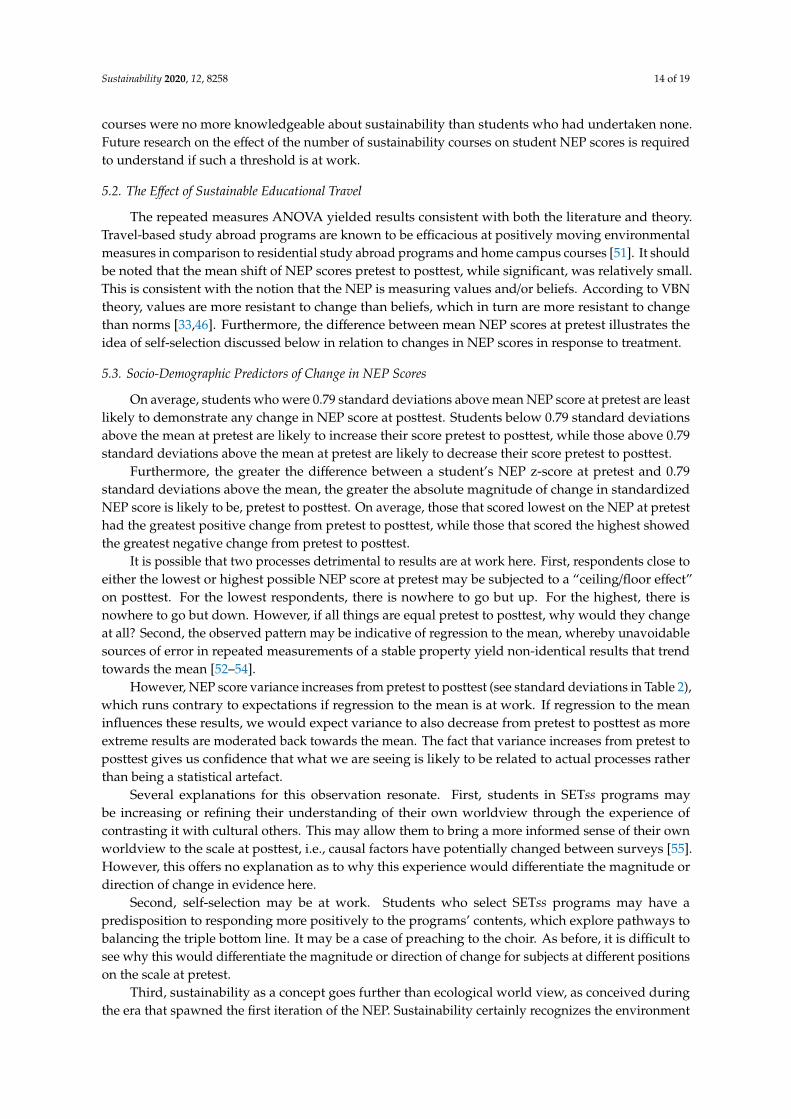
Repeated measures ANOVA results showed a significant, but small, interaction for Time andTreatment (n = 1638, F = 37.65, df = 1, p < 0.001, partialω2 = 0.01) and a significant, but small, effect forTreatment (F = 54.46, df = 1, p < 0.001, partialω2 = 0.02). SETss students’ NEP scores rose from pretest(m = 52.69, SE = 0.17) to posttest (m = 53.67, SE = 0.19) whereas OP students showed no significantchange in mean NEP score from pretest (m = 51.20, SE = 0.23) to posttest (m = 51.02, SE = 0.25; Figure 2).
Sustainability 2020, 12, x FOR PEER REVIEW 11 of 20
pretest (m = 52.69, SE = 0.17) to posttest (m = 53.67, SE = 0.19) whereas OP students showed no significant change in mean NEP score from pretest (m = 51.20, SE = 0.23) to posttest (m = 51.02, SE = 0.25; Figure 2).
Figure 2. NEP scores over Time by Treatment.
The paired t-test revealed a significant difference between pretest and posttest mean NEP scores (pretest = 52.52, sd = 6.78; posttest = 53.47, sd = 7.434) for SETss students (n = 2501, t = –9.53, df = 250, p < 0.001). At the 95% confidence level, there is support for H2 that, on average, NEP scores at posttest are higher than at prettest in Sustainable Educational Travel programs.
4.4. Hypothesis 3: Demographic Predictors of Response to Treatment in SETss Students
Stepwise regression of demographic variables returned a model with Gender (β = 0.10, SE = 0.05) as the only significant predictor of change in NEP (as z-scores) pretest to posttest (R = .06, F = 5.027, p < 0.05), supporting H3. Being female is weakly associated with higher change in NEP scores from pretest to posttest.
Linear regression showed a significant inverse relationship between change in NEP (as z-scores) pretest to posttest and NEP z-scores at pretest (n = 2501, F = 8.24, p < 0.01). Students in SETss programs who scored lower on the NEP scale at pretest were more likely to show greater gains in NEP score from pretest to posttest than those with higher NEP scores at pretest (Figure 3).
Figure 2. NEP scores over Time by Treatment.

Sustainability 2020, 12, 8258 11 of 19
The paired t-test revealed a significant difference between pretest and posttest mean NEP scores(pretest = 52.52, sd = 6.78; posttest = 53.47, sd = 7.434) for SETss students (n = 2501, t = −9.53, df = 250,p < 0.001). At the 95% confidence level, there is support for H2 that, on average, NEP scores at posttestare higher than at prettest in Sustainable Educational Travel programs.
4.4. Hypothesis 3: Demographic Predictors of Response to Treatment in SETss Students
Stepwise regression of demographic variables returned a model with Gender (β = 0.10, SE = 0.05)as the only significant predictor of change in NEP (as z-scores) pretest to posttest (R = 0.06, F = 5.027,p < 0.05), supporting H3. Being female is weakly associated with higher change in NEP scores frompretest to posttest.
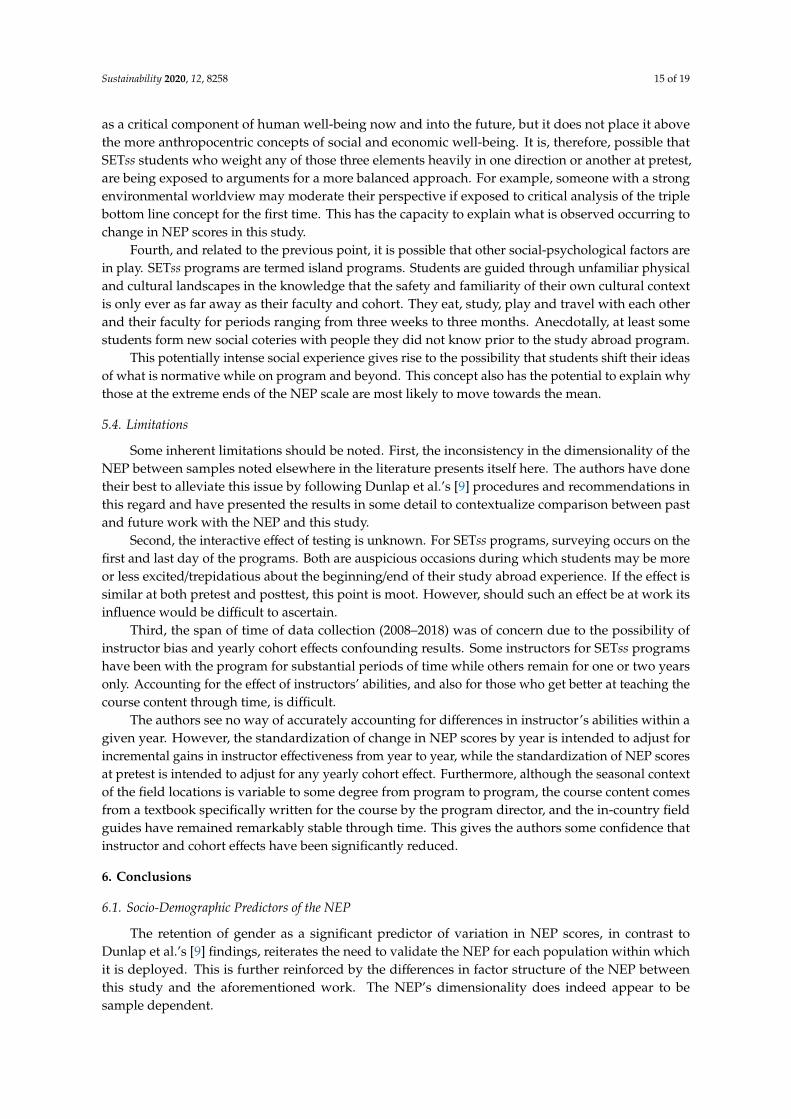
Linear regression showed a significant inverse relationship between change in NEP (as z-scores)pretest to posttest and NEP z-scores at pretest (n = 2501, F = 8.24, p < 0.01). Students in SETss programswho scored lower on the NEP scale at pretest were more likely to show greater gains in NEP scorefrom pretest to posttest than those with higher NEP scores at pretest (Figure 3).Sustainability 2020, 12, x FOR PEER REVIEW 12 of 20
Figure 3. Scatterplot of change in NEP by distance from mean at pretest in Sustainable Educational Travel students. Note: change scores and pretest scores are z-scores standardized by year.
Inclusion of NEP z-score at pretest as an independent variable into a stepwise regression with demographic variables yielded a model that retained it as the most significant variable (β = –0.21, SE = 0.02) in accounting for variation in change in NEP (as z-scores) pretest to posttest. The model (n = 1389, F = 31.95, p < 0.001; Table 8) also retained Gender (β = 0.19, SE = 0.04) and Political Orientation (β = –0.09, SE = 0.04) as significant explanatory variables. Being female is associated with greater gains in change in NEP (as z-scores) pretest to posttest, as is leaning towards the political left.
Table 8. Stepwise regression of demographic factors and NEP z-scores at pretest on change in NEP (as z-scores) pretest to posttest (n = 1389).
Model #. Added Variable Cumulative R*
R2 Change
F Change df1 df2 Sig. F
Change 1. Standardised Distance from Mean NEP at Pretest 0.222 0.049 72.133 1 1387 0.000
2. Gender 0.249 0.013 18.649 1 1386 0.000 3. Political Orientation 0.254 0.003 3.959 1 1385 0.047
Note: Independent variables entered: Gender, Political Orientation, Business Focus, Class Standing, Number of Human-Ecology Courses. *R is cumulative in this column as model # increases.
5. Discussion
5.1. Socio-Demographic Predictors of the NEP
The results of variable selection within the entire metadataset align with Dunlap et al.’s [9] findings on antecedents of the New Ecological Paradigm (NEP), to some degree. Of the three variables in this study that correspond to those used by Dunlap et al. [9], i.e., gender, political orientation and intended occupation (major of study), only the latter two showed the same relationships and were negatively associated with NEP scores at pretest. Results for gender as a predictor of NEP scores at pretest went against Dunlap et al.’s [9] findings and showed a significant positive relationship at pretest.
Figure 3. Scatterplot of change in NEP by distance from mean at pretest in Sustainable EducationalTravel students. Note: change scores and pretest scores are z-scores standardized by year.
Inclusion of NEP z-score at pretest as an independent variable into a stepwise regression withdemographic variables yielded a model that retained it as the most significant variable (β = −0.21,SE = 0.02) in accounting for variation in change in NEP (as z-scores) pretest to posttest. The model(n = 1389, F = 31.95, p < 0.001; Table 8) also retained Gender (β = 0.19, SE = 0.04) and PoliticalOrientation (β = −0.09, SE = 0.04) as significant explanatory variables. Being female is associated withgreater gains in change in NEP (as z-scores) pretest to posttest, as is leaning towards the political left.

Sustainability 2020, 12, 8258 12 of 19
Table 8. Stepwise regression of demographic factors and NEP z-scores at pretest on change in NEP(as z-scores) pretest to posttest (n = 1389).
Model #. Added Variable Cumulative R* R2 Change F Change df1 df2 Sig. F Change
1. Standardised Distancefrom Mean NEP at Pretest 0.222 0.049 72.133 1 1387 0.000
2. Gender 0.249 0.013 18.649 1 1386 0.0003. Political Orientation 0.254 0.003 3.959 1 1385 0.047
Note: Independent variables entered: Gender, Political Orientation, Business Focus, Class Standing, Number ofHuman-Ecology Courses. *R is cumulative in this column as model # increases.
5. Discussion
5.1. Socio-Demographic Predictors of the NEP
The results of variable selection within the entire metadataset align with Dunlap et al.’s [9] findingson antecedents of the New Ecological Paradigm (NEP), to some degree. Of the three variables in thisstudy that correspond to those used by Dunlap et al. [9], i.e., gender, political orientation and intendedoccupation (major of study), only the latter two showed the same relationships and were negativelyassociated with NEP scores at pretest. Results for gender as a predictor of NEP scores at pretest wentagainst Dunlap et al.’s [9] findings and showed a significant positive relationship at pretest.
5.1.1. Gender
In contrast to Dunlap et al.’s [9] findings, gender is found to be a significant predictor of NEP.However, this result is in line with other work on environmental attitudes see [23–26,29]. This makessense in light of Stern et al.’s [29] characterization of an individual’s position in the social structureas antecedent to worldview. If a society has significant differences in the position of genderswithin its structure/s, one expects to see differences in worldview between genders. For example,Zelezny et al. [48] found, compared to males, females are more likely to take account of the needs ofothers, to have higher levels of socialization and to be more socially responsible. This supports theidea that women can have a different experience of social structure than men, which in turn supportsthe finding of significant differences in worldview between genders.
5.1.2. Liberal Political Beliefs
The positive association between liberal political leaning and higher NEP scores at pretest resonateswith results from other studies see [9,23,24]. Returning to Stern et al.’s [29] hierarchy, one’s politicalbeliefs can be seen as a set of specific beliefs and attitudes based upon broader beliefs and a worldviewderived from an individual’s values. Thus, it is not surprising this study finds a relationship betweenliberal political beliefs and higher NEP scores. For example, those with conservative political beliefsthat the “market will fix everything” are less likely to identify with the “limits to growth” facet ofthe NEP.
Recent work by Ziegler [49] found considerable overlap between political orientation andenvironmental values (i.e., the NEP) in explaining variation in beliefs and attitudes on climate change.Furthermore, he found significant differences in the interaction of those variables when comparing theUnited States, Germany and China, suggesting that the relationship between the NEP and politicalorientation varies between cultures. Again, this reinforces Stern et al.’s [29] assertion that socialstructures precede values, which precede worldviews (including the NEP), which precede specificbeliefs and attitudes (including political orientation).
5.1.3. Business Majors
Dunlap et al. [9] found occupational sector to be a significant predictor of NEP. The results of thisstudy show business-related majors to be associated with lower NEP scores at pretest, adding definition

Sustainability 2020, 12, 8258 13 of 19
to this relationship for the college student demographic. The fact that business major was retained as asignificant contributor to variation in NEP scores at pretest alongside political orientation for the entiremetadataset is of interest. Regardless of political orientation, or gender, college students who choosebusiness majors over other fields of study on average score lower on the NEP than those with otheroccupations in mind.
One way of contextualizing this is to regard the choice of field of study as a behavioral commitment.From this perspective, it is underpinned by one’s values and beliefs (including one’s worldview)and should bear some relation to them. Furthermore, one’s choice of intended career is a potentiallylife-changing decision and should reflect an individual’s core values more than a decision such aswhether to install solar panels on one’s roof.
5.1.4. Class Standing
Class standing was not found to be a significant predictor of NEP scores. As a proxy for eitherage, or education level, the variable’s range may have been too restrictive (given this sample hasfew respondents outside undergraduate age range) to return results comparable to Dunlap et al. [9],who found age to have a weak negative association with NEP scores and others who have foundage or birth cohort to be predictors of environmentalism [21,22]. However, the result informs us thatincrements in educational level at this scale do not significantly contribute to variation in NEP scores.
One way of considering this result is from the perspective of self-selection of major of study.Prospective students approaching college education may seek areas of study that resonate with theirworld view, and/or that of their parents, potentially reducing the likelihood of them encounteringeducational transformative experiences that may alter, or broaden, that worldview. Selecting coursesof study that sit comfortably within one’s worldview may reduce the chance of encountering learningexperiences capable of causing the cognitive dissonance whose resolution lies at the heart of theoriesof experiential learning as one progresses through college education.
Comparing the MDS variable selection results with those for the SETss category, we see theBusiness Focus now absent from the best model identified by stepwise regression to account forvariability in NEP score at pretest. This is counterintuitive, given the higher percentage of businessschool students in the SETss group in comparison to the Other Program (OP) group (22% versus18%, respectively).
Again, the most obvious rationale to address the difference is self-selection. Students are activelyseeking out study abroad opportunities, of which a large range are on offer. Those that chooseSustainable Educational Travel programs may be predisposed to sustainability concepts or at leastaccepting of them. They may also be selecting the programs for their travel component, in contrastwith studying abroad at a single institution or location. Furthermore, the choice to study abroad,regardless of the mode of study, may be indicative of students looking to broaden their worldviewswho may therefore be more likely to alter their worldview to some degree.
With this in mind, a posthoc one-way ANOVA was conducted within business students (as asubset of the metadataset) using NEP pretest z-scores (standardized by year) as the independentvariable and SETss/OP as the categorical dependent variable. In SETss students, mean NEP pretestz-score was −0.20 (n = 399) while for OP students it was −0.54 (n = 77). ANOVA results showed meanNEP pretest z-scores were significantly higher in SETss students than in OP students, supporting theidea that self-selection is at work, at least in the subset of business majors.
5.1.5. Number of Sustainability-Related Courses
Model building did not retain the number of sustainability-related courses as a significant predictorof NEP scores at pretest. This is counter intuitive. One would think that as a student is exposed tomore sustainability-related courses, their worldview would become more environmentally focused.However, sustainability literacy research has indicated that there may be a threshold effect at work.Horvath et al. [50] found that students who had undertaken fewer than three sustainability-related
Sustainability 2020, 12, 8258 14 of 19
courses were no more knowledgeable about sustainability than students who had undertaken none.Future research on the effect of the number of sustainability courses on student NEP scores is requiredto understand if such a threshold is at work.
5.2. The Effect of Sustainable Educational Travel
The repeated measures ANOVA yielded results consistent with both the literature and theory.Travel-based study abroad programs are known to be efficacious at positively moving environmentalmeasures in comparison to residential study abroad programs and home campus courses [51]. It shouldbe noted that the mean shift of NEP scores pretest to posttest, while significant, was relatively small.This is consistent with the notion that the NEP is measuring values and/or beliefs. According to VBNtheory, values are more resistant to change than beliefs, which in turn are more resistant to changethan norms [33,46]. Furthermore, the difference between mean NEP scores at pretest illustrates theidea of self-selection discussed below in relation to changes in NEP scores in response to treatment.
5.3. Socio-Demographic Predictors of Change in NEP Scores
On average, students who were 0.79 standard deviations above mean NEP score at pretest are leastlikely to demonstrate any change in NEP score at posttest. Students below 0.79 standard deviationsabove the mean at pretest are likely to increase their score pretest to posttest, while those above 0.79standard deviations above the mean at pretest are likely to decrease their score pretest to posttest.
Furthermore, the greater the difference between a student’s NEP z-score at pretest and 0.79standard deviations above the mean, the greater the absolute magnitude of change in standardizedNEP score is likely to be, pretest to posttest. On average, those that scored lowest on the NEP at pretesthad the greatest positive change from pretest to posttest, while those that scored the highest showedthe greatest negative change from pretest to posttest.
It is possible that two processes detrimental to results are at work here. First, respondents close toeither the lowest or highest possible NEP score at pretest may be subjected to a “ceiling/floor effect”on posttest. For the lowest respondents, there is nowhere to go but up. For the highest, there isnowhere to go but down. However, if all things are equal pretest to posttest, why would they changeat all? Second, the observed pattern may be indicative of regression to the mean, whereby unavoidablesources of error in repeated measurements of a stable property yield non-identical results that trendtowards the mean [52–54].
However, NEP score variance increases from pretest to posttest (see standard deviations in Table 2),which runs contrary to expectations if regression to the mean is at work. If regression to the meaninfluences these results, we would expect variance to also decrease from pretest to posttest as moreextreme results are moderated back towards the mean. The fact that variance increases from pretest toposttest gives us confidence that what we are seeing is likely to be related to actual processes ratherthan being a statistical artefact.
Several explanations for this observation resonate. First, students in SETss programs maybe increasing or refining their understanding of their own worldview through the experience ofcontrasting it with cultural others. This may allow them to bring a more informed sense of their ownworldview to the scale at posttest, i.e., causal factors have potentially changed between surveys [55].However, this offers no explanation as to why this experience would differentiate the magnitude ordirection of change in evidence here.
Second, self-selection may be at work. Students who select SETss programs may have apredisposition to responding more positively to the programs’ contents, which explore pathways tobalancing the triple bottom line. It may be a case of preaching to the choir. As before, it is difficult tosee why this would differentiate the magnitude or direction of change for subjects at different positionson the scale at pretest.
Third, sustainability as a concept goes further than ecological world view, as conceived duringthe era that spawned the first iteration of the NEP. Sustainability certainly recognizes the environment
Sustainability 2020, 12, 8258 15 of 19
as a critical component of human well-being now and into the future, but it does not place it abovethe more anthropocentric concepts of social and economic well-being. It is, therefore, possible thatSETss students who weight any of those three elements heavily in one direction or another at pretest,are being exposed to arguments for a more balanced approach. For example, someone with a strongenvironmental worldview may moderate their perspective if exposed to critical analysis of the triplebottom line concept for the first time. This has the capacity to explain what is observed occurring tochange in NEP scores in this study.
Fourth, and related to the previous point, it is possible that other social-psychological factors arein play. SETss programs are termed island programs. Students are guided through unfamiliar physicaland cultural landscapes in the knowledge that the safety and familiarity of their own cultural contextis only ever as far away as their faculty and cohort. They eat, study, play and travel with each otherand their faculty for periods ranging from three weeks to three months. Anecdotally, at least somestudents form new social coteries with people they did not know prior to the study abroad program.
This potentially intense social experience gives rise to the possibility that students shift their ideasof what is normative while on program and beyond. This concept also has the potential to explain whythose at the extreme ends of the NEP scale are most likely to move towards the mean.
5.4. Limitations
Some inherent limitations should be noted. First, the inconsistency in the dimensionality of theNEP between samples noted elsewhere in the literature presents itself here. The authors have donetheir best to alleviate this issue by following Dunlap et al.’s [9] procedures and recommendations inthis regard and have presented the results in some detail to contextualize comparison between pastand future work with the NEP and this study.
Second, the interactive effect of testing is unknown. For SETss programs, surveying occurs on thefirst and last day of the programs. Both are auspicious occasions during which students may be moreor less excited/trepidatious about the beginning/end of their study abroad experience. If the effect issimilar at both pretest and posttest, this point is moot. However, should such an effect be at work itsinfluence would be difficult to ascertain.
Third, the span of time of data collection (2008–2018) was of concern due to the possibility ofinstructor bias and yearly cohort effects confounding results. Some instructors for SETss programshave been with the program for substantial periods of time while others remain for one or two yearsonly. Accounting for the effect of instructors’ abilities, and also for those who get better at teaching thecourse content through time, is difficult.
The authors see no way of accurately accounting for differences in instructor’s abilities within agiven year. However, the standardization of change in NEP scores by year is intended to adjust forincremental gains in instructor effectiveness from year to year, while the standardization of NEP scoresat pretest is intended to adjust for any yearly cohort effect. Furthermore, although the seasonal contextof the field locations is variable to some degree from program to program, the course content comesfrom a textbook specifically written for the course by the program director, and the in-country fieldguides have remained remarkably stable through time. This gives the authors some confidence thatinstructor and cohort effects have been significantly reduced.
6. Conclusions
6.1. Socio-Demographic Predictors of the NEP
The retention of gender as a significant predictor of variation in NEP scores, in contrast toDunlap et al.’s [9] findings, reiterates the need to validate the NEP for each population within whichit is deployed. This is further reinforced by the differences in factor structure of the NEP betweenthis study and the aforementioned work. The NEP’s dimensionality does indeed appear to besample dependent.

Sustainability 2020, 12, 8258 16 of 19
6.2. The Effect of Sustainable Educational Travel
The small, but significant, positive effect of sustainable educational travel on NEP scores across theduration of a program is no surprise. Of more interest is which processes, within sustainable educationaltravel, are responsible for the effect. This is a difficult area to investigate experimentally within theeducational context of this study. However, examination of the interaction between socio-demographicantecedents of changes in NEP scores may provide some direction and are discussed below.
6.3. Socio-Demographic Predictors of Change in NEP Scores
These results suggest that within programs with a demonstrated ability to influence environmentalworld view, albeit marginally, the predictors of environmental worldview at the commencement of aprogram are not necessarily the predictors of susceptibility to change. The fact that political orientationwas a significant predictor of NEP score at pretest but was not a significant predictor of change in NEPscore should give educators hope. That difference suggests that higher education has the ability toovercome at least some of the biases students bring with them to the educational discourse and thatSETss programs are effective at doing so.
Educators wishing to leverage this effect may wish to consider whether the pedagogies uponwhich SETss programs are based can be incorporated into their curricula, i.e., experiential learningtheory (ELT), transformational learning theory (TLT), situational learning theory (SLT) and criticalcultural pedagogy (CCP). To that end, further studies endeavoring to narrow down what aspectsof SETss most contribute to such change would be of interest. Of course, it would be beneficial toknow whether particular components of SETss programs are more effective at generating the observedeffect than others. Within the syllabi of the SETss programs used for this study, one component standsout from others as exemplifying the tenets of ELT, TLT, SLT and CCP experiences; the socio-scientificissue (SSI).
SSIs are used to encourage reflection on the knowledge and application of knowledge surroundinga given issue in society [56]. In SETss programs, SSIs are deployed in programs visiting Australia andNew Zealand to focus student learning on contemporary “wicked” problems, which have multiplestakeholders, different outcomes at different scales and no single solution. Students are assignedstakeholder or decision-maker roles and must research and present or conduct their case per that role.Research through interaction with local stakeholders is encouraged. Students playing decision-makerroles deliberate after stakeholder presentations and come to a decision, which is debated in characterand then debriefed out of character.
As such, SSIs utilize reflection as a core process in the construction of meaning in line with ELTand TLT. Furthermore, through being physically present in the socio-political context of the issue athand, the immersive aspect of SLT and the balance of power focus of CCP are invoked. Should othereducators wish to explore the potential of SETss pedagogies in their own practice, we recommend SSIsas promising starting point.
However, in order to recommend specific practices for educators to deploy in pursuit of suchgoals more resolution on the agents of change is required. Testing the effect of SSIs on worldviewsappears to be the lowest hanging fruit. The authors urge others with the opportunity to do so tocontribute to the discourse on the social-psychological predictors of beliefs and their malleability in thesustainability education setting.
Author Contributions: Conceptualization, M.T. and S.L.; methodology, M.T.; validation, S.L. and A.L.; formalanalysis, S.L. and A.L.; investigation, S.L.; data curation, S.L. and A.L.; writing—original draft preparation, S.L.;writing—review and editing, S.L., A.L., M.T., and D.R. All authors have read and agreed to the published versionof the manuscript.
Funding: This research received no external funding.
Conflicts of Interest: The authors declare no conflict of interest.

Sustainability 2020, 12, 8258 17 of 19
References
1. Institute of International Education. Open Doors Press Release. 2019. Available online:https://www.iie.org/Why-IIE/Announcements/2019/11/Number-of-International-Students-in-the-United-States-Hits-All-Time-High (accessed on 18 January 2019).
2. Bell, H.L.; Gibson, H.J.; Tarrant, M.A.; Perry, L.G.; Stoner, L. Transformational learning through study abroad:US students’ reflections on learning about sustainability in the South Pacific. Leis. Stud. 2014, 35, 389–405.[CrossRef]
3. Paige, R.M.; Fry, G.W.; Stallman, E.M.; Josic, J.; Jon, J. Study abroad for global engagement: The long-termimpact of mobility experiences. Intercult. Educ. 2009, 20, S29–S44. [CrossRef]
4. Tarrant, M.A.; Stoner, L.; Borrie, W.T.; Kyle, G.; Moore, R.L.; Moore, A. Educational Travel and GlobalCitizenship. J. Leis. Res. 2011, 43, 403–426. [CrossRef]
5. Tarrant, M.A. A Conceptual Framework for Exploring the Role of Studies Abroad in Nurturing GlobalCitizenship. J. Stud. Int. Educ. 2009, 14, 433–451. [CrossRef]
6. Dunlap, R.E. The New Environmental Paradigm Scale: From Marginality to Worldwide Use. J. Environ.Educ. 2008, 40, 3–18. [CrossRef]
7. Azjen, I.; Fishbein, M. The predication of behavior from attitudinal and normative variables. J. Exp. Soc.Psychol. 1970, 6, 466–487.
8. Stern, P.C.; Dietz, T.; Guagnano, G.A. The New Ecological Paradigm in Social-Psychological Context. Environ.Behav. 1995, 27, 723–743. [CrossRef]
9. Dunlap, R.E.; Van Liere, K.D.; Mertig, A.G.; Jones, R.E. New Trends in Measuring Environmental Attitudes:Measuring Endorsement of the New Ecological Paradigm: A Revised NEP Scale. J. Soc. Issues 2000, 56,425–442. [CrossRef]
10. Dunlap, R.E.; Van Liere, K.D. The “New Environmental Paradigm”. J. Environ. Educ. 1978, 9, 10–19.[CrossRef]
11. Anderson, M. New Ecological Paradigm (NEP) Scale. In The Berkshire Encyclopedia of Sustainability;Anderson, R., Ed.; Berkshire Publishing: Great Barrington, MA, USA; Volume 6, pp. 260–262.
12. Gorsuch, R.L.; Rokeach, M. Beliefs, Attitudes, and Values. Am. Sociol. Rev. 1969, 34, 267. [CrossRef]13. Google LLC. Google Scholar. Available online: https://scholar.google.co.nz/scholar?hl=en&as_sdt=0%2C5&
q=New+ecological+paradigm&btnG= (accessed on 9 February 2019).14. Hawcroft, L.J.; Milfont, T.L. The use (and abuse) of the new environmental paradigm scale over the last 30
years: A meta-analysis. J. Environ. Psychol. 2010, 30, 143–158. [CrossRef]15. LaLonde, R.; Jackson, E.L. The New Environmental Paradigm Scale: Has It Outlived Its Usefulness? J. Environ.
Educ. 2002, 33, 28–36. [CrossRef]16. Lundmark, C. The new ecological paradigm revisited: Anchoring the NEP scale in environmental ethics.
Environ. Educ. Res. 2007, 13, 329–347. [CrossRef]17. Messick, S. Validity of Psychological Assessment. Am. Psychol. 1995, 50, 741–749. [CrossRef]18. Amburgey, J.W.; Thoman, D.B. Dimensionality of the New Ecological Paradigm. Environ. Behav. 2011, 44,
235–256. [CrossRef]19. Xiao, C.; Buhrmann, J. The Structure and Coherence of the New Environmental Paradigm: Reconceptualizing
the Dimensionality Debate. Hum. Ecol. Rev. 2017, 23, 179–198. [CrossRef]20. Engelhard, G. Invariant Measurement; Routledge: New York, NY, USA, 2013.21. Jones, R.E.; Dunlap, R.E. The Social Bases of Environmental Concern: Have They Changed Over Time?
Rural Sociol. 2010, 57, 28–47. [CrossRef]22. Van Liere, K.D.; Dunlap, R.E. The Social Bases of Environmental Concern: A Review of Hypotheses,
Explanations and Empirical Evidence. Public Opin. Q. 1980, 44, 181. [CrossRef]23. Johnson, C.Y.; Bowker, J.M.; Cordell, H.K. Ethnic Variation in Enviromental Belief and Behavior: An
Examination of the New Ecological Paradigm in a Social Psychological Context. Environ. Behav. 2006, 36,157–186. [CrossRef]
24. Casey, P.J.; Scott, K. Environmental concern and behaviour in an Australian sample within anecocentric—Anthropocentric framework. Aust. J. Psychol. 2006, 58, 57–67. [CrossRef]
25. Rexeisen, R. The Impact of Study Abroad on the Development of Pro-environmental Attitudes. Int. J. Sust.Educ. 2014, 9, 7–19. [CrossRef]

Sustainability 2020, 12, 8258 18 of 19
26. Rexeisen, R.J.; Al-Khatib, J. Assurance of Learning and Study Abroad: A Case Study. J. Teach. Int. Bus. 2009,20, 192–207. [CrossRef]
27. Kalof, L.; Dietz, T.; Guagnano, G.; Stern, P.C. Race, Gender and Environmentalism: The Atypical Values andBeliefs of White Men. Race Gend. Cl. Conf. Others 2000, 9, 112–130. [CrossRef]
28. Rideout, B.E.; Hushen, K.; McGinty, D.; Perkins, S.; Tate, J. Endorsement of the New Ecological Paradigm inSystematic and E-mail Samples of College Students. J. Environ. Educ. 2005, 36, 15–23. [CrossRef]
29. Stern, P.C.; Dietz, T.; Kalof, L. Value Orientations, Gender, and Environmental Concern. Environ. Behav. 1993,25, 322–348. [CrossRef]
30. Schwartz, S.H. Normative Influences on Altruism. Adv. Exp. Soc. Psychol. 1977, 10, 221–279. [CrossRef]31. Ajzen, I. The Theory of Planned Behavior. Organ. Behav. Hum. Decis. Process. 1991, 50, 179–211. [CrossRef]32. Kaiser, F.G.; Hübner, G.; Bogner, F.X. Contrasting the Theory of Planned Behavior With the Value-Belief-Norm
Model in Explaining Conservation Behavior. J. Appl. Soc. Psychol. 2005, 35, 2150–2170. [CrossRef]33. Stern, P.C.; Kalof, L.; Dietz, T.; Guagnano, G.A. Values, Beliefs, and Proenvironmental Action: Attitude
Formation Toward Emergent Attitude Objects. J. Appl. Soc. Psychol. 1995, 25, 1611–1636. [CrossRef]34. Wynveen, C.J.; Kyle, G.T.; Tarrant, M.A. Study Abroad Experiences and Global Citizenship. J. Stud. Int. Educ.
2011, 16, 334–352. [CrossRef]35. De Groot, J.I.M.; Steg, L. Value Orientations to Explain Beliefs Related to Environmental Significant Behavior.
Environ. Behav. 2007, 40, 330–354. [CrossRef]36. Liu, X.; Zou, Y.; Wu, J. Factors Influencing Public-Sphere Pro-Environmental Behavior among Mongolian
College Students: A Test of Value–Belief–Norm Theory. Sustainability 2018, 10, 1384. [CrossRef]37. Kolb, D.A. Experiential Learning: Experience as the Source of Learning and Development; Prentice Hall:
Upper Saddle River, NJ, USA, 1984.38. Mezirow, J. Fostering Critical Reflection in Adulthood; Jossey-Bass: San Francisco, CA, USA, 1990.39. Stone, G.A.; Duffy, L.N. Transformative Learning Theory: A Systematic Review of Travel and Tourism
Scholarship. J. Teach. Travel Tour. 2015, 15, 204–224. [CrossRef]40. Hanson, L. Global Citizenship, Global Health, and the Internationalization of Curriculum. J. Stud. Int. Educ.
2008, 14, 70–88. [CrossRef]41. Brown, J.S.; Collins, A.; Duguid, P. Situated Cognition and the Culture of Learning. Situat. Cognit. Cult.
Learn. 1988, 18, 32–42. [CrossRef]42. Fenwick, T.J. Experiential Learning: A Theoretical Critique from Five Perspectives. 2001. Available online:
https://files.eric.ed.gov/fulltext/ED454418.pdf (accessed on 18 January 2019).43. Fenwick, T.J. Expanding Conceptions of Experiential Learning: A Review of the Five Contemporary
Perspectives on Cognition. Adult Educ. Q. 2000, 50, 243–272. [CrossRef]44. Giroux, H.A.; McLaren, P.L. Introduction: Schooling, Cultural Politics and the Struggle for Democracy.
In Critical Pedagogy, the State, and Cultural Struggle; Giroux, H.A., McLaren, P., Eds.; State University of NewYork: Albany, NY, USA, 1989.
45. Harraway, J.; Broughton-Ansin, F.; Deaker, L.; Jowett, T.; Shephard, K. Exploring the Use of the RevisedNew Ecological Paradigm Scale (NEP) to Monitor the Development of Students’ Ecological Worldviews.J. Environ. Educ. 2012, 43, 177–191. [CrossRef]
46. Quinn, J.A. Human Ecology and Interactional Ecology. Am. Sociol. Rev. 1940, 5, 713. [CrossRef]47. IBM Corp. Released 2017. IBM SPSS Statistics for Windows; Version 25; IBM Corp.: Armonk, NY, USA.48. Zelezny, L.C.; Chua, P.-P.; Aldrich, C. Elaborating on Gender Differences in Environmentalism. J. Soc. Issues
2000, 56, 443–457. [CrossRef]49. Ziegler, A. Political orientation, environmental values, and climate change beliefs and attitudes: An empirical
cross country analysis. Energy Econ. 2017, 63, 144–153. [CrossRef]50. Horvath, N.; Steward, M.; Shea, M. Toward Instruments of Assessing Sustainability Knowledge: Assessment
Development, Process, and Results From a Pilot Survey at the University of Maryland. J. Sust. Educ. 2013, 5,311–320.
51. Landon, A.C.; Woosnam, K.M.; Keith, S.J.; Tarrant, M.A.; Rubin, D.L.; Ling, S.T. Understanding and modifyingbeliefs about climate change through educational travel. J. Sust. Tour. 2019, 27, 292–307. [CrossRef]
52. Agresti, A.; Finlay, B. Statistical Methods for the Social Sciences, 4th ed.; Pearson Prentice Hall: Upper Saddle River,NY, USA, 2009.

Sustainability 2020, 12, 8258 19 of 19
53. Seel, N.M.; Buri, J.R.; Gunty, A.; Dukas, R.; Even, R.; Scheuer, O.; McLaren, B.M.; Okan, Z.; Everhart, D.E.;Schmidt-Kassow, M.; et al. Experimental and Quasi-Experimental Designs for Research on Learning.In Encyclopedia of the Sciences of Learning; Springer Science and Business Media LLC: New York, NY, USA,2012; pp. 1223–1229.
54. Schwarz, W.; Reike, D. Regression away from the mean: Theory and examples. Br. J. Math. Stat. Psychol.2017, 71, 186–203. [CrossRef] [PubMed]
55. Nesselroade, J.R.; Stigler, S.M.; Baltes, P.B. Regression toward the mean and the study of change. Psychol. Bull.1980, 88, 622–637. [CrossRef]
56. Ratcliffe, M.; Grace, M. Science Education for Citizenship: Teaching Socio-Scientific Issues; Open University Press:Maidenhead, UK, 2003.
© 2020 by the authors. Licensee MDPI, Basel, Switzerland. This article is an open accessarticle distributed under the terms and conditions of the Creative Commons Attribution(CC BY) license (http://creativecommons.org/licenses/by/4.0/).