Sustainability and Environmental Management: Emissions ...
19
8 Strategic Planning for Energy and the Environment Sustainability and Environmental Management: Emissions Accounting for Ports Atulya Misra, Karthik Panchabikesan, Elayaperumal Ayyasamy, and Velraj Ramalingam Chennai, India ABSTRACT Seaports are global hubs for the transportation of goods. They play an important role in today’s global societies and are critical nodes in transportation networks. Sustainable energy use impacts people, the world’s environment, and is relevant to the operation and maintenance of ports. In this article, an inventory of greenhouse gas (GHG) emissions in the port of Chennai is made by accounting for the various port facilities, the housing areas, and the fishing harbour, all managed by the port of Chennai. GHG emissions are quantified by following the guidelines of the Intergovernmental Panel on Climate Change (IPCC) and the World Port Climate Initiative (WPCI). Our estimate of GHG emissions for the financial year 2014-15 indicates that 280,558 tonnes of CO 2 e/year were generated by the port and port related activities. The detailed estima- tion of energy consumption and emissions generated by the individual systems are useful for energy engineers when implementing energy conservation measures and renewable energy technologies. Implemen- tation of GHG mitigation strategies for all port-related activities will help achieve significant GHG reductions, reducing the adverse impacts of global climate change. INTRODUCTION The environmental threats posed by global warming in the 21 st century diversely impact the health and economies of communities.
Transcript of Sustainability and Environmental Management: Emissions ...

8 Strategic Planning for Energy and the Environment
Sustainability andEnvironmental Management:
Emissions Accounting for PortsAtulya Misra, Karthik Panchabikesan,
Elayaperumal Ayyasamy, and Velraj RamalingamChennai, India
ABSTRACT
Seaports are global hubs for the transportation of goods. They play an important role in today’s global societies and are critical nodes in transportation networks. Sustainable energy use impacts people, the world’s environment, and is relevant to the operation and maintenance of ports. In this article, an inventory of greenhouse gas (GHG) emissions in the port of Chennai is made by accounting for the various port facilities, the housing areas, and the fishing harbour, all managed by the port of Chennai. GHG emissions are quantified by following the guidelines of the Intergovernmental Panel on Climate Change (IPCC) and the World Port Climate Initiative (WPCI). Our estimate of GHG emissions for the financial year 2014-15 indicates that 280,558 tonnes of CO2e/year were generated by the port and port related activities. The detailed estima-tion of energy consumption and emissions generated by the individual systems are useful for energy engineers when implementing energy conservation measures and renewable energy technologies. Implemen-tation of GHG mitigation strategies for all port-related activities will help achieve significant GHG reductions, reducing the adverse impacts of global climate change.
INTRODUCTION
The environmental threats posed by global warming in the 21st century diversely impact the health and economies of communities.

9Summer 2017, Vol. 37, No. 1
The Intergovernmental Panel on Climate Change (IPCC) fourth assess-ment report [1] states that among the GHG emissions from industrial activities, CO2 emissions are one of the major causes of climate inter-ference. Sea ports act as global hubs for the transportation of goods. Hence they have an important role in today’s globalized society and are critical nodes in global networks. Sustainable practices relevant to the operation and maintenance of ports impact the world’s people and the environment. Due to growing international trade, maritime emissions are expected to more than double by 2050 if no mitigation actions are initiated. The activities in and around sea ports use vast amounts of energy that contribute to GHG emissions. The development of a structured baseline for greenhouse gases helps identify the areas where improve-ments could be made to mitigate GHG emissions. GHG inventories can be used to evaluate the effectiveness of the mitigation measures over a period of time. A carbon footprint represents the amount of GHG emissions an organization or event directly or indirectly releases over a measured period. Carbon footprints can be used for tracking emis-sion trends and providing the information required to mitigate sea port GHG emissions. The ultimate challenge for the marine and port related industries is to develop environmentally sound, cost-effective, and practical solutions to achieve near zero carbon emission technologies. The major sources of air pollution at ports and their impact on health were extensively studied by Bailey and Solomon [2]. They sug-gested a broad range of mitigation approaches such as switching to cleaner versions of diesel fuel, restricting truck idling hours, transition-ing to alternative fuels and replacing older diesel equipment with new-er equipment. They also proposed measures that incorporate emerging technologies such as shore side power for docked ships, zero emission technologies (e.g., fuel cells), and automated container handling. Mora et al. [3] performed an extensive environmental analysis of a sample port considering 21 major port activities (sea traffic, land traffic, fishing activity, dredging, waste disposal, etc.) which often have adverse envi-ronmental impacts. Sustainable environmental management indicators such as air quality, atmospheric contaminant emissions, gas emissions, noise pollution, and quality of spilled waste water were also indicated. Schrooten et al. [4] studied the effects of recent international efforts to reduce the emissions from sea going vessels. Their investigations revealed that CO2e (carbon dioxide equivalent) emissions between

10 Strategic Planning for Energy and the Environment
2004 and 2010 would likely increase by 2% to 9%, while NOx emissions would increase as much as 8%, and SOx emissions would decrease by 50%. Wang et al. [5] compared global ship emission inventories using an automated mutual assistance vessel rescue data set and determined that the world’s cargo fleet accounted for about 80% of total commercial fleet emissions. They also generated spatial proxies of global ship traffic with two global ship reporting data sets as proxies to geographically resolve global ship emissions. Based on bottom-up and activity-based methodologies, Meyer et al. [6] estimated the atmospheric emissions by international merchant shipping in Belgian’s North Sea. Their estimate included the four primary Belgian seaports and compared their results with international emission estimates. Han et al. [7] identified the status of pollution mitigation measures implemented in the shipping sector and developed an environmental evaluation scheme by investigating the actual conditions of environ-mental pollution from ship and port areas. GHG emissions were esti-mated for the Port of Barcelona by Villalba et al. [8] to be 331,390 tonnes in 2008, half of which were attributed to vessel movement (sea-based emissions) and the other half to port related activities (land-based emis-sions). They also reported that the biggest polluters were auto carriers with 6 kg of GHG emissions per ton of cargo handled. Fitzgerald et al. [9] used a cargo based methodology and estimated that the interna-tional maritime transport of New Zealand’s imports and exports con-sumed 2.5 million tonnes of fuel during the year 2007, generating 7.7 million tonnes (Mt) of CO2e emissions. Liao et al. [10] investigated the variations in carbon dioxide emissions by moving containers from es-tablished ports through the emerging port of Taipei in northern Taiwan. They suggested the adoption of an analytical approach to understand the prospective CO2e reduction in the route selection of inland contain-er transportation. Gibbs et al. [11] analysed secondary data and infor-mation on actions taken by ports in the United Kingdom (UK) to reduce their emissions. Their studies focused on operations at five major UK ports and they determined that emissions from shipping at berth were ten times greater than those from the ports own operations. Moreover, it was found that shipping emissions associated with seaborne trade at those ports were more important than those generated by port opera-tions. Chang et al. [12] measured the greenhouse emissions, particularly from ocean going vessels in the Port of Incheon. They calculated the categories of GHG emissions and the movement of vessels from their

11Summer 2017, Vol. 37, No. 1
arrival in port, to docking, cargo handling and departure. Their results revealed that among various types of vessels, international car ferries were the most substantial emitters, followed by fully-loaded container vessels. India is the third largest emitter of greenhouse gases in the world, after China and the U.S. Between 1994 and 2007, India’s GHG emissions nearly doubled and continue to increase. Port authorities have a unique responsibility to adopt sustainable practices that preserve natural re-sources while ensuring economic growth. Prior to this assessment, ports in India have lacked GHG inventories of their activities. This article offers a detailed inventory that estimates the carbon footprint for the financial year 2014-15 of activities in the Port of Chennai, along with its housing colony and fishing harbour. Mitigation strategies to reduce GHG emissions are also discussed.
PORT OF CHENNAI
Chennai, the fourth largest Indian port in terms of throughput, is situated on the Coramandel coast and has a handling capacity of 86 mil-lion tonnes annually. The port has three docks namely Ambedkar Dock, Bharathi Dock and Jawahar Dock. Ambedkar Dock has facilities to han-dle steel, packed cargo, granite and other project cargos. Bharathi Dock handles containers, iron ore and petroleum oil. Jawahar dock handles food grains, coal, fertilizer and dolomite. The port has a 7 km entrance channel with 24 berths for cargo handling distributed along three docks. It has six transit sheds and four warehouses with a total covered space of 43,194 m2. There are 52 tanks for oil storage with a capacity of 166,469 kL which are connected through pipes from the oil jetty. Tank farms are located at various locations, both within and outside of the customs boundary areas. The container terminal 1 has 300 reefer (refrigerated vessels) points and container terminal 2 has 120 reefer points for cold storage. The Chennai port has minimal land area availability when com-pared to India’s other major ports, while the cargo handling capacity is much greater. The port has one of India’s longest container handling quays with length of 1,717 m plus an 885 m long quay at Bharathi Dock. The port has five tug boats for manoeuvring merchant vessels, four mooring launches and two dredgers to maintain the depth of the quay. The photographic views of container ship, dredger, mooring launch

12 Strategic Planning for Energy and the Environment
and tug boat are shown in Figures 1 (a), (b), (c) and (d) respectively. Cargo is moved to the marshalling yard for transportation to various locations using diesel locomotives. Railway locomotives (700 HP and 1,400 HP Locos), though mainly diesel driven, are a hybrid variety that allow the transmission of power to the locomotives using an alterna-tor. The equipment used for material handling includes fork lifts, rail mounted gantry cranes, shore-to-ship cranes, transfer cranes and front end loaders for loading bulk cargo. Electric cranes on the quays are used for handling dry bulk cargo and dredging along berths to salvage any cargo that has slipped or spilled along the berth while handling. Rail mounted gantry cranes are electrically driven unlike the transfer cranes which are diesel. Forklift trucks, pay loaders, excavators, locomotives, generators, and mobile cranes are all diesel driven. The container termi-nals use electric forklift trucks, which are battery powered except for the hydraulic operation of cylinders.
Figure 1. Images of marine vessels at Port of Chennai.

13Summer 2017, Vol. 37, No. 1
The port authorities control activities from vessel berthing to the transportation of cargo from the port. They also employ private compa-nies including Chennai Container Terminal Private Limited (CCTL) and Chennai International Terminals Private Limited (CITPL) for container handling on a build, operate and transfer (BOT) basis. The port is pow-ered by the electricity received from the Tamil Nadu electricity board. Diesel fuel is used by trucks, generators, rail locomotives and cranes. The fishing harbour has a handling capacity of 2,000 tonnes of fish an-nually, of which nearly 200 tonnes are exported. Port of Chennai acts as the largest car terminal in India and has a container terminal with a capacity of 1.6 million twenty foot equivalent units (TEU) per annum. The port has facilities to handle petroleum, oil and lubricants (POL), fertilizers, containers, iron ore, food grains and other types of project cargos. The port primarily handles containerized cargo and petroleum that together account for 90% of the total cargo.
ENERGY CONSUMING PORT ACTIVITIES AND CO2e EMISSIONS
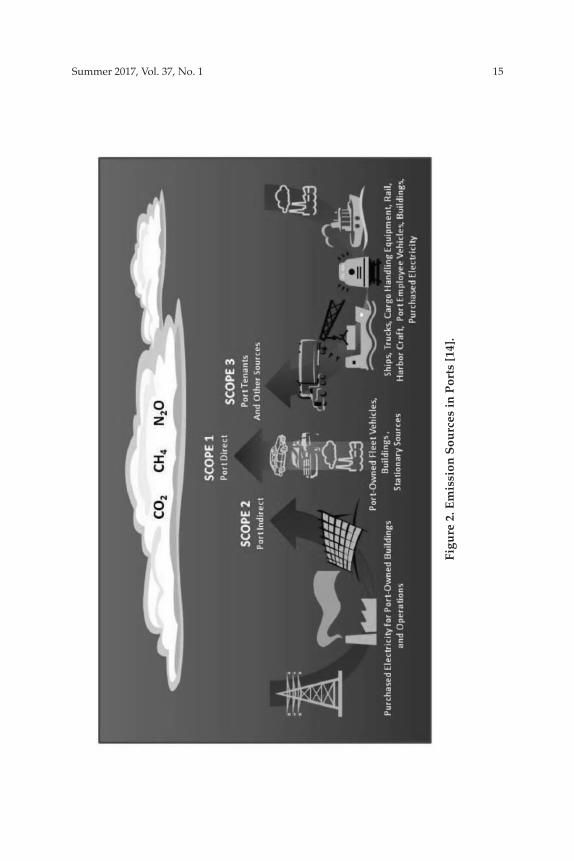
The carbon footprint of the port of Chennai was estimated for the year 2014-15 by applying ISO Standard 14064-1 [13] and WPCI guide-lines [14]. These guidelines provide methodologies to evaluate carbon footprints. The direct emissions (scope 1), indirect emissions (scope 2) and the other indirect emissions by port tenants and users (scope 3) have been considered in the assessment. Other indirect emissions accounted in scope 3 include emissions from the fishing harbour and housing colony, which are managed by the port of Chennai. The scope 1 emissions include diesel fuel usage by transporta-tion, the operation of port owned fleet vehicles (tugs, dredgers, pilot and mooring launches), electricity generation by diesel generators and material handling equipment such as cranes and fork lift trucks. The emissions are estimated using Equation 1 and based on port activities per the guidelines of WPCI [14]. The emission factor (EF) for diesel fuel consumption used is 2.68 kg of CO2e/litre.
Emissions = Σ i=1
nDiesel consumption i x EF (1)
In Equation, 1‘n’ is the number of diesel consuming equipment.The scope 2 emissions are evaluated based on the purchased electric-

14 Strategic Planning for Energy and the Environment
ity for the operation of port owned equipment such as cranes, pumps, reefer containers, machineries in workshop and for building air con-ditioning, lighting and other uses. Based on the sources of electricity generation in Tamil Nadu, the generation quantities and the emission factor for end user consumption, the import/export of electricity and aggregate technical and commercial (AT&C) losses can be estimated us-ing 1.33 kg CO2e/kWh. The scope 2 emissions estimation uses an activ-ity based approach and is given by Equation 2.
Emissions = Electrical Energy Consumption x EF (2)
Scope 3 includes several large categories of emissions that con-tribute to the greatest portion of emission inventory. These categories include the electricity and diesel consumption for privately operated cranes and other wharf equipment, diesel fuel used in fishing harbour, and electricity consumption in ice factories. The emissions due to mer-chant vessel operations inside the port, truck movements for intermodal transportation of cargo, the use of liquefied petroleum gas (LPG), plus power and petrol use in the port’s housing colony also contribute to scope 3 emissions. The GHG emissions due to various port activities are depicted in the Figure 2. Merchant vessel auxiliary engines are operated in the port to provide electricity to the ships and to power the ship cranes for mate-rial handling, contributing to emissions. Most of these ships have one or more boilers that are used for fuel heating and producing hot water or steam. A hybrid approach is used to estimate GHG emissions from merchant vessels, based on WPCI guidelines [14]. In this inventory, the emissions from sea transit are not considered. Only the emissions from manoeuvring and berth hoteling within the boundary of the port of Chennai are considered. Anchorage hoteling is not considered as few merchant vessels are subjected to anchorage hoteling in the port of Chennai. During the manoeuvring phase, the emissions from main ves-sel engine are estimated based on Equation 3.
Emissions = MCR x LF x operating duration i x EFΣi−1
n (3)
In Equation 3, n denotes the number of merchant vessels, MCR is the engine’s maximum continuous rated power in kW, and LF is the Load Factor. The load factor is estimated using Equation 4.
15Summer 2017, Vol. 37, No. 1
Figu
re 2
. Em
issi
on S
ourc
es in
Por
ts [1
4].
16 Strategic Planning for Energy and the Environment
LF = (Maneuvring speed/Ship’s maximum speed)3 (4)
The main vessel MCR and maximum rated speed are obtained based on world fleet averages, per WPCI guidelines [14]. The ma-noeuvring speed of merchant vessels within the boundary of the port of Chennai is four knots. The operating time or manoeuvring time is taken as the sum of pre-birth time and outward navigation time. These data were provided by the Chennai port authorities. It is assumed that the average year of manufacture of the merchant ships that visited the port of Chennai in the financial year 2014-15 is 2000 or newer and use medium speed direct drive propulsion. Merchant vessels are assumed to operate their main engines on residual oil (RO), an intermediate fuel oil (IFO 380), or one with similar specifications and an average sulphur content of 2.7%. The assumed GHG emission factor is 0.69 kg CO2e/kWh, based on the IVL, the 2004 Swedish Environmental Research In-stitute study [15]. The emissions from vessel auxiliary engine and boiler during the manoeuvring phase are estimated using Equation 5. The de-tails of auxiliary engine and boiler capacity are obtained from the POLA (Port of Los Angeles) inventory of air emissions [16].
Emissions = AS x Act x EF iΣi=1
n (5)
In Equation 5, ‘i’ corresponds to an operating auxiliary engine or boiler, AS is the auxiliary system (engine or boiler capacity) in kW, ‘n’ denotes the number of auxiliary systems in operation, and Act is the operating/manoeuvring time (hours). The manoeuvring time is the same as that used to estimate GHG emissions from the main engine during manoeuvring. The emission factor for the auxiliary engine (692.8 g CO2e/kWh) and boiler (994.8 g CO2e/kWh) are based on IVL 2004 [15] and the Euro NATO Training En-gineer Center (ENTEC) emission factor for steam boilers respectively [17]. During the hoteling phase, the main engine is turned off and only the auxiliary engines and boilers are used. The GHG emissions during the hoteling phase are estimated based on Equation 6, with the operating time signifying the time at berth. The berth time for all merchant vessels visiting the port of Chennai was provided by the port authority and was used to obtain the GHG emissions. Emissions from on-road vehicles in-clude emissions mostly from trucks. Since the details regarding the fuel consumption of non-port owned trucks used for transporting cargo are

17Summer 2017, Vol. 37, No. 1
not available, a surrogate is used to estimate GHG emissions (shown in Equation 6). Per WPCI guidelines for heavy duty vehicles such as trucks, an emission factor of 4.6 kg CO2e/h is estimated for idling periods while 1.0 kgCO2e/km is used for on-terminal running activities [14].
Emissions = Act i x EFΣi=1
N (6)
In Equation 6, ‘N’ is the number of vehicles, ‘i’ is the counter for vehicles and EF is the emission factor (either kgCO2e/h or kgCO2e/km). Other scope 3 emissions from sources such as vehicles used for employee transportation and LPG consumption in the housing colony are calcu-lated based on the activity, given by Equation 1 with the emission fac-tors for the various fuels consumed obtained from WPCI [14].
RESULTS AND DISCUSSION
The emission reduction approaches for the individual ports var-ies based on a variety of governance and operational models. We next evaluate the electricity and fuel consumption by various port activities and estimate their annual GHG emissions using various WPCI [14] and IPCC guidelines [1]. The ways to reduce these emissions using novel methodologies are also discussed.
Emissions from Port Owned Diesel ConsumingVehicles and Equipment Scope 1 emissions were entirely based on the use of diesel fuel in port activities such as transportation, manoeuvring, dredging and generation of electricity. A large quantity of diesel is consumed by the operation of tug boats that berth merchant vessels and by dredging boats that deepen the quay. Mooring launches are used for mooring ships. Pilot launches transport the pilots to merchant vessels so they can navigate them to the berths and manoeuvre them safely in and out of the port. Nearly a quarter of the total volume of the cargo is handled with port owned diesel locomotives. Diesel consumption and emissions by port owned vehicles and equipment are summarized in Table 1. Tug boats accounted for 62% of the total diesel consumption for driving their heavier propulsion engines, followed by diesel locomotives and dredgers, each accounting for roughly 10% of total diesel consumption.

18 Strategic Planning for Energy and the Environment
Table 1. Diesel consumption and emissions by port vehicles and equipment.
Emissions from Port Owned Electricity Consumption The scope 2 emissions were comprised entirely of the emissions from the electricity purchased from the Tamil Nadu Electricity Board for all port owned operations. Electricity is used in lighting and air conditioning for buildings and for powering the cargo handling equip-ment. The connected load of motors that are used by electric cranes and by water and oil distribution pumps account for 37% and 36% of the total power distribution respectively. The lighting and air conditioning systems accounted for the greatest portion of the remaining electricity consumption. The total electricity consumption of the Port of Chennai under scope 2 was 5,654,053 kWh and the annual CO2e was estimated to be 6,389 tonnes.
Emissions from Port Tenants and Users The emissions from private operators of port and port users are categorized under scope 3 (indirect). Any emissions not accredited to scope 1 and scope 2 emissions are included in scope 3. These carbon emissions include those from all remaining sources (e.g., merchant ves-sels, diesel usage in the fishing harbour, LPG usage in housing colony, and electricity consumption by tenants). These activities have minimal potential for emission reduction, since they are not under the opera-
19Summer 2017, Vol. 37, No. 1
tional control of the port. However, enforcing mandatory rules on the tenants may reduce the CO2e emissions.
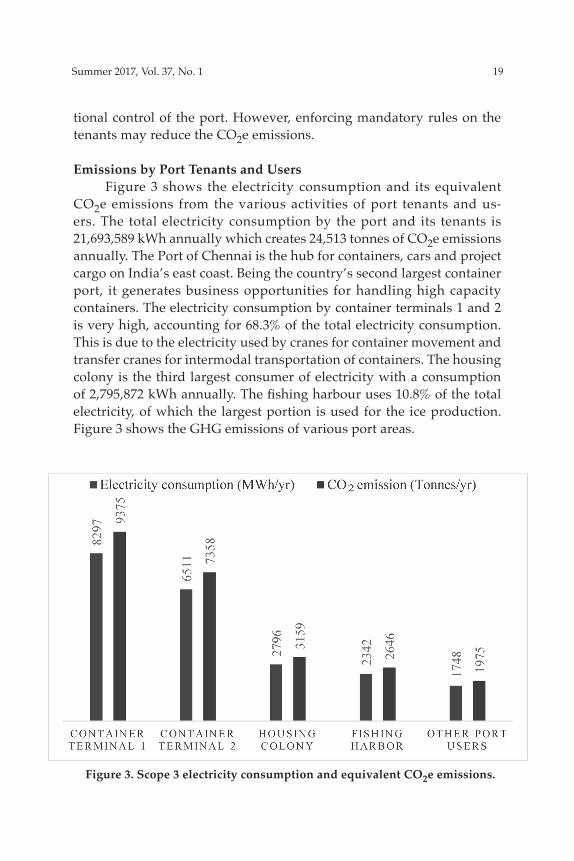
Emissions by Port Tenants and Users Figure 3 shows the electricity consumption and its equivalent CO2e emissions from the various activities of port tenants and us-ers. The total electricity consumption by the port and its tenants is 21,693,589 kWh annually which creates 24,513 tonnes of CO2e emissions annually. The Port of Chennai is the hub for containers, cars and project cargo on India’s east coast. Being the country’s second largest container port, it generates business opportunities for handling high capacity containers. The electricity consumption by container terminals 1 and 2 is very high, accounting for 68.3% of the total electricity consumption. This is due to the electricity used by cranes for container movement and transfer cranes for intermodal transportation of containers. The housing colony is the third largest consumer of electricity with a consumption of 2,795,872 kWh annually. The fishing harbour uses 10.8% of the total electricity, of which the largest portion is used for the ice production. Figure 3 shows the GHG emissions of various port areas.
Figure 3. Scope 3 electricity consumption and equivalent CO2e emissions.

20 Strategic Planning for Energy and the Environment
Diesel fuel is the major source of power for merchant vessels dur-ing their manoeuvring and hoteling phases and also powers the fishing boats and trucks used for intermodal transportation of cargo in the port. Diesel operated cranes in container terminals 1 and 2 also contribute to the total emissions. The details of the GHG emissions from the usage of diesel in merchant vessels and trucks are described below.
Emissions from Merchant Vessels The Port of Chennai handles all types of cargos ranging from liquid bulk, dry bulk and break bulk (dry bulk carriers), with contain-ers being the major business provider. Nearly 2,000 vessels call at the Port of Chennai, of which approximately 40% are container ships. The emissions from merchant vessel engines during the manoeuvring and hoteling periods are a major contributor to emissions. High capacity marine auxiliary engines and boilers are operated in the port to provide electricity to the ships for lighting, air conditioning, other on-board activities, and powering the ship cranes for material handling. Hence a large amount of fuel is consumed by the vessels which are docked at the port for various purposes. GHG emissions by various types of merchant vessels during the manoeuvring and hoteling periods while calling at the Port of Chennai are detailed in Table 2.
Table 2.GHG emissions by merchant vessels while manoeuvring and hoteling.
Figure 4 shows that the tankers contribute 56% of total emissions followed by container ships (16%).

21Summer 2017, Vol. 37, No. 1
Figure 5 shows the percentage of emissions during manoeuvring and hoteling periods by the auxiliary engines and boilers. A total of 85.7% of the GHG emissions from merchant vessels occur during hotel-ing while emissions resulting from manoeuvring are just 14.3% of the total. The tankers generate maximum emissions during their hoteling phase as their boilers are of very high capacity in comparison with the boilers in the other vessels.
Figure 4. Percentage of GHG emissions by types of merchant vessels.
Figure 5. Percentage of merchant vessel GHG emissions during manoeuvring and hoteling.

22 Strategic Planning for Energy and the Environment
Emissions from Trucks Heavy vehicles (e.g., trucks, lorries, tankers, tippers and trailers) are used inside the port for the intermodal transportation of cargo. These vehicles move to various locations in the port depending on the type of cargo they are handling. The port has three gates (Gates 0, 2 and 10, referred to as A, B and C respectively) for the movement of vehicles to facilitate the import and export of goods. Details concerning the num-ber of vehicles entering and leaving the port and their average distance travelled were obtained from the port authorities. The average idle time per trip was estimated to be 30 minutes and the GHG emissions were estimated based on WPCI 2010 guidelines. The details of the estimated GHG emissions from the trucks during both idling periods and during on-terminal activities are provided in Table 3. The total CO2e emissions from trucks used to transport cargo was estimated as 6,343 tonnes annu-ally, of which nearly one-third of the emissions were from vehicle idling.
Table 3. GHG emissions by the trucks operating inside the port.
Emissions from the Fishing Harbour and Others The Port of Chennai fishing harbour is the second highest con-sumer of diesel, consuming nearly 26,145 kL/year. The fishing harbour hosts 900 mechanised boats and roughly 1,200 fishing boats. Apart from the supplies to the domestic market, it also exports 2,000 tonnes of fish annually, contributing appreciably to emissions from diesel usage. The container terminals 1 and 2 are the other major diesel consumers, con-suming 1,600 kL/year and 2,150 kL/year, respectively. Other port users consume about 7.5 kL/year.
Emissions from Use of Petrol and LPG A survey was conducted in the housing colony to estimate the GHG emissions from fuel consumption for transporting employees, the

23Summer 2017, Vol. 37, No. 1
consumption of LPG for residential cooking, the port canteen and the Central Industrial Security Force (CISF) barracks. The housing colony consists of 1,336 residences. In a sample of 10% of these, a question-naire was used to survey LPG and petrol consumption. For the annual consumption of 7,603 litres of petrol for employee transportation, it is estimated that 17.3 tonnes of CO2e annually is released into the atmo-sphere. LPG is the only source of fuel for cooking in the Port of Chennai. The various areas of LPG usage include the CISF barracks, port canteen and the housing colony. Total LPG consumption is 214 tonnes, account-ing for 638 tonnes of CO2e emissions annually with nearly 70% of the total generated by the housing colony.
Summary of Scope 3 Emissions The percentage of GHG emissions based on scope 3 sources are provided in Table 4. Diesel usage by the port tenants contributes 90.6% while electricity consumption contributes 9.2%. Other scope 3 emissions such as petrol usage in the housing colony and LPG consumption were insignificant when compared to other emission sources.
Table 4. Total scope 3 GHG emissions.
CARBON FOOTPRINT IN THE PORT OF CHENNAI
The emission scenario of the Port of Chennai is provided in Figure 6. Scope 1 and 2 emission categories represent less than 5% of the port’s overall emissions, while scope 3 emissions associated with tenants ac-

24 Strategic Planning for Energy and the Environment
count for the majority of the port-wide emissions. GHG emission reduc-tions from all port-related sources are necessary to minimize the impact of port-related operations on climate change. Though scope 1 and 2 emissions are of lower magnitudes, they are easier for the port to control and therefore a good place to begin.
Figure 6. GHG emissions scenario of the Port of Chennai.
CONCLUSION
The carbon footprint of the Port of Chennai was estimated for the financial year 2014-15 using ISO Standard 14064-1. In conformance with the standard, the scope 1 (direct) emissions from diesel usage, scope 2 (indirect) emissions due to electricity consumption and scope 3 (indi-rect) emissions caused by the energy used by port tenants, the fishing harbour and the occupants from the housing colony were considered. The GHG emissions from the Port of Chennai total 280,558 tonnes of CO2e annually and the scope 3 emissions account for 95.3% of the total. Scope 1 and scope 2 emissions together accounted for 4.7% of total emis-sions. The detailed information made available in this article will be useful in implementing future energy conservation measures, renew-able energy technologies, and integrating them with smart grids. The

25Summer 2017, Vol. 37, No. 1
implementation of GHG mitigation strategies for all port-related activi-ties will achieve significant GHG reductions, thus reducing the adverse impacts of global climate change. The information will also be useful for policy makers in enforcing mandatory measures and adopting com-mercially available energy and environmentally friendly technologies.
Acknowledgement The authors acknowledge the administration and the technical staffs of the Port of Chennai for their financial support and assistance rendered during the data collection.
References [1] Intergovernmental Panel on Climate Change (2006). Guidelines for national
greenhouse gas inventories. [2] Bailey, D. and Solomon, G. (2004). Pollution prevention at ports: Clearing the air,
Environmental Impact Assessment Review 24, 749-774. [3] Peris-Mora, E., Orejas, J., Subirats, A., Ibáñez, S. and Alvareza P. (2005). Develop-
ment of a system of indicators for sustainable port management. Marine Pollu-tion Bulletin 50, 1649-1660.
[4] Schrooten, L., Vlieger, I. Panis, L., Styns, K. and Torfs, R. (2008). Inventory and forecasting of maritime emissions in the Belgian sea territory, an activity-based emission model. Atmospheric Environment 42, 667-676.
[5] Wang, C., Corbett, J., and Firestone, J. (2008). Improving spatial representation of global ship emissions inventories. Environmental Science and Technology 42, 193-199.
[6] Meyer, P., Maes, F., and Volckaer, A. (2008). Emissions from international ship-ping in the Belgian part of the North Sea and the Belgian seaports. Atmospheric Environment 42, 196–206.
[7] Han, C. (2010). Strategies to reduce air pollution in the shipping industry. The Asian Journal of Shipping and Logistics 26, 07-030.
[8] Villalba, G. and Gemechu, E. (2011). Estimating GHG emissions of marine ports - the case of Barcelona. Energy Policy 39, 1363–1368.
[9] Fitzgerald, W., Howitt, O., and Smith, I. (2011). Greenhouse gas emissions from the international maritime transport of New Zealand’s imports and export. En-ergy Policy 39, 1521–1531.
[10] Liao, C., Tseng, P., Cullinane, K. and Lu, C. (2010). The impact of an emerging port on the carbon dioxide emissions of inland container transport: An empirical study of Taipei port. Energy Policy 38, 5251–5257.
[11] Gibbs, D., Muller, P., Mangan, J. and Lalwani, C. (2014). The role of sea ports in end-to-end maritime transport chain emissions. Energy Policy 64, 337–348.
[12] Chang, Y., Song, Y. and Roh, Y. (2013). Assessing greenhouse gas emissions from port vessel operations at the Port of Incheon. Transportation Research Part D. Transport and Environment 25 1-4.
[13] Greenhouse gas protocol, www.ghgprotocol.org/standards. [14] World Ports Climate Initiative (2010), Carbon footprinting for ports, Guidance
document. [15] IVL (2004). Methodology for calculating emissions from ships: update on emis-

26 Strategic Planning for Energy and the Environment
sion factors. Prepared by IVL Swedish Environmental Research Institute for the Swedish Environmental Protection Agency.
[16] Port of Los Angeles (2012). Inventory of air emissions. [17] ENTEC (2002). http://ec.europa.eu/environment/air/pdf/task2_general.pdf.
————————————————————————————————ABOUT THE AUTHORS Atulya Misra is the principal secretary and commissioner of revenue administration, for the government of Tamil Nadu, India. He recently completed his five years of services as the chairman, Port of Chennai, India. He holds a Master’s degree in Science, certificates in (i) public private partnership from Institute of Development Studies, Sussex, UK, (ii) Marijuana policy project from Texas, USA & TERI Uni-versity, New Delhi and (iii) ‘Ship for World Youth’ from United Nations University, Tokyo. His email address is: [email protected].
Karthik Panchabikesan received his Master of Technology in energy conservation & management with university first rank in 2012 from Anna University. He is pursuing a Ph.D. at the Institute for Energy Studies, Anna University, Chennai under DST—INSPIRE fellowship. His email address is: [email protected].
Dr. Ayyasamy Elayaperumal is a professor in mechanical engi-neering, Anna University Chennai. He is a subject expert in the field of composite materials, nano science and engineering, surface engineering and design of machine elements. He received “Giri Metrology Endow-ment Appreciation” award for the year 2007-08 for guiding the best project in mechanical engineering at Anna University Chennai. He has several publications in reputed international journals. His email ad-dress is: [email protected].
Dr. Ramalingam Velraj is the director for the Institute for Energy Studies, Anna University, Chennai with specialization in energy engi-neering, energy storage, heat transfer, renewable energy and energy efficient buildings. He has more than 125 publications in reputed inter-national journals. He received “Active Consultant Award” in the year 2014 and “Best Innovation Award” in the year 2013 by Anna University. He is also involved in the consultancy works in energy applications and performance evaluation of thermal systems. He is the corresponding author of this article. His email address is: [email protected].