Sustain Program Asset Management Strategy. Power System Contr… · Sustain Program Asset...
40
B O N N E V I L L E P O W E R A D M I N I S T R A T I O N Power System Control (PSC) and Telecommunications Sustain Program Asset Management Strategy Laura Demory, Program Manager March 2012
Transcript of Sustain Program Asset Management Strategy. Power System Contr… · Sustain Program Asset...

B O N N E V I L L E P O W E R A D M I N I S T R A T I O N
Power System Control (PSC) and Telecommunications
Sustain Program
Asset Management Strategy
Laura Demory, Program Manager
March 2012

B O N N E V I L L E P O W E R A D M I N I S T R A T I O N
PSC & Telecommunications Asset Strategy 2
Executive Summary
Equipment Covered
• VHF • Telecom Transport • Telecom Support Equipment • SCADA/Telemetry/Supervisory Control • Field Information Network (FIN)/Operational Networks • Telephone Systems • System Telecommunications/Fiber Optic Cable
Key Drivers • Multiple generations of equipment on the BPA system and resulting technology
interoperability and obsolescence issues • Equipment condition and lack of manufacturer support • Rapid evolution of technologies in the market place • Evolving power system operations/needs • Evolving regulatory requirements • Constraints on outage and resource availability
B O N N E V I L L E P O W E R A D M I N I S T R A T I O N
PSC & Telecommunications Asset Strategy 3
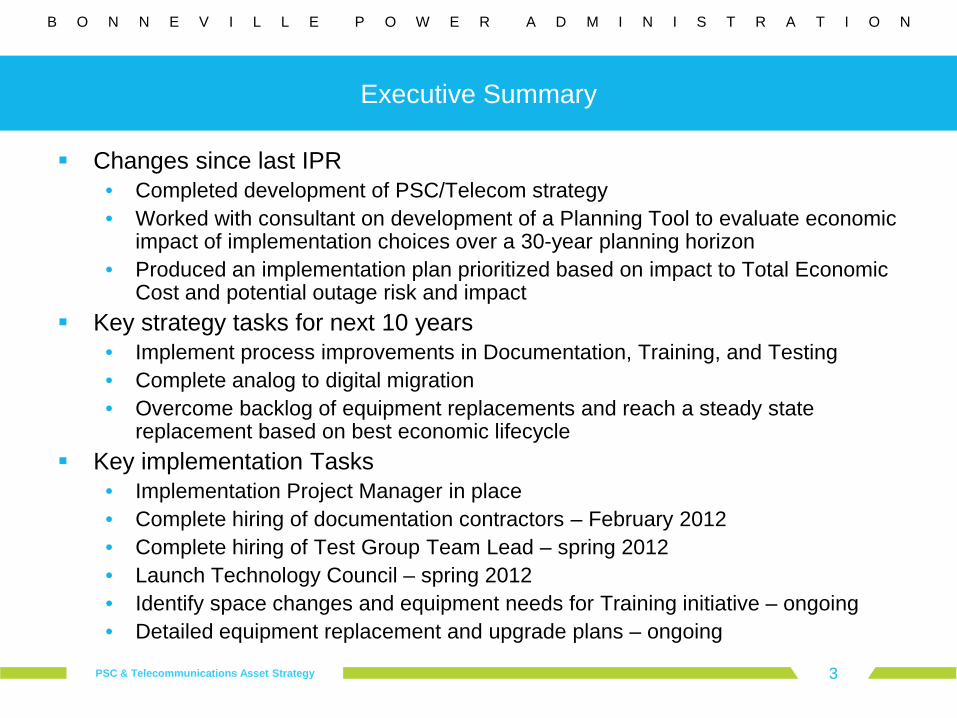
Executive Summary
Changes since last IPR • Completed development of PSC/Telecom strategy • Worked with consultant on development of a Planning Tool to evaluate economic
impact of implementation choices over a 30-year planning horizon • Produced an implementation plan prioritized based on impact to Total Economic
Cost and potential outage risk and impact Key strategy tasks for next 10 years
• Implement process improvements in Documentation, Training, and Testing • Complete analog to digital migration • Overcome backlog of equipment replacements and reach a steady state
replacement based on best economic lifecycle Key implementation Tasks
• Implementation Project Manager in place • Complete hiring of documentation contractors – February 2012 • Complete hiring of Test Group Team Lead – spring 2012 • Launch Technology Council – spring 2012 • Identify space changes and equipment needs for Training initiative – ongoing • Detailed equipment replacement and upgrade plans – ongoing

B O N N E V I L L E P O W E R A D M I N I S T R A T I O N
PSC & Telecommunications Asset Strategy 4
Budget Forecasts
Thousand's $ SOYFY2012 FY2013 FY2014 FY2015 FY2016 FY2017 FY2018 FY2019 FY2020 FY2021
Capital Cost Forecast
System ReplacementsVHF 0 0 0 0 0 0 TRANSPORT 1,295 1,179 1,143 1,140 1,140 1,045 1,181 1,195 1,209 1,208SUPPORT EQ 2,791 1,469 2,368 4,132 4,529 5,367 5,989 6,596 7,378 8,094SCADA 1,690 1,208 1,520 2,090 2,931 3,824 4,630 4,741 4,878 5,060NETWORKS 0 95 233 356 285 285 700 700 700 700TRANSFER TRIP 9,655 9,818 11,875 13,346 12,991 13,212 13,123 12,026 10,118 8,872TELEPHONES 930 306 475 333 736 2,375 2,259 1,256 1,778 2,209 Subtotal Replacements 16,361 14,076 17,614 21,397 22,612 26,107 27,882 26,514 26,061 26,143
Upgrades & AdditionsSystem Telecom 27,590 51,400 50,000 39,675 32,325 33,895 33,825 33,826 33,725 33,484
Total Direct Capital for Strategy 43,952 65,476 67,614 61,072 54,937 60,002 61,707 60,341 59,786 59,626
Maintenance Expense ForecastForecast for Status Quo 12,472 12,986 13,500 14,014 14,528 15,042 15,556 16,070 16,584 17,098With full strategy implementation 15,812 13,288 13,272 13,244 12,458 12,087 11,881 11,643 11,010 10,869
OMB
Note: Expense forecasts prior to completion of the Asset Strategy project yearly increasing budget needs. As the strategy is implemented, early years require startup costs for process improvement initiatives then maintenance requirements decrease as old equipment is retired, and process improvements begin to provide labor savings that is reflected in out-year expense budget projections.

B O N N E V I L L E P O W E R A D M I N I S T R A T I O N
PSC & Telecommunications Asset Strategy 5
What equipment is covered?
What is the health of the assets, and what risks must be managed?
What analytical approach was used?
What is the strategy?
What costs and resources will be needed?
Program Accomplishments FY10 – FY11

B O N N E V I L L E P O W E R A D M I N I S T R A T I O N
PSC & Telecommunications Asset Strategy 6
PSC Equipment Covered
Power system control and telecommunications equipment at a total of 732 sites, including 111 radio sites, 482 BPA and customer-owned substations, and 139 other sites such as power houses, maintenance buildings, and control centers. For capital accounting purposes, equipment is grouped into seven, level-5 nodes: VHF - this equipment includes all VHF fixed repeaters and controller units, mobile radios, and portable handheld radio
units.
Telecom Transport - this equipment includes analog and digital microwave radio, analog and digital multiplex, fiber optic terminal equipment and UHF radios. The combination of these systems creates an extensive, system-wide communications network, with over 10,000 telecom circuits (primarily data and control circuits)
Telecom Support Equipment - this equipment includes alarm systems, batteries/chargers, DC-DC converters, engine generators, UPS systems, timing systems, fault locators, miscellaneous support systems, and towers and grounds
SCADA/Telemetry/Supervisory Control – this equipment includes Supervisory Control And Data Acquisition Remote Terminal Units (RTUs), supervisory control systems, and telemetering systems
Field Information Network (FIN)/Operational Networks – data networks for data transfer. This equipment includes FIN network equipment, operational network equipment, network management system equipment, and modems
Transfer trip – this equipment includes protection units and Remedial Action Scheme (RAS) communication units
Telephone Systems - BPA maintains an extensive internal Dial Automatic Telephone System (DATS) for daily operation and maintenance activities. This equipment includes DATS switches and supporting systems, key system and telephone equipment, teleprotection systems
Fiber Optic Cable – this category includes approximately 3,000 miles of fiber optic cable
(# units of equipment shown in parenthesis)
B O N N E V I L L E P O W E R A D M I N I S T R A T I O N
PSC & Telecommunications Asset Strategy 7
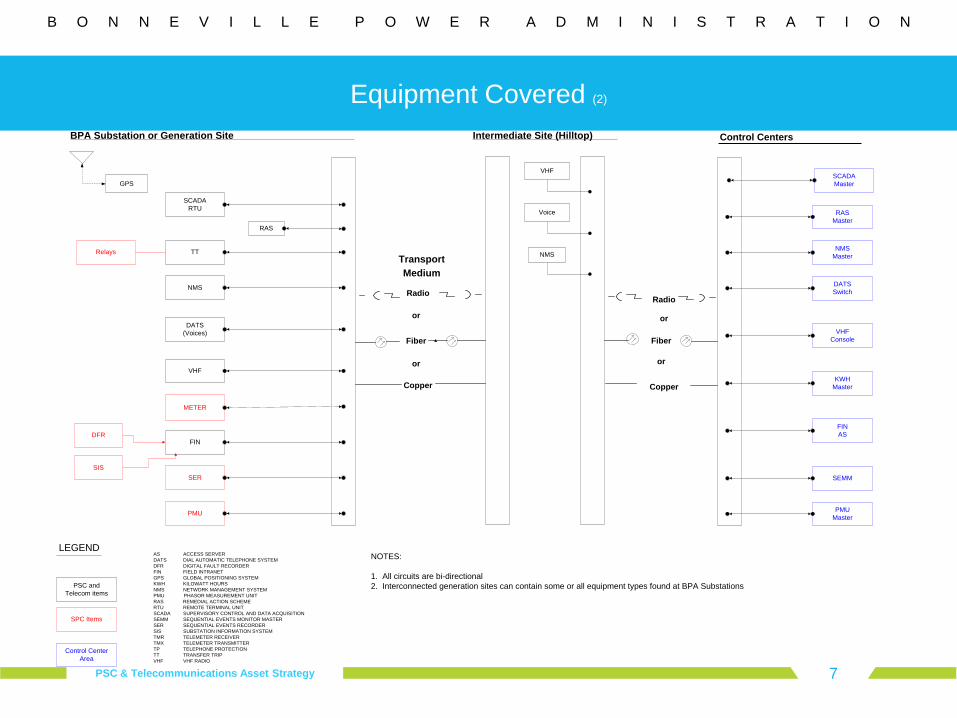
Equipment Covered (2)
GPS
BPA Substation or Generation Site
SCADARTU
TT
NMS
DATS(Voices)
VHF
METER
FIN
SER
RAS
Intermediate Site (Hilltop)
PMU
Relays
PSC and Telecom items
DFR
SIS
SPC Items
Control Center Area
SCADAMaster
RASMaster
NMSMaster
SEMM
FINAS
KWHMaster
PMU Master
DATSSwitch
VHF ConsoleFiber
Radio
Transport Medium
or
or
Copper
VHF
Voice
Copper
NMS
or
Fiber
Radio
or
LEGENDNOTES:
1. All circuits are bi-directional 2. Interconnected generation sites can contain some or all equipment types found at BPA Substations
AS ACCESS SERVERDATS DIAL AUTOMATIC TELEPHONE SYSTEMDFR DIGITAL FAULT RECORDER FIN FIELD INTRANETGPS GLOBAL POSITIONING SYSTEMKWH KILOWATT HOURS NMS NETWORK MANAGEMENT SYSTEMPMU PHASOR MEASUREMENT UNITRAS REMEDIAL ACTION SCHEMERTU REMOTE TERMINAL UNITSCADA SUPERVISORY CONTROL AND DATA ACQUISITIONSEMM SEQUENTIAL EVENTS MONITOR MASTERSER SEQUENTIAL EVENTS RECORDERSIS SUBSTATION INFORMATION SYSTEMTMR TELEMETER RECEIVERTMX TELEMETER TRANSMITTERTP TELEPHONE PROTECTIONTT TRANSFER TRIPVHF VHF RADIO
Control Centers
B O N N E V I L L E P O W E R A D M I N I S T R A T I O N
PSC & Telecommunications Asset Strategy 8
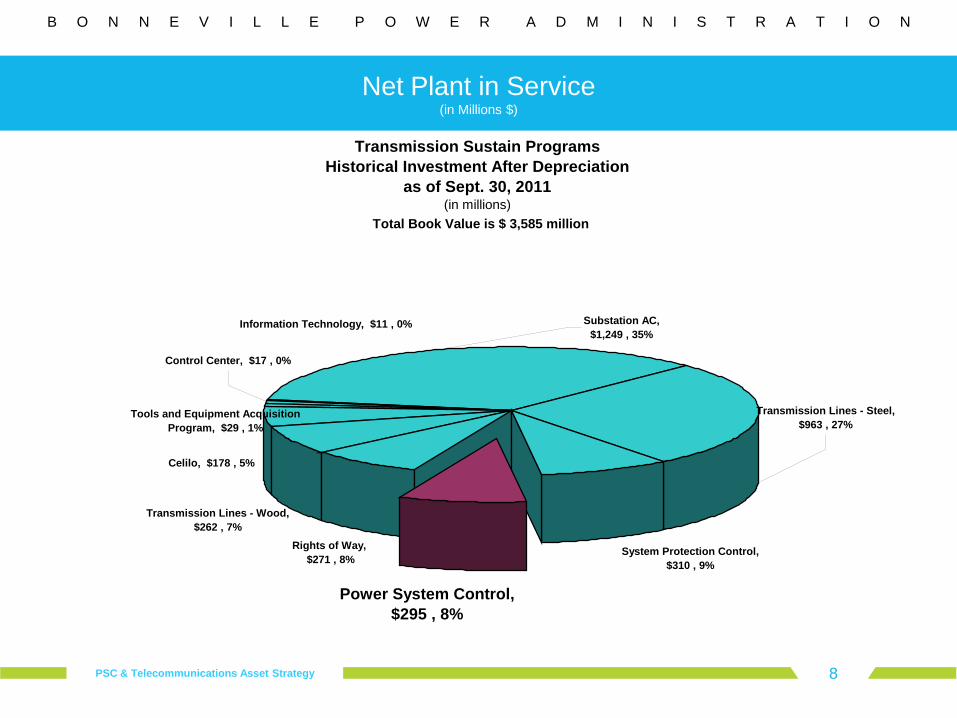
Net Plant in Service (in Millions $)
Substation AC, $1,249 , 35%
Transmission Lines - Steel, $963 , 27%
System Protection Control, $310 , 9%
Power System Control, $295 , 8%
Rights of Way, $271 , 8%
Transmission Lines - Wood, $262 , 7%
Celilo, $178 , 5%
Information Technology, $11 , 0%
Control Center, $17 , 0%
Tools and Equipment Acquisition Program, $29 , 1%
Transmission Sustain ProgramsHistorical Investment After Depreciation
as of Sept. 30, 2011(in millions)
Total Book Value is $ 3,585 million
B O N N E V I L L E P O W E R A D M I N I S T R A T I O N
PSC & Telecommunications Asset Strategy 9
What equipment is covered?
What is the health of the assets, and what risks must be managed?
What analytical approach was used?
What is the strategy?
What costs and resources will be needed?
Program Accomplishments FY10 – FY11

B O N N E V I L L E P O W E R A D M I N I S T R A T I O N
PSC & Telecommunications Asset Strategy 10
PSC Equipment Count & Demographics
Since 1995, PSC/Telecom equipment count has gone from approximately 9,600 to 12,500, an increase of almost 30% in a 15-year period. Much of this equipment has not been replaced, and around 45% of installed equipment is beyond its average expected life. Large backlogs of replacements need to be addressed.
Equipment Growth
0
2,000
4,000
6,000
8,000
10,000
12,000
14,000
1996
1997
1998
1999
2000
2001
2002
2003
2004
2005
2006
2007
2008
2009
2010
Existing Additions
Number of Units by Installation Year
0
200
400
600
800
1000
1200
> 19
80
1982
1984
1986
1988
1990
1992
1994
1996
1998
2000
2002
2004
2006
2008
2010
Year Installed
Num
ber o
f Ins
talle
d U
nits
15yrs

B O N N E V I L L E P O W E R A D M I N I S T R A T I O N
PSC & Telecommunications Asset Strategy 11
Lifecycle Assumptions by Equipment Type
Lifecycle for PSC equipment is typically 8 to 25 years depending on the equipment type
Majority of equipment falls in the 10 to 15 year range, and then should be replaced
About 45% of our existing PSC equipment is beyond its expected service life
The lifecycles at right were used in this strategy
EQUIPMENT TYPE Lifecycle
(Yrs) Number of Units
Average Age
SCADA 13 212 15
Transfer Trip 12 846 14
RAS 14 666 15
Fiber Cable 25 3000 miles
Mobile 15 1480 13
VHF Repeater 12 65 19
7 Year Lifecycle (Comm Alarm Systems, VRLA Batteries) 9 715 9
20 Yr Batteries (Flooded Cell Batteries) 22 248 11
DC Power 15 (Chargers, DC-DC Converters) 18 546 13
Misc 10 Year (Fiber Patch Panels; Fiber Drivers, etc.) 12 422 10
UHF Radios 11 109 11
Telemetering 18 578 12
Telephone (Key Systems, etc.) 12 720 17
Engine Generators 22 80 20
SONET Other (Fiber nodes) 12 261 8
DATS 12 14 7
SONET Ancillary (digital multiplex, digital microwave) 10 635 7

B O N N E V I L L E P O W E R A D M I N I S T R A T I O N
PSC & Telecommunications Asset Strategy 12
The number of corrective actions has increased dramatically over the last eight years
Equipment failures are tracked via the number of corrective work orders that have been created for unplanned work
System operations and economic impacts can be large if certain types of equipment -- such as Transfer Trip, SCADA, SONET, and RAS equipment -- fail
A growing share of corrective work orders are to mitigate technological obsolescence and interoperability problems
Corrective work orders to correct failures
All Corrective Work Orders - Repairs and Planned Corrective Actions
0
100
200
300
400
500
600
700
800
900
1000
1100
1200
1300
1400
1500
1600
2003 2004 2005 2006 2007 2008 2009 2010 2011
7 yr 15 yr 20 yr Analog DATS DC Systems SCADA Sonet Transfer Trip VHF System Total all planned/unplanned
Corrective work orders primarily for technological obsolescence and interoperability problems
B O N N E V I L L E P O W E R A D M I N I S T R A T I O N
PSC & Telecommunications Asset Strategy 13
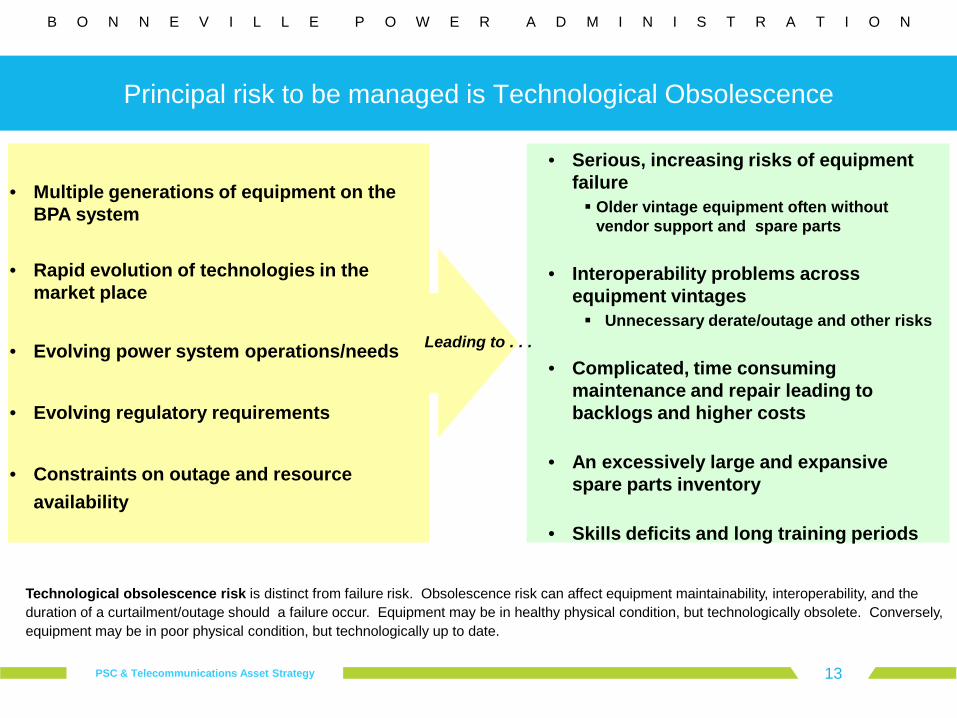
Principal risk to be managed is Technological Obsolescence
• Multiple generations of equipment on the BPA system
• Rapid evolution of technologies in the market place
• Evolving power system operations/needs
• Evolving regulatory requirements
• Constraints on outage and resource availability
• Serious, increasing risks of equipment failure Older vintage equipment often without
vendor support and spare parts
• Interoperability problems across equipment vintages Unnecessary derate/outage and other risks
• Complicated, time consuming maintenance and repair leading to backlogs and higher costs
• An excessively large and expansive spare parts inventory
• Skills deficits and long training periods
Leading to . . .
Technological obsolescence risk is distinct from failure risk. Obsolescence risk can affect equipment maintainability, interoperability, and the duration of a curtailment/outage should a failure occur. Equipment may be in healthy physical condition, but technologically obsolete. Conversely, equipment may be in poor physical condition, but technologically up to date.

B O N N E V I L L E P O W E R A D M I N I S T R A T I O N
PSC & Telecommunications Asset Strategy 14
0
5
10
15
20
25
2002 2003 2004 2005 2006 2007 2008 2009 2010 2011
Mill
ions
$
PSC - TELECOM TRANSPORT PSC - TELECOM SUPPORT EQUIPMENT PSC - SCADA/TELEMETRY/SUPV CNTRL
PSC - TRANSFER TRIP PSC - TELEPHONE SYSTEMS SYSTEM TELECOMMUNICATIONS
PSC Capital Expenditure History
We have woefully under-invested in replacements for these assets
• Cumulative gross investment of ~$300 million
• Relatively short-lived assets: 7-25 years, 15 years avg. • As a rule of thumb: based on today’s system, annual level of investment should be at a
rate of $20 million/year once backlogs have been worked down • The average historical rate has been $3-4 million/year

B O N N E V I L L E P O W E R A D M I N I S T R A T I O N
PSC & Telecommunications Asset Strategy 15
PSC Maintenance Expense History
These assets require a significant level of resources to maintain, repair and operate. Maintenance expenses in FY 2012 will total approximately $15.8 million. These expenses are expected to continue to grow as the system gets larger and becomes increasingly more complex --- until obsolete equipment is removed and replaced (e.g. analog to digital), and strategy process improvement initiatives reach steady state.
PSC Program History
0
2
4
6
8
10
12
14
2005 2006 2007 2008 2009 2010 2011
Mill
ions
$
TLM-FIBER MATERIAL LABOR

B O N N E V I L L E P O W E R A D M I N I S T R A T I O N
PSC & Telecommunications Asset Strategy 16
What equipment is covered?
What is the health of the assets, and what risks must be managed?
What analytical approach was used?
What is the strategy?
What costs and resources will be needed?
Program Accomplishments FY10 – FY11

B O N N E V I L L E P O W E R A D M I N I S T R A T I O N
PSC & Telecommunications Asset Strategy 17
Four innovations used for the PSC/Telecom asset strategy
1. Quantification of regional (societal) costs as well as BPA-incurred costs
• Estimates the value of transmission reliability • The cost to the region when equipment fails and a customer outage occurs
2. Comprehensive modeling of cost (and avoided cost) uncertainties
• A leap forward in quantifying risks • Based on historical actuals and extensive coordination with SMEs
3. New model will enable work to be prioritized to reduce reliability risk and
exposure and reduce economic cost • While also taking into account capital funding, outage availability, resource availability, and other
constraints
4. Structured approach to implementation planning • Assumptions, data, and model vetted • Replacements and maintenance prioritized in greater detail • Redesigned and bolstered processes, including test and evaluation program, technical training,
and asset documentation practices • Resources allocated
Overall goal: minimize long-term economic cost to BPA and the Region

B O N N E V I L L E P O W E R A D M I N I S T R A T I O N
PSC & Telecommunications Asset Strategy 18
Economic Modeling In a Nutshell
Equipment failures Failure curves for old and new equipment Based on BPA historical trends, SME judgment,
available manufacturer and industry trends
Cost of equipment failures Repair/unplanned replacement costs (BPA cost)
Collateral damage (BPA cost)
Mandated remedial work (BPA cost)
Lost customer value – if outage occurs (societal cost)
Equipment replacements and maintenance Type of equipment replaced or maintained Timing of replacements or maintenance Nature of replacement equipment (technology type) Number of labor hours needed for the work
Cost of replacements and maintenance Equipment costs per unit Labor costs per unit Spare inventory costs Training and documentation costs
Simulates over a 30 year period . . .
Cap
ture
s ra
nge
of u
ncer
tain
ties C
aptures range of uncertainties
The modeling evaluates a long-term plan of upgrades, replacements and maintenance – by equipment type, by year Produces expected value costs for BPA and the region – with 80% uncertainty ranges
NPV and capital and expense totals by year Cost probability curves and key drivers of cost uncertainty
Labor (FTE) requirements by craft/skill group by year Equipment failure rates by year
Informs outage planning

B O N N E V I L L E P O W E R A D M I N I S T R A T I O N
PSC & Telecommunications Asset Strategy 19
The Modeling Tool
An Excel-based planning tool that provides feedback (via economic costs and other indicators) to the planner based on choice, level and timing of replacements
The model is not an optimization model
24 PSC equipment types are modeled - each with different failure, cost, labor and other attributes
Over 900 inputs
80% uncertainty ranges on all model inputs
Model can be used to determine value of efficiency and productivity improvements • Training program improvements • Documentation backlog reduction • Testing improvements
Model may be run with capital, human resource, and planned outage constraints applied

B O N N E V I L L E P O W E R A D M I N I S T R A T I O N
PSC & Telecommunications Asset Strategy 20
Deciding optimal time to repair or replace depends on equipment age, expected life, condition, technological change
Failure-probability curves
were prepared for each of 24 equipment types
Curves compare age with probable end of life
The method uses failure-probability (survival) curves that were derived from actual BPA PSC equipment failures coupled with SME judgment
SCADA Equipment Failure Curves (New)
0%
5%
10%
15%
20%
25%
30%
35%
40%
45%
1 2 3 4 5 6 7 8 9 10 11 12 13 14 15 16 17 18 19 20 21 22 23 24 25 26 27 28 29 30 31
Equipment Age (Years)
Failu
re R
ate
PessimisticNeutralOptimistic
Sample Failure Rate for SCADA Equipment
Expected service lives (years)
Pessimistic 12.5
Neutral 16.6
Optimistic 20.2
B O N N E V I L L E P O W E R A D M I N I S T R A T I O N
PSC & Telecommunications Asset Strategy 21
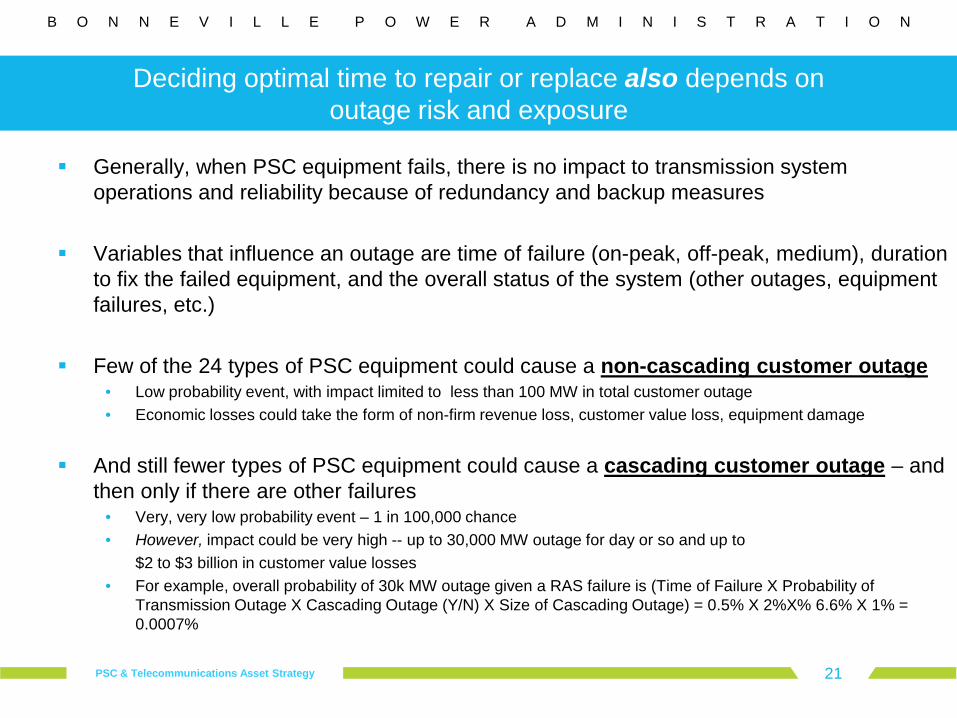
Deciding optimal time to repair or replace also depends on outage risk and exposure
Generally, when PSC equipment fails, there is no impact to transmission system operations and reliability because of redundancy and backup measures
Variables that influence an outage are time of failure (on-peak, off-peak, medium), duration to fix the failed equipment, and the overall status of the system (other outages, equipment failures, etc.)
Few of the 24 types of PSC equipment could cause a non-cascading customer outage • Low probability event, with impact limited to less than 100 MW in total customer outage • Economic losses could take the form of non-firm revenue loss, customer value loss, equipment damage
And still fewer types of PSC equipment could cause a cascading customer outage – and then only if there are other failures
• Very, very low probability event – 1 in 100,000 chance • However, impact could be very high -- up to 30,000 MW outage for day or so and up to $2 to $3 billion in customer value losses • For example, overall probability of 30k MW outage given a RAS failure is (Time of Failure X Probability of
Transmission Outage X Cascading Outage (Y/N) X Size of Cascading Outage) = 0.5% X 2%X% 6.6% X 1% = 0.0007%
B O N N E V I L L E P O W E R A D M I N I S T R A T I O N
PSC & Telecommunications Asset Strategy 22
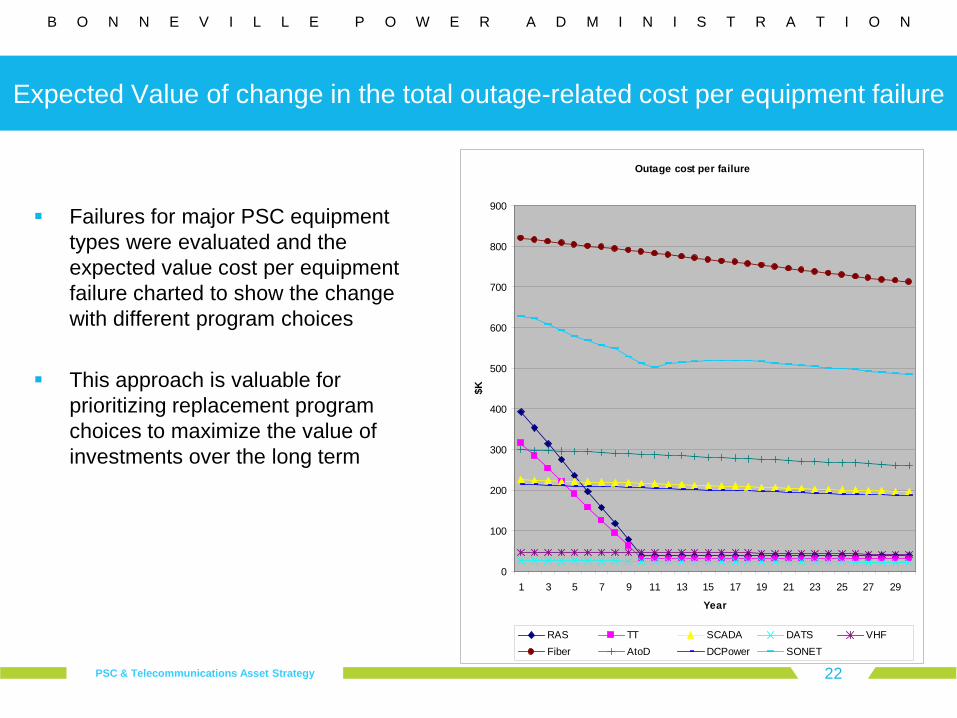
Expected Value of change in the total outage-related cost per equipment failure
Failures for major PSC equipment
types were evaluated and the expected value cost per equipment failure charted to show the change with different program choices
This approach is valuable for prioritizing replacement program choices to maximize the value of investments over the long term
Outage cost per failure
0
100
200
300
400
500
600
700
800
900
1 3 5 7 9 11 13 15 17 19 21 23 25 27 29
Year
$K
RAS TT SCADA DATS VHF Fiber AtoD DCPower SONET

B O N N E V I L L E P O W E R A D M I N I S T R A T I O N
PSC & Telecommunications Asset Strategy 23
What equipment is covered?
What is the health of the assets, and what risks must be managed?
What analytical approach was used?
What is the strategy?
What costs and resources will be needed?
Program Accomplishments FY10 – FY11
B O N N E V I L L E P O W E R A D M I N I S T R A T I O N
PSC & Telecommunications Asset Strategy 24
Rolling Technology Strategy
Aggressively reduce risks of asset failure, interoperability, and technological obsolescence
• Surmount large backlogs that have resulted from years of under-investment − Accomplish conversion from analog equipment to digital within 7-9 years
Replace critical analog Transfer Trip and RAS equipment within five years (accelerate from the current pace of 17-19 years)
− Implement the projects now in flight (see slide 37)
• Design and conduct a comprehensive, integrated testing program − “Test twice, install once” − Enhance existing selection and testing programs by adding a field testing phase to the current pre-qualification testing
− Install enough terminals of a new technology to test for technology interoperability, system limits for timing, geographic distribution, circuit type limitations
− Coordinate the testing of system components so that roll-outs are efficient and pose minimal risk to system stability
− Ensure that reliability risk is reduced , time-consuming and expensive re-do’s are minimized, and scarce FTE are deployed efficiently
• Develop and implement a long-term strategy for moving off SONET − Technological obsolescence predicted in 10 years − Meanwhile investment in SONET is needed to ensure capacity adequacy, reliability − Begin with field operation testing of OMET, then determine deployment

B O N N E V I L L E P O W E R A D M I N I S T R A T I O N
PSC & Telecommunications Asset Strategy 25
Rolling Technology Strategy
Ensure PSC and telecom equipment is upgraded/replaced to enable the agency to deliver on its strategic initiatives
• Such as: −Potential formation of an energy imbalance market −Potentially greater use of dynamic transfer capacity −Potentially greater use of demand response resources −Potential move to 15-minute scheduling −Technological innovations that enable grid operators to “see” the grid more accurately, intermittent
generation to be forecast more accurately, and grid operations to be controlled more precisely
Update the strategy analytics on recurring basis −Update asset health risk assessments −Update prioritization of work activities – directed at maximizing total economic value
Continue to benchmark with other west coast utilities to learn how they manage PSC assets
B O N N E V I L L E P O W E R A D M I N I S T R A T I O N
PSC & Telecommunications Asset Strategy 26
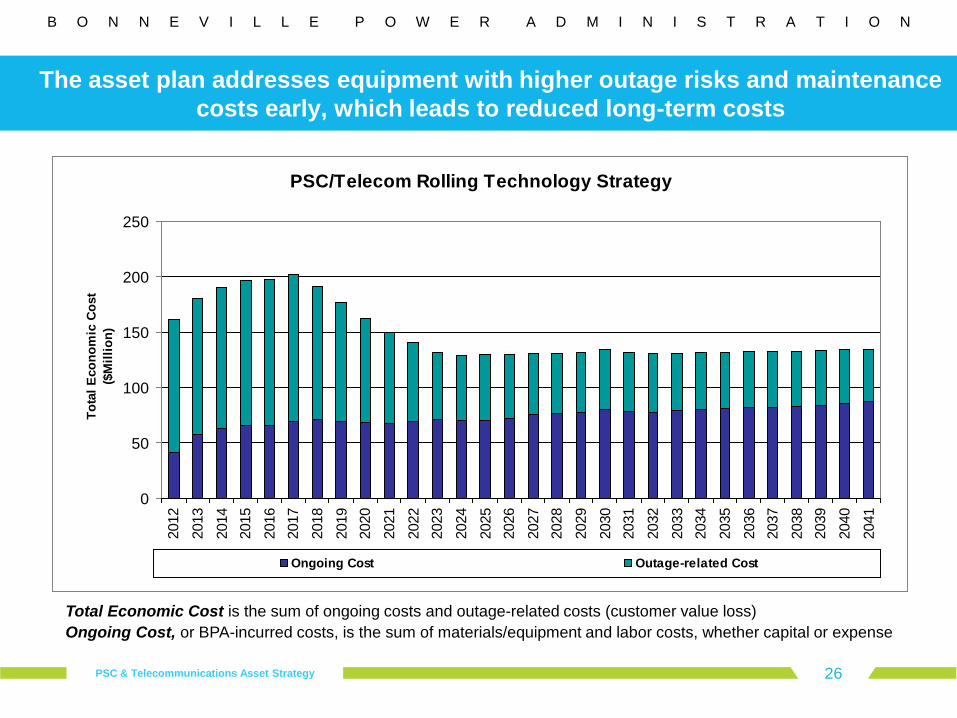
The asset plan addresses equipment with higher outage risks and maintenance costs early, which leads to reduced long-term costs
PSC/Telecom Rolling Technology Strategy
0
50
100
150
200
250
2012
2013
2014
2015
2016
2017
2018
2019
2020
2021
2022
2023
2024
2025
2026
2027
2028
2029
2030
2031
2032
2033
2034
2035
2036
2037
2038
2039
2040
2041
Tota
l Eco
nom
ic C
ost
($M
illio
n)
Ongoing Cost Outage-related Cost
Total Economic Cost is the sum of ongoing costs and outage-related costs (customer value loss) Ongoing Cost, or BPA-incurred costs, is the sum of materials/equipment and labor costs, whether capital or expense

B O N N E V I L L E P O W E R A D M I N I S T R A T I O N
PSC & Telecommunications Asset Strategy 27
The plan requires an increase in labor to overcome backlog, implement a shorter technology life-cycle, and accommodate growth of the system.
0
50
100
150
200
250
300
350
400
2012
2014
2016
2018
2020
2022
2024
2026
2028
2030
2032
2034
2036
2038
2040
Tota
l Lab
or (F
ull T
ime
Equ
ival
ent)
* Excludes the labor for the Mobile Replacement CMO project
On average, labor costs represent 58 percent of the program’s total annual cost
Current level
2011 Asset Plan

B O N N E V I L L E P O W E R A D M I N I S T R A T I O N
PSC & Telecommunications Asset Strategy 28
Several key working assumptions underlie the development of the model and implementation plan
Low impact equipment is repaired until it reaches terminal failure, then replaced (run to fail) rather than having a time-based replacement cycle
Replacement cycles are driven by equipment type, technology and market lifecycles, experience with similar technologies, ability to repair in-house and availability of spares. Adjusted lifecycles by equipment type and extended whenever appropriate
Assume all failures will be repaired to restore service prior to a replacement decision being made, and terminal failure rate is between 2% and 10%
Equipment groupings are based on similarities in system impact, cost, and life cycle
A/D replacements turned to retirements (eliminated duplication between A/D and SONET categories)
Outage risk reassessed for different sizes of outages. High MW/high cost outages much lower risk than low MW/low cost outages

B O N N E V I L L E P O W E R A D M I N I S T R A T I O N
PSC & Telecommunications Asset Strategy 29
Highest priority is assigned to replacing equipment with the greatest likelihood of failure and the greatest likelihood of transmission outage
0
200
400
600
800
1000
1200
2012
2013
2014
2015
2016
2017
2018
2019
2020
2021
2022
2023
2024
2025
2026
2027
2028
2029
2030
2031
2032
2033
2034
2035
2036
2037
2038
2039
2040
2041
# of
Rep
lace
men
ts
SCADA Transfer Trip RASFiber Mobile Repeater7 year (alarm systems, VRLA batteries) DC Power 20 yr UHFDC Power SONET Other DATSSONETAnci Analog to Digital
Note: Fiber is measured in miles, all other equipment in numbers of units
Planned Critical Replacements by Equipment Type
Next replacement cycles of the VHF mobile system begin in FY27 and FY40

B O N N E V I L L E P O W E R A D M I N I S T R A T I O N
PSC & Telecommunications Asset Strategy 30
0
50
100
150
200
250
300
2012
2013
2014
2015
2016
2017
2018
2019
2020
2021
2022
2023
2024
2025
2026
2027
2028
2029
2030
2031
2032
2033
2034
2035
2036
2037
2038
2039
2040
2041
# of
Rep
lace
men
ts
Miscellaneous - 10 year lifecycle Run To Failure Telemeter Telephone Engine Generator Expense RTF
Non-Critical Replacements by Equipment Type
Lower priority is assigned to non-critical equipment
Noncritical replacements are deferred to make room for critical replacements. Noncritical replacements then ramp up because equipment reaches end of service life
B O N N E V I L L E P O W E R A D M I N I S T R A T I O N
PSC & Telecommunications Asset Strategy 31
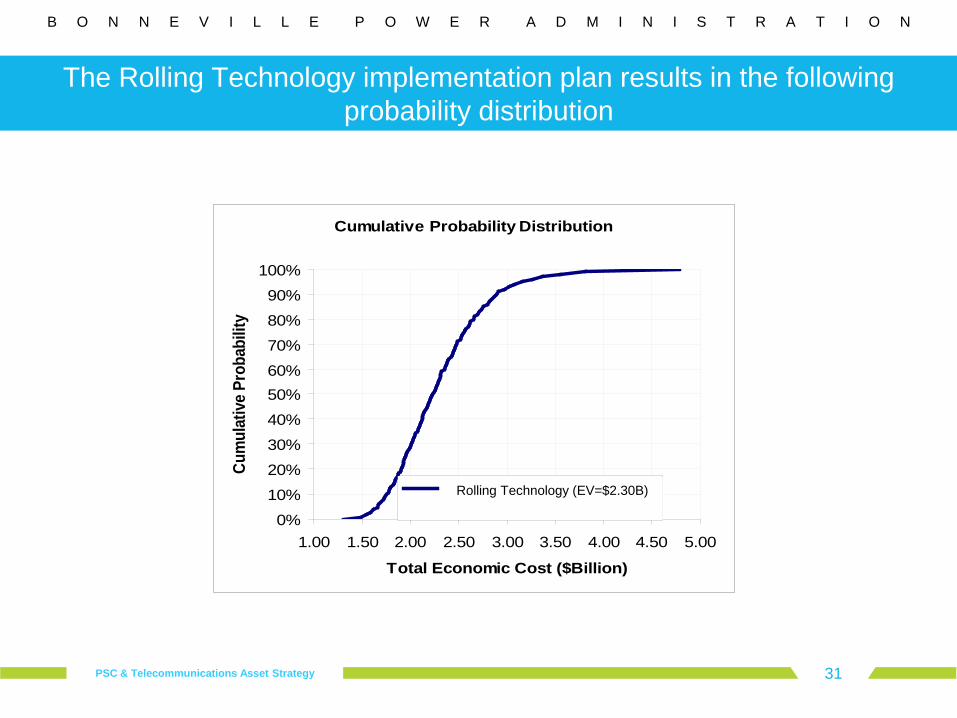
The Rolling Technology implementation plan results in the following probability distribution
Rolling Technology
(EV
Cumulative Probability Distribution
0%
10%
20%
30%
40%
50%60%
70%
80%
90%
100%
1.00 1.50 2.00 2.50 3.00 3.50 4.00 4.50 5.00
Total Economic Cost ($Billion)
Cum
ulat
ive
Prob
abili
ty
Total Economic Cost - Rolling(EV = 2.30)
Rolling Technology (EV=$2.30B)

B O N N E V I L L E P O W E R A D M I N I S T R A T I O N
PSC & Telecommunications Asset Strategy 32
At steady state, Ongoing Cost runs at $70 million/year, then grows as the system grows
0
10
20
30
40
50
60
70
80
90
100
2012
2013
2014
2015
2016
2017
2018
2019
2020
2021
2022
2023
2024
2025
2026
2027
2028
2029
2030
2031
2032
2033
2034
2035
2036
2037
2038
2039
2040
2041
Tota
l Ong
oing
Cos
ts (m
illio
ns $
)
Expense Capital Mobile Radio (contract)
PSC Plan – Ongoing Costs
B O N N E V I L L E P O W E R A D M I N I S T R A T I O N
PSC & Telecommunications Asset Strategy 33
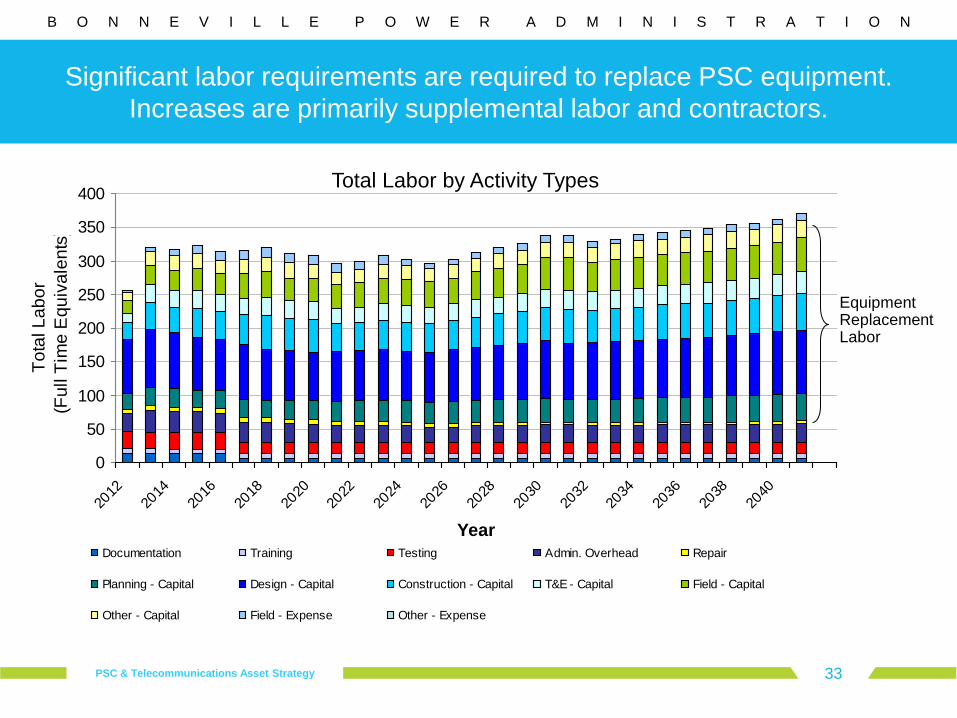
Significant labor requirements are required to replace PSC equipment. Increases are primarily supplemental labor and contractors.
0
50
100
150
200
250
300
350
400
2012
2014
2016
2018
2020
2022
2024
2026
2028
2030
2032
2034
2036
2038
2040
Year
Tota
l Lab
or (F
ull T
ime
Equ
ival
ents
)
Documentation Training Testing Admin. Overhead Repair
Planning - Capital Design - Capital Construction - Capital T&E - Capital Field - Capital
Other - Capital Field - Expense Other - Expense
Equipment Replacement Labor
Total Labor by Activity Types
B O N N E V I L L E P O W E R A D M I N I S T R A T I O N
PSC & Telecommunications Asset Strategy 34
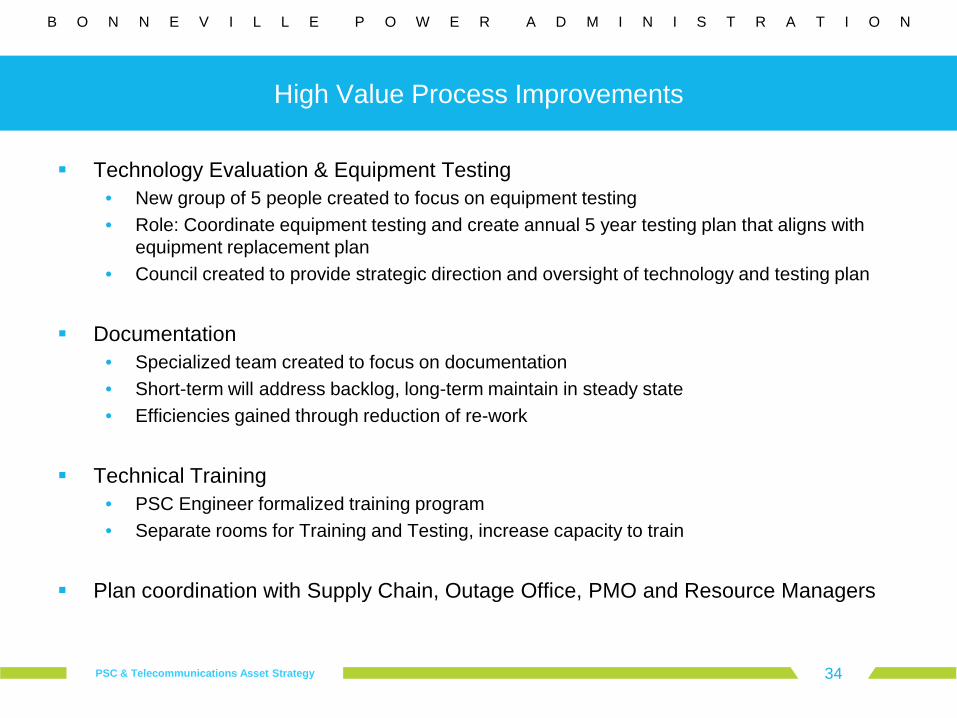
High Value Process Improvements
Technology Evaluation & Equipment Testing • New group of 5 people created to focus on equipment testing • Role: Coordinate equipment testing and create annual 5 year testing plan that aligns with
equipment replacement plan • Council created to provide strategic direction and oversight of technology and testing plan
Documentation
• Specialized team created to focus on documentation • Short-term will address backlog, long-term maintain in steady state • Efficiencies gained through reduction of re-work
Technical Training
• PSC Engineer formalized training program • Separate rooms for Training and Testing, increase capacity to train
Plan coordination with Supply Chain, Outage Office, PMO and Resource Managers
B O N N E V I L L E P O W E R A D M I N I S T R A T I O N
PSC & Telecommunications Asset Strategy 35
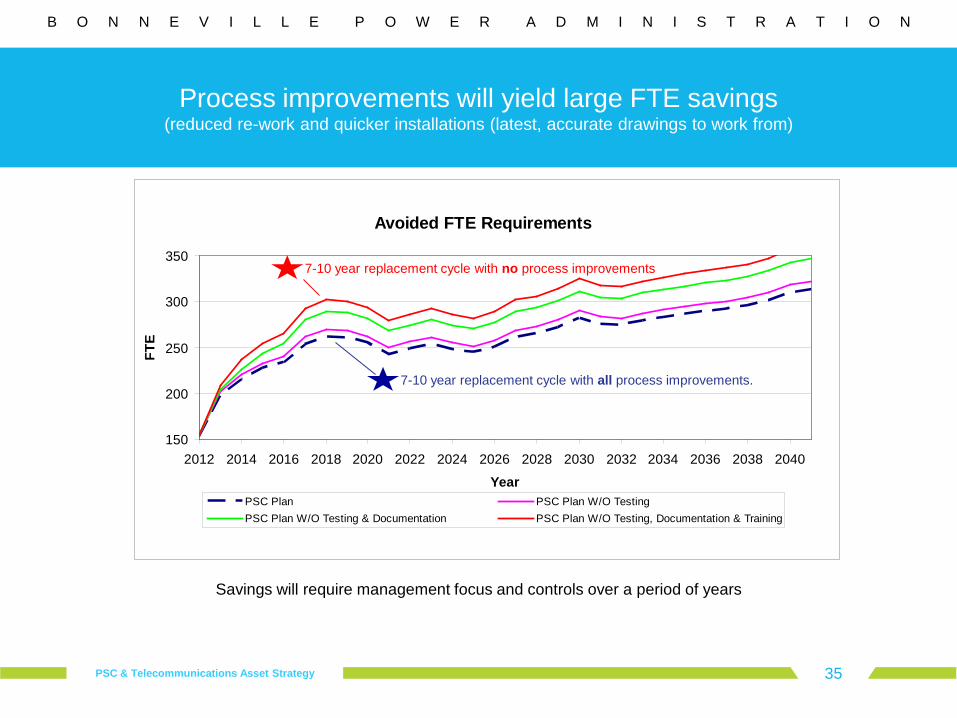
Process improvements will yield large FTE savings (reduced re-work and quicker installations (latest, accurate drawings to work from)
Avoided FTE Requirements
150
200
250
300
350
2012 2014 2016 2018 2020 2022 2024 2026 2028 2030 2032 2034 2036 2038 2040
Year
FTE
PSC Plan PSC Plan W/O TestingPSC Plan W/O Testing & Documentation PSC Plan W/O Testing, Documentation & Training
7-10 year replacement cycle with all process improvements.
7-10 year replacement cycle with no process improvements
Savings will require management focus and controls over a period of years

B O N N E V I L L E P O W E R A D M I N I S T R A T I O N
PSC & Telecommunications Asset Strategy 36
What equipment is covered?
What is the health of the assets, and what risks must be managed?
What analytical approach was used?
What is the strategy?
What costs and resources will be needed?
Program Accomplishments FY10 – FY11
B O N N E V I L L E P O W E R A D M I N I S T R A T I O N
PSC & Telecommunications Asset Strategy 37
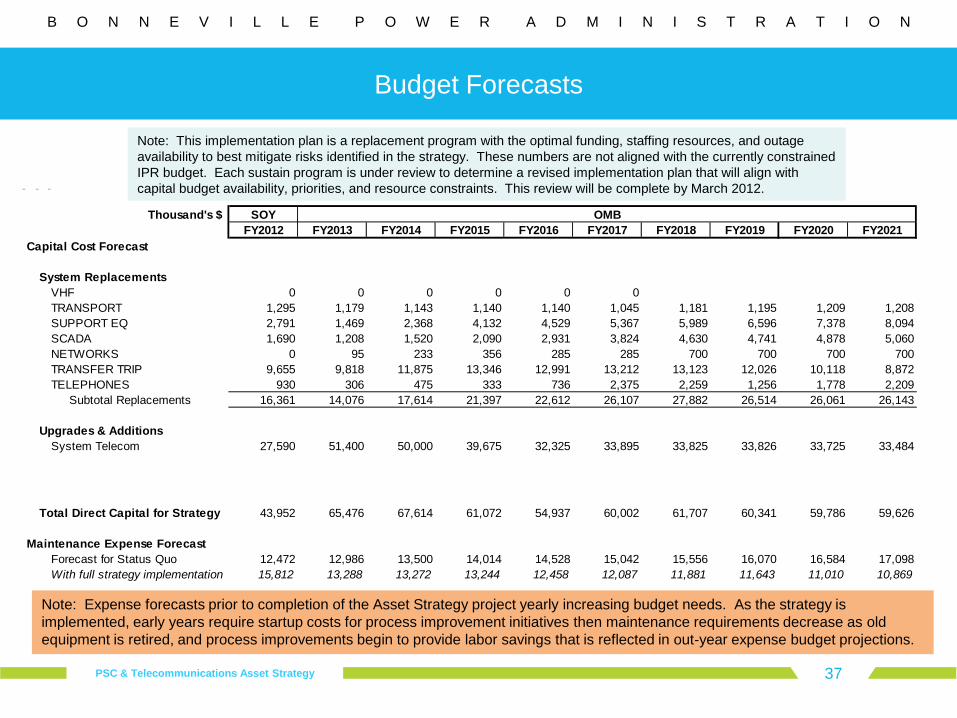
Budget Forecasts
Thousand's $ SOYFY2012 FY2013 FY2014 FY2015 FY2016 FY2017 FY2018 FY2019 FY2020 FY2021
Capital Cost Forecast
System ReplacementsVHF 0 0 0 0 0 0 TRANSPORT 1,295 1,179 1,143 1,140 1,140 1,045 1,181 1,195 1,209 1,208SUPPORT EQ 2,791 1,469 2,368 4,132 4,529 5,367 5,989 6,596 7,378 8,094SCADA 1,690 1,208 1,520 2,090 2,931 3,824 4,630 4,741 4,878 5,060NETWORKS 0 95 233 356 285 285 700 700 700 700TRANSFER TRIP 9,655 9,818 11,875 13,346 12,991 13,212 13,123 12,026 10,118 8,872TELEPHONES 930 306 475 333 736 2,375 2,259 1,256 1,778 2,209 Subtotal Replacements 16,361 14,076 17,614 21,397 22,612 26,107 27,882 26,514 26,061 26,143
Upgrades & AdditionsSystem Telecom 27,590 51,400 50,000 39,675 32,325 33,895 33,825 33,826 33,725 33,484
Total Direct Capital for Strategy 43,952 65,476 67,614 61,072 54,937 60,002 61,707 60,341 59,786 59,626
Maintenance Expense ForecastForecast for Status Quo 12,472 12,986 13,500 14,014 14,528 15,042 15,556 16,070 16,584 17,098With full strategy implementation 15,812 13,288 13,272 13,244 12,458 12,087 11,881 11,643 11,010 10,869
OMB
Note: Expense forecasts prior to completion of the Asset Strategy project yearly increasing budget needs. As the strategy is implemented, early years require startup costs for process improvement initiatives then maintenance requirements decrease as old equipment is retired, and process improvements begin to provide labor savings that is reflected in out-year expense budget projections.
Note: This implementation plan is a replacement program with the optimal funding, staffing resources, and outage availability to best mitigate risks identified in the strategy. These numbers are not aligned with the currently constrained IPR budget. Each sustain program is under review to determine a revised implementation plan that will align with capital budget availability, priorities, and resource constraints. This review will be complete by March 2012.

B O N N E V I L L E P O W E R A D M I N I S T R A T I O N
PSC & Telecommunications Asset Strategy 38
What equipment is covered?
What is the health of the assets, and what risks must be managed?
What analytical approach was used?
What is the strategy?
What costs and resources will be needed?
Program Accomplishments FY10 – FY11
B O N N E V I L L E P O W E R A D M I N I S T R A T I O N
PSC & Telecommunications Asset Strategy 39
FY10 – FY11 Program Accomplishments
The focus of the PSC/Telecom Asset Program during FY10/FY11 was two-fold:
Complete the strategy development project and implementation planning with SDG.
• The end result of the strategy effort is a robust, comprehensive implementation plan that utilizes monetized value metrics for equipment condition, equipment reliability risk, and customer value to produce an optimized program designed to maximize investment value and minimize power system reliability risks due to PSC/Telecom equipment failures
Execution of projects to move the analog to digital migration initiative forward
• Completed joint fiber ring in the Puget Sound area with Puget Sound Energy • Buried approximately 8 miles of problematic fiber optic cable near Augspurger Mtn. • Completed Sifton section of #AC SONET • #KC Phase 1 Project became operational, allowing circuits to begin moving from the
analog microwave along the COI to fiber and digital radio • Progress on #NC SONET systems and analog/digital migration

B O N N E V I L L E P O W E R A D M I N I S T R A T I O N
PSC & Telecommunications Asset Strategy 40
FY10 – FY11 Accomplishments
Completed 20% of EACC circuit cutovers Completed replacement of:
• 27 comm batteries/chargers • 7 FLAR remotes • 5 SCADA RTUs • 11 UHF radios • 54 analog comm alarm RTUs • 6 antenna systems • 3 DATS telephone switches • 32 analog Transfer Trip/RAS units
Received approval for and beginning preliminary design to upgrade over 300 miles of fiber optic cable on the Ross-Schultz fiber project.
Received approval for and currently implementing “D” system analog radio replacement (#WC Project)
Received approval for and beginning preliminary design for Mobile Radio Replacement Project
FY10 – FY11 Program Accomplishments