Suspended Sediment and Bed Load in Three Tributaries to ... · Three bed-load samples were...
30
Suspended Sediment and Bed Load in Three Tributaries to Lake Emory in the Upper Little Tennessee River Basin, North Carolina, 2000 – 02 U.S. Geological Survey U.S. Department of the Interior Prepared in cooperation with Macon County, North Carolina U.S. Geological Survey Water-Resources Investigations Report 03–4194
Transcript of Suspended Sediment and Bed Load in Three Tributaries to ... · Three bed-load samples were...

Suspended Sediment and Bed Load in Three Tributariesto Lake Emory in the Upper Little Tennessee River Basin,North Carolina, 2000 – 02
U.S. Geological SurveyU.S. Department of the Interior
Prepared in cooperation with Macon County, North Carolina
U.S. Geological Survey Water-Resources Investigations Report 03–4194
U.S. GEOLOGICAL SURVEY
Water-Resources Investigations Report 03–4194
Suspended Sediment and Bed Load in Three Tributaries to Lake Emory in the Upper Little Tennessee River Basin, North Carolina, 2000 – 02
Prepared in cooperation with
Macon County, North Carolina
By Carolyn J. Oblinger
Raleigh, North Carolina2003

U.S. DEPARTMENT OF THE INTERIOR
GALE A. NORTON, Secretary
U.S. GEOLOGICAL SURVEY
Charles G. Groat, Director
For additional information write to: Copies of this report can be purchased from:
U.S. Geological Survey Branch of Information Services Box 25286, Federal Center Denver, CO 80225 1-888-ASK-USGS
The use of firm, trade, and brand names in this report is for identification purposes only and does not constitute endorsement by the U.S. Government.
Additional information about U.S. Geological Survey programs and products in North Carolina can be obtained from the Web site: http://nc.water.usgs.gov
District Chief U.S. Geological Survey 3916 Sunset Ridge Road Raleigh, NC 27607 [email protected]
Contents III
CONTENTSAbstract ................................................................................................................................................................................ 1Introduction .......................................................................................................................................................................... 1
Purpose and scope ...................................................................................................................................................... 3Study area ................................................................................................................................................................... 3Acknowledgments ...................................................................................................................................................... 3
Data-collection methods ....................................................................................................................................................... 4Streamflow data .......................................................................................................................................................... 5Suspended-sediment data ........................................................................................................................................... 6Bed-load data ............................................................................................................................................................. 6Particle size ................................................................................................................................................................ 6
Streamflow ........................................................................................................................................................................... 6Estimation of streamflow in the Cullasaja River ........................................................................................................ 9Estimation of Porter’s Bend dam releases .................................................................................................................. 13
Suspended sediment ............................................................................................................................................................. 13Load ............................................................................................................................................................................ 13Particle size ................................................................................................................................................................ 19
Bed material ......................................................................................................................................................................... 21Bed load ..................................................................................................................................................................... 21Particle size ................................................................................................................................................................ 23
Summary .............................................................................................................................................................................. 23References ............................................................................................................................................................................ 24
FIGURES
1 – 2. Maps showing:1. Location of the upper Little Tennessee River basin, North Carolina .............................................................. 22. Locations of streamgages and sediment-sampling sites in the upper Little Tennessee
River basin, North Carolina ............................................................................................................................ 43. Photograph of a Helley-Smith bed-load sampler .................................................................................................... 6
4 – 13. Graphs showing:4. Total annual precipitation at the Franklin, North Carolina, Weather Station for
1990 – 2001, and the long-term average annual rainfall .................................................................................. 75. Long-term minimum and median daily-mean streamflow and daily-mean streamflow for
water year 2001 at (A) the Little Tennessee River near Prentiss and (B) Cartoogechaye Creek near Franklin, North Carolina ............................................................................... 7
6. Departure from mean-monthly streamflow at (A) the Little Tennessee River near Prentiss and (B) Cartoogechaye Creek near Franklin, North Carolina, and (C) monthly rainfall at the Franklin Weather Station ..................................................................................... 8
7. Distributions of sampled streamflows at (A) the Little Tennessee River and (B) Cartoogechaye Creek in relation to long-term streamflow durations from streamgages at the Little Tennessee River near Prentiss and Cartoogechaye Creek near Franklin, North Carolina ............................................................................... 9
8. Relation of daily-mean streamflow in the Cullasaja River to daily-mean streamflows at Cartoogechaye Creek near Franklin and the Little Tennessee River near Prentiss, North Carolina, for water years 1970 – 71 ........................................................................................ 10

IV Contents
9. Relation of instantaneous and daily-mean streamflows at the Cullasaja River near Franklin, North Carolina, to instantaneous (2001 – 02) and daily-mean (1970 – 71) streamflows at the Little Tennessee River near Prentiss and Cartoogechaye Creek near Franklin ................................................................................................................ 12
10. Distribution of suspended-sediment concentrations at the four Little Tennessee River basin study sites in North Carolina .................................................................................................................. 16
11. Relation of daily sediment load to instantaneous streamflow at (A) the Cullasaja River near Franklin, (B) Cartoogechaye Creek near Franklin, and (C) the Little Tennessee River at Riverside, North Carolina ............................................................................................................................. 17
12. Relation of daily suspended-sediment load and instantaneous streamflow at Cartoogechaye Creek near Franklin, North Carolina, for 1977 – 79 and 2001 ................................................ 19
13. Distribution of percentages of suspended-sediment particles finer than 0.062 millimeter at the four Little Tennessee River basin study sites in North Carolina ........................................................... 21
TABLES
1. Selected U.S. Geological Survey streamgaging stations in the upper Little Tennessee River basin, North Carolina ................................................................................................................... 5
2. Regression equations relating streamflow at the two Little Tennessee River basin index sites to streamflow in the Cullasaja River, North Carolina ..................................................................................... 11
3. Relation of streamflow measured at the Cullasaja River to streamflow at Cartoogechaye Creek near Franklin and the Little Tennessee River near Prentiss, North Carolina, during water years 2001 and 2002 .......................................................................................................................... 11
4. Streamflow statistics for the Little Tennessee River basin, North Carolina, study sites for the 2001 water year ........................................................................................................................................... 13
5. Suspended-sediment concentrations at the four Little Tennessee River basin study sites in North Carolina and measured or estimated streamflow at three of the study sites.............................................................................................................................................. 14
6. Results of regression analyses relating the natural log of instantaneous suspended- sediment load to the natural log of instantaneous streamflow at three Little Tennessee River basin study sites in North Carolina ................................................................................................................ 18
7. Estimated suspended-sediment loads and yields at the three study sites and at sites sampled in 1970 – 79 in the Little Tennessee River basin, North Carolina ..................................................... 18
8. Streamflow and suspended-sediment concentration and particle-size distributions in samples from the four Little Tennessee River basin study sites in North Carolina ............................................ 20
9. Bed load and suspended-sediment load during three runoff events at three sites in the Little Tennessee River basin in North Carolina ................................................................................................ 22
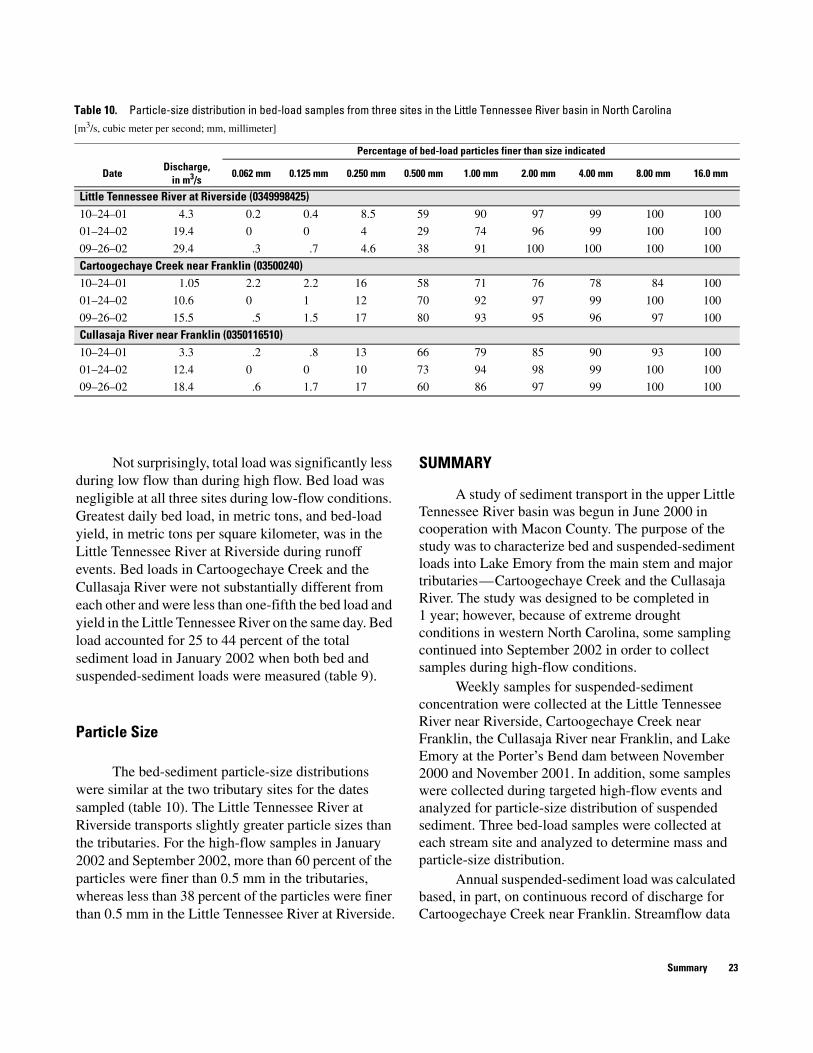
10. Particle-size distribution in bed-load samples from three sites in the Little Tennessee River basin in North Carolina ................................................................................................................................. 23

Contents V
CONVERSION FACTORS, ABBREVIATIONS, and ACRONYMS
Abbreviated water-quality units: mg/L, milligram per literL, liter (a unit of volume equal to approximately 1.056 quarts)
Acronyms:
EWI equal-width integratedFISP Federal Interagency Sedimentation ProjectMEWI multiple equal-width incrementNOAA National Oceanic and Atmospheric AdministrationNWIS National Water Information SystemUSGS U.S. Geological SurveyVA visual accumulation
GLOSSARY
Daily-mean streamflow — The mean streamflow for any one day. For example, the daily-mean streamflow for October 10, 2002.Annual-mean streamflow — The arithmetic mean of the daily-mean streamflows for the year noted or for the designated period. For example, the annual-mean streamflow for 1944 to 2001 is the arithmetic mean of all daily-mean streamflow for that period.Mean-monthly streamflow — The arithmetic mean of the means of record for a specific month during a specific period of years. For example, the mean-monthly streamflow for October is the arithmetic mean of all October means during 1944 to 2001.
Multiply By To obtain
Lengthmillimeter (mm) 0.03937 inchcentimeter (cm) 0.3937 inch
meter (m) 3.281 foot1.094 yard
kilometer (km) 0.6214 mile
Areahectare (ha) 2.471 acre
square kilometer (km2) 0.3861 square mile
Volumecubic meter (m3) 35.31 cubic foot
1.308 cubic yard
Flowmeter per second (m/s) 3.281 foot per second
cubic meter per second (m3/s) 35.31 cubic foot per secondcubic meter per second per square kilometer [(m3/s)/km2] 91.49 cubic foot per second per square mile
Masskilogram (kg) 2.205 poundmetric ton (t) 1.102 short ton (2,000 pounds)
metric ton per day (t/d) 1.102 short ton (2,000 pounds)metric ton per square kilometer (t/km2) 2.855 short ton (2,000 pounds) per square mile

Abstract 1
Suspended Sediment and Bed Load in Three Tributaries to Lake Emory in the Upper Little Tennessee River Basin, North Carolina, 2000 – 02
By Carolyn J. Oblinger
ABSTRACT
A study was conducted in the upper Little Tennessee River basin to characterize suspended-sediment and bed-load sediment transport into Lake Emory from the main stem and two major tributaries — Cartoogechaye Creek and the Cullasaja River. Suspended-sediment concentrations in the discharge from Lake Emory also were measured. Weekly samples for suspended-sediment concentration were collected between November 2000 and November 2001, and periodic samples were collected during targeted high-flow events. Suspended-sediment samples were collected during stormwater runoff conditions for analysis of particle-size distribution. Three bed-load samples were collected at each stream site.
The greatest annual load (5,700 metric tons) and yield (18 metric tons per square kilometer) of suspended sediment during the study period were in the Little Tennessee River near Riverside, North Carolina. Much smaller annual yields were calculated for Lake Emory, the Cullasaja River, and Cartoogechaye Creek (5, 5, and 7 metric tons per square kilometer, respectively). Drought conditions during the study period appear to have been a factor in the small loads compared to loads measured in the same area in the 1970’s. The annual-mean streamflow at the Little Tennessee River at Prentiss during 2001 was about 50 percent of the long-term annual-mean streamflow (1944 – 2001). High-flow events carry most of the annual sediment load.
INTRODUCTION
The upper Little Tennessee River basin in western North Carolina is part of the Little Tennessee River basin upstream from Fontana Lake (fig. 1). The upper basin is mountainous and rural — less than 5 percent of the land use in the basin is classified as urban and 89 percent is forested. Parts of the basin lie within the Great Smoky Mountains National Park and Nantahala National Forest. Because the Little Tennessee River is a mountain river, its tributaries typically have relatively steep gradients and riffle habitats capable of supporting trout populations (North Carolina Division of Water Quality, 2000). The Little Tennessee River also supports a large variety of other aquatic species, including three rare species on the Federal endangered species list — the Appalachian elktoe mussel (Alasmidonta raveneliana), the little-wing pearly mussel (Pegias fabula), and the Spotfin chub (Cyprinella monacha). The Little Tennessee River basin is the only basin in North Carolina where the slippershell mussel (Alasmidonta viridis) and Tennessee pigtoe mussel (Fusconaia barnesiana) can be found.
A major water-quality issue in the rural setting of the Little Tennessee River basin is sedimentation — both historic and recent (North Carolina Division of Water Quality, 2002). Sedimentation is the primary factor affecting ecological communities in the basin (Harding and others, 1998), resulting in loss of in-stream microhabitats and aquatic-habitat degradation. Sedimentation is caused primarily by land-clearing
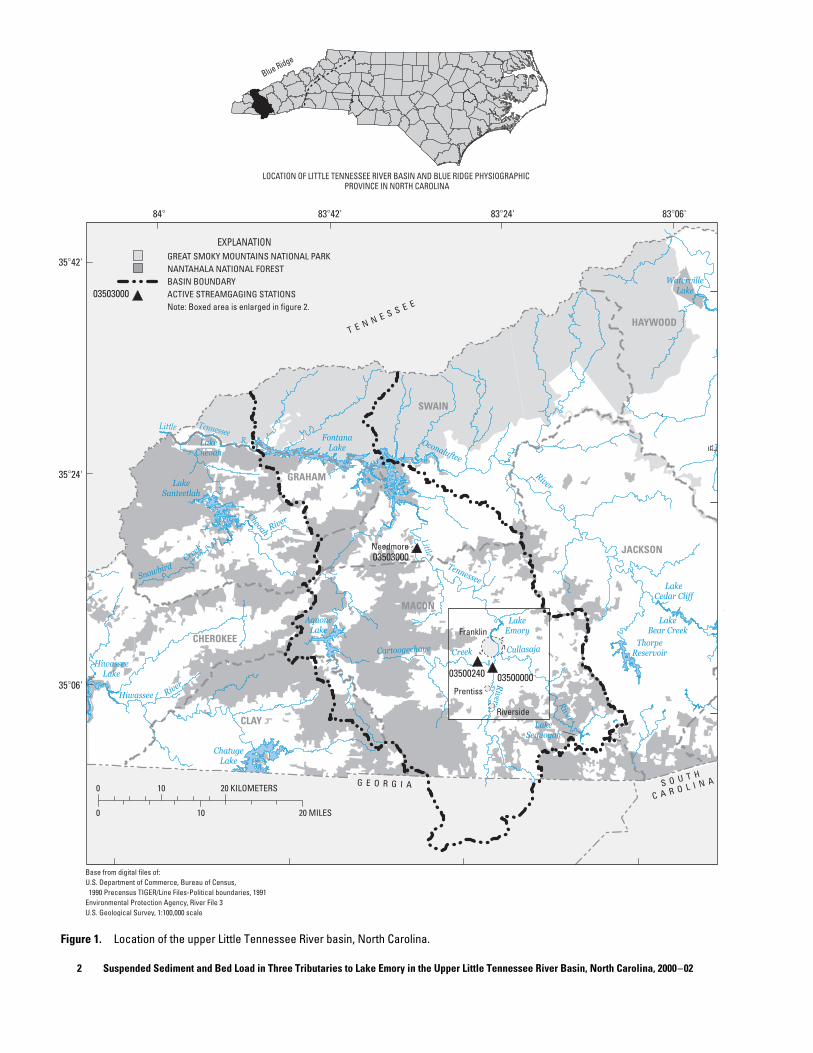
2 Suspended Sediment and Bed Load in Three Tributaries to Lake Emory in the Upper Little Tennessee River Basin, North Carolina, 2000 – 02
Figure 1. Location of the upper Little Tennessee River basin, North Carolina.

Introduction 3
activities, rural roads, loss of riparian vegetation to agriculture and silviculture, and urban runoff. In addition, landscape features, such as high stream-channel gradients, are important factors contributing to sedimentation rates (Scott and others, 2002). Harding and others (1998) reported that the conditions of current aquatic communities are related more to past land use than to current land use.
Historically, sediment has clogged the channel of the upper Little Tennessee River and has deposited sediment in Lake Emory (fig. 1; North Carolina Department of Environment, Health, and Natural Resources, 1992, p. 155). Riparian agricultural practices, such as stock watering and growing specialty vegetable crops, and more recently, increasing urbanization in the upper portion of the watershed in the towns of Highlands and Franklin have increased the river's suspended-sediment load and bed load. Thus, by trapping sediments, Lake Emory has protected important natural resources downstream, particularly in respect to several federally listed species of freshwater mussel.
Suspended-sediment data are available from the 1970's for the Little Tennessee River at Needmore and Cartoogechaye Creek near Franklin (Simmons, 1993). Average annual suspended-sediment loads were calculated to be 100,000 metric tons (t) for the Little Tennessee River at Needmore and 10,000 t for Cartoogechaye Creek near Franklin for the 1970’s. Average annual suspended-sediment yields at these sites were 110 and 81 metric tons per square kilometer (t/km2), respectively. By comparison, an average yield of 68 t/km2 was calculated for rural, agricultural sites in the upper Tennessee River basin (Simmons, 1993).
Federal, State, and local agencies and organizations are working to restore degraded aquatic resources in the upper Little Tennessee River and some of its tributaries, including protection and enhancement of threatened and endangered species populations and wetland restoration. Key to developing restoration strategies is a better understanding of the amount of sediment that is transported in the upper Little Tennessee River, the sediment sources and particle-size characteristics, and the amount of sediment that is transported past Porter's Bend dam at Lake Emory. The data collected during this investigation begin to address these issues.
Purpose and Scope
This report describes the results of a study to characterize suspended-sediment and bed-load sediment transport into Lake Emory from the main stem of the Little Tennessee River and two major tributaries — Cartoogechaye Creek and the Cullasaja River. Suspended-sediment concentration in discharge from Lake Emory also was measured. Sediment samples were collected weekly over a 12-month period from November 2000 to November 2001. In addition, three bed-load measurements were made between October 2001 and September 2002.
Study Area
The Little Tennessee River basin is in the Blue Ridge Physiographic Province. The river rises in Georgia near the North Carolina border and flows north through North Carolina into Tennessee (fig. 1) where it joins the Tennessee River. The upper Little Tennessee River basin is the area of the Little Tennessee River basin that is upstream from Fontana Lake. The study area includes the portion of the upper Tennessee River basin upstream from Porter's Bend dam at Lake Emory (fig. 2). The study area is drained by the Little Tennessee River, the Cullasaja River, and Cartoogechaye Creek. The Cullasaja River and Cartoogechaye Creek join the Little Tennessee River near Franklin, N.C. (fig. 2).
Lake Emory is a 76-hectare (ha) reservoir built in the 1920's as a source of hydropower. Nantahala Power and Light Company has owned and operated the lake since 1933 (North Carolina Department of Environment, Health, and Natural Resources, 1992). Based on lake samples collected in July 1988, the lake has been described as eutrophic and shallow and having a short retention time (North Carolina Department of Environment, Health, and Natural Resources, 1992). Suspended-solids concentrations at each of three sites sampled in the lake were at least 18 milligrams per liter (mg/L).
Acknowledgments
This investigation was cooperatively funded by the U.S. Geological Survey (USGS) and Macon County, N.C. The author wishes to thank Eugene Gonzales of Macon County for collecting weekly

4 Suspended Sediment and Bed Load in Three Tributaries to Lake Emory in the Upper Little Tennessee River Basin, North Carolina, 2000 – 02
Figure 2. Locations of streamgages and sediment-sampling sites in the upper Little Tennessee River basin, North Carolina.
suspended-sediment samples regardless of weather conditions. The author also wishes to acknowledge the assistance of Gene Barker and his staff from the USGS Field Office in Asheville, N.C. Leadership in bringing together the partners who supported this investigation was provided by Linda Adcock of the U.S. Army Corps of Engineers in Nashville, Tenn.
DATA-COLLECTION METHODS
The data-collection methods used during this investigation are consistent with published USGS protocols (Rantz and others, 1982; U.S. Geological Survey, 1997 – present; Edwards and Glysson, 1999). Results of all sediment analyses are stored in the USGS

Data-Collection Methods 5
National Water Information System (NWIS) water-quality database.
Streamflow Data
Streamflow in the upper Little Tennessee River basin was determined from measurements from available streamgage records (Rantz and others, 1982) or from estimates based on record from a nearby streamgage. The streamgages in the study area are operated and maintained by the USGS in cooperation with the North Carolina Department of Environment and Natural Resources.
Of the four study sites (table 1), streamflow is recorded continuously only at Cartoogechaye Creek near Franklin. Streamflow at the Little Tennessee River at Riverside was estimated from streamflow record at the Little Tennessee River near Prentiss, about 4.8 kilometers (km) downstream. Streamflow near Prentiss was reduced by multiplying by a factor determined by the ratio of the drainage areas (311 km2 / 363 km2 = 0.857) to obtain an estimate of the streamflow at Riverside.
Estimating the streamflow at Cullasaja River near Franklin was more complex, however, because no streamgage was in operation on the Cullasaja River during the study period. A location just upstream from
the Cullasaja study site was operated from 1921 to 1971 — Cullasaja River at Cullasaja, N.C. (03501000). Although the difference in the drainage areas of the two sites is only 12 km2, a stage-streamflow relation from this gage was too dated to be useful. In addition, a 60-ha drinking-water reservoir, Lake Sequoyah, impounds the upper 23 km2 of the watershed and potentially affects streamflow downstream (fig. 1).
As a result, two nearby streamgages were selected as potential index sites for estimating streamflow at the Cullasaja River near Franklin — the Little Tennessee River near Prentiss (03500000) and Cartoogechaye Creek near Franklin (03500240). Historic streamflow records were retrieved from the NWIS surface-water database and analyzed to determine which of the two sites was the better index site.
Discharge below the dam at Lake Emory also had to be estimated. Although water is released through the turbines at the Porter's Bend dam for power generation, no records of the releases are maintained by Nantahala Power and Light Company (Richard Conley, Duke Power Lake Management, oral commun., December 20, 2001). In addition, leakage occurs through the dam structure, and when lake levels are high, water also may be released over the spillway. An annual-mean streamflow was estimated for 2001 based
Table 1. Selected U.S. Geological Survey streamgaging stations in the upper Little Tennessee River basin, North Carolina[USGS, U.S. Geological Survey; km2, square kilometer; m3/s, cubic meter per second; t, metric ton; t/km2, metric ton per square kilometer; bold/shaded station numbers and names identify sites sampled for this study; —, no data]
USGS station numbera
(fig. 2)
a Station number is assigned by the U.S. Geological Survey on the basis of geographic location. The downstream order number system is used for surface-water sites.
Station name
Period of streamflow
record (water yearsb)
b Water year is the period October 1 through September 30 and is identified by the year in which the period ends.
Drainagearea(km2)
Annual-mean streamflow (m3/s)
Annual suspended sediment
Period of record
2001 water year
Load (t)
Yield (t/km2)
0349998425 Little Tennessee River at Riverside — 311 — — — —
03500000 Little Tennessee River near Prentiss 1943 – present 363 11 5.44 — —
03500240 Cartoogechaye Creek near Franklin 1944, 1947, 1953 – 55, 1958, 1960, 1961 – present
148 4.1 2.09 10,000 81
0350116510 Cullasaja River near Franklin — 236 — — — —
03501000 Cullasaja River at Cullasaja 1907 – 09, 1921 – 71
224 — — — —
03501564 Lake Emory at the dam near Franklin — 804 — — — —
03503000 Little Tennessee River at Needmore 1943 – 81, 1983 – present
1,130 29.9 15.2 100,000 110

6 Suspended Sediment and Bed Load in Three Tributaries to Lake Emory in the Upper Little Tennessee River Basin, North Carolina, 2000 – 02
Figure 3. Helley-Smith bed-load sampler.
on record from the streamgage at the Little Tennessee River at Needmore about 32 km below the dam (fig. 1).
Suspended-Sediment Data
Stream samples for analysis of suspended-sediment concentration were collected once per week at each of the four study sites. In addition, several samples were collected during targeted high-flow events. At each data-collection stream site, a box enclosure containing a US-D-74 suspended-sediment sampler was mounted to a bridge rail at the approximate center of streamflow (Edwards and Glysson, 1999). Macon County staff used this equipment to collect single, vertical, suspended-sediment samples (box samples) once per week. The US-D-74 sampler is one of a number of samplers designed by the Federal Interagency Sedimentation Project (FISP) for use in collecting a depth-integrated suspended-sediment sample. USGS staff used a US-DH-81 or US-DH-59 sampler periodically to collect equal-width integrated (EWI) suspended-sediment samples that could be used to validate the single, vertical samples as being representative of the average suspended-sediment concentration in the stream cross section. Suspended-sediment concentrations in samples collected using the EWI method were compared to concentrations measured in the box samples. The samples were shipped to the USGS sediment laboratory in Louisville, Ky., and analyzed for suspended-sediment concentration. Samples were analyzed by using the filtration method described by Guy (1977).
Bed-Load Data
A Helley-Smith type sampler was used to sample bed load (fig. 3). The sampler is designed to collect particles less than 76 millimeters (mm) at mean velocities up to 3.0 meters per second (m/s). The sampler has a 76-mm by 76-mm opening to a 0.25-mm mesh sampling bag that is supported by a metal frame. The sampler weighs 29.9 kilograms (kg). The nozzle-expansion ratio is 3.1.
Bed-load samples were analyzed for total weight by the USGS sediment laboratory in Iowa City, Iowa, using methods described by Guy (1977). Two samples were collected from each stream site using the multiple equal-width-increment (MEWI) method (Edwards and Glysson, 1999, p. 75). Each stream cross section was
sampled at five equally spaced locations. The sampler was positioned on the streambed at each location for 20 minutes in October 2001 when streamflow was low, and for 5 minutes in January and September 2002 when streamflow was much greater. Two transects were collected for a total of 10 subsamples for each sample. Subsamples were combined into one composite sample that was analyzed for total weight and particle-size distribution. The number of subsections, width of each subsection, time the sampler rested on the streambed, number of transects, and average streamflow during the sampling period were recorded.
Particle Size
Selected suspended-sediment samples were analyzed for the distribution of particle sizes. The quantity of material collected was, for most samples, insufficient for a full particle-size analysis. Therefore, samples were sieved according to Guy (1977) to determine the percentage of particles finer than sand — less than (<) 0.062 mm. However, at least one suspended-sediment sample from each stream site was analyzed for a more complete range of particle sizes by using the visual accumulation (VA) tube method (Guy, 1977). Each bed-load sample was analyzed for particle-size distribution by the USGS sediment laboratory in Iowa City using methods described by Guy (1977).
STREAMFLOW
A severe drought was occurring in western North Carolina during the study period. Rainfall at the National Oceanic and Atmospheric Administration’s

Streamflow 7
Figure 5. Long-term minimum and median daily-mean streamflow and daily-mean streamflow for water year 2001 at (A) the Little Tennessee River near Prentiss and (B) Cartoogechaye Creek near Franklin, North Carolina.
Figure 4. Total annual precipitation at the Franklin, North Carolina, Weather Station for 1990 – 2001, and the long-term average annual rainfall.
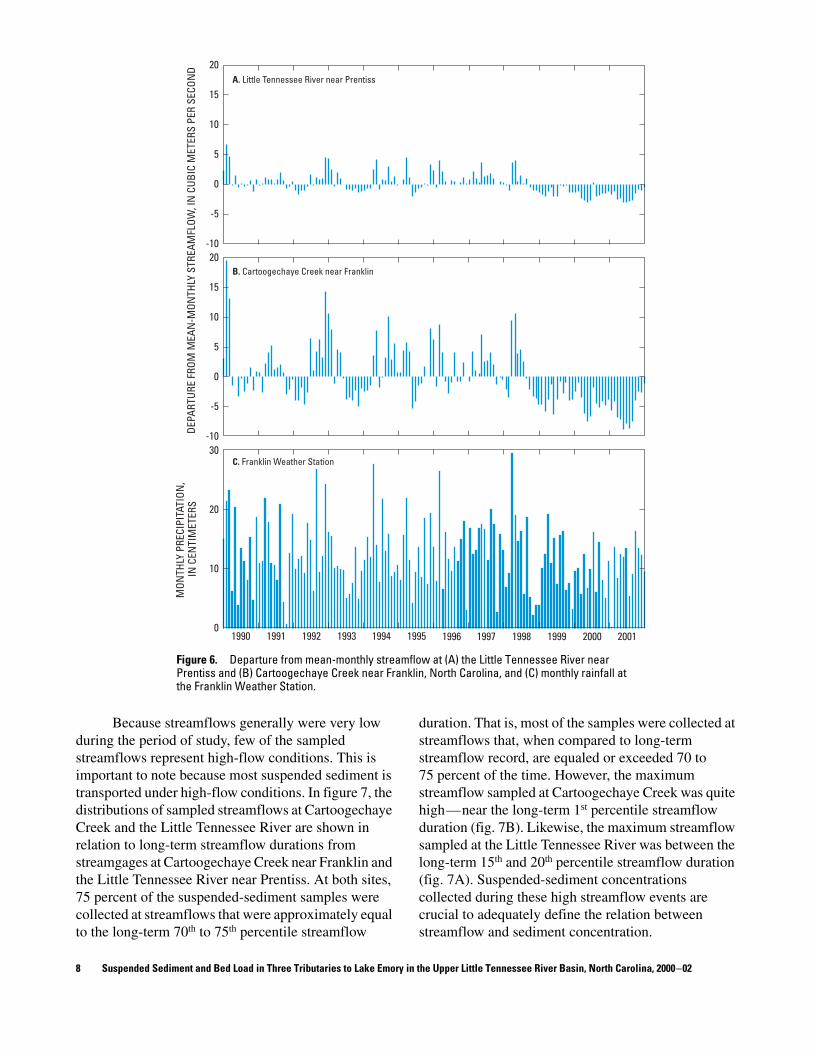
(NOAA) Franklin, N.C., weather station typically averages 134 centimeters (cm) per year based on data collected from 1949 through 2000 (Southeast Regional Climate Center, 2003). Rainfall amounts at the Franklin weather station are seasonally variable but declined steadily overall from about July 1998 (fig. 4). Ninety percent of the daily-mean streamflows in 2001 were less than the median daily-mean streamflow at the Little Tennessee River near Prentiss and Cartoogechaye Creek near Franklin (fig. 5), and the annual-mean stream-flow for 2001 was 50 percent of the long-term annual-mean streamflow (table 1). Moreover, new minimum values for daily-mean stream-flow were established for 12 and 18 percent of the days in 2001 at the Little Tennessee River near Prentiss and Cartoogechaye Creek near Franklin, respectively. Monthly departures from the long-term mean-monthly streamflows were almost entirely negative at these two sites beginning in July 1998 (fig. 6).
8 Suspended Sediment and Bed Load in Three Tributaries to Lake Emory in the Upper Little Tennessee River Basin, North Carolina, 2000 – 02
Figure 6. Departure from mean-monthly streamflow at (A) the Little Tennessee River near Prentiss and (B) Cartoogechaye Creek near Franklin, North Carolina, and (C) monthly rainfall at the Franklin Weather Station.
Because streamflows generally were very low during the period of study, few of the sampled streamflows represent high-flow conditions. This is important to note because most suspended sediment is transported under high-flow conditions. In figure 7, the distributions of sampled streamflows at Cartoogechaye Creek and the Little Tennessee River are shown in relation to long-term streamflow durations from streamgages at Cartoogechaye Creek near Franklin and the Little Tennessee River near Prentiss. At both sites, 75 percent of the suspended-sediment samples were collected at streamflows that were approximately equal to the long-term 70th to 75th percentile streamflow
duration. That is, most of the samples were collected at streamflows that, when compared to long-term streamflow record, are equaled or exceeded 70 to 75 percent of the time. However, the maximum streamflow sampled at Cartoogechaye Creek was quite high — near the long-term 1st percentile streamflow duration (fig. 7B). Likewise, the maximum streamflow sampled at the Little Tennessee River was between the long-term 15th and 20th percentile streamflow duration (fig. 7A). Suspended-sediment concentrations collected during these high streamflow events are crucial to adequately define the relation between streamflow and sediment concentration.

Streamflow 9
Figure 7. Distributions of sampled streamflows at (A) the Little Tennessee River and (B) Cartoogechaye Creek in relation to long-term streamflow durations from streamgages at the Little Tennessee River near Prentiss and Cartoogechaye Creek near Franklin, North Carolina.
Estimation of Streamflow in the Cullasaja River
Record from a discontinued streamgage at Cullasaja River at Cullasaja, which has a drainage area 12 km2 less than the drainage area near Franklin (table 1), provided daily-mean streamflow that was compared to coincidental daily-mean streamflow at streamgages at Cartoogechaye Creek near Franklin and the Little Tennessee River near Prentiss to assess whether either of these streamgages could be used as an index gage. An index gage was needed to estimate streamflow during the study period for the Cullasaja River near Franklin. The most recent year for which
coincident daily-mean streamflow data were available for these three sites was water year1 1971. Streamflow was compared for water years 1970 – 71 (fig. 8). Equations relating daily-mean streamflow at the index sites to daily-mean streamflow at the Cullasaja River at Cullasaja were determined by means of ordinary least-squares linear regression (table 2). The greater scatter about the regression line and the lower coefficient of determination (R2) for Cartoogechaye Creek near
1 Water year is the period October 1 through September 30 and is identified by the year in which the period ends.

10 Suspended Sediment and Bed Load in Three Tributaries to Lake Emory in the Upper Little Tennessee River Basin, North Carolina, 2000 – 02
Figure 8. Relation of daily-mean streamflow in the Cullasaja River to daily-mean streamflows at Cartoogechaye Creek near Franklin and the Little Tennessee River near Prentiss, North Carolina, for water years 1970 – 71.

Streamflow 11
Franklin indicate that Cartoogechaye Creek is a poorer index gage for the Cullasaja River than is the Little Tennessee River near Prentiss.
During the study, instantaneous streamflow was measured seven times at the Cullasaja River near Franklin at streamflows ranging from 1.77 to 21.0 cubic meters per second (m3/s; table 3). These instantaneous streamflow measurements were compared to simultaneous instantaneous streamflow determined from the streamgage record at the potential index sites (table 3; fig. 9). Instantaneous streamflows at the index sites were related to instantaneous streamflow at the Cullasaja River near Franklin using ordinary least-squares linear regression (table 2).
As in the 1970 – 71 relations (fig. 8; table 2), the greater scatter about the regression line and the lower R2 value for Cartoogechaye Creek near Franklin indicate that Cartoogechaye Creek is a poorer index gage for the Cullasaja River than is the Little Tennessee River near Prentiss. The slope and intercept of the 2001 – 02 relation for the Little Tennessee River near Prentiss are very similar to the slope and intercept of the 1970 – 71 relation. The slight offset of the 2001 – 02 regression relation compared with the 1970 – 71 relation is due, in part, to the difference in the drainage areas of the Cullasaja River at Cullasaja (1970 – 71 relation) and the Cullasaja River near Franklin (2001 – 02 relation; table 1). For example, when
Table 2. Regression equations relating streamflow at the two Little Tennessee River basin index sites to streamflow in the Cullasaja River, North Carolina[N, number of observations; R 2, coefficient of determination; P value, probability that the slope is equal to zero; Qcc, streamflow, in meters per second, at the Cullasaja River at Cullasaja; Qcf, streamflow, in meters per second, at the Cullasaja River near Franklin; InQi, natural log of streamflow, in meters per second, at the index gage]
Type of streamflow record N Regression equation R 2P value for the slope
Little Tennessee River near PrentissDaily mean, 1970 – 71 730 Qcc = e0.98(InQi)–0.46 0.9242 0.0000
Instantaneous, 2001 – 02 7 Qcf = e1.014(InQi)–0.45 0.9886 0.0000
Cartoogechaye Creek near FranklinDaily mean, 1970 – 71 730 Qcc = e0.85(InQi)–0.70 0.8159 0.0000
Instantaneous, 2001 – 02 7 Qcf = e0.83(InQi)–0.75 0.8834 0.0016
Table 3. Relation of streamflow measured at the Cullasaja River to streamflow at Cartoogechaye Creek near Franklin and the Little Tennessee River near Prentiss, North Carolina, during water years 2001 and 2002[Water year is the period October 1 through September 30 and is identified by the year in which the period ends; %, percent]
Date Time
Instantaneous streamflow, in cubic meters per second
Predicted streamflow at Cullasaja River based on comparison of data for the study
period with data from the index gage (percent error)
Cartoogechaye Creek
Little Tennessee River near Prentiss
Cullasaja River
Cartoogechaye Creek
Little Tennessee River near Prentiss
03-14-2001 1030 3.20 9.03 6.00 5.56 (7%) 5.48 (9%)
05-02-2001 1050 1.90 5.12 3.88 3.60 (7%) 3.73 (4%)
06-22-2001 1220 1.13 3.06 1.77 2.35 (-33%) 1.97 (-11%)
08-31-2001 1030 1.05 3.06 1.86 2.20 (-18%) 2.19 (-18%)
09-25-2001 1130 2.32 12.32 7.70 4.26 (45%) 8.05 (-5%)
10-25-2001 1055 2.07 4.62 3.31 3.65 (-10%) 3.03 (9%)
01-23-2002 1523 19.7 32.0 21.0 25.1 (-20%) 21.1 (-1%)
12 Suspended Sediment and Bed Load in Three Tributaries to Lake Emory in the Upper Little Tennessee River Basin, North Carolina, 2000 – 02
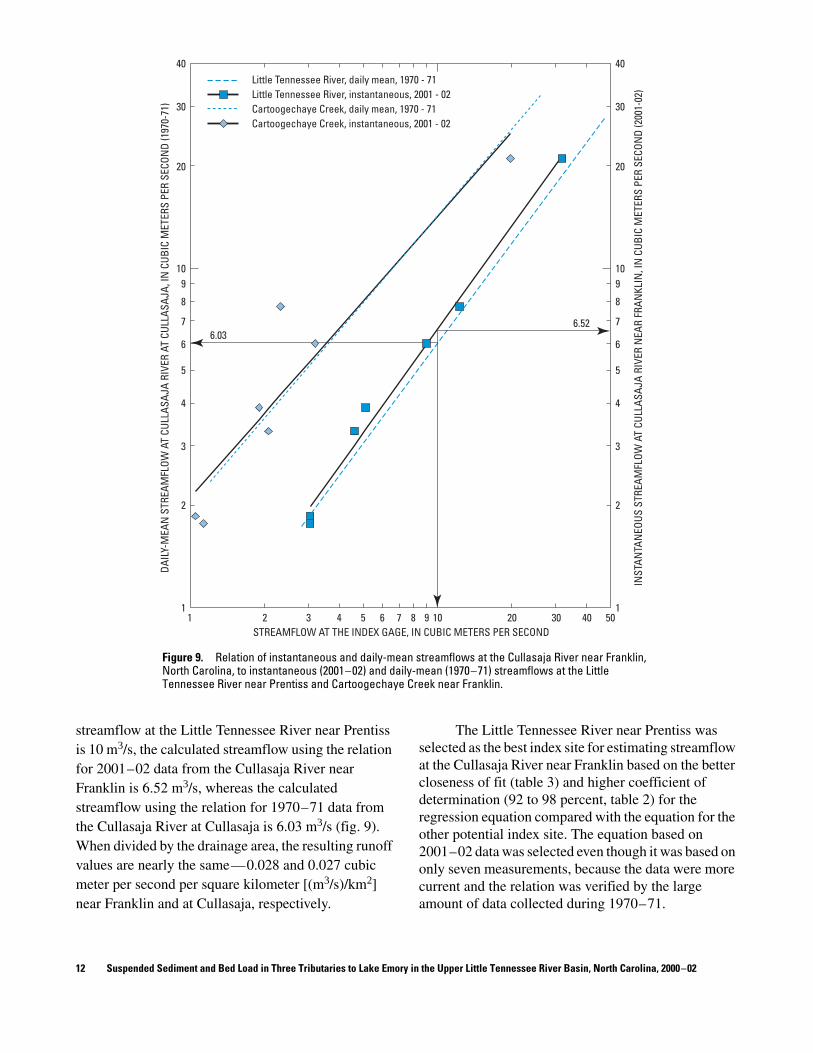
Figure 9. Relation of instantaneous and daily-mean streamflows at the Cullasaja River near Franklin, North Carolina, to instantaneous (2001 – 02) and daily-mean (1970 – 71) streamflows at the Little Tennessee River near Prentiss and Cartoogechaye Creek near Franklin.
streamflow at the Little Tennessee River near Prentiss is 10 m3/s, the calculated streamflow using the relation for 2001 – 02 data from the Cullasaja River near Franklin is 6.52 m3/s, whereas the calculated streamflow using the relation for 1970 – 71 data from the Cullasaja River at Cullasaja is 6.03 m3/s (fig. 9). When divided by the drainage area, the resulting runoff values are nearly the same — 0.028 and 0.027 cubic meter per second per square kilometer [(m3/s)/km2] near Franklin and at Cullasaja, respectively.
The Little Tennessee River near Prentiss was selected as the best index site for estimating streamflow at the Cullasaja River near Franklin based on the better closeness of fit (table 3) and higher coefficient of determination (92 to 98 percent, table 2) for the regression equation compared with the equation for the other potential index site. The equation based on 2001 – 02 data was selected even though it was based on only seven measurements, because the data were more current and the relation was verified by the large amount of data collected during 1970 – 71.
Suspended Sediment 13
Estimation of Porter’s Bend Dam Releases
No records exist of releases through the Porter’s Bend dam at Lake Emory, so the quantity of water discharged from the lake had to be estimated in order to estimate sediment load from the lake. Two methods were used to estimate an annual-mean water discharge from the dam. In the first method, streamflows in the Little Tennessee River near Prentiss, Cartoogechaye Creek near Franklin, and the Cullasaja River near Franklin were measured or estimated at 15-minute intervals for the study period, and the values were summed. The result was 396,800,000 m3 of streamflow for the study period (1.25 years), or an annual-mean streamflow of 10.0 m3/s, which was the assumed discharge through the dam. In the second method, the measured annual-mean streamflow at the Little Tennessee River at Needmore for 2001 (15.3 m3/s, table 4) was reduced by multiplying by a factor determined by the ratio of drainage areas (804 / 1,130 = 0.71) to estimate an annual-mean streamflow of 11 m3/s, which was the assumed discharge through Porter’s Bend dam.
Using the two estimated values, the annual runoff, in centimeters, was calculated and compared with annual runoff at the other sites (table 4). The estimated annual runoff for the dam obtained by using
the second method was reasonably close to runoff at other sites in the study area, so the annual-mean streamflow of 11 m3/s was judged to be a reasonable estimate for calculating suspended-sediment load.
SUSPENDED SEDIMENT
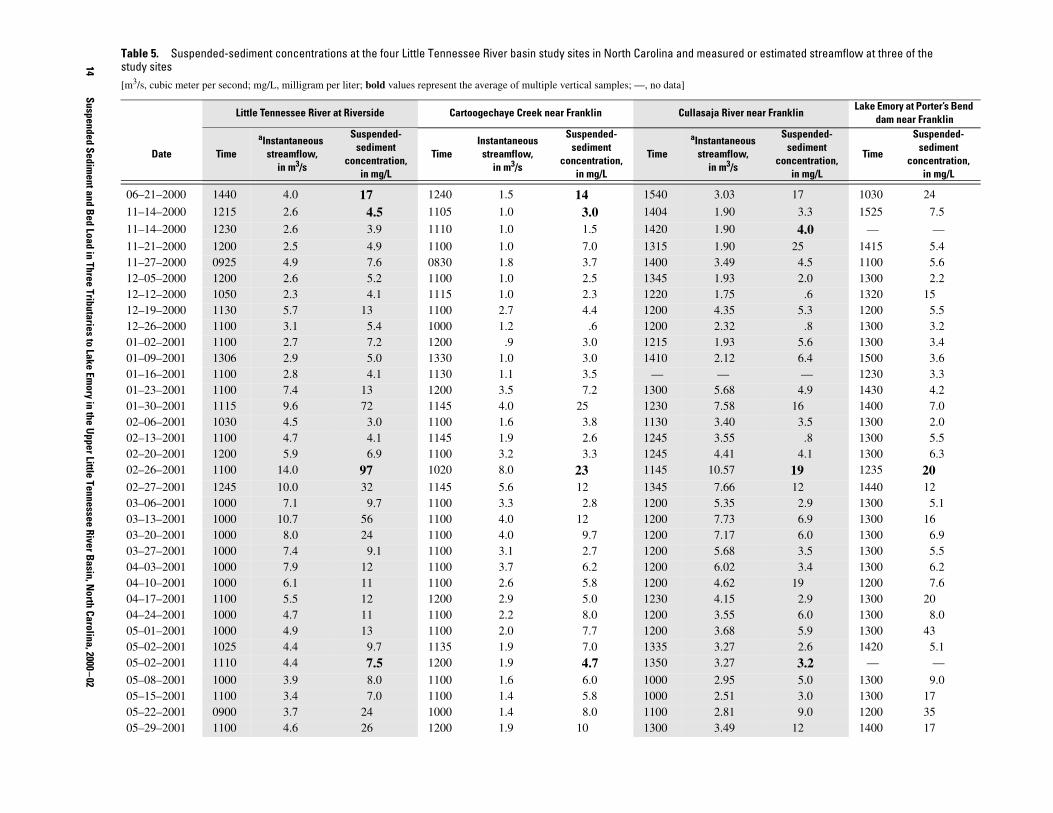
Samples for analysis of suspended-sediment concentration were collected once per week at each site from November 2000 to November 2001 (table 5). In addition, several samples were collected during targeted high-flow events. The distribution of measured concentrations at each site is shown in figure 10. The greatest median suspended-sediment concentration was measured at Porter’s Bend dam at Lake Emory (12 mg/L). Lowest median concentrations were measured at the Cullasaja and Cartoogechaye sites (5 and 4.9 mg/L, respectively), although the range of concentrations was large.
Load
Instantaneous suspended-sediment loads, in metric tons per day, were calculated from instantaneous streamflow and measured suspended-sediment concentration. A regression equation was developed for each site — the Little Tennessee River at Riverside, Cartoogechaye Creek, and the Cullasaja River — relating the natural log of streamflow to the natural log of suspended-sediment load at each site (fig. 11; table 6). The regression equations were used to calculate suspended-sediment loads for each 15-minute (unit value) interval at each site by using continuous streamflow record (Cartoogechaye Creek and the Little Tennessee River at Riverside) or estimates of streamflow (Cullasaja River). These unit-value load data were summed for each site. Each sum was adjusted by multiplying by the mean of the antilog of the regression residuals (Duan's smearing estimator) to account for retransformation bias (Duan, 1983; Koltun and others, 1994) to determine the total load for the study period (1.25 years). The total load for the period of study, annual load, and annual yield are shown in table 7.
As noted previously, suspended-sediment load could not be calculated for water discharged from Lake Emory because there was no record of streamflow out of the dam. Instead, suspended-sediment load was estimated by using the 11-m3/s estimate for average
Table 4. Streamflow statistics for the Little Tennessee River basin, North Carolina, study sites for the 2001 water year[Water year is the period October 1 through September 30 and is identified by the year in which the period ends; km2, square kilometer; m3/s, cubic meter per second; cm, centimeter]
SiteDrainage
area, in km2
Annual-mean streamflow,
in m3/s
Runoff, in cm
Little Tennessee River at Riverside
311 4.58 46.4
Little Tennessee River at Needmore
1,130 15.3 42.7
Cartoogechaye Creek near Franklin
148 2.09 44.5
Cullasaja River near Franklin
236 3.4 45.4
Porter’s Bend dam at Lake Emory
804 a10 / b11
a Estimated annual-mean streamflow by using method one.b Estimated annual-mean streamflow by using method two.
c39 / d43
c Calculated runoff by using estimated annual-mean streamflow from method one.
d Calculated runoff by using estimated annual-mean streamflow from method two.
14
Suspended Sediment and B
ed Load in Three Tributaries to Lake Emory in the U
pper Little Tennessee River Basin, N
orth Carolina, 2000 – 02
Table 5. Suspended-sediment concentrations at the four Little Tennessee River basin study sites in North Carolina and measured or estimated streamflow at three of the study sites [m3/s, cubic meter per second; mg/L, milligram per liter; bold values represent the average of multiple vertical samples; —, no data]
Little Tennessee River at Riverside Cartoogechaye Creek near Franklin Cullasaja River near FranklinLake Emory at Porter’s Bend
dam near Franklin
Date Time
aInstantaneous streamflow,
in m3/s
Suspended-sediment
concentration, in mg/L
TimeInstantaneous
streamflow, in m3/s
Suspended-sediment
concentration, in mg/L
Time
aInstantaneous streamflow,
in m3/s
Suspended-sediment
concentration, in mg/L
Time
Suspended-sediment
concentration, in mg/L
06–21–2000 1440 4.0 17 1240 1.5 14 1540 3.03 17 1030 24
11–14–2000 1215 2.6 4.5 1105 1.0 3.0 1404 1.90 3.3 1525 7.5
11–14–2000 1230 2.6 3.9 1110 1.0 1.5 1420 1.90 4.0 — —
11–21–2000 1200 2.5 4.9 1100 1.0 7.0 1315 1.90 25 1415 5.411–27–2000 0925 4.9 7.6 0830 1.8 3.7 1400 3.49 4.5 1100 5.612–05–2000 1200 2.6 5.2 1100 1.0 2.5 1345 1.93 2.0 1300 2.212–12–2000 1050 2.3 4.1 1115 1.0 2.3 1220 1.75 .6 1320 1512–19–2000 1130 5.7 13 1100 2.7 4.4 1200 4.35 5.3 1200 5.512–26–2000 1100 3.1 5.4 1000 1.2 .6 1200 2.32 .8 1300 3.201–02–2001 1100 2.7 7.2 1200 .9 3.0 1215 1.93 5.6 1300 3.401–09–2001 1306 2.9 5.0 1330 1.0 3.0 1410 2.12 6.4 1500 3.601–16–2001 1100 2.8 4.1 1130 1.1 3.5 — — — 1230 3.301–23–2001 1100 7.4 13 1200 3.5 7.2 1300 5.68 4.9 1430 4.201–30–2001 1115 9.6 72 1145 4.0 25 1230 7.58 16 1400 7.002–06–2001 1030 4.5 3.0 1100 1.6 3.8 1130 3.40 3.5 1300 2.002–13–2001 1100 4.7 4.1 1145 1.9 2.6 1245 3.55 .8 1300 5.502–20–2001 1200 5.9 6.9 1100 3.2 3.3 1245 4.41 4.1 1300 6.302–26–2001 1100 14.0 97 1020 8.0 23 1145 10.57 19 1235 2002–27–2001 1245 10.0 32 1145 5.6 12 1345 7.66 12 1440 1203–06–2001 1000 7.1 9.7 1100 3.3 2.8 1200 5.35 2.9 1300 5.103–13–2001 1000 10.7 56 1100 4.0 12 1200 7.73 6.9 1300 1603–20–2001 1000 8.0 24 1100 4.0 9.7 1200 7.17 6.0 1300 6.903–27–2001 1000 7.4 9.1 1100 3.1 2.7 1200 5.68 3.5 1300 5.504–03–2001 1000 7.9 12 1100 3.7 6.2 1200 6.02 3.4 1300 6.204–10–2001 1000 6.1 11 1100 2.6 5.8 1200 4.62 19 1200 7.604–17–2001 1100 5.5 12 1200 2.9 5.0 1230 4.15 2.9 1300 2004–24–2001 1000 4.7 11 1100 2.2 8.0 1200 3.55 6.0 1300 8.005–01–2001 1000 4.9 13 1100 2.0 7.7 1200 3.68 5.9 1300 4305–02–2001 1025 4.4 9.7 1135 1.9 7.0 1335 3.27 2.6 1420 5.105–02–2001 1110 4.4 7.5 1200 1.9 4.7 1350 3.27 3.2 — —
05–08–2001 1000 3.9 8.0 1100 1.6 6.0 1000 2.95 5.0 1300 9.005–15–2001 1100 3.4 7.0 1100 1.4 5.8 1000 2.51 3.0 1300 1705–22–2001 0900 3.7 24 1000 1.4 8.0 1100 2.81 9.0 1200 3505–29–2001 1100 4.6 26 1200 1.9 10 1300 3.49 12 1400 17
Suspended Sediment
15
06–05–2001 1100 3.8 18 1200 1.5 7.1 1300 2.92 8.5 1400 8.806–12–2001 1100 3.3 13 1200 1.3 6.0 1300 2.55 9.0 1400 1206–19–2001 1200 2.6 8.7 1300 1.0 2.5 1400 1.97 4.9 1500 1006–26–2001 1200 15.7 554 1300 18.2 933 1400 17.64 75 1500 4607–03–2001 1100 5.6 26 1200 2.0 14 1300 4.35 19 1400 1507–10–2001 1100 4.1 12 1200 1.4 6.1 1300 3.07 7.1 1400 1407–17–2001 1100 2.9 11 1200 1.1 3.6 1300 2.16 2.8 1400 2007–24–2001 1100 2.4 17 1200 .9 5.4 1300 1.79 2.0 1400 2307–31–2001 1100 5.4 497 1200 1.3 7.8 1300 8.53 9.0 1020 1007–31–2001 — — — — — — — — — 1400 2708–07–2001 1100 3.5 23 1200 1.2 5.3 1300 2.68 9.4 1400 6008–14–2001 1100 7.9 79 1200 2.0 27 1300 5.52 38 1400 4908–21–2001 1100 2.7 7.2 1200 1.0 2.5 1300 2.01 3.8 1400 2408–28–2001 1100 2.3 7.1 1200 1.0 2.6 1300 1.75 2.3 1400 1809–04–2001 1100 4.3 12 1200 1.5 4.2 1300 2.81 9.4 1400 1909–11–2001 1200 2.7 5.2 1300 1.0 1.7 1400 1.75 7.5 1500 6809–18–2001 1200 2.1 4.2 1300 .9 1.9 1400 1.40 1.4 1500 1609–25–2001 1200 12.1 67 1300 2.3 20 1400 7.70 21 1500 2509–26–2001 1055 6.5 19 1151 1.6 2.0 1351 4.88 3.0 1325 9.010–02–2001 1100 4.0 4.0 1200 1.0 1.1 1100 2.55 1.3 1400 1210–09–2001 1100 3.5 2.2 1200 1.0 .6 1300 2.27 .8 1400 1510–16–2001 1100 5.9 12 1200 1.5 3.5 1300 4.41 8.2 1400 1310–23–2001 1100 3.8 4.1 1200 1.2 3.0 1300 2.84 2.9 1400 8.910–24–2001 1400 3.6 4.0 1500 1.2 1.4 — — — — —
10–25–2001 — — — — — — 1200 3.31 2.5 1500 2.9
10–30–2001 1100 3.5 3.0 1200 1.1 2.2 1300 2.60 3.8 1400 1211–06–2001 1100 3.1 1.8 1200 1.1 .8 1300 2.36 1.5 1400 2811–13–2001 1100 2.9 2.9 1200 1.0 1.3 1300 2.19 .5 1400 1711–20–2001 1100 2.8 2.1 1200 1.0 2.5 1300 2.12 .8 1400 3111–27–2001 1100 4.3 6.5 1200 1.5 3.2 1300 3.23 2.8 1400 1801–20–2002 1130 13.4 87 — — — 1040 — 9.0 1225 3101–23–2002 1325 28.2 369 1110 21.7 324 1215 21.0 114 1417 9301–23–2002 1327 28.2 289 1112 21.7 302 1216 — 169 — —01–24–2002 1421 19.5 47 1015 10.6 5.9 1224 12.4 2.8 — —
a Estimated from the streamgage record at the Little Tennessee River near Prentiss.
Table 5. Suspended-sediment concentrations at the four Little Tennessee River basin study sites in North Carolina and measured or estimated streamflow at three of the study sites—Continued[m3/s, cubic meter per second; mg/L, milligram per liter; bold values represent the average of multiple vertical samples; —, no data]
Little Tennessee River at Riverside Cartoogechaye Creek near Franklin Cullasaja River near FranklinLake Emory at Porter’s Bend
dam near Franklin
Date Time
aInstantaneous streamflow,
in m3/s
Suspended-sediment
concentration, in mg/L
TimeInstantaneous
streamflow, in m3/s
Suspended-sediment
concentration, in mg/L
Time
aInstantaneous streamflow,
in m3/s
Suspended-sediment
concentration, in mg/L
Time
Suspended-sediment
concentration, in mg/L
16 Suspended Sediment and Bed Load in Three Tributaries to Lake Emory in the Upper Little Tennessee River Basin, North Carolina, 2000 – 02
Figure 10. Distribution of suspended-sediment concentrations at the four Little Tennessee River basin study sites in North Carolina.

Suspended Sediment 17
Figure 11. Relation of daily sediment load to instantaneous streamflow at (A) the Cullasaja River near Franklin, (B) Cartoogechaye Creek near Franklin, and (C) the Little Tennessee River at Riverside, North Carolina.

18 Suspended Sediment and Bed Load in Three Tributaries to Lake Emory in the Upper Little Tennessee River Basin, North Carolina, 2000 – 02
daily discharge from the dam (table 4) and a median measured suspended-sediment concentration of 12 mg/L (fig. 10). This resulted in an estimated annual suspended-sediment load of 4,200 t and yield of 5 t/km2 (table 7).
The greatest annual load and yield in 2001 (5,700 t and 18 t/km2, respectively) was in the Little Tennessee River at Riverside (table 7). The yield at Riverside far exceeded the yields at Cartoogechaye Creek, the Cullasaja River, and out of Lake Emory. By comparison, Simmons (1993) calculated mean-annual suspended-sediment yields, based on data from the 1970's, of 20 t/km2 for the Nantahala River near Rainbow Springs and 15 t/km2 for Cataloochee Creek near Cataloochee — two relatively pristine, forested
basins in the Blue Ridge Province of North Carolina.
In order to assess the significance of drought conditions during the study period on suspended-sediment loads, the 2001 data were compared with estimates of suspended-sediment load and yield, and the annual-mean streamflows at Cartoogechaye Creek near Franklin and the Little Tennessee River at Needmore between 1970 and 1979 (Simmons, 1993; table 7). Annual load and yield were an order of magnitude less during the study period compared to estimates from the 1970’s. This may be, in part, due to the higher streamflows during the period 1970 – 79 when annual-mean
streamflows were more than twice as high as those during the study period (table 7).
The decrease in suspended-sediment load compared to the 1970’s also may be a result of long-term change in the relation between suspended-sediment load and streamflow as a result of changes in land-use conditions in the basin. Annual suspended-sediment loads are highly variable and difficult to assess with only 1 year of recent data. The relation of suspended-sediment load to instantaneous streamflow for the period 1977 – 79 (when streamflow and suspended-sediment data are available) was compared to the relation of suspended-sediment load to instantaneous streamflow for the study period at Cartoogechaye Creek (fig. 12). During 1977 – 79, more
Table 6. Results of regression analyses relating the natural log of instantaneous suspended-sediment load to the natural log of instantaneous streamflow at three Little Tennessee River basin study sites in North Carolina[R 2, coefficient of determination; P value, probability that the slope is equal to zero]
Site InterceptSlope
coefficientR 2 P value
Mean of the
antilog of the
residuals
Cartoogechaye Creek
-1.44 1.98 0.72 0.00 1.57
Cullasaja River -2.23 2.09 .62 .00 1.44
Little Tennessee River at Riverside
-2.38 2.62 .80 .00 1.24
Table 7. Estimated suspended-sediment loads and yields at the three study sites and at sites sampled in 1970 – 79 in the Little Tennessee River basin, North Carolina [m3/ s, cubic meter per second; t, metric ton; t/km2, metric ton per square kilometer; —, no data]
Suspended sediment, 2000 – 01
Suspended sediment, 1970 – 79a
a From Simmons (1993).
SiteAnnual-mean streamflow,
in m3/s
Load, in t, 10 – 01 – 00 to
12 – 31 – 01
Annual load, in t
Annual yield,
in t/km2
Annual-mean streamflow,
in m3/s
Annual load, in t
Annual yield,
in t/km2
Little Tennessee River at Riverside
b 4.58
b Streamflow at the Prentiss, North Carolina, streamgage.
7,200 5,700 18 — — —
Cartoogechaye Creek near Franklin
2.09 1,300 1,000 7 4.39 10,000 81
Cullasaja River near Franklin
c 3.4 1,500 1,200 5 — — —
Porter’s Bend dam at Lake Emory
c 11 — 4,200 5 — — —
Little Tennessee River at Needmore
15.3 — — — 33.7 100,000 110
c Estimated.
Suspended Sediment 19
Figure 12. Relation of daily suspended-sediment load and instantaneous streamflow at Cartoogechaye Creek near Franklin, North Carolina, for 1977 – 79 and 2001.
samples were collected at high streamflow than during the study period when nearly 75 percent of the samples were collected at streamflows less than 2 m3/s because of drought conditions (fig. 12). Figure 12 indicates a decrease in the slope and intercept of the line determined by regressing streamflow on instantaneous load in 2001 compared with 1977 – 79. However, more samples are needed at streamflows greater than 10 m3/s to adequately define the suspended-sediment load and streamflow relation for the 2001 water year.
Particle Size
Selected suspended-sediment samples were analyzed for particle size (table 8). Based on the small number of samples collected during this study, particle sizes were predominately finer than sand (finer than 0.062 mm) at all of the sites (fig. 13). This, too, probably is an effect of low streamflows during the study. There was little variation in the median percentage of particles finer than 0.062 mm among the sites; however, as would be expected, the median

20 Suspended Sediment and Bed Load in Three Tributaries to Lake Emory in the Upper Little Tennessee River Basin, North Carolina, 2000 – 02
Table 8. Streamflow and suspended-sediment concentration and particle-size distributions in samples from the four Little Tennessee River basin study sites in North Carolina [m3/ s, cubic meter per second; mg/L, milligram per liter; mm, millimeter; —, no data]
Percentage of suspended-sediment particles finer than the indicated size
Site Date TimeInstantaneous
discharge, in m3/s
Suspended-sediment
concentration, in mg/L
0.062 mm
0.125 mm
0.250 mm
0.500 mm
1.00 mm
aLittle Tennessee River at Riverside
a Streamflows are estimated for the Little Tennessee River at Riverside and Cullasaja River near Frankllin.
04–24–01 1000 4.7 11 70 — — — —
05–08–01 1000 3.9 8 81 — — — —
05–22–01 0900 3.6 24 85 — — — —
07–31–01 1240 11.1 441 86 92 97 100 100
09–26–01 1055 7.6 19 85 88 100 100 100
01–20–02 1130 13.4 87 64 68 100 100 100
01–23–02 1325 35.7 369 64 72 82 100 100
Cartoogechaye Creek near Franklin
04–24–01 1100 2.2 8 75 — — — —
05–08–01 1100 1.6 6 64 — — — —
05–22–01 1000 1.4 8 81 — — — —
07–31–01 1120 1.3 b 3
b Concentration was too low for full particle-size analysis.
95 — — — —
09–26–01 1151 1.6 b 2 100 — — — —
01–20–02 0952 8.6 79 70 70 89 100 100
01–23–02 1110 21.7 324 80 87 97 100 100
aCullasaja River near Franklin
04–24–01 1200 3.8 6 71 — — — —
05–08–01 1000 3.1 5 70 — — — —
05–22–01 1100 2.6 9 60 — — — —
07–31–01 1350 8.5 5 90 — — — —
09–26–01 1351 4.9 b 3 100 — — — —
01–20–02 1040 — b 15 100 — — — —
01–23–02 1215 22.4 114 79 85 100 100 100
Lake Emory at Porter’s Bend dam near Franklin
04–24–01 1300 — 8 93 — — — —
05–08–01 1300 — 9 93 — — — —
05–22–01 1200 — 35 77 — — — —
07–31–01 1020 — b 10 100 — — — —
09–26–01 1325 — b 9 100 — — — —

Bed Material 21
Figure 13. Distribution of percentages of suspended-sediment particles finer than 0.062 millimeter at the four Little Tennessee River basin study sites in North Carolina.
percentage of fine suspended-sediment particles (< 0.062 mm) was greatest at Porter’s Bend dam.
BED MATERIAL
Sediment that is deposited on the streambed is bed material. Small particles can be resuspended during periods of elevated streamflow to produce suspended-sediment load (discussed previously). Larger particles that are too heavy to be suspended in the water column during elevated streamflows may move along the streambed as bed load.
Bed Load
Bed load is sediment that moves by sliding, rolling, or bouncing along on or near the streambed
(Edwards and Glysson, 1999). Bed load is difficult to accurately measure because (1) any sampling device placed on the bed may disturb bed-load flow and rate of movement and (2) bed load is highly temporally and spatially variable. The material collected with the bed-load sampler generally consists of material that is not collected by suspended-sediment sampling equipment.
Drought conditions during the study period limited opportunities for collecting bed-load samples because most bed load is carried during high-streamflow events. Three bed-load samples were collected at each stream site to estimate the amount of material that was being transported near the streambed and that was unaccounted for by the suspended-sediment sampler (tables 9, 10). Bed load was added to the suspended-sediment load calculated for a particular day to determine a total load.
22
Suspended Sediment and B
ed Load in Three Tributaries to Lake Emory in the U
pper Little Tennessee River Basin, N
orth Carolina, 2000 – 02
Table 9. Bed load and suspended-sediment load during three runoff events at three sites in the Little Tennessee River basin in North Carolina[Samples were collected and composited at two cross sections from five or six equally spaced locations in the cross section; —, no data; <, less than]
Daily-mean suspended-sediment load
Daily-mean bed load Daily-mean total
sediment load,
in metric tonsDate Time
Discharge, in cubic
meters per second
Stream width, in meters
Width of each section,
in meters
Sampling time at each section,
in seconds
Metric tonsMetric tons per square kilometer
Metric tonsMetric tons per square kilometer
Little Tennessee River at Riverside (0349998425)10–24–01 1305 4.3 6.7 1.34 1200 1.5 0.005 0.5 0.002 2.0
01–24–02 1421 19.4 5.8 3.81 180 79 .25 47 0.15 126
09–26–02 1538 29.4 19.2 1.16 300 — — 42 0.14 —
Cartoogechaye Creek near Franklin (03500240)10–24–01 1530 1.05 3.3 0.64 1200 0.13 0.001 0.004 <0.001 0.13
01–24–02 1015 10.6 4.4 2.89 180 5.5 .037 3.3 .012 8.8
09–26–02 1106 15.5 15.8 .88 300 — — 5.1 .034 —
Cullasaja River near Franklin (0350116510)10–25–01 1500 3.3 4.8 0.98 1200 0.72 0.003 0.07 <0.001 0.79
01–24–02 1224 12.4 5.8 1.16 180 3.2 .014 2.5 .010 5.7
09–26–02 1312 18.4 20.7 3.44 300 — — 5.3 .022 —
Summary 23
Not surprisingly, total load was significantly less during low flow than during high flow. Bed load was negligible at all three sites during low-flow conditions. Greatest daily bed load, in metric tons, and bed-load yield, in metric tons per square kilometer, was in the Little Tennessee River at Riverside during runoff events. Bed loads in Cartoogechaye Creek and the Cullasaja River were not substantially different from each other and were less than one-fifth the bed load and yield in the Little Tennessee River on the same day. Bed load accounted for 25 to 44 percent of the total sediment load in January 2002 when both bed and suspended-sediment loads were measured (table 9).
Particle Size
The bed-sediment particle-size distributions were similar at the two tributary sites for the dates sampled (table 10). The Little Tennessee River at Riverside transports slightly greater particle sizes than the tributaries. For the high-flow samples in January 2002 and September 2002, more than 60 percent of the particles were finer than 0.5 mm in the tributaries, whereas less than 38 percent of the particles were finer than 0.5 mm in the Little Tennessee River at Riverside.
SUMMARY
A study of sediment transport in the upper Little Tennessee River basin was begun in June 2000 in cooperation with Macon County. The purpose of the study was to characterize bed and suspended-sediment loads into Lake Emory from the main stem and major tributaries — Cartoogechaye Creek and the Cullasaja River. The study was designed to be completed in 1 year; however, because of extreme drought conditions in western North Carolina, some sampling continued into September 2002 in order to collect samples during high-flow conditions.
Weekly samples for suspended-sediment concentration were collected at the Little Tennessee River near Riverside, Cartoogechaye Creek near Franklin, the Cullasaja River near Franklin, and Lake Emory at the Porter’s Bend dam between November 2000 and November 2001. In addition, some samples were collected during targeted high-flow events and analyzed for particle-size distribution of suspended sediment. Three bed-load samples were collected at each stream site and analyzed to determine mass and particle-size distribution.
Annual suspended-sediment load was calculated based, in part, on continuous record of discharge for Cartoogechaye Creek near Franklin. Streamflow data
Table 10. Particle-size distribution in bed-load samples from three sites in the Little Tennessee River basin in North Carolina[m3/s, cubic meter per second; mm, millimeter]
Percentage of bed-load particles finer than size indicated
DateDischarge,
in m3/s0.062 mm 0.125 mm 0.250 mm 0.500 mm 1.00 mm 2.00 mm 4.00 mm 8.00 mm 16.0 mm
Little Tennessee River at Riverside (0349998425)10–24–01 4.3 0.2 0.4 8.5 59 90 97 99 100 100
01–24–02 19.4 0 0 4 29 74 96 99 100 100
09–26–02 29.4 .3 .7 4.6 38 91 100 100 100 100
Cartoogechaye Creek near Franklin (03500240)10–24–01 1.05 2.2 2.2 16 58 71 76 78 84 100
01–24–02 10.6 0 1 12 70 92 97 99 100 100
09–26–02 15.5 .5 1.5 17 80 93 95 96 97 100
Cullasaja River near Franklin (0350116510)10–24–01 3.3 .2 .8 13 66 79 85 90 93 100
01–24–02 12.4 0 0 10 73 94 98 99 100 100
09–26–02 18.4 .6 1.7 17 60 86 97 99 100 100
24 Suspended Sediment and Bed Load in Three Tributaries to Lake Emory in the Upper Little Tennessee River Basin, North Carolina, 2000 – 02
for the Little Tennessee River at Prentiss were used to estimate instantaneous streamflow record and suspended-sediment load at the Little Tennessee River at Riverside and Cullasaja River near Franklin. Streamflow at the Little Tennessee River at Needmore was used to estimate an annual-mean discharge for 2001 for releases from Lake Emory. Equations relating estimated streamflow to suspended-sediment concentration were developed and used to compute estimates of annual suspended-sediment loads.
Bed-load samples were collected in October 2001 during low-flow conditions and in January and September 2002 during stormwater-runoff conditions. Bed-load samples were analyzed for weight and particle-size distribution. Selected suspended-sediment samples were analyzed for particle-size distribution.
For the study period, the greatest annual load and yield of suspended sediment (5,700 t and 18 t/km2, respectively) was at the Little Tennessee River near Riverside. Much smaller annual yields were calculated for Lake Emory, the Cullasaja River, and Cartoogechaye Creek — 5, 5, and 7 t/km2, respectively.
In an earlier study in the 1970’s, the mean-annual suspended-sediment yield at Cartoogechaye Creek was 81 t/km2 and 110 t/km2 at the Little Tennessee River at Needmore, which indicates a decline in sediment loads. The mean-annual suspended-sediment yield for relatively pristine, forested sites in the North Carolina Blue Ridge Province was 20 t/km2 for the Nantahala River near Rainbow Springs and 15 t/km2 for Cataloochee Creek near Cataloochee. Drought conditions during the more recent study period probably were a factor in the small loads at these sites in 2001 compared to those in the 1970's and to forested reference sites. The annual-mean streamflow for the 2001 water year was about 50 percent of the long-term annual-mean streamflow (1944 – 2001), and high-flow events carry most of the annual sediment load.
REFERENCES
Duan, N., 1983, Smearing estimate-a nonparametric retransformation method: Journal of the American Statistical Association, v. 78, no. 383, p. 605 – 610.
Edwards, T.K., and Glysson, G.D., 1999, Field methods for measurement of fluvial sediment: U.S. Geological Survey Techniques of Water-Resources Investigations, book 3, chap. C2, 89 p.
Guy, H.P., 1977, Laboratory theory and methods for sediment analysis: U.S. Geological Survey Techniques of Water-Resources Investigations, book 5, chap. C1, 58 p.
Harding, J.S., Benfield, E.F., Bolstad, P.V., Helfman, G.S., and Jones, E.B.D., III, 1998, Stream biodiversity — The ghost of land use past: Proceedings of the National Academy of Sciences USA, v. 95, no. 25, p. 14843 – 14847.
Koltun, G.F., Gray, J.R., and McElhone, T.J., 1994, User's manual for SEDCALC, a computer program for computation of suspended-sediment discharge: U.S. Geological Survey Open-File Report 94 – 459, 46 p.
North Carolina Department of Environment, Health, and Natural Resources, Division of Environmental Management, 1992, North Carolina lake assessment report: Raleigh, N.C., North Carolina Department of Environment, Health, and Natural Resources, Report 92 – 02, 353 p.
North Carolina Division of Water Quality, 2000, Basinwide assessment report — Little Tennessee River: Raleigh, N.C., North Carolina Department of Environment and Natural Resources, 83 p.
———2002, Little Tennessee River basinwide water quality plan: Raleigh, N.C., North Carolina Department of Environment and Natural Resources, 129 p.
Rantz, S.E., and others, 1982, Measurement and computation of streamflow: U.S. Geological Survey Water-Supply Paper 2175, v. 1 and 2, 631 p.
Scott, M.C., Helfman, G.S., McTammany, M.E., Benfield, E.F., and Bolstad, P.V., 2002, Multiscale influences on physical and chemical stream conditions across Blue Ridge landscapes: Journal of the American Water Resources Association, v. 38, no. 5, p. 1379 – 1392.
Simmons, C.E., 1993, Sediment characteristics of North Carolina streams, 1970 – 79: U.S. Geological Survey Water-Supply Paper 2364, 84 p.
Southeast Regional Climate Center, 2003, Historical climate summaries for North Carolina: accessed on Jan. 16, 2003, at http://cirrus.dnr.state.sc.us/cgi-bin/sercc/cliMAIN.pl?nc3228
U.S. Geological Survey, 1997 to present, National field manual for the collection of water-quality data: U.S. Geological Survey Techniques of Water-Resources Investigations, book 9, chap. A1 – A9, 2 v. [variously paged].
![Applicability of bed load transport models for mixed‐size ...seismo.berkeley.edu/~kirchner/reprints/2015_126...mann, 2001, 2012; Yager et al., 2007, 2012a]. Bed load transport in](https://static.fdocuments.in/doc/165x107/60237d044cbd7d03851d5c4a/applicability-of-bed-load-transport-models-for-mixedasize-kirchnerreprints2015126.jpg)