Suspended Micro/ nanofiber Hierarchical Scaffolds for ... STEP Spinning ... PS 65.1mg.ml-1solution...
54
Suspended Micro/ nanofiber Hierarchical Scaffolds for Studying Cell Mechanobiology Ji Wang Thesis submitted to the faculty of the Virginia Polytechnic Institute and State University in partial fulfillment of the requirements for the degree of Master of Science In Macromolecular Science and Engineering Amrinder S. Nain, Chair Judy S. Riffle S. Richard Turner February 11 th , 2015 Blacksburg, Virginia Key words: nanofiber manufacturing, hierarchical scaffolds, cell geometry, single cell forces
Transcript of Suspended Micro/ nanofiber Hierarchical Scaffolds for ... STEP Spinning ... PS 65.1mg.ml-1solution...

Suspended Micro/ nanofiber Hierarchical Scaffolds for Studying Cell Mechanobiology
Ji Wang
Thesis submitted to the faculty of the Virginia Polytechnic Institute and State University in partial
fulfillment of the requirements for the degree of
Master of Science
In
Macromolecular Science and Engineering
Amrinder S. Nain, Chair
Judy S. Riffle
S. Richard Turner
February 11th, 2015
Blacksburg, Virginia
Key words: nanofiber manufacturing, hierarchical scaffolds, cell geometry, single cell forces

Suspended Micro/ nanofiber Hierarchical Scaffolds for Studying Cell Mechanobiology
Ji Wang
Abstract
Extracellular matrix (ECM) is a fibrous natural cell environment, possessing complicated micro-
and nano- architectures, which provides signaling cues and influences cell behavior. Mimicking
this three dimensional environment in vitro is a challenge in developmental and disease biology.
Here, suspended multilayer hierarchical nanofiber assemblies fabricated using the non-
electrospinning STEP (Spinneret based Tunable Engineered Parameter) fiber manufacturing
technique with controlled fiber diameter (microns to less than 100 nm), orientation and spacing in
single and multiple layers are demonstrated as biological scaffolds.
Hierarchical nanofiber assemblies were developed to control single cell shape (shape index from
0.15 to 0.57), nuclei shape (shape index 0.75 to 0.99) and focal adhesion cluster length (8-15
micrometer). To further investigate single cell-ECM biophysical interactions, nanofiber nets fused
in crisscross patterns were manufactured to measure the “inside out” contractile forces of single
mesenchymal stem cells (MSCs). The contractile forces (18-320 nano Newton) were found to scale
with fiber structural stiffness (2-100 nano Newton/micrometer). Cells were observed to shed debris
on fibers, which were found to exert forces (15-20 nano Newton). Upon CO2 deprivation, cells
were observed to monotonically reduce cell spread area and contractile forces. During the
apoptotic process, cells exerted both expansive and contractile forces. The platform developed in
this study allows a wide parametric investigation of biophysical cues which influence cell
behaviors with implications in tissue engineering, developmental biology, and disease biology.
iii
Acknowledgement
I’d like to express my gratitude to the people that made this work possible and provided guidance
over my time at Virginia Tech. My advisor, Professor Amrinder Nain for welcoming me as the
first student into his team, providing guidance and encouragement throughout the whole process,
and for allowing the freedom to explore interesting topics as they came up, regardless of the
outcome. Additionally, I’d like to thank the rest of my committee, Professor Judy Riffle and
Professor Richard Turner for their guidance and encouragement both in class and in the context of
my research. I’d like to thank Virginia tech and the Macromolecules and Interfaces Institute for
providing funding and support, and ICTAS and the NCFL facilities and equipment. I would also
like to thank other members in the STEP lab for their suggestions and collaboration. My work
would not have been possible without the support of Kevin Sheets, Puja Sharma, Colin Ng, Brian
Koons , Amritpal Gil and the rest of the STEP lab. Additionally, I’d like to thank Dr. Behkam’s
group for their sincere and generous help. I wish all of you good luck in your work in the future,
wherever it leads you. I acknowledge the financial support from Biomedical Engineering and
Mechanics Department and Macromolecules and Interfaces Institute during this study.

iv
Table of Content
Chapter 1 Introduction .......................................................................................................................... 1 1.1 Motivations ........................................................................................................................................ 1 1.2 A Brief Survey of Current Continuous Polymer Nanofiber Fabrication Approaches ............... .3 1.3 Focus of This Work ........................................................................................................................... 5 Chapter 2 Materials and Methods ......................................................................................................... 7 2.1 Polymer Solution Preparation .......................................................................................................... 7 2.2 STEP Spinning ................................................................................................................................... 7 2.3 Cell Culturing .................................................................................................................................... 7 2. 4 Fluorescence Microscopy ................................................................................................................. 8 2.5 AFM based Stiffness Measurement ................................................................................................. 8 2.6 SEM Characterization ...................................................................................................................... 9 2.7 Statistical Methods ............................................................................................................................ 9 Chapter 3 Results and Discussion......................................................................................................... 10 3.1 Non-electrospinning STEP Technique .......................................................................................... 10 3.2 Suspended Micro/Nanofiber Hierarchical Biological Scaffolds.................................................. .13 3.3 Contractile Cell Force Probes using Suspended Nanofiber Networks ....................................... 23 3.3.1 Fabrication and Characterization of Nanofiber Nets ............................................................... 23 3.3.2 Mesenchymal Stem Cell Contractile Force Measurement based on Nanofiber Nets ............. 30 Chapter 4 Conclusions and Future Work ........................................................................................... 36 References .............................................................................................................................................. 38 Appendix A: Copy Right Permission from Langmuir ....................................................................... 44 Appendix B: Copy Right Permission from Polymer Journal Nature ............................................... 45
v
List of Figures Figure 1: (A) Schematic illustration of STEP, (B) PS fiber diameters as a function of substrate rotating
speed ‘ω’ for 2000K (g.mol-1) PS 65.1mg.ml-1solution in p-xylene. (C-F) 3-D STEP fiber collections on
cube, cylinder, sphere and shape assemblies respectively. ....................................................................... 10 Figure 2: Schematic illustration of fiber formation process in STEP process. ........................................ 11 Figure 3: Crisscrossed STEP fibers made from varied polymer species. polystyrene (PS) (A), poly
(methyl methacrylate) (PMMA) (B)and fibrinogen (C) respectively. Scale bars represent 1 m in inserts
of A and C. ............................................................................................................................................... 12 Figure 4: STEP capability in achieving control in single and double layer structures. (A-D) Arrays of
8000, 500, 150 and 30nm diameter PS fibers, (E) relative angles between adjacent fibers, (F) fiber spacing
variation. .................................................................................................................................................. 14 Figure 5: Bottom up PS nanofiber assemblies using STEP :(A) 70nm fiber arrays on top of a 800nm
diameter fiber,(B) 800nm diameter fiber arrays in orthogonal configurations,(C) three layers of fiber
arrays configured at 60° angles with each other with d1=d2=400nm, d3=800nm, ,(D) a hierarchical fiber
assembly of different diameter fibers with controlled orientations d1=400nm,d2=800nm,d3=d4=70nm;
α12=α23=80°,α34=90°. ................................................................................................................................ 16 Figure 6: Schematic and SEM images of partial section of six layer bottom up hierarchical assembly with
numbers denoting the bottom up sequence of deposition. Highlighted frames in inserts I-III are PS,
PMMA and PU unit cells respectively. Insert IV and V demonstrates the bottom up deposition sequence.
Scale bars represent 10m in inserts I-V. ................................................................................................ 18 Figure 7: (A)-(D) Representative fluorescent images of C2C12 mouse myoblasts on divergent fibers with
varying angles (A) 0°, (B) 30°, (C) 60°, (D) 90°, (E-F) cell shape index and cell spread area as a function
of divergent angles ±SE. * shows statistical significance (P<0.01,n=60/category). Scale bars represent 20
m in (A)-(D). ......................................................................................................................................... 19 Figure 8: (A)-(D) Representative focal adhesion paxillin (green) and nucleus (blue) images of C2C12
mouse myoblasts on SL, SS, DL and DS hierarchical architectures, (E) FAC cluster length, and (F) cell
nucleus shape index of C2C12 mouse myoblasts on four conformation of hierarchical architectures ±SE.
* shows statistical significance (P<0.05, n=50/category). ........................................................................ 21 Figure 9: (A) Schematic illustration of SEM images of suspended STEP nanofiber nets. (B) SEM image
of an orthogonal patterns of bigger and smaller diameter fibers................................................................ 23 Figure 10: (A) Illustration of a suspended nanofiber deflected by an AFM cantilever. (B) A force vs
deflection curve of a single suspended PS nanofiber. .............................................................................. 26 Figure 11: Product of apparent stiffness kapp and L/D2
of PS nanofibers as a function of (D/L)2 ............ 27
Figure 12: (A) A schematic illustration of a “tie rod” model for cell contractile force calculation. (B) A
fluorescent cell image showing the “inside out” cell force measurement. ................................................ 28
Figure 13: Stiffness variation along the length of a suspended fiber with 200nm diameter and 320 m
length. Yellow dots represent the experimental value obtained by deflecting the fiber at different locations
using an AFM cantilever. .......................................................................................................................... 29 Figure 14: (A) Single fiber deflection with L=230mm, d=300nm, ϴ=40°, P1=18nN, P2=22nN, fiber
ϴ=40°, P1=150nN, P2=131
N=60. ........................................................................................................................................................ 31
Figure 15: (A) Time lapse of a MSC migration along two parallel fibers. Scale bars represent 5m. (B)
Time evolution of the force exerted by the leading edge and trailing edge. (C) Trailing and (D) leading
edge force evolution along fiber length in conjunction with stiffness variation edge. Scale bar represent 20
m. .................................................................................................................................................... ...... 32

vi
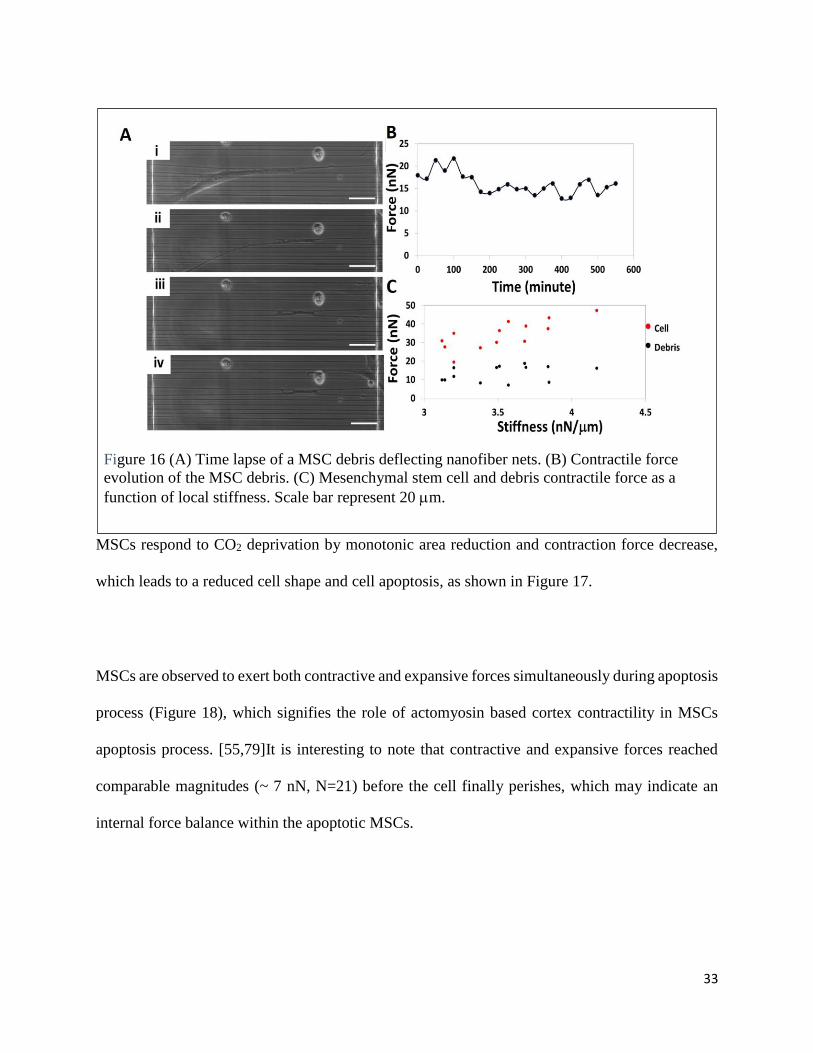
Figure 16: (A) Time lapse of a MSC debris deflecting nanofiber nets. (B) Contractile force evolution of
the MSC debris. (C) Mesenchymal stem cell and debris contractile force as a function of local stiffness.
Scale bar represent 20 m. ....................................................................................................................... 33 Figure 17: (A) (B) Time lapse of a MSC undergoing CO2 deprivation. (C) Cell area reduction and
contractile force evolution during CO2 deprivation process. ................................................................... 34 Figure 18: Mesenchymal stem cell forces evolution during apoptosis. (A)-(C) Time lapse images
corresponding to three stages of apoptosis. (D) Expanding and contracting forces during the cell apoptosis
process. ..................................................................................................................................................... 35

vii
List of Tables Table 1 PS fiber diameters as a function of solvent, solution concentration and molecular weight. ........ 12 Table 2 Control of fiber spacing at ω=40 rPS by manipulating Vt. .......................................................... 13 Table 3 Mechanical Properties of single PS nanofibers............................................................................ 27

viii
List of Equations Equation 1 ................................................................................................................................................. 25 Equation 2 ................................................................................................................................................. 25 Equation 3 ................................................................................................................................................. 25 Equation 4 ................................................................................................................................................. 27 Equation 5 ................................................................................................................................................. 28 Equation 6 ................................................................................................................................................. 29

ix
List of Abbreviations
STEP Spinneret based Tunable Engineered Parameter
ECM Extracellular matrix
MSC Mesenchymal Stem Cell
nm Nano meter
nN Nano Newton
m Micro meter
mm Millimeter
AFM Atomic Force Microscope
PS Polystyrene
PMMA Poly methyl methacrylate
PU Poly Urethane
DC Direct Current
RPS Rotation Per Second
ml Milliliter
l Microliter
g Microgram
SEM Scanning Electron Microscope
FAC Focal Adhesion Cluster
SI Shape Index

1
Chapter 1 Introduction
1.1 Motivations
Cell behavior is directly affected by extracellular matrix (ECM), which is primarily composed of
natural hierarchical assemblies of protein nanofibers.[1–3] The hierarchical architecture of the
surrounding ECM is comprised of individual fibrous proteins (30-70 nm diameter), which can
form bundles (100nm-microns in diameter).[4–10] These bundles of fibers are observed to be
aligned or seemingly randomly distributed in vivo.[11–14] Due to imaging limitations in vivo,
much of our current understanding about fundamental cell processes is derived from reductionist
in vitro platforms, such as flat substrates and gels, which aim to capture a complete in vivo
description replete with simultaneous biophysical and biochemical cues.[15–17]. In this regard,
significant work has been done to develop in vitro platforms. As an example, micro-patterned flat
surface approaches involve micro-fabrication of cell-adhesive patches on cell culture substrates
with high precision using soft lithography or photolithography.[18,19] The engineered surfaces
with the ability to constrain cell spreading to a specific cell-surface area have been shown to
dramatically affect cell proliferation, differentiation, migration and apoptosis.[20,21] However,
the complexity in preparation of the cell-adhering substrates coupled with their long term stability
and compatibility in cell-culture medium are typical problems requiring consideration. [22,23] On
the other hand, hydrogel-crosslinked networks possessing high water content have been
intensively utilized for in vitro cell experiments.[24] Cells embedded into hydrogels sense
confinement from both mechanical properties of the hydrogels and pericellular accumulation of
ECM proteins. However, tuning the mechanical properties of hydrogels can be difficult as it
involves a complex interplay of network properties, swelling characteristics, degradation rates and
deposition of ECM macromolecules.[25] While these platforms have indeed provided a deeper

2
understanding of cell-substrate interactions and mechanotransduction, interpretation from a cell-
ECM perspective is still challenging since these 2D and 3D structures are unable to capture
features of in vivo fibrous ECM, such as fiber alignment, diameter (curvature) and structure
bending stiffness (N/m).
Recently, nanofiber assemblies have been studied as bioassays providing 3D topology that better
mimics the architectures formed by fibrous ECM proteins. It is well known that besides chemical
composition and morphology of individual nanofibers, nanofiber orientation plays important roles
in guiding cellular responses.[26,27] Ramakrishna et al. collected aligned polymer nanofibers on
a rotating drum collector for vascular tissue engineering and they found that human coronary artery
muscle cells express a spindle-like shape and the cytoskeleton inside these cells was parallel to the
direction of the nanofibers.[28,29] Yang et al. seeded neural stem cells (NSCs) on aligned PLLA
nanofiber scaffolds and they found that the direction of NSC elongation and outgrowth was parallel
to the fibers and the NSC differentiation was higher on PLLA nanofibers than that on micro
fibers.[30] Lee et al. found that human ligament fibroblasts (HLF) on the aligned nanofibers were
spindle-shaped and synthesized significantly more collagen than those on random nanofiber
sheets.[31]
Suspended nanofibers possessing diameters closely resembling those of the native fibrous ECM
proteins provide a curved surface for cell attachment and have mechanical properties that can be
tuned to investigate biophysical influence on cell behaviors. Using suspended nanofiber
assemblies as a platform, Nain et al. demonstrated that cells on aligned and suspended fibers
exhibited higher migration speeds and changes in migration direction in the direction of diverging

3
fibers [32]. Recently, work by Sheets et al. has demonstrated that cells on suspended fibers have
focal adhesion cluster length ~4X longer than those on flat substrates, which may be the reason
why cells have different behaviors associated with fiber dimensionality.[33] In the context of
disease models, Sharma et al. has demonstrated that the bleb size and number density of blebs on
a cell inversely correlates with the area, with blebs on glioma cells eliminated at a cell spread area
of ~1600 µm2. [8]
The suspended nanofibers cause cells to react to surface curvature and dimensionality that flat
substrates inherently mask, thus providing a unique platform for investigating cell-fiber
interactions. We speculate that the topological parameters (fiber diameter and alignment) along
with the structural stiffness in suspended nanofiber assemblies elicits diverse cell behaviors as
measured by a large number of metrics, including cell shape and area, nucleus shape index, focal
adhesion cluster (FAC) length and cell contraction forces.
1.2 A Brief Survey of Current Continuous Polymer Nanofiber Fabrication Approaches
In vitro culture conditions mimicking fibrous ECM mechanics/topography have tremendous
potential for studying cellular behaviors for applications in tissue engineering and has been a target
for multiple nanofabrication techniques, such as nanolithography, micro/nano printing and
electrospinning technique.[34,35] Key factors impacting fiber use in cell studies include the ability
to precisely control fiber diameter and deposition (orientation and spacing). The recent
advancements in achieving control of fiber deposition include electrospinng (far-field
electrospinning (FFES), near-field electrospinning (NFES)) and direct drawing.

4
Electropinning is the most widely known method of forming continuous polymeric nanofibers. In
this process, polymer solution is pumped through a needle where an electric field extrudes polymer
fibers on a collecting target. In the past decade, the bioengineering community has seen rapid
growth in the use and improvement of electrospinning techniques to achieve nanofiber scaffolds
with control of fiber diameter and alignment. To create aligned nanofiber assemblies, a high speed
rotating drum or patterned electrodes are commonly used as a collector. In this regard, Li et al.
have demonstrated fabrication of aligned electrospun nanofibers using patterned electrodes,[36]
Katta et al. demonstrated aligned electrospun nanofibers on a high speed rotating drum,[37] and
Zussman et al. fabricated nanofiber arrays and crisscross patterns using a wheel-like bobbin
collector.[38,39] Similarly Teo et al. collected aligned nanofibers by placing two blades in line
with one another with a gap between them.[40] Dalton et al. used two rings placed in parallel to
collect highly aligned fibers that were deposited at the perimeters of the rings. [41] Although a
certain degree of fiber alignment has been achieved, these approaches have encountered
difficulties in spatially arranging fibers with accurately controlled diameter and spacing due to the
inherent electric instabilities.
On the other hand, NFES has demonstrated improved fiber patterning through reducing applied
voltage and the source-to-target distance. Bisht et al. deposited aligned polymeric nanofibers on
three dimensional substrates using low voltage (200 V) near-field electrospinning.[42] Sun et al.
demonstrated orderly collected nanofibers by using a 600 V voltage and a source-to-target
distances ~10mm. [43] The bending instabilities are reduced, resulting in better control of the
5
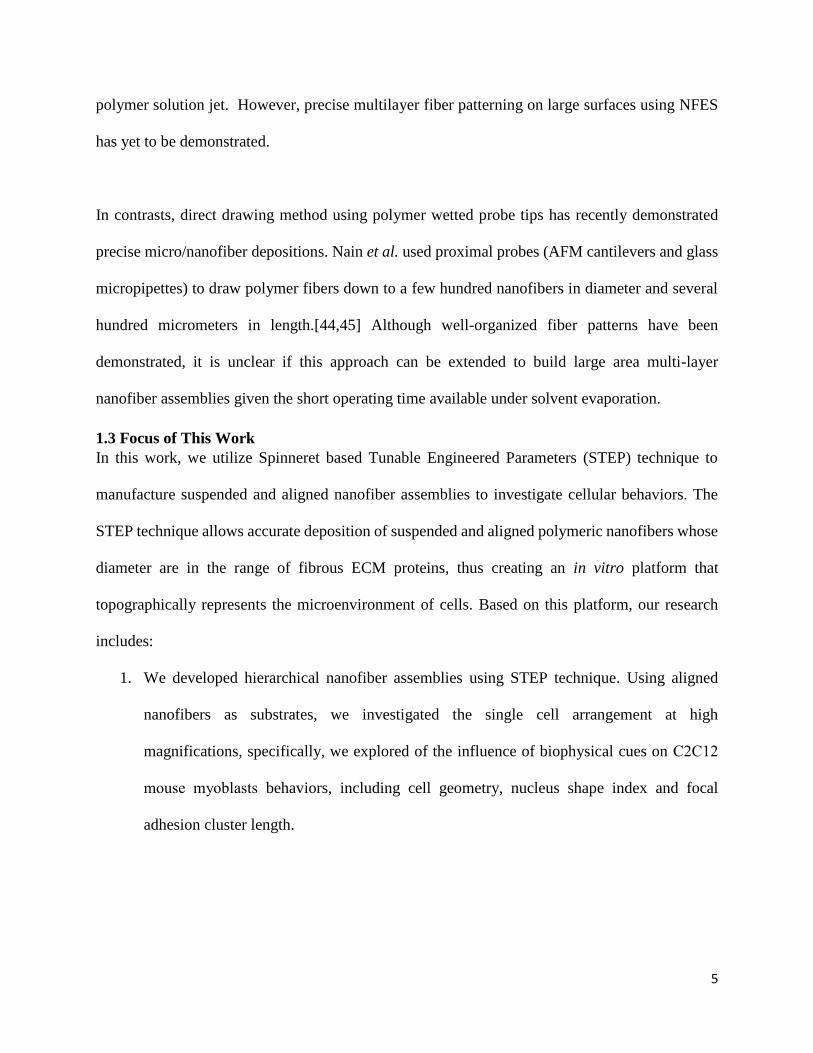
polymer solution jet. However, precise multilayer fiber patterning on large surfaces using NFES
has yet to be demonstrated.
In contrasts, direct drawing method using polymer wetted probe tips has recently demonstrated
precise micro/nanofiber depositions. Nain et al. used proximal probes (AFM cantilevers and glass
micropipettes) to draw polymer fibers down to a few hundred nanofibers in diameter and several
hundred micrometers in length.[44,45] Although well-organized fiber patterns have been
demonstrated, it is unclear if this approach can be extended to build large area multi-layer
nanofiber assemblies given the short operating time available under solvent evaporation.
1.3 Focus of This Work
In this work, we utilize Spinneret based Tunable Engineered Parameters (STEP) technique to
manufacture suspended and aligned nanofiber assemblies to investigate cellular behaviors. The
STEP technique allows accurate deposition of suspended and aligned polymeric nanofibers whose
diameter are in the range of fibrous ECM proteins, thus creating an in vitro platform that
topographically represents the microenvironment of cells. Based on this platform, our research
includes:
1. We developed hierarchical nanofiber assemblies using STEP technique. Using aligned
nanofibers as substrates, we investigated the single cell arrangement at high
magnifications, specifically, we explored of the influence of biophysical cues on C2C12
mouse myoblasts behaviors, including cell geometry, nucleus shape index and focal
adhesion cluster length.

6
2. We measured the contractile forces of cells attached to suspended fibers. Mesenchymal
stem cell contractile forces are measured based on suspended and aligned nanonets during
cell migration and the apoptosis process.

7
Chapter 2 Materials and Methods
2.1 Polymer Solution Preparation
All chemicals were used as received without further purification. Polystyrene (PS) of several
molecular weights (WM ) (860K, 1500K, and 2000K g.mol-1, Polymer Scientific, USA) were
dissolved at room temperature in p-xylene and tetrahydrofuran (THF) at varying concentrations
for one week prior to experiments. Poly(methyl methacrylate) (PMMA, WM = 540K g.mol-1,
Polymer scientific, USA) was dissolved in chlorobenzene at 134 mg.ml-1, and the polyurethane
(PU5719, Lubrizol Advanced Material, USA) was dissolved in DMF at 292 mg.ml-1. Bovine
fibrinogen fraction 1 from plasma (340 kDa, Sigma-Aldrich Chemical Co., USA) was dissolved
in HFP at 100 mg.ml-1.
2.2 STEP Spinning
The viscous polymer solutions were pumped through the 100 micron diameter micropipette
spinneret (Jensen Global, USA). The substrate was mounted onto a DC motor, which in turn was
mounted onto a motorized three degree of freedom micro-positioning stage (VP-25XA, Newport
Inc, USA). No voltage source was used in the experiments to eject polymer solution.
2.3 Cell Culturing
STEP scaffolds were mounted on glass-bottom six-well plates (MatTek Corp., Ashland, MA).
Fiber scaffolds were sterilized by adding 2 ml of 70% ethanol for 10 min, then coated with 2g.ml-
1fibronectin (Invitrogen, Carlsbad, CA).[8,33] C2C12 mouse myoblasts (American Type Culture
Collection, Manassas, VA) were cultured in Dulbecco’s Modified Eagle Medium (DMEM)

8
supplemented with 10% fetal bovine serum (FBS) and 1% penicillin/streptomycin (HyClone
Laboratories, Logan, UT). Cells were seeded onto the fiber scaffolds via 30 l droplets at a
concentration of 100,000 cells ml-1 and incubated at 37 °C and 5% CO2. Cells were then given 2–
6 h to attach onto the nanofibers. After 1 hour of seeding, 2 ml of medium was added to each well.
2. 4 Fluorescence Microscopy
F-actin stress fibers, focal adhesions and the nucleus in C2C12 mouse myoblasts were stained.
Cells were fixed in 4% paraformaldehyde, permeabilized in a 0.1% Triton X100 solution and
blocked in 10% goat serum. Primary goat antipaxillin antibodies (Invitrogen) were diluted 1:250
and incubated at 4 C° for 1 h. Secondary goat anti-rabbit antibodies conjugated to Alexa Fluor 488
(Invitrogen) were then added along with a 1:100 dilution of rhodamine phalloidin (Santa Cruz
Biotechnology, Santa Cruz, CA) and placed at room temperature for 45 min and protected from
light. DAPI counterstaining was performed by adding 300 nM DAPI (Invitrogen) for 5 min. The
substrates were then rinsed with PBS and observed using a Zeiss microscope. Fiber scaffolds were
kept hydrated in 1 ml phosphate buffered saline (PBS) during imaging.
2.5 AFM based Stiffness Measurement
Nanofiber stiffness was measured by deflecting the suspended nanofiber at the middle using an
AFM cantilever (DNP S-10 cantilevers of stiffness 0.175–0.7 Nm-1, Bruker, California) The
measurements were made in contact mode, and the stiffness of the cantilever was measured every
time before use.

9
2.6 SEM Characterization
For SEM (Zeiss, Leo 1550) analysis, the samples were placed on gold-coated stubs and sputter
coated.
2.7 Statistical Methods
Statistical analysis and graphing were performed using GraphPad software. One way ANOVA
testing with Tukey post testing comparing all pairs of data sets was performed. Bar graphs are
presented with standard error bars.
Note: Cell culturing and fluorescence microscopy were conducted by Kevin Sheets and Puja
Sharma.

10
Chapter 3 Results and Discussion
3.1 Non-electrospinning STEP Technique
In a typical STEP fiber fabrication process, polymer solution is extruded from a micropipette
and forms a droplet (Figure 1(A)). The droplet is brought in contact with a rotating substrate
mounted onto a three degree of freedom micro-positioning stage. Thus, in this set up, the substrate
undergoes both rotational (Vr) and translational (Vt) motions. As the rotating substrate translates
vertically, a polymeric filament is continuously extracted from the solution droplet and
subsequently deposited on the substrate in parallel configurations. Controlled fiber deposition on
various shapes (cube, cylinder, sphere, and shape assemblies) makes STEP an attractive technique
for achieving fiber assemblies on curved surfaces of varying geometries (Figure 1(C-F)).[46]
STEP fiber formation depends on material and processing parameters. Fiber diameter scales with
Figure 1(A) Schematic illustration of STEP, (B) PS fiber diameters as a function of substrate
rotating speed ‘ω’ for 2000K (g.mol-1) PS 65.1mg.ml-1solution in p-xylene. (C-F) 3-D STEP
fiber collections on cube, cylinder, sphere and shape assemblies respectively. Wang et al,
Langmuir, 2014, 30. Used with permission of American Chemical Society, 2015.

11
rotational speed (ω) as shown in Figure 1(B), and in this study, all fibers were obtained at a
constant rotating speed ω=40 rPS (substrate width=8 mm).
Smooth and uniform diameter fibers start to form as the solution concentrations approache critical
entanglement concentration Ce, which signify sufficient number of polymer chain entanglements
leading to a long range of elastic network required for fiber formation.[47] Fiber diameter was
controlled through a combination of material parameters, including solvent volatility (e.g. boiling
point), solution concentration and molecular weight of the polymer. Higher solution concentration,
low boiling point solvent and higher molecular weight lead to less deformable entangled polymer
chain networks (Figure 2), thus producing larger fiber diameters. Using these approaches, we have
been able to control fiber diameters in a fairly large range from 30 nm to 8 m (Table 1). Note that
the diameter of fibrous ECM proteins ranges from 50 nm (e.g. collagen fibrils) to microns (e.g.
collagen fiber bundles), which is well within the diameter range of STEP fibers.[48] Therefore, it
is possible to topographically mimic native ECM at different scales using STEP fibers.
Figure 2 Schematic illustration of fiber formation process in STEP process.
12
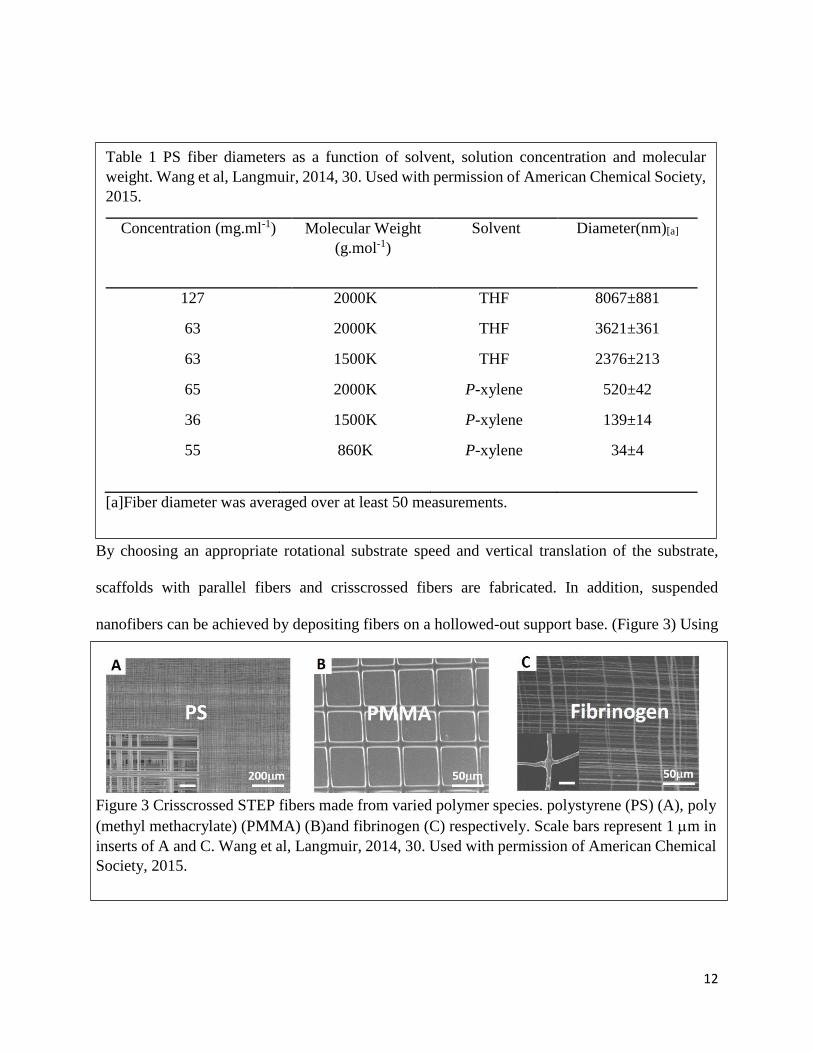
By choosing an appropriate rotational substrate speed and vertical translation of the substrate,
scaffolds with parallel fibers and crisscrossed fibers are fabricated. In addition, suspended
nanofibers can be achieved by depositing fibers on a hollowed-out support base. (Figure 3) Using
Table 1 PS fiber diameters as a function of solvent, solution concentration and molecular
weight. Wang et al, Langmuir, 2014, 30. Used with permission of American Chemical Society,
2015.
Concentration (mg.ml-1) Molecular Weight
(g.mol-1)
Solvent Diameter(nm)[a]
127 2000K THF 8067±881
63 2000K THF 3621±361
63 1500K THF 2376±213
65 2000K P-xylene 520±42
36 1500K P-xylene 139±14
55 860K P-xylene 34±4
[a]Fiber diameter was averaged over at least 50 measurements.
Figure 3 Crisscrossed STEP fibers made from varied polymer species. polystyrene (PS) (A), poly
(methyl methacrylate) (PMMA) (B)and fibrinogen (C) respectively. Scale bars represent 1 m in
inserts of A and C. Wang et al, Langmuir, 2014, 30. Used with permission of American Chemical
Society, 2015.

13
this technique, we have obtained aligned micro/nanofibers from various polymer species,
including polystyrene (PS), poly(methyl methacrylate) (PMMA), poly(ethylene oxide) (PEO), and
fibrinogen fibers.
3.2 Suspended Micro/Nanofiber Hierarchical Biological Scaffolds
STEP based fiber manufacturing provides a single stable filament from the pendant droplet,
leading to uniform diameter fibers which can be deposited precisely in ordered configurations,
thus enabling accurate control of fiber diameter, alignment and spacing. As no solution filament
spraying or branching occurs during STEP fabrication, the fiber diameter variation is well
controlled within 12%. (Table 1). In addition, since the filament is directly pulled out from the
solution droplet by the collecting substrate, the source-to-target distance, where instability is
typically found in electrospinning, is absent. The absence of filament whipping in STEP results in
a very high degree of alignment, where relative angles between fibers in an array are maintained
less than 3° for microfiber and less than 6° for sub 100 nm diameter fibers (Figure 4(A-E)).
Furthermore, STEP technique allows patterning ultrathin nanofibers of 30 nm in diameter (Figure
4(D)), which is comparable to the lowest diameter that can be aligned with
Table 2Control of fiber spacing at ω=40 rPS by manipulating Vt. Wang et al, Langmuir, 2014,
30. Used with permission of American Chemical Society, 2015.
Fiber Diameter (nm) Desired Spacing (m) Vt (mm/s) Average Spacing (m)[a]
8000 50 2.27 53.2
500 2 0.11 1.8
150 5 0.20 4.7
30 1 0.04 1.1
[a]Fiber spacing was averaged over 30 measurements in fiber arrays.
14
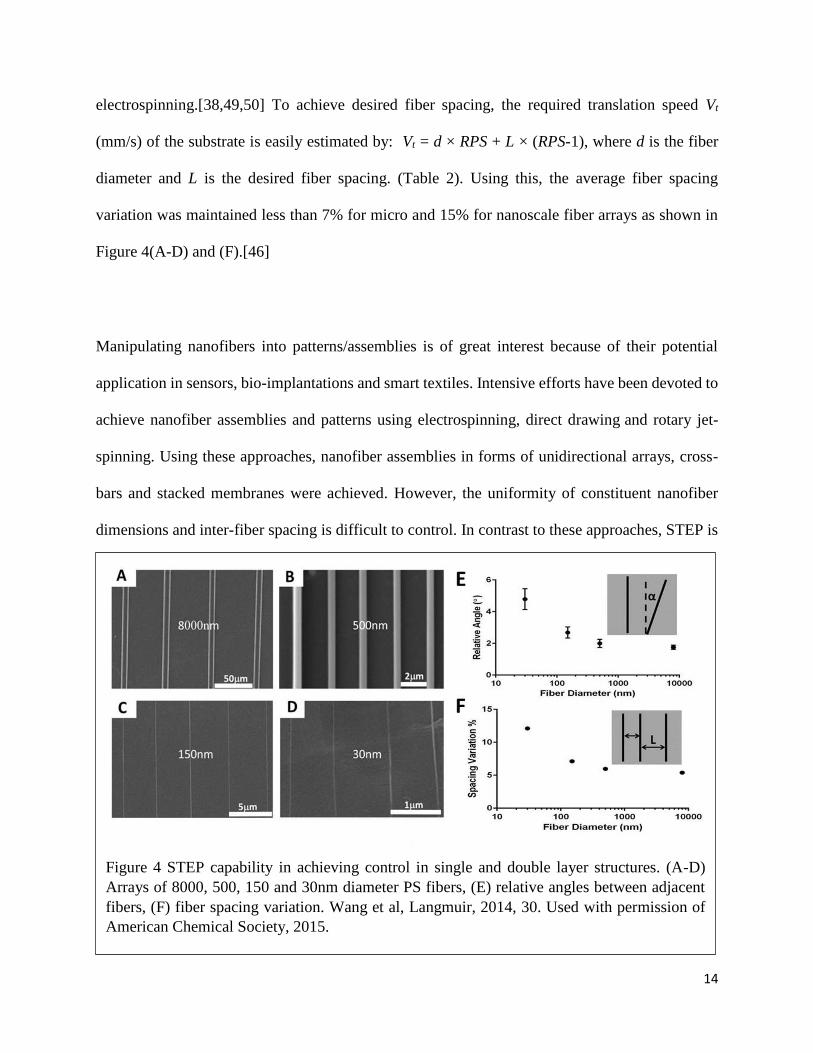
electrospinning.[38,49,50] To achieve desired fiber spacing, the required translation speed Vt
(mm/s) of the substrate is easily estimated by: Vt = d × RPS + L × (RPS-1), where d is the fiber
diameter and L is the desired fiber spacing. (Table 2). Using this, the average fiber spacing
variation was maintained less than 7% for micro and 15% for nanoscale fiber arrays as shown in
Figure 4(A-D) and (F).[46]
Manipulating nanofibers into patterns/assemblies is of great interest because of their potential
application in sensors, bio-implantations and smart textiles. Intensive efforts have been devoted to
achieve nanofiber assemblies and patterns using electrospinning, direct drawing and rotary jet-
spinning. Using these approaches, nanofiber assemblies in forms of unidirectional arrays, cross-
bars and stacked membranes were achieved. However, the uniformity of constituent nanofiber
dimensions and inter-fiber spacing is difficult to control. In contrast to these approaches, STEP is
Figure 4 STEP capability in achieving control in single and double layer structures. (A-D)
Arrays of 8000, 500, 150 and 30nm diameter PS fibers, (E) relative angles between adjacent
fibers, (F) fiber spacing variation. Wang et al, Langmuir, 2014, 30. Used with permission of
American Chemical Society, 2015.
15
capable of obtaining nanofiber assemblies with unique control of fiber dimensions, spacing and
orientations. Uniform diameter STEP fibers are configured in parallel arrays as they are collected
on substrates and the space between fibers is easily controlled by adjusting the substrate translation
speed. At constant rotating speed, fiber spacing is directly proportional to the translation speed.
Additionally, layers of fiber arrays can be deposited on top of previous layers at any desired angle.
Due to absence of electric fields, sub 100 nm diameter fibers can be easily deposited in the form
of evenly spaced uniform fiber arrays without being disturbed by spinning instabilities. In Figure

16
5(A) and (B), we demonstrate 70 nm diameter fiber arrays on top of a 800nm diameter fiber and a
crisscross fiber assembly of 800 nm diameter fibers (forming a matrix of rectangular unit cells).
[51]Notice that from Figure 5(A) to (B), the fiber spacing was increased from 1m to 16 m by
increasing translation speed from 0.02 mm/s to 0.32 mm/s. More complex fiber patterns were
achieved by stacking several layers of fiber arrays together while varying the inter-layer angles.
Figure 5(C) demonstrates an assembly of three layers of fiber arrays (diameters: d1=d2=400 nm,
d3= 800 nm) deposited at 60° angles to each other, creating equilateral triangles. In addition, large
Figure 5 Bottom up PS nanofiber assemblies using STEP :(A) 70nm fiber arrays on top of a
800nm diameter fiber,(B) 800nm diameter fiber arrays in orthogonal configurations,(C)
three layers of fiber arrays configured at 60° angles with each other with d1=d2=400nm,
d3=800nm, ,(D) a hierarchical fiber assembly of different diameter fibers with controlled
orientations d1=400nm,d2=800nm,d3=d4=70nm; α12=α23=80°,α34=90°. Wang et al, Polymer
Journal, 2013, 45. Used with permission of Nature Publishing group, 2015

17
diameter fiber networks can be used as basis of the assembly, over which sub 100 nm diameter
fiber networks form the top structures, thus creating a bottom up hierarchical structure. Figure 5(D)
demonstrates such a hierarchical assembly, which incorporates base layers made of medium
diameter fibers (d1=400 nm) and large diameter fibers (d2=800 nm) and top structure made of small
diameter fibers (d3=d4=70 nm) with controlled orientations (α12, α23, α34) and fiber spacing.
As shown in Figure 6, using STEP fibers as 1D building blocks, we then developed a suspended 6
layer scaffold (thickness ~12 µm) in which large diameter PS fibers (diameter~5 m) were first
deposited in two layers at unit cell area of 100×100m2.[46] The third and fourth layers of PMMA
fiber (diameter~1 m) were deposited at 50×50 m2 unit cell size on top of PS fibers and finally,
fifth and sixth layer of PU fibers (300 nm in diameter) were deposited on top of PMMA fibers at
10×10 m2 unit cell size. To maintain fiber conformations (fiber spacing and orientation), each
new layer was fused to the previously deposited layers at the intersections using an in-house
solvent vapor treatment method. Using STEP, there is potentially no limitation on the numbers of
layers that can be stacked on top of each other and the architectures of each layer (fiber material,
diameter and conformation) can be customized as required.

18
A large number of studies using flat or gel culture systems have highlighted the role of extrinsic
biophysical cues from the surrounding extra-cellular matrix (ECM) on cellular interactions.[52,53]
Topographic reactions of cells to micro-meter range features such as wells, islands, and pillars
have been intensively investigated based on micro-patterned approaches.[54] It has been shown
that cell shape, position and function can be regulated by attachment of cells on engineered
Figure 6 Schematic and SEM images of partial section of six layer bottom up hierarchical
assembly with numbers denoting the bottom up sequence of deposition. Highlighted
frames in inserts I-III are PS, PMMA and PU unit cells respectively. Insert IV and V
demonstrates the bottom up deposition sequence. Scale bars represent 10 m in inserts I-
V. Wang et al, Langmuir, 2014, 30. Used with permission of American Chemical Society,
2015.
19
substrates coated with different density of ECM.[55,56] However, cells require a full description
of 3D nanofibrous ECM to maintain their phenotypic shape and establish behaviour patterns.
Recently, electrospun nanofibrous scaffolds have been successfully produced from both synthetic
and natural polymers with diameter ranging from nanometer to micrometers.[34,57] Cell studies
on these scaffolds have revealed that cell attachment and spreading is affected by nanofiber
diameter and scaffolds porosity.[58,59] However, the role of suspended fiber spacing and
orientation in influencing cell behavior has yet to be demonstrated. Cells on suspended fibers react
to mechanical cues by wrapping around the suspended fibers, which has been shown by us to elicit
different cell behaviors.[8,33,60–62] Suspended cell-fiber culture systems afford a wide
parametric investigation of the role of topographical cues on cellular interactions. In this study, we
present the development of hierarchical nanofiber assemblies as a platform technology to control
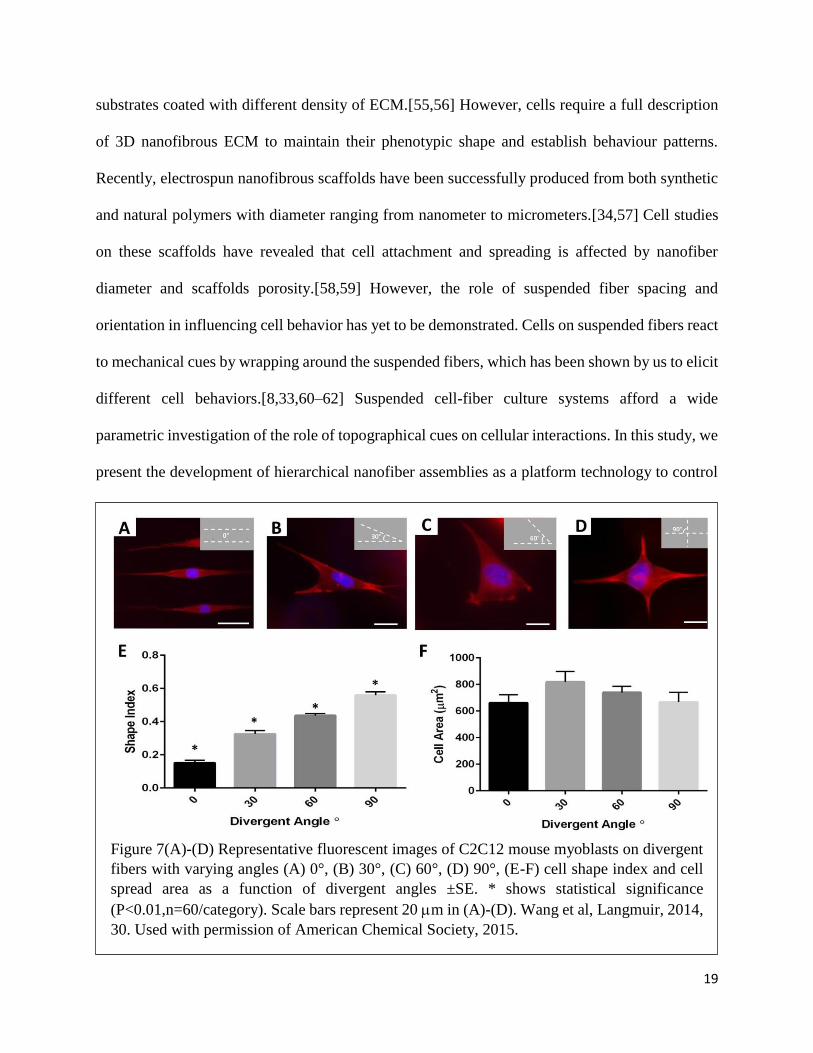
Figure 7(A)-(D) Representative fluorescent images of C2C12 mouse myoblasts on divergent
fibers with varying angles (A) 0°, (B) 30°, (C) 60°, (D) 90°, (E-F) cell shape index and cell
spread area as a function of divergent angles ±SE. * shows statistical significance
(P<0.01,n=60/category). Scale bars represent 20 m in (A)-(D). Wang et al, Langmuir, 2014,
30. Used with permission of American Chemical Society, 2015.
20
cell geometry with the aim of studying the arrangement of cellular cytoskeleton on suspended fiber
networks.
Geometric shapes of cells are known to play an important role in directing DNA synthesis, cell
growth and apoptosis.[63,64] To control cell geometric shapes, suspended nanofibers with varied
divergent angles were prepared. As shown in Figure 7 (A-D), C2C12 mouse myoblasts seeded on
suspended PS nanofibers (diameter~300nm) with divergent angles (0° to 30°, 60° and 90°),
attached and formed shapes that closely matched the shape of the underlying divergent nanofibers.
[46]The simplest spindle shape was formed on parallel fibers (0°), and with increase in the
divergent angle, cells spread on multiple fibers, forming polygonal shapes. Correspondingly, cell
shape index SI (2
4πASI=
p, where A is the cell area and p is the cell perimeter) demonstrated
pronounced increase (from 0.15 to 0.57) with increasing divergent angles (Figure 7 (E)).
Interestingly, as the cell shape varied on divergent nanofibers, the cell area was maintained
relatively constant (Figure 7 (F)). To the best of our knowledge, this is the first time that cell shapes
are precisely controlled through the divergent angles between suspended nanofibers.
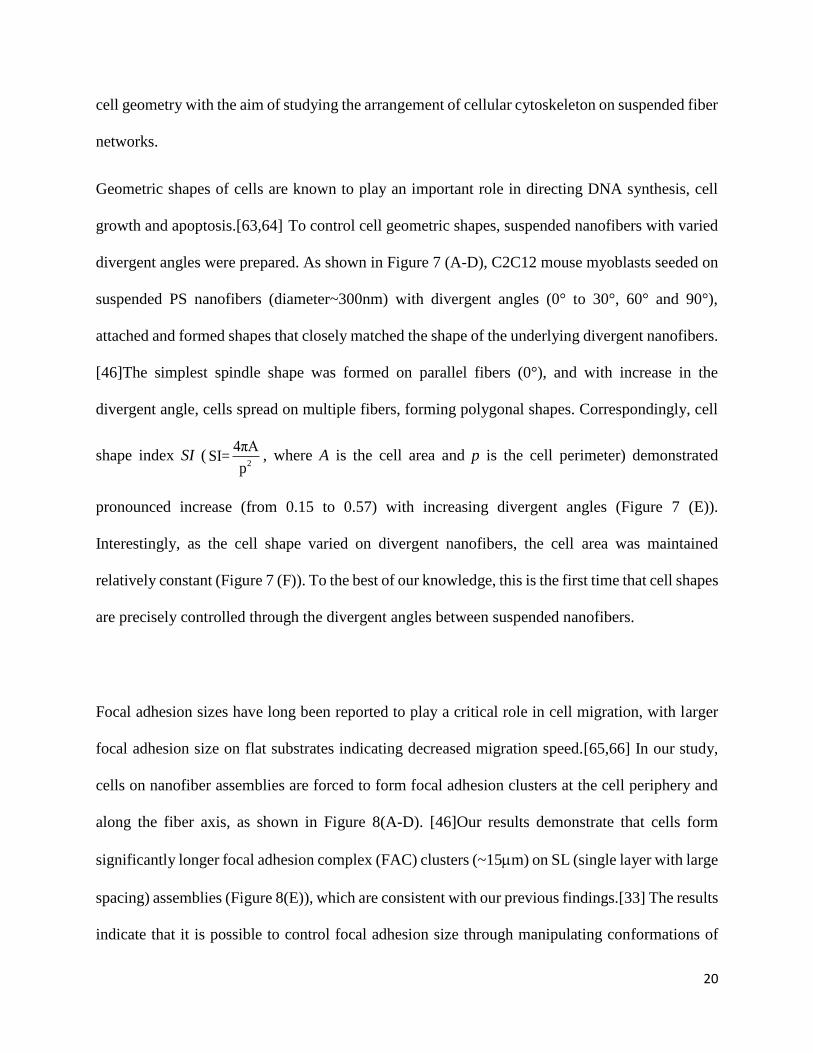
Focal adhesion sizes have long been reported to play a critical role in cell migration, with larger
focal adhesion size on flat substrates indicating decreased migration speed.[65,66] In our study,
cells on nanofiber assemblies are forced to form focal adhesion clusters at the cell periphery and
along the fiber axis, as shown in Figure 8(A-D). [46]Our results demonstrate that cells form
significantly longer focal adhesion complex (FAC) clusters (~15m) on SL (single layer with large
spacing) assemblies (Figure 8(E)), which are consistent with our previous findings.[33] The results
indicate that it is possible to control focal adhesion size through manipulating conformations of

21
nanofiber assemblies. Furthermore, the FAC cluster lengths are more than 8 m on all four
conformations SL (sing layer with large fiber spacing 20 m), SS ( single layer with small fiber
spacing 5 m), DL (double layer with large spacing 20 m) and DS (double layer with small
20m
20m20m
20m
A
SL SS
DL DS
FE * *
B
C D
Figure 8(A)-(D) Representative focal adhesion paxillin (green) and nucleus (blue) images of
C2C12 mouse myoblasts on SL, SS, DL and DS hierarchical architectures, (E) FAC cluster
length, and (F) cell nucleus shape index of C2C12 mouse myoblasts on four conformation of
hierarchical architectures ±SE. * shows statistical significance (P<0.05, n=50/category).
Wang et al, Langmuir, 2014, 30. Used with permission of American Chemical Society, 2015.

22
spacing 5 m) , which are significantly longer than previous reported FAC lengths on flat
substrates (1-6 m).[67,68]
Cellular geometry can elicit different nucleus shapes due to coupling of nucleus with the
cytoskeleton.[69,70] Nucleus shape deformation has been proposed to cause conformational
changes in chromatin structure and organization and directly affect gene expression and protein
synthesis.[71,72] On suspended fibers, as shown in Figure 8 (F), the nuclei became elongated
(nucleus shape index SI~0.75) as the cell formed spindle shapes on unidirectional nanofiber
assemblies (SL and SS), while on crisscross nanofiber assemblies (DL and DS), the nuclei
appeared rounded (nucleus shape index SI~0.99) within the polygonal-shaped cells. Our results
indicate that cell nucleus shape can be modulated by topographical cues of the nanofiber
assemblies, thus influencing nuclear functions and possible cell functions.
In conclusion, suspended nanofiber scaffolds with precisely controlled fiber orientation have been
developed using the STEP technique, which offers an opportunity to closely represent the native
environments aimed at recapitulating cell behaviors in vitro. The suspended nanofibers cause cells
to react to surface curvature and dimensionality that flat substrates inherently mask, thus enabling
a unique platform for investigating cell-fiber interactions as measured by a number of metrics such
as cell geometries, densities, spread areas, cluster length and cell nucleus shapes. The suspended
nanofiber assemblies provide cells with simultaneous 1, 2 and 3D cues, as cells are able to align
along the fiber axis (1D), spread between multiple fibers (2D) and wrap around fibers (3D). Our
results suggest that exquisite topographical cues from the nanofiber assembly can potentially
control cell behaviors and functions. We envision that exquisitely deposited suspended nanofibers

23
on varied three dimensional shapes could find wide applications in diverse fields such as wound
healing, organ regeneration and developmental and disease biology.
3.3 Contractile Cell Force Probes using Suspended Nanofiber Networks
3.3.1 Fabrication and Characterization of Nanofiber Nets
Stem cells possess a unique ability to differentiate into a number of committed lineages in response
to physical cues. Physical interactions with ECM induce cell forces, which influence critical cell
behaviors such as attachment, spreading, migration, and cell differentiation. Forces exerted by
single cells can range from pico Newtons to micro Newtons, which are measured by a variety of
existing platforms such as micropillar arrays and deformable flat gels. In the latter case,
displacements of beads embedded randomly throughout the gel are correlated to deformation
generated by cells. However, the relation between bead displacements and force is difficult to
compute. [73,74] An alternative strategy has been to use micro-dimensional force sensor arrays
Figure 9 (A) Schematic illustration of SEM images of suspended STEP nanofiber nets. (B)
SEM image of an orthogonal patterns of bigger and smaller diameter fibers.

24
(FSA) such as micropillars/posts. The deflection of the pillar/post caused by the attached cell is
a direct measurement of the local forces. [75,76] However, fabrication of the micropillars with
precisely controlled dimensions (cross-sections, height and density) is challenging and tracking
the deformation of posts can be time consuming. So far, both approaches have provided important
quantitative information on force distributions and has led to significant improvement in
understanding of spatial and temporal traction response of cells. However, these platforms are
unable to capture the physical features of in-vivo fibrous ECM, namely fiber diameter and fiber
bending stiffness (N/m). Based on the hierarchical nanofiber assemblies, we developed nanofiber
nets, which topographically and mechanically mimic the fibrous ECM and offer an approach to
measure cell forces conveniently.
Most of the cells do not only apply forces but also respond through cytoskeleton organization to
the resistance that they sense with regard to the stiffness of the matrix. Here, the nanofiber nets are
developed to quantify the effects of fiber stiffness on mesenchymal stem cell (MSC) forces. As
shown in Figure 9, nanofiber nets are achieved by fusing nanofibers with microfibers at the
intersections. The diameter, suspended length and spacing of nanofibers can be precisely
controlled using the STEP technique. Using the STEP technique, suspended and aligned micron
fibers (diameter 2-3 m) and nanofibers (diameter 200-1000 nm) were deposited in orthogonal
patterns and fused at the intersections using a custom solvent evaporation device. The nanofibers
were deposited precisely to control the suspended length from 50 to 300 m to observe measurable
fiber deflection.

25
The deflection of the suspended nanofibers is a direct measurement of the contractile cell forces.
To calculate cell contractile forces, mechanical properties (stiffness and modulus) of single
suspended nanofibers are characterized through an AFM based three point bending test. By
deflecting a single suspended nanofiber at the middle, a force-deflection curve can be achieved,
the slope of which gives the apparent stiffness value kapp of the nanofiber, as shown in Figure 10.
As proposed by Caenot et al., the apparent stiffness value of a nanofiber/nanowire can be expressed
as [77]:
3
192 24
5app T
EI Tk k k
L L
Equation 1
Where k and Tk are contributions of structure stiffness and tension in the fiber respectively. In our
study, we assume the tensile stress is uniformly distributed across the cross-section of the fiber,
and therefore we can re-write Eq 1 as:
Equation 2
Where D is the fiber diameter and R is the tensile stress built during the manufacturing process.
Multiplying both sides of Eq 2 with 2/L D , we have :
2 2 6/ 3 ( )
5
Rapp
Dk L D E
L
Equation 3
Reporting apparent modulus multiplied by 2/L D versus geometrical parameter 2( )D
L should give
a linear relation, as shown in Figure 11. The linear regression allows the determination of elastic
modulus E and tensile stress R (summarized in Table 3), as the slope is proportional to the elastic
2
3
6192
5
Rapp T
DEIk k k
L L

26
modulus E and the non-zero intercept is proportional to the tensile stress R . Note that the
determined elastic modulus of PS nanofiber is 0.97 GPa, which is comparable to the bulk material.
The cells were assumed to exert contractile loads through focal adhesions, which are located at
both edges of the cell, as is indicated by stained paxillin images (Figure 8).
Figure 10 (A) Illustration of a suspended nanofiber deflected by an AFM cantilever. (B) A
force vs deflection curve of a single suspended PS nanofiber.

27
For cell force calculation, we use the “tie rod” model as shown in Figure 12 (A). Suspended
nanofibers were considered as prismatic beams with “pin-pined” boundary conditions. We assume
the beam is under tension with small beam deflections. Under these conditions, the cell contractile
loads P1 and P2 can be obtained by solving the following equations:
1 1 2 21
sinh[ ( )] ( ) sinh[ ( )] ( )sinh[ ] sinh[ ]
sinh[ ] sinh[ ]
P L a P L a P L b P L ba a a a Y
S L SL S L SL
Equation 4
Table 3 Mechanical Properties of single PS nanofibers
Slope (MPa) Modulus (GPa) Intercept (MPa) Tensile Stress
(MPa)
9085.22 0.97 15.48 4.10
Figure 11 Product of apparent stiffness kapp and L/D2 of PS nanofibers as a function of
(D/L)2

28
1 1 2 22
sinh[ ] ( ) sinh[ ( )] ( )sinh[ ( )] sinh[ ]
sinh[ ] sinh[ ]
P a P L b P L b P L bL b a b b Y
S L SL S L SL
Equation 5
Where
S
EI
, E , I and S are fiber modulus and second moment of inertia and tensile load
respectively. Y1 and Y2 are beam deflections at locations a and b, L is the length of the beam.
. Figure 12(A) A schematic illustration of a “tie rod” model for cell contractile force
calculation. (B) A fluorescent cell image showing the “inside out” cell force measurement.

29
As mesenchymal stem cell stretched along the STEP nanonets, the smaller diameter fibers were
deflected. (Figure 12 (B)). The deflection at both ends of the cell and the respective angle of
deflection “Ɵ” (line drawing along the cell body, signifying high concentration of of F-actin stress
fibers) were measured.
The stiffness along a suspended fiber length was calculated from Eq 6:
1
sinh[ ]sinh[ ( )] ( )
sinh[ ]
pk
a ayL x L x
S L SL
Equation 6
The calculated results were verified by deflecting a suspended nanofiber at different locations
using an AFM cantilever, as shown in Figure 13. With known mechanical properties of the
polystyrene nanofibers (Young’s modulus ~0.97 GPa, stress built in the fiber ~ 4.1 MPa), the fiber
stiffness can be varied through adjusting diameter and suspended length. In our current study, the
Figure 13 Stiffness variation along the length of a suspended fiber with 200nm diameter and
320 m length. Yellow dots represent the experimental value obtained by deflecting the fiber
at different locations using an AFM cantilever.

30
fiber stiffness is varied from 1 nN/m (corresponding to dia~150 nm, length~300 m) to 300
nN/m (corresponding to dia~1000 nm, length~0 m). The stiffness range we used in this study
has covered the full range achieved by poly(dimethylsiloxane) (PDMS) micropillar arrays.
Although the stiffness of the micropillars can be manipulated by changing the diameter and length,
there is a lower limit of stiffness (~10 nN/m) achieved in this way due to the limitation of the
pillar length.[74] In contrast, nanofiber nets offer us a straightforward approach to adjust the
stiffness within a wide range of three orders of magnitude by controlling the fiber dimensions
(diameter and suspended length). Note that it is convenient for us to achieve nanofibers with
stiffness less than 1nN/m by increasing the fiber length.
3.3.2 Mesenchymal Stem Cell Contractile Force Measurement based on Nanofiber Nets
In our experiment, we observe MSCs contractile force ranging from 18 nN to 350 nN, depending
on the stiffness of the fiber. (Figure 14) Large diameter fiber with short suspended length leads to
larger contractile forces. In our study, cell forces increases with stiffness in the range of 2 nN-100
nN. The increase of cell force with stiffness suggests that the matrix strain may be sensed by cells
as tactile set point—cell contraction forces are regulated to achieve a certain deformation of the
matrix, which is supported by previous studies of Discher et al. [78]

31
Using STEP nanonets, the biophysical interactions of single MSC cells with suspended fibers
provide us with new insights into cell mobility, which can be coupled with a force response and
stiffness variation. In particular, the platform provides the ability to measure the forces exerted by
single MSC cells as they migrate along nanofibers.
Figure 14 (A) Single fiber deflection with L=230mm, d=300nm, ϴ=40°, P1=18nN, P2=22nN,
fiber stiffness 6nN/m. (B) Single fiber deflection with L= 120mm, d=800nm, ϴ=40°,
P1=150nN, P2=131 nN, fiber stiffness 82 nN/m. (C) MSC contractile forces as a function
of local stiffness, N=60.

32
As shown in Figure 15, MSCs adhered to parallel fibers exert higher forces at the leading edge
compared to the trailing edge. Furthermore, the evolution of contractile forces exerted by leading
and trailing edges scale with structural stiffness.
In our experiment, cells were observed to shed debris (Figure 16 (A)) and the contractile forces of
debris was recorded as shown in Figure 16 (B). It is interesting to note that MSC debris
continuously exerts contraction (15-20 nN) for about 10 hours. Compared to MSC cell body forces,
debris forces are lower and do not respond to the stiffness variation in the stiffness range 3 nN/m-
4.5 nN/m. (Figure 16 (C)).
Figure 15(A) Time lapse of a MSC migration along two parallel fibers. Scale bars represent 5
m. (B) Time evolution of the force exerted by the leading edge and trailing edge. (C) Trailing
and (D) leading edge force evolution along fiber length in conjunction with stiffness variation
edge. Scale bar represent 20 m.
33
MSCs respond to CO2 deprivation by monotonic area reduction and contraction force decrease,
which leads to a reduced cell shape and cell apoptosis, as shown in Figure 17.
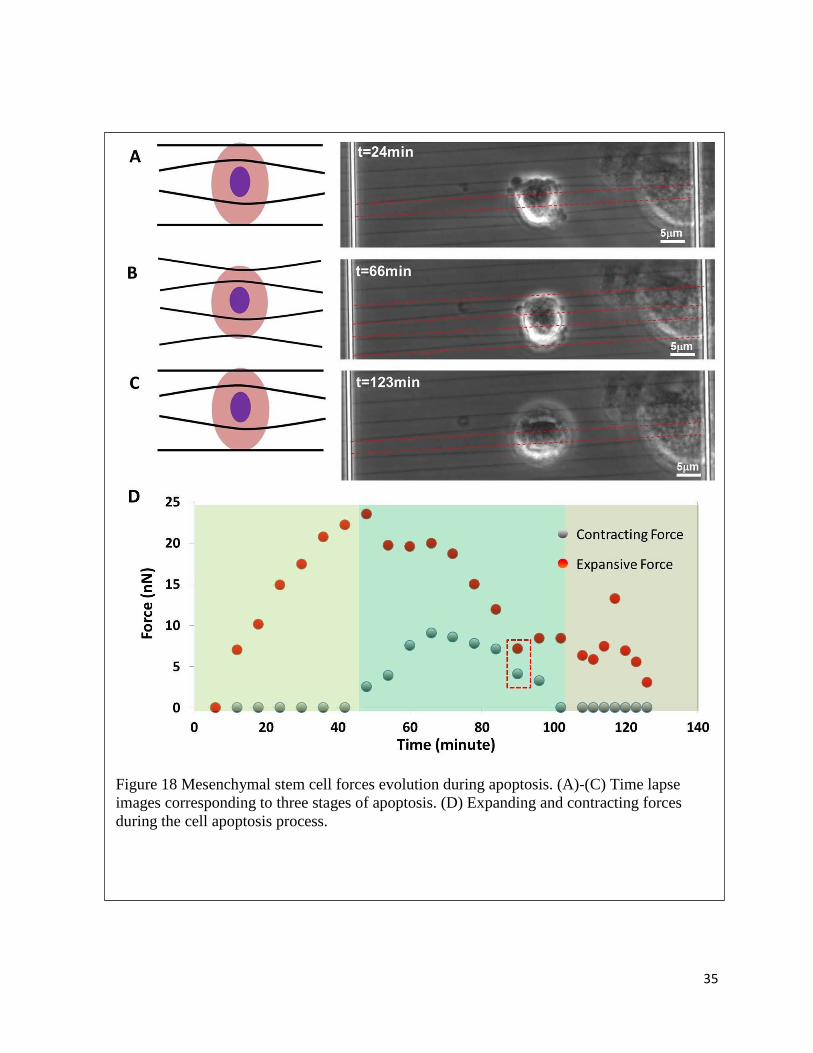
MSCs are observed to exert both contractive and expansive forces simultaneously during apoptosis
process (Figure 18), which signifies the role of actomyosin based cortex contractility in MSCs
apoptosis process. [55,79]It is interesting to note that contractive and expansive forces reached
comparable magnitudes (~ 7 nN, N=21) before the cell finally perishes, which may indicate an
internal force balance within the apoptotic MSCs.
Figure 16 (A) Time lapse of a MSC debris deflecting nanofiber nets. (B) Contractile force
evolution of the MSC debris. (C) Mesenchymal stem cell and debris contractile force as a
function of local stiffness. Scale bar represent 20 m.

34
In this study, we developed suspended nanofiber networks to probe mesenchymal stem cell forces.
Fibers possessing diameters closely resembling those of the native fibrous ECM proteins provide
a curved surface for cell attachment and have structural stiffness (N/m) that can be tuned to
investigate biophysical influence on cell behaviors. MSC contractile forces were found in the range
of 18-320 nN, which scale with fiber stiffness. Cell debris is able to exert forces of the magnitude
15-20 nN. Cell migration forces evolution is dictated by the stiffness gradient. During apoptosis
process, MSCs reduce cell spread area and exert both expansive and contractile forces. This work
provides design principles for tissue engineering efforts involving tissue regeneration, oncology,
developmental and disease biology.
Figure 17(A) (B) Time lapse of a MSC undergoing CO2 deprivation. (C) Cell area reduction
and contractile force evolution during CO2 deprivation process.
35
Figure 18 Mesenchymal stem cell forces evolution during apoptosis. (A)-(C) Time lapse
images corresponding to three stages of apoptosis. (D) Expanding and contracting forces
during the cell apoptosis process.

36
Chapter 4 Conclusions and Future Work
STEP technique allows collection of polymeric nanofibers of uniform dimension (diameter:sub
100nm to micrometers) in highly aligned configurations (relative angles between fibers were
maintained less than 6°) with well controlled inter-fiber spacing( <15%) . The STEP scaffolds
were used as a platform to study single cell behaviors.
For single cell arrangement, using double layer divergent (0°to 90°) suspended nanofiber
assemblies, we show precise quantitative control on cell geometry (change in shape index from
0.15 to 0.57 at similar cell areas). Furthermore, using unidirectional or crisscross patterns of sparse
and dense fiber arrays, we are able to control cell nucleus shape index (from 0.75 to 0.99) with
cells nearly doubling their focal adhesion cluster length(~15m) on widely spaced nanofiber arrays.
Single cell contractile forces were measured using a non-invasive “inside-out” STEP-based
nanofiber net platform, which topographically represent the microenvironment of cells.
Mesenchymal Stem Cells (MSCs) exerted contractile forces in range of 18nN to 320 nN which
scale with the fiber stiffness, while cell debris have the ability to exert 15-20nN contractile forces
on their immediate ECM. MSCs respond to CO2 depletion by decreasing cell area and reducing
contractile forces. MSCs are observed to exert both contractive and expansive forces
simultaneously during apoptotic process.
We demonstrate that suspended and aligned nanofibers with diameters in the range of ECM
proteins can cause cell to react to structural features, such as curvature, orientation and structural
stiffness (N m-1), thus provides a unique platform to investigate cell-ECM interactions.

37
In the future, force required to differentiate MSC cells can be measured and optimal biophysical
environmental conditions required to induce MSC differentiation can be identified through careful
selection of fiber diameter, suspended length and material. Optimization of ECM mimicking bio-
scaffolds using STEP technique may help in general to better exploit the therapeutic potentials of
stem cells. In addition, a better understanding of the mechanical transduction between single
cancer cells and their environment can be achieved by integrating the current platform with
microfluidic device.

38
References
[1] Guilak F, Cohen DM, Estes BT, Gimble JM, Liedtke W, Chen CS. Control of stem cell fate by
physical interactions with the extracellular matrix. Cell Stem Cell 2009;5:17–26.
doi:10.1016/j.stem.2009.06.016.
[2] Huebsch N, Arany PR, Mao AS, Shvartsman D, Ali OA, Bencherif SA, et al. Harnessing traction-
mediated manipulation of the cell/matrix interface to control stem-cell fate. Nat Mater
2010;9:518–26. doi:10.1038/nmat2732.
[3] Rosso F, Giordano A, Barbarisi M, Barbarisi A. From cell-ECM interactions to tissue engineering.
J Cell Physiol 2004;199:174–80. doi:10.1002/jcp.10471.
[4] Fernández M, Keyriläinen J, Serimaa R, Torkkeli M, Karjalainen-Lindsberg ML, Tenhunen M, et
al. Small-angle x-ray scattering studies of human breast tissue samples. Phys Med Biol
2002;47:577–92.
[5] Zoumi A, Yeh A, Tromberg BJ. Imaging cells and extracellular matrix in vivo by using second-
harmonic generation and two-photon excited fluorescence. Proc Natl Acad Sci U S A
2002;99:11014–9. doi:10.1073/pnas.172368799.
[6] Alexander DC, Hubbard PL, Hall MG, Moore E a, Ptito M, Parker GJM, et al. Orientationally
invariant indices of axon diameter and density from diffusion MRI. Neuroimage 2010;52:1374–
89. doi:10.1016/j.neuroimage.2010.05.043.
[7] Gritsenko PG, Ilina O, Friedl P. Interstitial guidance of cancer invasion. J Pathol 2012;226:185–
99. doi:10.1002/path.3031.
[8] Sharma P, Sheets K, Elankumaran S, Nain AS. The mechanistic influence of aligned nanofibers on
cell shape, migration and blebbing dynamics of glioma cells. Integr Biol (Camb) 2013;5:1036–44.
doi:10.1039/c3ib40073e.
[9] Ushiki T. Collagen fibers, reticular fibers and elastic fibers. A comprehensive understanding from
a morphological viewpoint. Arch Histol Cytol 2002;65:109–26.
[10] Montgomery H, Rustogi N, Hadjisavvas A, Tanaka K, Kyriacou K, Sutton CW. Proteomic
profiling of breast tissue collagens and site-specific characterization of hydroxyproline residues of
collagen alpha-1-(I). J Proteome Res 2012;11:5890–902. doi:10.1021/pr300656r.
[11] Conklin MW, Eickhoff JC, Riching KM, Pehlke CA, Eliceiri KW, Provenzano PP, et al. Aligned
collagen is a prognostic signature for survival in human breast carcinoma. Am J Pathol
2011;178:1221–32. doi:10.1016/j.ajpath.2010.11.076.
[12] Friedl P, Wolf K. Plasticity of cell migration: a multiscale tuning model. J Cell Biol 2010;188:11–
9.
[13] Petrie RJ, Doyle AD, Yamada KM. Random versus directionally persistent cell migration. Nat
Rev Mol Cell Biol 2009;10:538–49.

39
[14] Friedl P, Wolf K. Proteolytic interstitial cell migration: a five-step process. Cancer Metastasis Rev
2009;28:129–35. doi:10.1007/s10555-008-9174-3.
[15] Ekaputra AK, Prestwich GD, Cool SM, Hutmacher DW. Combining electrospun scaffolds with
electrosprayed hydrogels leads to three-dimensional cellularization of hybrid constructs.
Biomacromolecules 2008;9:2097–103. doi:10.1021/bm800565u.
[16] Tibbitt MW, Anseth KS. Hydrogels as extracellular matrix mimics for 3D cell culture. Biotechnol
Bioeng 2009;103:655–63. doi:10.1002/bit.22361.
[17] Falconnet D, Csucs G, Grandin HM, Textor M. Surface engineering approaches to micropattern
surfaces for cell-based assays. Biomaterials 2006;27:3044–63.
doi:10.1016/j.biomaterials.2005.12.024.
[18] Papenburg BJ, Vogelaar L, Bolhuis-Versteeg LAM, Lammertink RGH, Stamatialis D, Wessling
M. One-step fabrication of porous micropatterned scaffolds to control cell behavior. Biomaterials
2007;28:1998–2009. doi:10.1016/j.biomaterials.2006.12.023.
[19] Ito Y. Surface micropatterning to regulate cell functions. Biomaterials 1999;20:2333–42.
doi:10.1016/S0142-9612(99)00162-3.
[20] Wong JY, Leach JB, Brown XQ. Balance of chemistry, topography, and mechanics at the cell–
biomaterial interface: Issues and challenges for assessing the role of substrate mechanics on cell
response. Surf Sci 2004;570:119–33. doi:10.1016/j.susc.2004.06.186.
[21] Gallant ND, Capadona JR, Frazier AB, Collard DM, García AJ. Micropatterned Surfaces to
Engineer Focal Adhesions for Analysis of Cell Adhesion Strengthening. Langmuir 2002;18:5579–
84. doi:10.1021/la025554p.
[22] Graber DJ, Zieziulewicz TJ, Lawrence D a., Shain W, Turner JN. Antigen Binding Specificity of
Antibodies Patterned by Microcontact Printing. Langmuir 2003;19:5431–4.
doi:10.1021/la034199f.
[23] Nelson CM, Raghavan S, Tan JL, Chen CS. Degradation of Micropatterned Surfaces by Cell-
Dependent and -Independent Processes †. Langmuir 2003;19:1493–9. doi:10.1021/la026178b.
[24] Van Vlierberghe S, Dubruel P, Schacht E. Biopolymer-based hydrogels as scaffolds for tissue
engineering applications: a review. Biomacromolecules 2011;12:1387–408.
doi:10.1021/bm200083n.
[25] Brandl F, Sommer F, Goepferich A. Rational design of hydrogels for tissue engineering: impact of
physical factors on cell behavior. Biomaterials 2007;28:134–46.
doi:10.1016/j.biomaterials.2006.09.017.
[26] Bashur CA, Dahlgren LA, Goldstein AS. Effect of fiber diameter and orientation on fibroblast
morphology and proliferation on electrospun poly(D,L-lactic-co-glycolic acid) meshes.
Biomaterials 2006;27:5681–8. doi:10.1016/j.biomaterials.2006.07.005.
40
[27] Cooper JA, Lu HH, Ko FK, Freeman JW, Laurencin CT. Fiber-based tissue-engineered scaffold
for ligament replacement: design considerations and in vitro evaluation. Biomaterials
2005;26:1523–32. doi:10.1016/j.biomaterials.2004.05.014.
[28] Venugopal J, Ma LL, Yong T, Ramakrishna S. In vitro study of smooth muscle cells on
polycaprolactone and collagen nanofibrous matrices. Cell Biol Int 2005;29:861–7.
doi:10.1016/j.cellbi.2005.03.026.
[29] Mo X., Xu C., Kotaki M, Ramakrishna S. Electrospun P(LLA-CL) nanofiber: a biomimetic
extracellular matrix for smooth muscle cell and endothelial cell proliferation. Biomaterials
2004;25:1883–90. doi:10.1016/j.biomaterials.2003.08.042.
[30] Yang F, Murugan R, Wang S, Ramakrishna S. Electrospinning of nano / micro scale poly ( L -
lactic acid ) aligned fibers and their potential in neural tissue engineering. Biomaterials
2005;26:2603–10. doi:10.1016/j.biomaterials.2004.06.051.
[31] Lee CH, Shin HJ, Cho IH, Kang Y-M, Kim IA, Park K-D, et al. Nanofiber alignment and direction
of mechanical strain affect the ECM production of human ACL fibroblast. Biomaterials
2005;26:1261–70. doi:10.1016/j.biomaterials.2004.04.037.
[32] Nain AS, Phillippi J a, Sitti M, Mackrell J, Campbell PG, Amon C. Control of cell behavior by
aligned micro/nanofibrous biomaterial scaffolds fabricated by spinneret-based tunable engineered
parameters (STEP) technique. Small 2008;4:1153–9. doi:10.1002/smll.200800101.
[33] Sheets K, Wunsch S, Ng C, Nain AS. Shape-dependent cell migration and focal adhesion
organization on suspended and aligned nanofiber scaffolds. Acta Biomater 2013;9:7169–77.
doi:10.1016/j.actbio.2013.03.042.
[34] Yoshimoto H, Shin YM, Terai H, Vacanti JP. A biodegradable nanofiber scaffold by
electrospinning and its potential for bone tissue engineering. Biomaterials 2003;24:2077–82.
doi:10.1016/S0142-9612(02)00635-X.
[35] Barnes CP, Sell SA, Boland ED, Simpson DG, Bowlin GL. Nanofiber technology: designing the
next generation of tissue engineering scaffolds. Adv Drug Deliv Rev 2007;59:1413–33.
doi:10.1016/j.addr.2007.04.022.
[36] Li D, Xia Y. Electrospinning of Nanofibers: Reinventing the Wheel? Adv Mater 2004;16:1151–
70. doi:10.1002/adma.200400719.
[37] Katta P, Alessandro M, Ramsier RD, Chase GG. Continuous Electrospinning of Aligned Polymer
Nanofibers onto a Wire Drum Collector. Nano Lett 2004;4:2215–8. doi:10.1021/nl0486158.
[38] Zussman E, Theron A, Yarin AL. Formation of nanofiber crossbars in electrospinning. Appl Phys
Lett 2003;82:973–5. doi:10.1063/1.1544060.
[39] Theron A, Zussman E, Yarin A. Electrostatic field-assisted alignment of electrospun nanofibres.
Nanotechnology 2001;12:384–90.

41
[40] Shalumon KT, Sathish D, Nair S V., Chennazhi KP, Tamura H, Jayakumar R. Fabrication of
Aligned Poly(Lactic Acid)-Chitosan Nanofibers by Novel Parallel Blade Collector Method for
Skin Tissue Engineering. J Biomed Nanotechnol 2012;8:405–16. doi:10.1166/jbn.2012.1395.
[41] Dalton PD, Joergensen NT, Groll J, Moeller M. Patterned melt electrospun substrates for tissue
engineering. Biomed Mater 2008;3:034109. doi:10.1088/1748-6041/3/3/034109.
[42] Bisht GS, Canton G, Mirsepassi A, Kulinsky L, Oh S, Dunn-Rankin D, et al. Controlled
continuous patterning of polymeric nanofibers on three-dimensional substrates using low-voltage
near-field electrospinning. Nano Lett 2011;11:1831–7. doi:10.1021/nl2006164.
[43] Sun D, Chang C, Li S, Lin L. Near-field electrospinning. Nano Lett 2006;6:839–42.
doi:10.1021/nl0602701.
[44] Nain AS, Wong JC, Amon C, Sitti M. Drawing suspended polymer micro-/nanofibers using glass
micropipettes. Appl Phys Lett 2006;89:183105.
[45] Nain AS, Amon C, Sitti M. Proximal Probes Based Nanorobotic Drawing of Polymer
Micro/Nanofibers. IEEE Trans Nanotechnol 2006;5:499–510.
[46] Wang J, Nain AS. Suspended micro/nanofiber hierarchical biological scaffolds fabricated using
non-electrospinning STEP technique. Langmuir 2014;30:13641–9. doi:10.1021/la503011u.
[47] Nain AS, Wang J. Polymeric nanofibers: isodiametric design space and methodology for
depositing aligned nanofiber arrays in single and multiple layers. Polym J 2013;45:695–700.
doi:10.1038/pj.2013.1.
[48] Cell Biology of Extracellular Matrix. Springer; 1991.
[49] Bisht GS, Canton G, Mirsepassi A, Kulinsky L, Oh S, Dunn-Rankin D, et al. Controlled
continuous patterning of polymeric nanofibers on three-dimensional substrates using low-voltage
near-field electrospinning. Nano Lett 2011;11:1831–7. doi:10.1021/nl2006164.
[50] Chang C, Limkrailassiri K, Lin L. Continuous near-field electrospinning for large area deposition
of orderly nanofiber patterns. Appl Phys Lett 2008;93:123111. doi:10.1063/1.2975834.
[51] Nain AS, Wang J. Polymeric nanofibers: isodiametric design space and methodology for
depositing aligned nanofiber arrays in single and multiple layers. Polym J 2013;45:695–700.
doi:10.1038/pj.2013.1.
[52] Wang N, Ostuni E, Whitesides GM, Ingber DE. Micropatterning tractional forces in living cells.
Cell Motil Cytoskeleton 2002;52:97–106. doi:10.1002/cm.10037.
[53] Wang P-Y, Yu H-T, Tsai W-B. Modulation of alignment and differentiation of skeletal myoblasts
by submicron ridges/grooves surface structure. Biotechnol Bioeng 2010;106:285–94.
doi:10.1002/bit.22697.
[54] Stevens MM, George JH. Exploring and engineering the cell surface interface. Science
2005;310:1135–8. doi:10.1126/science.1106587.
42
[55] Chen CS. Geometric Control of Cell Life and Death. Science (80- ) 1997;276:1425–8.
doi:10.1126/science.276.5317.1425.
[56] Chen CS, Mrksich M, Huang S, Whitesides GM, Ingber DE. Micropatterned surfaces for control
of cell shape, position, and function. Biotechnol Prog n.d.;14:356–63. doi:10.1021/bp980031m.
[57] Ji Y, Ghosh K, Zheng X, Li B, Sokolov JC, Prestwich GD, et al. Electrospun three-dimensional
hyaluronic acid nanofibrous scaffolds. Biomaterials 2006;27:3782–92.
doi:10.1016/j.biomaterials.2006.02.037.
[58] Pham QP, Sharma U, Mikos AG. Electrospun poly(epsilon-caprolactone) microfiber and
multilayer nanofiber/microfiber scaffolds: characterization of scaffolds and measurement of
cellular infiltration. Biomacromolecules 2006;7:2796–805. doi:10.1021/bm060680j.
[59] Erisken C, Zhang X, Moffat KL, Levine WN, Lu HH. Scaffold Fiber Diameter Regulates Human
Tendon Fibroblast Growth and Differentiation. Tissue Eng Part A 2012;19.
doi:10.1089/ten.tea.2012.0072.
[60] Bakhru S, Nain AS, Highley C, Wang J, Campbell P, Amon C, et al. Direct and cell signaling-
based, geometry-induced neuronal differentiation of neural stem cells. Integr Biol (Camb)
2011:1207–14. doi:10.1039/c1ib00098e.
[61] Ker EDF, Nain AS, Weiss LE, Wang J, Suhan J, Amon CH, et al. Bioprinting of growth factors
onto aligned sub-micron fibrous scaffolds for simultaneous control of cell differentiation and
alignment. Biomaterials 2011;32:8097–107.
[62] Nain AS, Phillippi JA, Sitti M, Mackrell J, Campbell PG, Amon C. Control of cell behavior by
aligned micro/nanofibrous biomaterial scaffolds fabricated by spinneret-based tunable engineered
parameters (STEP) technique. Small 2008;4:1153–9. doi:10.1002/smll.200800101.
[63] Baldwin DF, Park CB, Suh NP. An extrusion system for the processing of microcellular polymer
sheets: Shaping and cell growth control. Polym Eng Sci 1996;36:1425–35. doi:10.1002/pen.10537.
[64] Dike LE, Chen CS, Mrksich M, Tien J, Whitesides GM, Ingber DE. Geometric control of
switching between growth, apoptosis, and differentiation during angiogenesis using
micropatterned substrates. In Vitro Cell Dev Biol Anim 1999;35:441–8. doi:10.1007/s11626-999-
0050-4.
[65] Nagasaki A, Kanada M, Uyeda TQ. Cell adhesion molecules regulate contractile ring-independent
cytokinesis in Dictyostelium discoideum. Cell Res 2009;19:236–46. doi:10.1038/cr.2008.318.
[66] Ridley AJ, Schwartz MA, Burridge K, Firtel RA, Ginsberg MH, Borisy G, et al. Cell migration:
integrating signals from front to back. Science 2003;302:1704–9. doi:10.1126/science.1092053.
[67] Berginski ME, Vitriol EA, Hahn KM, Gomez SM. High-resolution quantification of focal
adhesion spatiotemporal dynamics in living cells. PLoS One 2011;6:e22025.
doi:10.1371/journal.pone.0022025.

43
[68] Diener A, Nebe B, Lüthen F, Becker P, Beck U, Neumann HG, et al. Control of focal adhesion
dynamics by material surface characteristics. Biomaterials 2005;26:383–92.
doi:10.1016/j.biomaterials.2004.02.038.
[69] Dahl KN, Ribeiro AJS, Lammerding J. Nuclear shape, mechanics, and mechanotransduction. Circ
Res 2008;102:1307–18. doi:10.1161/CIRCRESAHA.108.173989.
[70] McBride SH, Knothe Tate ML. Modulation of stem cell shape and fate A: the role of density and
seeding protocol on nucleus shape and gene expression. Tissue Eng Part A 2008;14:1561–72.
doi:10.1089/ten.tea.2008.0112.
[71] Bissell MJ, Weaver VM, Lelievre SA, Wang F, Petersen OW, Schmeichel KL. Tissue Structure,
Nuclear Organization, and Gene Expression in Normal and Malignant Breast. Cancer Res
1999;59:1757s – 1764.
[72] Brunet A, Roux D, Lenormand P, Dowd S, Keyse S, Pouysségur J. Nuclear translocation of
p42/p44 mitogen-activated protein kinase is required for growth factor-induced gene expression
and cell cycle entry. EMBO J 1999;18:664–74. doi:10.1093/emboj/18.3.664.
[73] Munevar S, Wang Y, Dembo M. Traction Force Microscopy of Migrating Normal and H-ras
Transformed 3T3 Fibroblasts. Biophys J 2001;80:1744–57. doi:10.1016/S0006-3495(01)76145-0.
[74] Du Roure O, Saez A, Buguin A, Austin RH, Chavrier P, Silberzan P, et al. Force mapping in
epithelial cell migration. Proc Natl Acad Sci U S A 2005;102:2390–5.
doi:10.1073/pnas.0408482102.
[75] Ghibaudo M, Saez A, Trichet L, Xayaphoummine A, Browaeys J, Silberzan P, et al. Traction
forces and rigidity sensing regulate cell functions. Soft Matter 2008;4:1836.
doi:10.1039/b804103b.
[76] Tan JL, Tien J, Pirone DM, Gray DS, Bhadriraju K, Chen CS. Cells lying on a bed of
microneedles: an approach to isolate mechanical force. Proc Natl Acad Sci U S A 2003;100:1484–
9. doi:10.1073/pnas.0235407100.
[77] Cuenot S, Frétigny C, Demoustier-Champagne S, Nysten B. Surface tension effect on the
mechanical properties of nanomaterials measured by atomic force microscopy. Phys Rev B
2004;69:165410. doi:10.1103/PhysRevB.69.165410.
[78] Discher DE, Janmey P, Wang YL. Tissue cells feel and respond to the stiffness of their substrate.
Science (80- ) 2005;310:1139–43. doi:10.1126/science.1116995.
[79] Zhang Y-H, Zhao C-Q, Jiang L-S, Dai L-Y. Substrate stiffness regulates apoptosis and the mRNA
expression of extracellular matrix regulatory genes in the rat annular cells. Matrix Biol
2011;30:135–44. doi:10.1016/j.matbio.2010.10.008.
44
Appendix A: Copy Right Permission from Langmuir

45
Appendix B: Copy Right Permission from Polymer Journal Nature


![ENVIRONMENTAL CONTAMINANTS … ortho-xylene, 45-70% meta-xylene, 23% para-xylene, and 6-10% ethylbenzene [366]. While o-xylene is recognized as a distinct product in](https://static.fdocuments.in/doc/165x107/5b4c8c857f8b9afe4d8b9be3/environmental-contaminants-ortho-xylene-45-70-meta-xylene-23-para-xylene-and.jpg)