Susanna Glaze, Bobby Creel, and Christopher Brown … · Susanna Glaze, Bobby Creel, and...
23
Susanna Glaze, Bobby Creel, and Christopher Brown New Mexico State University 2009 AWRA Spring Specialty Conference 4-6 May 2009 – Anchorage, Alaska
Transcript of Susanna Glaze, Bobby Creel, and Christopher Brown … · Susanna Glaze, Bobby Creel, and...

Susanna Glaze, Bobby Creel, and Christopher BrownNew Mexico State University
2009 AWRA Spring Specialty Conference4-6 May 2009 – Anchorage, Alaska

Outline Outline
Introduction to general water resources issues in Las Cruces, NMI f li t h d N M iInfo on climate change and New MexicoArea of investigation and research questionsData and methodsAnticipated results

BackgroundBackgroundWater resources in the American Southwest
On the whole, anOn the whole, an arid region Sensitive to droughts anddroughts and shortages Water often over-allocated Population growth creating further demand

Las Cruces NMLas Cruces, NM
Population 86,268 (as of p , (2006)
Increase of 17.3% since 2000Arid receiving only 8 8 ½”Arid – receiving only 8 -8 ½ annually
Most precipitation occurring during summer monsoon
Prone to summer floodsPrimary culprits:Primary culprits:○ Rio Grande (tamed by the Rio
Grande Project of mid 1900s)○ Side channels and arroyosSide channels and arroyos
Climate ChangeClimate Change
Increasing carbon dioxideIncreasing carbon dioxide levels are causing warming and drying in the A i S hAmerican Southwest
Process is already underwayunderway
Added stress placed on water resourceswater resources Profound impacts will occur in many areasy

Climate Change Climate Change
From the University of Arizona Department of y pGeosciences Environmental Studies Laboratory.

Climate Change Climate Change
From the University of Arizona Department of y pGeosciences Environmental Studies Laboratory

Climate Change in New MexicoClimate Change in New Mexico
Rising temperaturesChanges in snowpackChanges in water volumeEarlier peak flowsEarlier peak flowsWarmer wintersHotter summersIncrease in evaporation andIncrease in evaporation and evapotranspirationMore precipitation occurring as rain, less as snowless as snowIncrease in intensity of extreme weather events

Climate Change and FloodingClimate Change and Flooding
“When it rains it pours!”When it rains it pours!
Increased frequency andIncreased frequency and intensity of summer monsoon storms
○ More precipitation falls in a shorter time span
○ Larger amounts of runoff○ Larger amounts of runoff○ Flashier, more severe urban
flooding
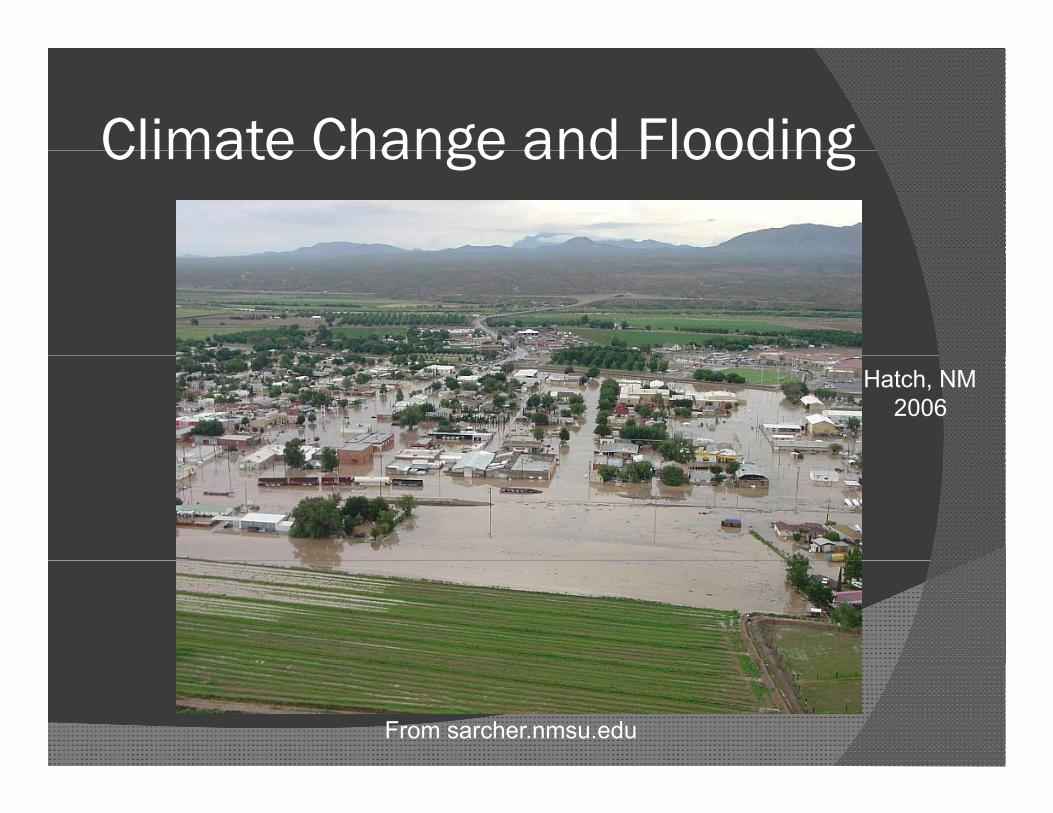
Climate Change and FloodingClimate Change and Flooding
Hatch, NM2006
From sarcher.nmsu.edu

Climate Change and FloodingClimate Change and Flooding
CompoundingCompounding Factors
Urban Development○ Impervious surface ○ Causes higher peak
runoffrunoff○ Higher volume of
runoffF t fl○ Faster flow
Aging InfrastructureSedimentSediment
From Leopold 1968

Climate Change and FloodingClimate Change and Flooding
100-year and 500-year flood levels may100 year and 500 year flood levels may need adjustment
Currently based on historic climate dataCurrently based on historic climate dataFlood control structures may require upgradeupgrade
Some already degraded due to age

From NM WRRI

From City ofFrom City of Las Cruces

Research QuestionsResearch QuestionsHow will rainfall intensity and periodicity change in Las Cr ces nder climate change?Cruces under climate change?
If there is an increase in rainfall intensity, how will it affect flooding dynamics? Will we see more flood events higherflooding dynamics? Will we see more flood events, higher stages, storm hydrographs exceeding channel capacity, or all of the above?
Can the current flood infrastructure accommodate potential future increases in runoff due to climate change and land-use change?
What changes or improvements should be made to allow infrastructure to accommodate projected future flood flows?

Methods & DataMethods & Data
Based on a framework created byBased on a framework created by Catherine Denault, Robert G. Millar, and Barbara J. Lence in 2006
“Assessment of Possible Impacts of Climate Change in an Urban Catchment.” ○ Journal of the American Water Resources
Association 42(3): 685-697.

Methods & DataMethods & Data
Analyze past rainfall intensity for y p ytrends
Data needed:R i f ll i t it d t f diff t○ Rainfall intensity data for different durations (5min, 10min, 15min, 1hr, etc) for Las CrucesD t h ld h ti t○ Data should cover enough time to ensure statistically significant results
○ Only summer monsoon data will be dused
Linear regression will be used to test for trends

Methods & DataMethods & Data
Extrapolate to the futureExtrapolate to the futureAny trendlines of statistical significance will be used to create f t I t it D tifuture Intensity-Duration-Frequency (IDF) curvesLinear regression will be used toLinear regression will be used to extrapolate to two future years, 2025 and 2050. IDF ill b d t tIDF curves will be used to create future synthetic storms to be modeled in SWMM

Methods & DataMethods & Data
SWMM5SWMM5EPA’s StormWater Management ModelUsed to model storm runoff in an urbanUsed to model storm runoff in an urban settingUses topography, sewer system layout, soil g y y yattributes, slope, and land use change dataCan model single events or long term hchanges

Methods & DataMethods & Data
Synthetic storms created from trendlinesSynthetic storms created from trendlines found will be used in SWMMSimulations will be ranSimulations will be ranSWMM will pinpoint which structures will be able to accommodate increasesbe able to accommodate increases, which will fail

Anticipated OutcomesAnticipated Outcomes
Trendlines of statistical significance areTrendlines of statistical significance are expected to be foundFuture rainfall scenarios will causeFuture rainfall scenarios will cause “flashier” floodsSome structures will pass some will failSome structures will pass, some will fail
Acknowledgements Acknowledgements
Funding provided by Vice President ofFunding provided by Vice President of Research, New Mexico State University
Graduate Research Enhancement Program
and NM Water Resources Researchand NM Water Resources Research Institute

Questions orQuestions or Feedback??Feedback??