Survival analysis as a tool to model Little Bustard...
46
Universidade de Lisboa Faculdade de Ciências Departamento de Informática Survival analysis as a tool to model Little Bustard mortality rates in the Iberian Peninsula Joana Lopes Marcelino Dissertação Mestrado em Bioinformática e Biologia Computacional Especialização em Biologia Computacional 2014
-
Upload
hoangnguyet -
Category
Documents
-
view
215 -
download
0
Transcript of Survival analysis as a tool to model Little Bustard...

Universidade de Lisboa
Faculdade de Ciências
Departamento de Informática
Survival analysis as a tool to model Little Bustard mortality rates in the Iberian Peninsula
Joana Lopes Marcelino
Dissertação
Mestrado em Bioinformática e Biologia Computacional
Especialização em Biologia Computacional
2014

Universidade de Lisboa
Faculdade de Ciências
Departamento de Informática
Survival analysis as a tool to model Little Bustard mortality rates in the Iberian Peninsula
Joana Lopes Marcelino
Dissertação
Mestrado em Bioinformática e Biologia Computacional
Especialização em Biologia Computacional
Doutor Francisco Moreira
Professor Doutor Jorge M. Palmeirim
2014

2
ACKNOWLEDGEMENTS
Os meus sinceros agradecimentos ao Professor Francisco, por ter aceite ser meu orientador, por
apesar de ter uma "casa cheia", ter disponibilizado um lugar no CEABN para eu trabalhar, e por ter
sempre disponível aqueles "5 a 7 minutos" para esclarecer todas as minhas dúvidas estatístico-
existenciais.
Ao Professor Jorge, por me ter aceite como orientanda, pelo interesse e conselhos.
Ao João Paulo, por ter aceite o papel de orientador, pela dedicação e disponibilidade, e pelo
entusiasmo contagioso presente ao longo de todo o ano. Obrigado pelas saídas de campo e por me
mostrares outra perspectiva.
À família do João Paulo, por me aguentarem durante uns dias, e me fazerem sentir bem-vinda ao
Alentejo. Especialmente ao Filipe, por me ter cedido o quarto, e por me ter apresentado ao LEGO
Marvel Super Heroes!
A todo o pessoal do CEABN, por partiharem a secretária comigo (mesmo quando não sabiam), pelo
estímulo intelectual e por me fazerem sentir bem-vinda. Particularmente à Inês pelo interesse no meu
trabalho e pela disponibilidade para me ajudar.
Ao David Santos, por ter partilhado comigo o seu trabalho, pelos conselhos e ter sido das poucas
pessoas com quem pude falar sobre análise de sobrevivência.
À Ana Leal, por ter despendido um pouco do seu tempo para me arranjar a bibliografia que procurava
há semanas.
Aos elementos das equipas de Espanha, que facultaram os dados de seguimento: Santiago Mañosa,
Francesc Martínez, Manuel Morales, Eladio Garcia de La Morena e Gerard Bota.
To Professor Todd Fuller, for spending time showing me how Micromort works.
Ao Daniel Pinheiro, pelas magníficas fotografias do sisão.
Ao Yann Tiersen pela banda sonora.
A todos os amigos/família que de uma maneira ou outra contribuiram para tornar este ano
ligeiramente menos stressante.
Ao Manel, pela figura 3, que nem uma figura parecia antes do teu arranjo. Obrigado também por
estares sempre presente (ainda que à distância) e por tirares e partilhares comigo todas as

3
fotografias que eu não tive disponibilidade para tirar este ano. Agora já podes vir a Lisboa (tens cá um
cantinho), e vamos "ver pássaros"!
Ao Pedro pela revisão da tese e pelo "Vens para o Algarve e escreves a tese na praia." (aceito o
convite no próximo ano!)
Ao Filipe, sobretudo pela paciência extra para me aturar este ano, pelas torradas e negrescos e pela
gato-terapia. Obrigado pela constante motivação, por ouvires as minhas dúvidas existenciais e pela
companhia indispensável. It's your turn now, may the Force be with you!
À minha irmã, por se interessar pelo meu trabalho, pela troca de ideias e por se esforçar para
perceber o que andei a fazer. Obrigado pelos conhecimentos em direito internacional privado, por me
explicares quem paga as despesas se um sisão português com descendência morrer em Espanha.
Obrigado também por teres conseguido pôr fim a 5 anos sem internet em casa (facilitou-me a vida)!
Ah, e por conseguires pôr-me razoavelmente bem disposta às 7 da manhã!
Aos meus pais, por todo o apoio e incentivo, pela paciência e por assistirem às "Palestras em
Família" ao fim de um dia cansativo. Não me querendo vangloriar, está tudo encaminhado para ser a
primeira pessoa a quebrar a maldição!
Ao Belky, por estar a dar cabo da paniculite e ser a minha companhia diária. Vais receber uma caixa
extra de sticks pelo Natal!

4
"Unless you try to do something beyond what you have already mastered, you will never grow."
- Ralph Waldo Emerson

5
RESUMO
O modelo de Cox proportional hazards é um modelo de sobrevivência semi-paramétrico utilizado em
análise de regressão para dados censurados. O modelo original tem sofrido alterações, com a
inclusão de novas extensões que permitem maior flexibilidade e a análise de um conjunto mais
alargado de dados. Entre as recentes extensões, incluem-se: a análise de variáveis dependentes do
tempo, múltiplas observações de eventos, tied events e estratificação de variáveis dependentes do
tempo.
A sobrevivência é um fator determinante na ecologia de populações e na biologia da conservação.
Este tipo de estudos só é possível com recurso a técnicas de telemetria, que tornam possível a
aquisição de informação contínua. Existem vários problemas associados a este tipo de análise
quando aplicada a animais em estado selvagem, muitas vezes ignorados pelos investigadores. Os
mais típicos consistem na influência que o equipamento de seguimento tem no animal e no stress
induzido pela marcação. Estes e outros problemas tornam a análise de sobrevivência de animais
selvagens um desafio.
O sisão (Tetrax tetrax) é uma ave ameaçada na Península Ibérica classificada como Vulnerável
(Cabral et al., 2005; Madroño et al., 2004) em Portugal e catalogada como Near Threatened
pela International Union for Conservation of Nature (IUCN) a nível global (Collar et al., 1994). Tem
estado em declínio acentuado na Europa, especialmente em Itália, França e Espanha, apresentando
uma tendência desconhecida em Portugal. Trata-se de uma ave estepária adaptada a meios
agrícolas abertos extensivos e a pastagens. Entre os principais fatores de ameaça à espécie,
destacam-se: a perda e fragmentação do habitat devido à intensificação agrícola nos solos mais
produtivos, o abandono agrícola nos solos menos produtivos, a construção de infraestruturas (linhas
elétricas, vedações, estradas) e as alterações climáticas.
Neste contexto, a identificação e análise da forma como diferentes fatores influenciam a mortalidade
do sisão e a distinção entre as diferentes causas de mortalidade constitui um contributo relevante
para o desenvolvimento e aplicação de medidas que promovam a conservação desta espécie.
Com este trabalho pretendeu-se aplicar a análise de sobrevivência – normalmente utilizada em
estudos de medicina, engenharia, economia e sociologia – a um estudo ecológico, usando software
estatístico comum, geralmente utilizado por investigadores desta área.
Neste trabalho foi utilizada uma amostra de 143 indivíduos capturados e seguidos na Península
Ibérica, com o objectivo de: (1) identificar as principais causas de mortalidade natural e antropogénica
e quantificar a sua importância relativa; (2) modelar o efeito de quatro variáveis: sexo, uso do solo,
6
época e região bioclimática na sobrevivência do sisão, usando o estimador de Kaplan-Meier e o
Modelo Extended Cox Proportional Hazards Model for Time-Dependent Variables.
A mortalidade antropogénica teve uma prevalência maior do que seria expectável para uma espécie
protegida. Cerca de 17% da população ibérica morre anualmente devido a causas humanas, uma
maior percentagem que a morte anual por causas naturais (15%). Estes valores de mortalidade
antropogénica, associados a uma fraca produtividade do sisão, mais nítida em áreas com pior estado
de conservação de habitat, levam à falta de sustentabilidade da espécie, pondo em risco a
sobrevivência de uma ave com estatuto de Quase Ameaçada. A colisão com linhas elétricas foi, até
hoje, a causa de mortalidade antropogénica com maior destaque. Com este estudo, concluímos que
cerca de 4% da população da Península Ibérica morre anualmente por colisão com linhas elétricas e
cerca de 1% por atropelamento. Para a população de Portugal, tinha sido estimada anteriormente
uma mortalidade anual de 1,5% por linhas elétricas (Silva et al., 2010b). No entanto, a causa de
morte antropogénica com maior prevalência foi a caça, com cerca de 12% da população a morrer
anualmente por esta causa.
Não foram evidenciadas diferenças entre a proporção de mortes dentro e fora da época de caça,
sugerindo que esta variável não influencia a proporção de mortalidade por cada uma das causas. Não
foi encontrada uma relação entre o sexo e a morte dentro ou fora da época venatória.
Dentro da morte por causas naturais, foi apenas identificada a morte por predação. Mamíferos e
rapinas tendem a predar o sisão aproximadamente na mesma proporção, ainda que tenham sido
identificados 5% de casos em que o predador não foi identificado.
Aplicámos com sucesso o modelo de Cox a um objeto de estudo ecológico, conseguindo eliminar o
máximo de bias associado e identificar os principais fatores que influenciam a sobrevivência do sisão.
A região bioclimática revelou-se o fator com maior influência na mortalidade da espécie. Regiões
mais secas e quentes tendem a ter um maior risco de mortalidade, provavelmente devido à escassez
de vegetação e insetos em épocas de seca, desencadeando uma menor disponibilidade de alimento.
Concluímos que fêmeas de sisão têm um maior risco de mortalidade que os machos. Estas são as
únicas responsáveis pelos cuidados parentais, despendendo energia tanto na postura como na
alimentação das crias. Este é, portanto, um período de grande vulnerabilidade para as fêmeas, que
se pode estender após a época de reprodução, e que pode afetar o seu fitness de inverno.
Uma vez que a intensificação agrícola é o fator mais associado à ameaça da espécie, seria
expectável observar um impacto negativo deste uso do solo na mortalidade do sisão. Contudo, tal
não se verificou, tendo este factor apresentado pouca influência em comparação com a região
bioclimática e o sexo. Sobretudo durante os anos de seca, o sisão está mais dependente de culturas
7
intensivas (com maior disponibilidade de alimento) durante a época de pós-reprodução e inverno,
havendo registos de movimento dos mesmos de áreas extensivas para áreas intensivas durante
estas épocas do ano. Assim, admite-se a existência de uma relação entre o uso do solo e a época,
que influencie o comportamento destas variáveis. A época foi a variável com menor impacto na
mortalidade do sisão.
O nosso trabalho demonstra quão mal compreendidas e desconhecidas eram algumas ameaças à
população do sisão na Península Ibérica. Uma redução da mortalidade antropogénica terá um grande
impacto na viabilidade desta espécie, particularmente em zonas com menor produtividade da mesma.
Alterações na legislação das épocas venatórias e medidas de sensibilização poderiam reduzir o
problema de caça associado, sendo um fator que afeta anualmente quase 12% da população. A
adaptação da rede elétrica em termos de localização e design de linhas também deve ser
considerada prioritária.
A análise de sobrevivência usando o modelo de Cox foi aplicada com sucesso a um caso de estudo
ecológico, e revelou ser capaz de acomodar os problemas associados ao seguimento de animais
selvagens. Foi igualmente aplicada com sucesso a análise de causas específicas de mortalidade para
esta espécie, utilizando o estimador de Heisey e Fuller, o que possibilitou o cálculo das taxas de
mortalidade anuais para causas de morte de origem natural e antropogénica.
Devem ser tomadas medidas para orientar o trabalho de campo especificamente para este tipo de
análise, principalmente no que diz respeito à obtenção de uma data de mortalidade mais precisa. Um
maior esforço de identificação de carcaças, juntamente com o uso de emissores que permitam medir
parâmetros fisiológicos para determinar o estado do indivíduo, seriam soluções que contribuiriam
para atenuar este problema. Neste trabalho conseguimos testar a influência do peso dos emissores e
do tipo de tecnologia de seguimento na sobrevivência do sisão e verificámos que emissores com
peso abaixo de 6,76% do peso corporal não tiveram influência significativa na sobrevivência. O uso
de diferentes tecnologias de seguimento também não teve influência ao nível da mortalidade.
Palavras-chave: Modelo Cox proportional hazards, análise de sobrevivência, dados censurados,
conservação, seguimento de aves, Tetrax tetrax, estimador de Heisey and Fuller.

8
ABSTRACT
The Cox proportional hazards model has become the most widely used method for regression
analysis for censored data and is frequently used to model survival data. The introduction of new
extensions to the original model like time-dependent covariates, multiple observations, multiple time-
scales, tied events and time-dependent strata improved it and made it more widely applicable.
Survival estimation is an important aspect of population ecology and conservation biology, with
telemetry making possible the acquisition of continuous survival information. There are often problems
associated with this type of analysis in ecological studies of free-ranging animals, that are frequently
disregarded by researchers, such as the influences of the transmitter's weight, induced stress in
handling the species, or interval-censored death dates, which make survival studies on free ranging
animals a challenge.
In this study, we aim to apply survival analysis - frequently used in medicine, engineering, economics
and sociology - to an ecological study, using a standard statistical software, widely used by
researchers of this area. We have successfully applied this approach to a case study and managed to
address potential bias sources and identify the main factors that influence Little Bustard's (Tetrax
tetrax) survival. Furthermore, we have also computed cause-specific mortality rates for this species,
using the Heisey and Fuller estimator.
Keywords: Cox proportional hazards model, survival, censoring, ecological, tracking, Heisey and
Fuller estimator.
9
INDEX
ACKNOWLEDGEMENTS .............................................................................................................. 2
RESUMO .......... ............................................................................................................................. 5
ABSTRACT........ ............................................................................................................................. 8
INTRODUCTION ......................................................................................................................... 10
KAPLAN MEIER ESTIMATE ........................................................................................ 11
EXTENDED COX PROPORTIONAL HAZARDS MODEL FOR TIME DEPENDENT VARIABLES .......................................................................................... 11
THE LITTLE BUSTARD AS A CASE STUDY ............................................................... 12
CHAPTER 1: ANALYZING CAUSES OF LITTLE BUSTARD MORTALITY IN THE
IBERIAN PENINSULA AND MODELLING FACTORS DRIVING NATURAL DEATHS ................. 16
DISCUSSION .............................................................................................................................. 36
REFERENCES ............................................................................................................................ 38
APPENDICES .............................................................................................................................. 44

10
INTRODUCTION
Survival analysis consists in the analysis of data in which the outcome variable of interest is time until
an event occurs. It is frequently used in medical research for analyzing subject treatment responses,
but is also used in other areas to study different events like equipment failures (engineering), stock
market crashes (economics) and births or retirements (sociology).
In ecological studies, survival analysis is most commonly used to model animal survival rates (Murray
and Patterson, 2006). Although this type of analysis has not been very explored in the past,
development and assessment of survival methods applied to free ranging animals has been
increasing as a focus point in many studies (Pollock and Winterstein, 1989; Lebreton et al., 1992;
Murray, 2002; Murray and Patterson, 2006) with significant improvements in the development of
software for the analysis of complex survival functions (Williams et al., 2002). This has led to a recent
increase in the use of survival analysis methods in conservation biology studies (Gauthier et al., 2001;
Ward et al., 2004; Haines et al., 2005; Bender et al., 2007; Hupp et al., 2008; Le Gouar et al., 2008;
Ma and Bechinski, 2008; Persson et al., 2009; Evelsizer et al., 2010; Domingues et al., 2012;
Buuveibaatar et al., 2013; Melis et al., 2013; Olson et al., 2014).
Survival analysis and the assessment of mortality causes in wildlife are essential to analyze and
quantify the main pressures that affect individual mortality and species population trends, contributing
to conservation strategies of threatened species. Comparatively to other demographic parameters of
wildlife populations, survival is difficult to estimate (McCallum, 2000) due to animal capture and
monitoring difficulties that lead to small sample sizes and uncertainly about the fate of large part of the
tracked individuals. Nevertheless, the increasing use of remote tracking devices and the
improvements made in terms of capture techniques has facilitated survival assessment for free-
ranging animals (Krebs, 1999; Kenward, 2001; Millspaugh and Marzluff, 2001), leading to an
increased number of survival studies applied to ecology.
Current survival analysis procedures are capable of dealing with key data analytical problems like
censoring. Censoring is very common in radio-tracking studies and occurs when we do not know an
individual's exact survival time for different reasons: the date of death is uncertain, the individual is
"lost to follow-up", i.e., it's signal may be lost during the tracking with no carcass found, or the
individual is still alive at the end of the study. To estimate survival probability at a given time, in
addition to the risk set at that time, the information of censored individuals is included up to the time of
censorship, rather than excluded from the start.
11
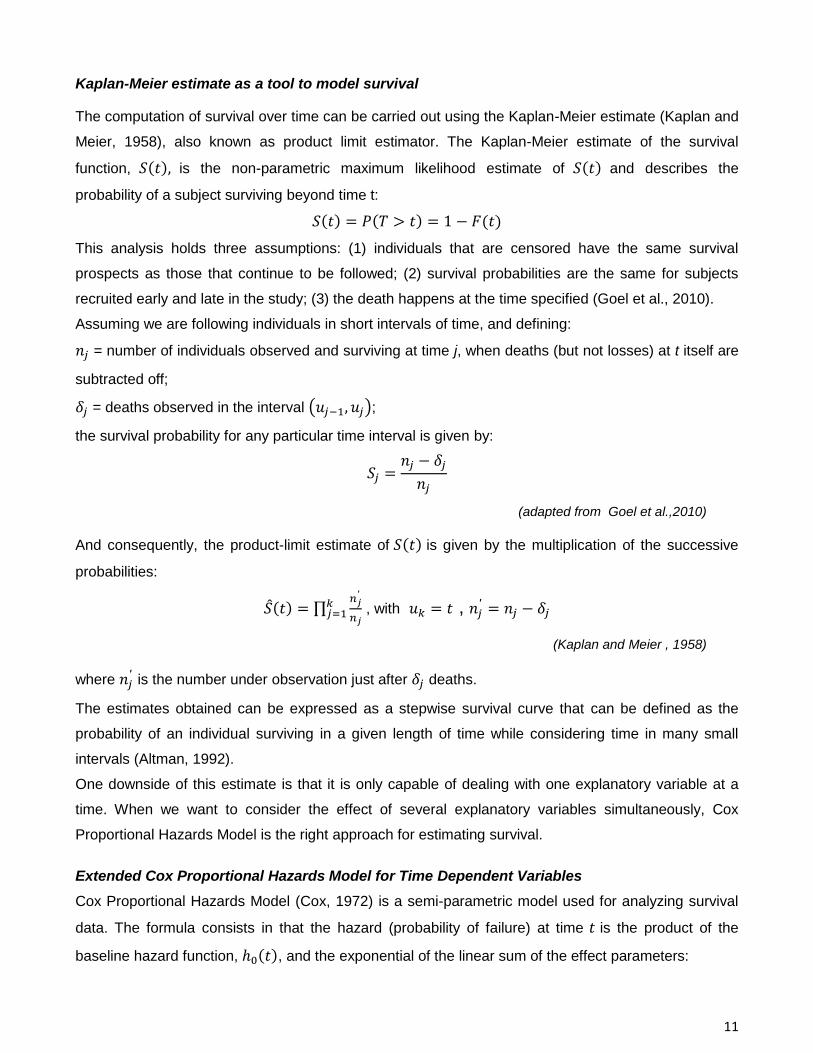
Kaplan-Meier estimate as a tool to model survival
The computation of survival over time can be carried out using the Kaplan-Meier estimate (Kaplan and
Meier, 1958), also known as product limit estimator. The Kaplan-Meier estimate of the survival
function, is the non-parametric maximum likelihood estimate of and describes the
probability of a subject surviving beyond time t:
This analysis holds three assumptions: (1) individuals that are censored have the same survival
prospects as those that continue to be followed; (2) survival probabilities are the same for subjects
recruited early and late in the study; (3) the death happens at the time specified (Goel et al., 2010).
Assuming we are following individuals in short intervals of time, and defining:
= number of individuals observed and surviving at time j, when deaths (but not losses) at t itself are
subtracted off;
= deaths observed in the interval ;
the survival probability for any particular time interval is given by:
(adapted from Goel et al.,2010)
And consequently, the product-limit estimate of is given by the multiplication of the successive
probabilities:
, with ,
(Kaplan and Meier , 1958)
where is the number under observation just after deaths.
The estimates obtained can be expressed as a stepwise survival curve that can be defined as the
probability of an individual surviving in a given length of time while considering time in many small
intervals (Altman, 1992).
One downside of this estimate is that it is only capable of dealing with one explanatory variable at a
time. When we want to consider the effect of several explanatory variables simultaneously, Cox
Proportional Hazards Model is the right approach for estimating survival.
Extended Cox Proportional Hazards Model for Time Dependent Variables
Cox Proportional Hazards Model (Cox, 1972) is a semi-parametric model used for analyzing survival
data. The formula consists in that the hazard (probability of failure) at time is the product of the
baseline hazard function, , and the exponential of the linear sum of the effect parameters:

12
The baseline hazard function describes how the risk of death changes over time at baseline levels of
the covariate, and the exponential expression describes how the hazard varies in response to the
explanatory variables.
This model must hold two important assumptions: (1) Non-informative censoring assumption states
that censored individuals must not be related to the probability of occurrence of the event; (2)
Proportional hazards assumption is based on the fact that the effect of a covariate does not change
over time. Herewith, the baseline function is an expression of time, whereas the exponential
expression involves the variables but not the time - the variables are then called time-independent.
When considering variables that do change its value over time, we call them time-dependent and the
model is renamed Extended Cox Model:
(Kleinbaum and Klein, 2005)
Although the value changes over time, there is only one coefficient for each time-dependent variable.
Thus, there is only one value that has an effect in the hazard, measured at time .
The Little Bustard as a case study
The Little Bustard Tetrax tetrax (Linnaeus, 1758) is the only species of the genus Tetrax and belongs
to the family Otididae. It had originally a Palaearctic distribution (Cramp and Simmons, 1980)
extending from the Iberian Peninsula and Morocco, to Kyrgyzstan and extreme northwest China (del
Hoyo et al., 1996), but became extinct as a breeding species in late 19th and 20th centuries in many
countries of Central and Southern Europe (Cramp and Simmons, 1980; Schulz, 1985, 1987; Goriup,
1994). Today, its breeding distribution is fragmented and concentrated in two main regions: the first
one centred in south-eastern European Russia and Kazakhstan, and the second, and most important
one, in the Iberian Peninsula, southern France, Sardinia and Morocco (Cramp and Simmons, 1980;
del Hoyo et al., 1996; Palacín and Alonso, 2009) (Fig. 1). Over the last decades the population has
been declining in most of its range. In France, for example, between the 80’s and late 90’s the
population almost became extinct with an estimated decline of 92% (Jolivet, 1997). The Iberian
Peninsula is thought to be the main stronghold of the western European population (Iñigo and Barov,
2010).
time-independent
time-dependent

13
Figure 1 - World distribution map of the Little Bustard (BirdLife International and NatureServe, 2014).
The Little Bustard is currently classified as globally Near Threatened by the International Union for
Conservation of Nature (IUCN) (Collar et al., 1994) and Vulnerable in the Iberian Peninsula (Madroño
et al., 2004; Cabral et al., 2005; Iñigo and Barov, 2010). The estimated population in Spain is now
about 40.000-85.000 breeding males (García de la Morena et al., 2006) in contrast with 100.000-
200.000 in the 90's (de Juana and Martínez, 1996). In Portugal, the population is estimated to be
around 17.500 breeding males (Silva and Pinto, 2006). Furthermore, the Little Bustard is considered
an umbrella species (Silva et al., 2010a) since the European Union Directive on the Conservation of
Wild Birds (79/409/EEC) has classified it as priority species for conservation and defined Special
Protection Areas (SPA) for its conservation.
As a grassland bird, it is adapted to open extensive agricultural areas with low intensity farming
(Cramp and Simmons, 1980). In western Europe its main habitat consists not only of extensive cereal
farmland (Martínez, 1994; Silva et al., 2004, 2007; Morales et al., 2006b), but also of fallow land and
extensive pastureland during the breeding season (Martínez, 1994; Salamolard and Moreau, 1999;
Delgado and Moreira, 2000; Wolff et al., 2002a, 2002b). This species diet consists primarily of green
plant leaves but also includes arthropods (Jiguet, 2002). It is mainly based on Leguminosae and
Cruciferae during winter (Cramp and Simmons, 1980; Martínez, 1994), and the consumption of
invertebrates is especially important during post-breeding season (Jiguet, 2002).
14
The Little Bustard performs regular movements in the Iberian Peninsula at the end of the breeding
season, from the nesting sites towards areas with greater food availability.
The main causes of Little Bustards decline are related to habitat loss and fragmentation, population
fragmentation and habitat degradation, mainly caused by intensive farming. Intensive farming is
usually characterized by the establishment of monocultures, the use of chemical additives and heavy
mechanisation. This type of agriculture increased in the last decades (Chamberlain and Fuller, 2000;
Siriwardena et al., 2000) resulting in a reduction of extensive agricultural habitats (Donázar et al.,
1993; Bignal and McCracken, 1996) and habitat degradation, consequently leading to the decline of
farmland species (Schulz, 1985; Blanco et al., 1998; Bouma et al., 1998; Chamberlain and Fuller,
2000; Donald et al., 2001; Martínez and Tapia, 2002; Sanderson et al., 2005; Santos and Suárez,
2005). In the Iberian Peninsula, permanently irrigated lands are the predominant type of intensive
farming. They are associated to crops that rely on irrigation infrastructures and, depending on the type
of crop, can lead to a partial or total loss of habitat for the species. Together with the abandonment of
agricultural activity and the decreasing use of crop rotation systems, intensive farming is believed to
be the main reason for Little Bustard decreasing numbers, due to decreased habitat extent and quality
(Goriup, 1994; Morales et al., 2005b, 2006b; García et al., 2007).
Other factors responsible for the Little Bustard's population decline include collision with
infrastructures, hunting and predation.
What we know about Little Bustard mortality causes
Predation is the most common natural cause of death for Little Bustard (Schulz, 1987). Its preference
for hill tops (Silva et al., 2004) and low vegetation (Martínez, 1994; Moreira, 1999; Salamolard and
Moreau, 1999) can be considered an anti-predatory strategy (Silva et al., 2010b). Maintaining distance
of tall over-head lines, where avian predators perch, can be also a protective measure to become less
vulnerable to predation (Silva et al., 2010b). However, no information is available about Little Bustard
predators, but potential species include the red fox (Vulpes vulpes), hen harrier (Circus cyaneus),
peregrine falcon (Falco peregrinus) and Iberian imperial eagle (Aquila adalberti).
Bioclimatic regions can have also influence on this species behavior. Drier and hotter climates lead to
less productive soils and consequently to fewer food resources (Delgado and Moreira, 2010), possibly
the affecting the survival of the Little Bustard, in particular of juveniles. Alongside that, seasons are
also a possible factor of interference, with higher temperatures occurring in post-breeding season,
when the Little Bustard have to spend energy when moving to more productive soils (Silva et al.,
2007), probably increasing its mortality risk. Differences between survival rates between sexes are

15
also a possibility, since there are several studies that report a biased sex ratio towards males
(Inchausti and Bretagnolle, 2005; Morales et al., 2008; Faria et al., 2012).
Human-caused deaths are poorly studied, but the construction of infra-structures such as power lines,
fences and roads has been considered the main threat (Silva et al., 2010b; Alcazar, 2013). This kind
of structures is on ongoing construction and, in addition to causing habitat fragmentation by partly
blocking the birds movements, are thought to be a significant source of direct mortality by collision
(Neves et al., 2005). In Portugal it is estimated that about 134 Little Bustards die every year by
collision with power lines (Infante et al., 2005). Little is known about the effect of illegal hunting of the
species in the Iberian Peninsula, but, given the number of hunters active during autumn and winter all
over the region, this is suspected to be an important cause of mortality. And even if it is not an
important source of direct mortality, it could be a major factor of disturbance (Gauger, 2007).
Existent ecological studies on Little Bustard (de Juana and Martínez, 1996; Jolivet and Bretagnolle,
2002; Inchausti and Bretagnolle, 2005; Morales et al., 2006a; De Juana, 2009; Delgado et al., 2009;
Palacín and Alonso, 2009; Silva et al., 2010b, 2014b; Moreira et al., 2012a) do not report any specific
information about what is the impact of anthropogenic directly caused deaths (e.g., power line
collision, hunting, vehicle collision) in comparison with deaths by natural causes (e.g., predation,
starvation, hyper- and hypothermia). Moreover, none of the studies reference mortality rates
associated with environmental pressures that influence survival through time. It is then essential to
study the importance of these factors in terms of mortality risk. That information would allow
population modelling under different land use and climatic scenarios and be a major contribute to the
development and application of conservation strategies for this species.
Using a sample of over 100 little bustards captured, tagged and followed in the Iberian Peninsula, the
aims of this work are: (1) to identify the main causes of natural and anthropogenic deaths, and
quantify their relative importance; (2) to model the effect of four variables: sex, land cover, seasons
and bioclimatic region on Little Bustard's survival, using Kaplan-Meier estimate and the Extended Cox
Proportional Hazards Model for Time-Dependent Variables.

16
CHAPTER1:
Analyzing causes of little bustard mortality in the Iberian Peninsula and
modelling factors driving natural deaths
17
ABSTRACT
The Little Bustard (Tetrax tetrax) is facing a number of threats in the Iberian Peninsula - the region
considered to be the stronghold of the Western Europe population of the species. Understanding what
is causing this species' decline is a key step towards reverting this tendency. Knowing survival and
cause-specific mortality rates is essential to make decisions about future management of the
population.
Here, we use Cox Proportional Hazards Model to evaluate what are the main environmental and
anthropogenic threats of the Little Bustard in the Iberian Peninsula, using 10 years of tracking data.
This work proved to be key in identifying new threats and assessing the importance of previously
known ones. Previous studies suggest that this species decline is mainly caused by recent changes in
agricultural practices. However, we concluded that 17.1% of the Little Bustard's mortality is caused by
direct anthropogenic sources, mainly through hunting. Bioclimatic region is the main environmental
pressure, suggesting that low precipitation and temperature extremes are possibly connected with the
decline of this species. We observed different mortality tendencies between sexes, with females
having a higher mortality risk than males, which can explain the biased sex ratio reported in previous
studies. Agricultural practices did not have the expected impact on survival. Conservation strategies
should focus on reducing hunting zones in classified areas and further studies on survival of the Little
Bustard should be focused on temperature extremes.
Keywords: survival; cause-specific mortality; Iberian Peninsula; Tetrax tetrax; hunting; anthropogenic
deaths; tracking data; Cox proportional hazards model.

18
INTRODUCTION
Little Bustard (Tetrax tetrax) had originally a continuous Palaearctic distribution (Cramp and Simmons,
1980), but has suffered an accentuated decline in the late 19th century. Currently it occurs on two
major breeding areas: one centred in Kazakhstan and European Russia and another in the Iberian
Peninsula, Southern France, Sardinia and Morocco (Cramp and Simmons, 1980; del Hoyo et al.,
1996; Palacín and Alonso, 2009).
The Iberian Peninsula is thought to be the main stronghold of the western European population (Iñigo
and Barov, 2010). This species population has, however, declined from 100.000-200.000 in the 90's
(de Juana and Martínez, 1996) to 40.000-85.000 breeding males in Spain (García de la Morena et al.,
2006) and it seems to be keeping this declining tendency (Morales et al., 2006a; De Juana, 2009). In
Portugal, the population is estimated at 17.500 breeding males (Silva and Pinto, 2006) with an
unknown trend. It is currently classified as globally Near Threatened by the International Union for
Conservation of Nature (IUCN) and as Vulnerable in the Iberian Peninsula (Cabral et al., 2005,
Madroño et al., 2004) and it is considered an umbrella species since the European Union Directive on
the Conservation of Wild Birds (2009/147/EC) has classified it as priority species for conservation and
defined Special Protection Areas (SPA) for its conservation.
As a grassland bird, the Little Bustard is well adapted to open extensive agricultural areas with low
intensity farming (Cramp and Simmons, 1980), which are especially important during the breeding
season (Martínez, 1994; Moreira, 1999; Delgado and Moreira, 2000; Morales et al., 2006b). The
adults mainly feed on green plants (Jiguet, 2002), mostly Leguminosae and Cruciferae (Cramp and
Simmons, 1980; Martínez, 1994), while chicks depend almost exclusively on arthropods during the
first weeks of life (Jiguet, 2002).
A number of factors could be contributing to Little Bustard's decline, but the main threat is considered
to be agricultural intensification which leads to habitat loss or degradation (Goriup, 1994; Morales et
al., 2005b, 2006b; García et al., 2007). In Iberian landscapes, agricultural intensification leads to the
decreasing use of crop rotation systems and suppression of fallow land, which is a key breeding
habitat for the Little Bustard (Martínez, 1994; Morales 2005; Moreira et al., 2012). In France, nest
destruction during harvesting is also reported (Inchausti and Bretagnolle, 2005).
Little Bustard death causes
Predation is thought to be the most common natural cause of death for Little Bustard (Schulz, 1987).
Potential predator species include the red fox (Vulpes vulpes), hen harrier (Circus cyaneus), peregrine
falcon (Falco peregrinus) and Iberian imperial eagle (Aquila adalberti). Its preference for hill tops (Silva

19
et al., 2004), low vegetation (Martínez, 1994; Moreira, 1999; Salamolard and Moreau, 1999) and
keeping distance from overhead lines, can be an anti-predatory strategy (Silva et al., 2010b).
The Little Bustard is also probably vulnerable to climatic changes. Precipitation is associated with
higher densities of Little Bustard due to positive effects on vegetation growth and arthropod availability
(Delgado and Moreira, 2010). Predicted changes in the climate of the Iberian Peninsula indicate a
decline in overall precipitation and an increase of the mean temperature. The combination of lower
rainfall and higher temperatures lead to dry fields and less vegetation, and consequently decreasing
the abundance of plants and arthropods (Delgado et al., 2009), putting in jeopardy the survival of
adults, but particularly of juveniles, that depend almost exclusively on insects during their first days of
life (Jiguet, 2002).
Collision with power lines is one of the most significant identified anthropogenic causes of mortality,
the Little Bustard being one of the birds most susceptible to it (Bevanger, 1998; Janss, 2000). It is
estimated that about 1.5% of the Portuguese population dies annually due to overhead power lines
(Silva et al., 2010b). In addition to causing direct mortality by collision, the ongoing construction of
power lines, fences and roads is likely to be causing habitat loss. Another source of non-natural
mortality is illegal hunting, although, the extent to which this might be affecting Iberian populations is
unknown. Hunting may not only result in mortality but it may also cause disturbance (Gauger, 2007),
which disturbs Little Bustards, possible leading to some additional collisions with infrastructures.
The first goal of this study was testing for differences in survival between sexes. We hypothesized that
females had a higher mortality risk comparing to males, since there are several studies that report a
biased sex ratio towards males (Inchausti and Bretagnolle, 2005; Morales et al., 2008; Faria et al.,
2012). We also compared differences in terms of mortality risk between two land types: non-irrigated
arable land (extensive agriculture) and permanently irrigated land (intensive agriculture),
hypothesizing that intensive agriculture would have a higher mortality risk due to lack of habitat
suitability. We tested if seasons had influence in Little Bustard's mortality risk throughout the year. It
was to expect that the post-breeding season had the highest risk of mortality, by the fact that the Little
Bustard loses energy in the breeding season, being more susceptible to predation afterwards. Finally,
we tested bioclimatic regions influence on Little Bustard's survival.
An understanding of the main causes for population decline is required for sound decision-making
aiming at a species recovery. How different factors affect survival is therefore key for outlining
recovery plans of threatened species (Le Gouar et al., 2008). Even though many of the anthropogenic
mortality factors threatening this species have been described, the impacts of these factors on the
overall population are greatly unknown. Furthermore, existing ecological studies on Little Bustard do

20
not report mortality rates associated with environmental pressures that influence survival through time
(de Juana and Martínez, 1996; Jolivet and Bretagnolle, 2002; Inchausti and Bretagnolle, 2005;
Morales et al., 2006a; De Juana, 2009; Delgado et al., 2009; Palacín and Alonso, 2009; Silva et al.,
2010b, 2014b; Moreira et al., 2012a). It is then essential to study the importance of these factors in
terms of mortality risk. That information would allow population modelling under different management
scenarios and be a major contribution to the development and application of conservation strategies
specific for this species.
The main objectives of this paper are: (1) to identify the causes of anthropogenic and natural deaths of
the Little Bustard, and their relative prevalence; (2) to determine how and what factors influence
natural mortality in the Iberian Peninsula. To answer the first question, we gathered all the available
mortality data from telemetry studies of individuals tracked in the Iberian Peninsula and divided and
quantified them by death cause. To model factors driving natural deaths we gathered Little Bustard
tracking data from individuals which died from natural causes from two regions of the Iberian
Peninsula (Alentejo/Extremadura and Catalonia) and modelled the role of sex, land cover, seasons
and bioclimatic region in survival.
METHODS
Study Areas
The study was carried out in the Iberian Peninsula, within several Spanish autonomous regions
(Catalonia, Aragon, Castilla-La Mancha, Castile and León and Extremadura) and the Portuguese
region of Alentejo, covering important areas of the species distribution of Iberia (de Juana and
Martínez, 1996; Iñigo and Barov, 2010). The data collected is mostly concentrated in Catalonia and
Alentejo/Extremadura (Fig. 1 and Fig. 2). In the Northeastern areas of the Peninsula, agriculture is
more intensive with smaller fields and more irrigation (Lapiedra et al., 2011). Conversely, in the
Southwestern regions of Iberia the landscape is characterized by larger fields and considerable
amounts of grasslands (Moreira et al., 2012b).
The Iberian Peninsula is characterized by four types of bioclimatic regions according to Köppen–
Geiger climate classification system (Peel et al., 2007)(Fig. 3). This climate classification system
defines distinct types of climates using average monthly values for precipitation and air temperature.
Southwestern Iberia has a temperate climate with dry or hot summer (Csa) which consists in a dry
summer and average temperature in the hottest month above 22 °C. On the other hand, Northeastern
region has a more diverse climate, but is mainly characterized by a temperate climate without a dry
season and with a temperate summer (Cfb). The other two predominant climates of this region are the

21
cold steppe (BSk) and temperate with dry or temperate summer (Csb). Cold steppe is a dry climate
where, on average, evapotranspiration exceeds precipitation, and has average annual temperature
below 18 °C. Csb is also a temperate climate with dry summer, but with four months or more with
average temperatures above 10 °C.
Figure 1. Asterisks indicate the location of dead individuals recorded between 2001 and 2012 used in the
cause-specific analysis. The areas in light grey represent the potential habitat for the Little Bustard, representing
the land uses most frequented by the species.
Figure 2. Location of the two study areas (in dark grey), within the Iberian Peninsula: 1 - Southwestern region
(Alentejo/Extremadura); 2 - Northeastern region (Catalonia/Aragon). The areas in light grey represent the
potential habitat for the Little Bustard, representing the land uses most frequented by the species.

22
Figure 3. Iberian Peninsula Köppen-Geier climate classification.
Data collection
We collected mortality data of 143 birds that were radio-tracked in several areas of the Iberian
Peninsula (Fig.1 and Fig. 2), from 2001 to 2014, over a total period of 13 years. From this overall
database, specific datasets were used accordingly with requirements of the different objectives of this
study.
In Southwestern Iberia, the capture was made with a stuffed female used as a decoy, with trap loops
around it. The individuals that were attracted and fell in the traps were fitted with harnesses with
transmitters attached. In Northeastern Iberia, males were also captured with loops and females were
captured with the funnel trap method (Ponjoan et al., 2010). Captured individuals were followed on a
daily basis in Southwestern Iberia and on a biweekly basis in Northeastern Iberia until the signal was
lost or indicated immobility for a considerable period of time.
Assessing mortality causes
To analyze cause-specific mortality we collected data from 139 tagged individuals from several areas
of the Iberian Peninsula (Fig. 1). When a tracking signal was lost or indicated immobility for a long
period of time, the individual's last position was searched and when a feather spot or carcass were
located, the probable cause of death was designated. The cause of death was always accessed by
Others
Csb - Temperate with dry or temperate summer
Cfb - Temperate without a dry season and temperate summer
Csa - Temperate with dry or hot summer
BSk - Cold steppe
23
recovery of the carcass or by local evidences, and categorized as human-caused or natural. We
defined probable natural deaths as ecological and environmental pressures (e.g. predation or
starvation) and probable anthropogenic deaths as direct human-caused deaths (e.g. hunting or
collision). For example, if only the harness was found with bullet marks on it, or the individual was
found with dog bite marks, the cause was considered to be hunting. If the bird was found underneath
overhead transmission power lines or dead in a road, the registers were collision with power lines or
cars. Censored individuals were not considered to be mortalities (Pollock and Winterstein, 1989).
Probable deaths were therefore classified as one of the following causes: predation, collision with
overhead transmission power lines, vehicle collision and hunting. Only the former was considered
natural causes, and it was possible to distinguish predation by birds of prey from predation by
mammals. When in the presence of broken carcass bones, or feathers still attached to the remains,
the probable predator was considered to be a mammal. In contrast, if the carcass was left whole, with
feathers around it, a bird of prey was the probable predator. The individuals status was set to
censured when in doubt of the individual's death. The day of death/disappearance was assumed to be
50% of the time between the date of the last register alive and the date when the carcass was found.
Factors driving natural deaths
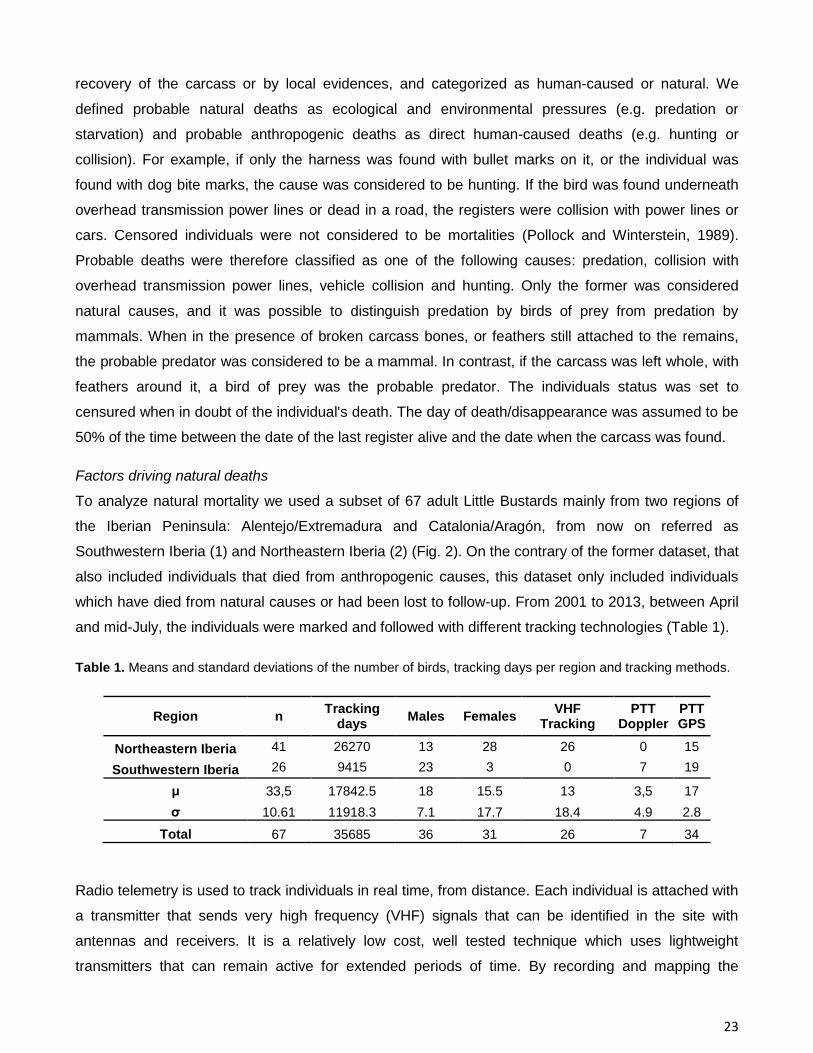
To analyze natural mortality we used a subset of 67 adult Little Bustards mainly from two regions of
the Iberian Peninsula: Alentejo/Extremadura and Catalonia/Aragón, from now on referred as
Southwestern Iberia (1) and Northeastern Iberia (2) (Fig. 2). On the contrary of the former dataset, that
also included individuals that died from anthropogenic causes, this dataset only included individuals
which have died from natural causes or had been lost to follow-up. From 2001 to 2013, between April
and mid-July, the individuals were marked and followed with different tracking technologies (Table 1).
Table 1. Means and standard deviations of the number of birds, tracking days per region and tracking methods.
Region n Tracking
days Males Females
VHF Tracking
PTT Doppler
PTT GPS
Northeastern Iberia 41 26270 13 28 26 0 15
Southwestern Iberia 26 9415 23 3 0 7 19
μ 33,5 17842.5 18 15.5 13 3,5 17
σ 10.61 11918.3 7.1 17.7 18.4 4.9 2.8
Total 67 35685 36 31 26 7 34
Radio telemetry is used to track individuals in real time, from distance. Each individual is attached with
a transmitter that sends very high frequency (VHF) signals that can be identified in the site with
antennas and receivers. It is a relatively low cost, well tested technique which uses lightweight
transmitters that can remain active for extended periods of time. By recording and mapping the

24
animal's location from multiple angles, its position can be estimated with triangulation rules. Although
VHF signals travel enormous distances, they can be blocked due to topography, water or heavy
vegetation (Poole, 2003). This technology also depends on the person's ability to work with the
antennas and receivers and the effort that is made to locate the animal. Without that, the technique
has low performance and can easily mislead the study. PTT Doppler satellite telemetry uses platform
transmitter terminals (PTTs) to emit ultra-high frequency signals that are identified by polar orbiting
meteorological satellites with Argos systems attached. This satellites sweep the earth surface
registering the PTTs signals. An animal location is determined by the perceived change in frequency
that results from the movement of a transmitter and receiver - like in the Doppler effect. This
technology can obtain locations variable error between 250 and 2000 m, depending on the quality of
the location (Collecte Localisation Satellites, 2014). PTT GPS technology combines the calculation of
locations via Global Positioning System (GPS) and the transmission of this information to the Argos
receivers on meteorological satellites. A GPS location has only a few meters of error and usually a
high frequency data acquisition.
Data analysis
Capturing and handling of birds can lead to capture myopathy (Williams and Thorne, 1996). The Little
Bustard is particularly susceptible to myopathy (Marco et al., 2006; Ponjoan et al., 2008). This disease
can affect the bird’s mobility up to 11 days after capture (Ponjoan et al., 2008) and consequently
turning it vulnerable to predation. To avoid confounding effects between natural deaths and capture
myopathy, the period of time between capturing handling and releasing of the birds was reduced to a
minimum and all bird mortality that occurred up to 25 days after capturing and tagging, was eliminated.
Data homogenization is also an important step to reduce bias. Since we were dealing with different
data collection methods, there was a need to adapt the data grain. PTT GPS daily tracking data was
thereby transformed in biweekly data so we could analyse it conjointly. All the in-between daily
locations were deleted.
Testing the influence of tracking devices
Because we used VHF tracking, PTT Doppler and PTT GPS tracking technologies in this study, it was
essential to test for survival differences between birds followed with different technologies. To access
that, we carried out a Kaplan-Meier analysis (Kaplan and Meier, 1958), and the Log-Rank Test
(Harrington and Fleming, 1982) was used to compare the distributions. To do this analysis, we used
data from Northeastern Iberia, as it was the only area with representative numbers of GPS and radio-
tracking technologies (Table 1).
Transmitter's weight can also influence animal survival, and consequently can potentially affect the
study final results (Wilson and McMahon, 2006; Brooks et al., 2008; Casper, 2009). Backpack
25
transmitters, like the ones used in our study, have the advantage of not affecting the bird's balance
(Irvine et al., 2007). In relation to transmitter weight, it is recommended it be under 5% of the body
weight for harness mounts (Kenward, 2001). The medium weights of the backpacks was of 4,54 (σ
±0.69) of the weight of the bustards. To test whether the weight of the technology influenced the
survival of the tracked birds we also used Kaplan-Meier estimate and the Log-Rank Test.
Assessing mortality causes
Descriptive statistics was used to identify the relative prevalence of anthropogenic and natural deaths
in the population. The Heisey and Fuller estimator (Heisey and Fuller, 1985) was used to compute
annual mortality rates of the Little Bustard for each type of causing factor, using the software
MICROMORT 1.3 (Heisey and Fuller, 1985). We evaluated the hunting indirect pressure by
disturbance, testing if the mortality frequencies of the different death causes were affected by the
hunting season. The seasons were divided based on hunting periods in the Iberian Peninsula: hunting
season (1 September - 28 February) and non-hunting season (1 March - 31 August), based on
knowledge of legal hunting periods on land within the study areas. The frequencies were computed
excluding all individuals whose exact death day was not known, to avoid bias related with hunting
seasons. To compare mortality frequencies we used the Fisher's exact test, using the fisher.test
function in R software. We also divided the data between sexes to test if they were differently affected
by both seasons, comparing mortality frequencies in and out of the hunting periods.
Factors driving natural deaths
We selected four variables that could have influence on Little Bustard's survival: sex, season, land
cover and bioclimatic region.
The year was divided in three different periods of four months each: Breeding (March to June), Post-
breeding (July to October) and Winter (November to February). This divisions were made to
comprehend the season periods of Southwestern Iberia and Northeastern Iberia, since there is a small
difference in the start and end dates between the two regions.
Land use data was obtained from Corine Land Cover (European Environment Agency) and processed
in Geographic Information System (GIS) using Quantum GIS 2.0 (Quantum GIS Development Team
2012).
To find the estimates of the survival function for the environmental variables that possible influence
Little Bustard's survival, multivariate statistical analyses was performed. We quantified mortality risks
for the Little Bustard with the Extended Cox Proportional Hazards Model for Time-Dependent
Variables (Andersen and Gill, 1982; Therneau and Grambsch, 2000; Kleinbaum and Klein, 2005)

26
using the survival package (Therneau and Grambsch, 2000; Therneau, 2014) of the statistical
programming language R (R Development Core Team 2014). We tested for an effect of sex, land use,
season and bioclimatic regions, using those factors as covariates on the global model. Dredge
function from the MuMIn package (Barton, 2014) was used to generate a set of models with all
combinations of the terms in the global model. We compared the relative performance of the
alternative models using Akaike's Information Criterion (AIC; Akaike, 1974; Burnham and Anderson,
2002) and chose models with (Burnham et al., 2010). Full model averaging based on AIC
(Burnham and Anderson, 2001; Lukacs et al., 2009) was performed and the importance of the
covariates was estimated. To deal with ties between events (Xin et al., 2013), the Efron approximation
was used for being more accurate and computationally efficient than the usually used Breslow method
(Therneau and Grambsch, 2000). To visualize the main patterns in the averaged model, fitted values
were plotted against each of the explanatory variables in the model. As all variables were categorical,
the mean and standard errors of the fitted values were estimated for each category. Prior to model
selection, we assessed to which extent the assumption of proportional hazards was met, using
cox.zph function (Grambsch and Therneau, 1994).
RESULTS
Assessing mortality causes
The weight of the tracking device did not affect the survival of Little Bustards ( = 0.6, 1 df, p=0.436),
neither did the tracking method ( = 0, 1 df, p=0.926).
We documented 62 mortality events from all causes over the course of the study, after censoring
individuals whose transmitter stopped working. Anthropogenic death causes represented 41.9% of the
Little Bustard's detected mortality (Fig. 4). Hunting was the most common source of anthropogenic
mortality (32.3%), followed by power line collision (6.5%) and vehicle collision (3.2%). The only
identified natural cause of mortality was predation, which was responsible for 58.1% of the registered
mortality. Birds of prey were the main identified predators with a presence of 55.6%, and mammals
correspond to 38.9% of the predation events. Cases where the identified cause was predation but in
which it was not possible to recognize the predator corresponded to 5.6%.
27
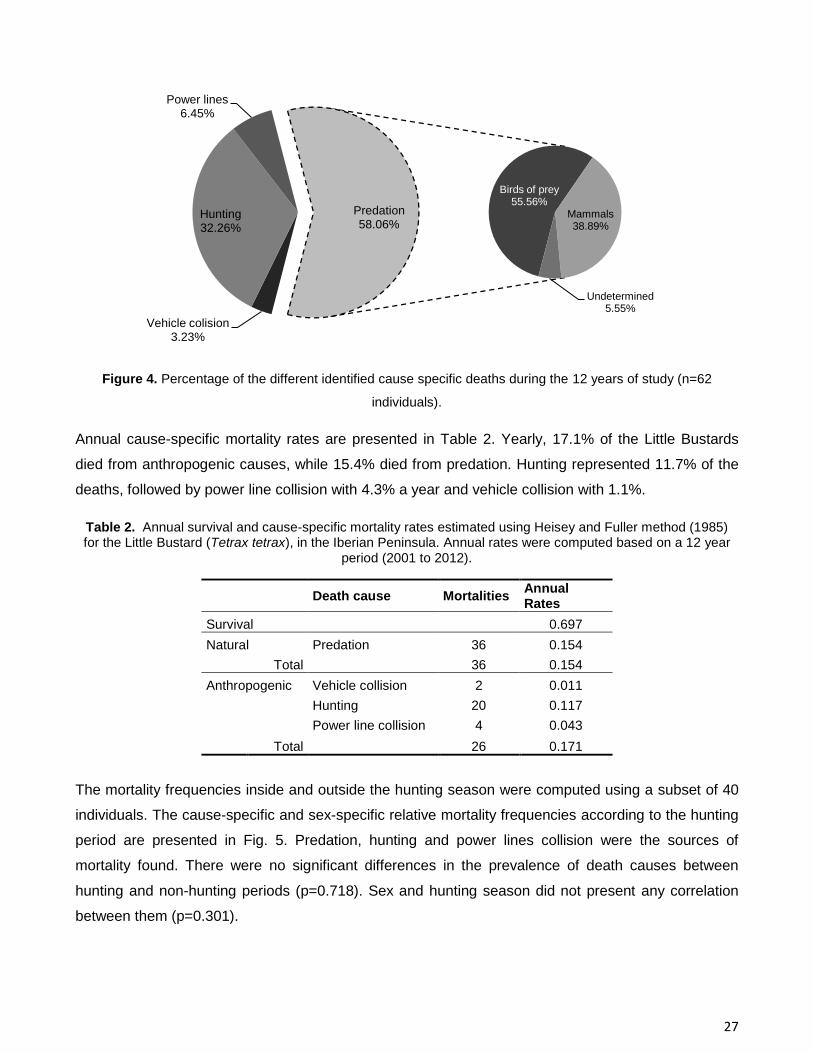
Figure 4. Percentage of the different identified cause specific deaths during the 12 years of study (n=62
individuals).
Annual cause-specific mortality rates are presented in Table 2. Yearly, 17.1% of the Little Bustards
died from anthropogenic causes, while 15.4% died from predation. Hunting represented 11.7% of the
deaths, followed by power line collision with 4.3% a year and vehicle collision with 1.1%.
Table 2. Annual survival and cause-specific mortality rates estimated using Heisey and Fuller method (1985) for the Little Bustard (Tetrax tetrax), in the Iberian Peninsula. Annual rates were computed based on a 12 year
period (2001 to 2012).
Death cause Mortalities
Annual Rates
Survival 0.697
Natural Predation 36 0.154
Total 36 0.154
Anthropogenic Vehicle collision 2 0.011
Hunting 20 0.117
Power line collision 4 0.043
Total 26 0.171
The mortality frequencies inside and outside the hunting season were computed using a subset of 40
individuals. The cause-specific and sex-specific relative mortality frequencies according to the hunting
period are presented in Fig. 5. Predation, hunting and power lines collision were the sources of
mortality found. There were no significant differences in the prevalence of death causes between
hunting and non-hunting periods (p=0.718). Sex and hunting season did not present any correlation
between them (p=0.301).
Birds of prey 55.56%
Mammals 38.89%
Undetermined 5.55%
Vehicle colision 3.23%
Hunting 32.26%
Power lines 6.45%
Predation 58.06%

28
Figure 5. (a) Cause-specific relative mortality frequencies for hunting and non-hunting periods (b) Male and
female relative mortality frequencies inside and outside the hunting period.
* 1 Sep - 28 Feb
** 1 Mar - 31 Aug
Factors driving natural deaths
According to Burnham et al. (2010), models where ΔAIC is in the 2–7 range have some support and
should rarely be dismissed. We have then considered all models with ∆AIC<5 , resulting in a selection
of 7 models with Akaike weights summing approximately 99% confidence set (Table 3). Bioclimatic
region was the covariate with strongest support, having a relative importance equal to 1 (Table 4),
followed by sex, land cover, and finally, season.
0
0.1
0.2
0.3
0.4
0.5
0.6
0.7
0.8
0.9
1
Hunting Non-hunting
Rela
tive f
req
ue
ncy
Predation
Hunting
Collision
0
0.1
0.2
0.3
0.4
0.5
0.6
0.7
0.8
0.9
1
Hunting Non-hunting
Rela
tive f
req
ue
ncy
Male
Female
*
*
**
**
(a)
(b)

29
Table 3. Summary of Cox proportional hazards models estimating survival rates of the Little Bustard, during the
course of the study, 2001-2014. AIC weights sum up to 0.99 and indicate the relative likelihood of a given model
being the most appropriate.
Covariates df AIC ∆AIC w
Region + Sex 4 194.28 0.00 0.39
Region + Land Cover + Sex 6 195.59 1.30 0.20
Region 3 195.68 1.40 0.19
Region + Land Cover 5 197.63 3.35 0.07
Region + Season + Sex 6 197.75 3.47 0.07
Region + Season 5 198.93 4.64 0.04
Region + Land Cover + Season + Sex 8 199.20 4.92 0.03
Table 4. Relative importance of the covariates after model averaging, calculated as the sum of the AIC over all
of the models in which the parameter of interest appears.
Covariates Region Sex Land Cover Season
Relative variable importance 1.00 0.70 0.31 0.14
Nº of containing models 7 4 3 3
The full model averaged regression coefficients showed that the temperate climate with dry or hot
summer (Csa), characteristic of Southwestern climate, has a higher relative mortality risk than Cfb,
which covers the majority of the Northeastern study area. BSk has the second higher risk of mortality,
followed by Csb. The results are expressed in Table 5.
Table 5. Full model-averaged coefficients for factors driving natural deaths.
Covariates Estimate Std. Error
BSk climate 0 -
Cfb climate -1.726 1.147
Csa climate 0.410 1.246
Csb climate -1.570 1.477
Female 0 -
Male -0.727 0.661
Extensive 0 -
Intensive -0.243 0.494
Others 0.055 0.283
Breeding 0 -
Post-breeding -0.015 0.424
Winter 0.055 0.399
Differences were observed between the mortality of females and males. Females seem to have a
greater risk of mortality than males. Land cover use did not have a significant influence on mortality,
although extensive agricultural land uses showed higher risk of mortality than intensive agricultural
30
land uses and other land uses. Seasons practically showed no differences between them. Cox
proportional hazards assumption was met for every variable (Appendix A).
When plotting the fitted values to visualize the net effect of the variables (Fig. 6), sex was the only
variable showing a different tendency than the model coefficients, with males showing a higher
mortality than females.
Figure 6. Relative mortality risks of each variable: bioclimatic regions, sex, land cover and season, after doing
model average and computing the mean of the fitted values. Standard errors are also plotted.

31
DISCUSSION
Is anthropogenic mortality sustainable?
Anthropogenic death causes had greater prevalence than anticipated for a protected species,
representing ca. 42% of the registered mortality events. Our work estimates that ca. 17% of the
Iberian population die every year due to human-caused deaths, which is higher than annual mortality
by predation (ca. 15%), the main natural cause of mortality. It should be noticed however that this
result only expresses adult annual mortality. Given that only 54% of the chicks survive to became
adult (Schulz, 1987), total annual population mortality (considering both juvenile and adult together)
will be higher. Productivity is a key demographic parameter for the viability of Little Bustard
populations and, if favorable productivity is maintained, the Little Bustard's population may not decline
in spite of these estimated mortality rates (Inchausti and Bretagnolle, 2005; Morales et al., 2005a;
Delgado et al., 2009). In areas with poor habitat quality like the Northeastern Iberia (Lapiedra et al.,
2011), a biased sex ratio towards males occurs (Inchausti and Bretagnolle, 2005; Morales et al.,
2005a, 2008), and this results in a decrease in productivity due to female shortage (Tarjuelo et al.,
2013). Therefore, degraded sites with populations presenting low breeding productivity such as the
ones recorded in Northern Spain and Western France (Inchausti and Bretagnolle, 2005; Morales et al.,
2005a; Delgado et al., 2009), are vulnerable due to natural and anthropogenic mortality.
Iñigo and Barov (2010), in the European Union action plan for the Little Bustard, state that the main
threats to the species are entirely connected with agricultural practices. Anthropogenic death causes
are poorly studied and are mainly attributed to collision with power lines (Silva et al., 2010b, 2014b),
with no references to hunting. We found that poaching contributes substantially to the overall mortality;
11.7% of the population dies every year from hunting.
Previous studies estimated that collision with overhead power lines cause an annual mortality of over
1.5% of the Portuguese Little Bustard population (Infante et al., 2005; Silva et al., 2010b). Our work
now estimates a mortality almost three times higher, with 4.3% of the population dying per year due to
power line collision. We also found that 1.1% die every year by collision with vehicles, which was an
unknown threat up to now. However, this estimate was based only on two casualties, and thus
requires validation. The Little Bustard has been described to avoid the vicinity of transmission lines
(Silva et al., 2010b) as well as roads and human structures (Suárez-Seoane, 2002; Silva et al., 2004;
Osborne and Suárez-Seoane, 2006). The ongoing habitat loss and degradation in the Iberian
Peninsula and the growing expansion of the power line grid can be forcing the species proximity to
these structures.

32
As for predation, even though birds of prey were responsible for most of the observed cases of
mortality caused by predation, this difference was not sufficiently marked to ascertain statistically if
they are more important predators than mammals.
There were no differences between mortality frequencies inside and outside hunting periods. This
suggests that the Little Bustard is subject to the same amount of pressure by predation, power lines
collision and hunting, inside and outside the hunting period. There was also not found a relation
between sex and hunting period. From the 40 mortality events recorded, eight were hunting cases
found in non-hunting periods, indicating that hunting is occurring also outside the general hunting
season, although four of them coincide with the hunting period of Columba palumbus and Streptopelia
turtur in Portugal or the half-closed season in Spain, a hunting season with restrictions that usually
starts in mid-August.
Bioclimatic region and sex explain most of the natural mortality
Bioclimatic region is the environmental factor with the greatest influence on Little Bustard's mortality
rates, with Csa presenting the higher risk and Cfb the lowest. These two climates are, respectively, the
characteristic climates of the Southwestern and Northeastern study areas. The Southwestern
grasslands in Iberia (Csa) are dominated by a dry climate with high temperatures in summer, while
Northeastern Iberia (Cfb) does not have a marked dry season and has milder temperatures. Higher
temperatures associated with low rainfall lead to dryer fields and less food resources, with likely
negative impacts on the species. The results corroborate the conclusions of previous studies which
found that higher densities of the Little Bustard are associated with higher precipitation, due to
increased vegetation growth and arthropod availability (Delgado and Moreira, 2010). Although poorly
represented in our data, BSk was also found to be associated to a high mortality risk. It is a dry
climate, with mild hot summers and cold winters, supporting the same conclusion. Temperature seems
to play a crucial factor in Little Bustard's survival (Delgado et al., 2011). Having a higher surface-to-
volume ratio than, for example, the Great Bustard (Otis tarda), the Little Bustard is described to have a
lower tolerance to extreme temperatures, and is more sensitive to temperature changes (Delgado et
al., 2011).
Our results suggest that females have a higher risk of mortality than males. Inchausti and Bretagnolle,
(2005) reported a higher annual sex-specific survival rate for males in western France, although the
difference was not statistically significant. During the breeding season, females have to spend energy
with egg laying and satisfying the requirements of the offspring (Cramp and Simmons, 1980), and in
some cases producing a second clutch. Females solely ensure parental care, which extends until after
the breeding season (Cramp and Simmons, 1980). As a result, they may reach a lower physical
condition, which can lead to a lower tolerance to winter temperatures and a greater exposition to

33
predators, thus affecting their winter fitness. Males, on the other hand, have time to store the energy
needed to migrate to the wintering sites after breeding. We did not find cases of female deaths due to
crop harvesting. Fitted values show a opposite pattern compared with the model averaging
coefficients (for a similar case, see Águas et al., (2014)), probably because there is a confounding
effect between this variable and the bioclimatic region. In fact, only 12% of the tagged individuals in
the Southwestern Iberia (where the mortality risk is higher) were females, in contrast with the
Northeastern Iberia, with 68% tagged females.
The habitat in Northeastern Iberia has experienced, since the mid-thirties, agricultural intensification
and a decrease of fallow land; its Little Bustard population is experiencing a decline (Lapiedra et al.,
2011). On the contrary, the Southwestern area presents better preserved habitats. In spite of the
higher mortality risk associated with a drier and hotter climate, it maintains some areas with high Little
Bustard densities (García de la Morena et al., 2006; Silva and Pinto, 2006). Areas with low habitat
quality are usually associated with populations with a sex ratio biased towards males, while the sex
ratio in regions with good habitat tends to be balanced (Silva et al., 2014a). The decline of this species
in low habitat quality sites was, until now, attributed to crop harvesting and lack of food resources for
the offspring (Inchausti and Bretagnolle, 2005). Adding to that, females have to expend more energy
to feed and are consequently more vulnerable than males. We hypothesize that in Northeastern Iberia,
the low fecundity rate and overall reproductive success (Tarjuelo et al., 2013) does not compensate
natural and anthropogenic mortality.
Land cover had a lower impact on survival when compared with both bioclimatic region and sex.
Intensive agriculture is believed to be the main cause of the Little Bustards decline (Goriup, 1994;
Morales et al., 2005b, 2006b; García et al., 2007), and thus it was expected that land cover types
associated with agricultural intensification, such as intensive farmland mosaics, would have a higher
associated mortality risk. Nevertheless, we did not identified this pattern. Although extensive
agriculture is crucial during the breeding season, intensive agriculture may provide abundant food
availability that could be important for post-breeding and winter survival, especially during drought
years. In the Southwestern Iberia, in these seasons, the Little Bustard performs movements from non-
irrigated farmland to more intensive agricultural sites, some of which with irrigated land uses (Silva et
al., 2007). The risk of mortality could eventually not differ between extensive and intensified sites,
however there could be a relation between the effect of land use and season.
Season has a small impact on survival of the Little Bustard, having the least importance in the final
model, with a maximum difference between relative mortality risks of 0.015. However, it is possible
that a regional confounding effect may be affecting the results. The study was conducted at an Iberian
Peninsula scale, and thus it is expected that the Southwestern study area, being the hottest and driest

34
region, has a higher mortality in summer, and therefore seasons could have a more evident effect at a
regional scale. In the Northeastern Iberia, the climate is not as dry and hot, being the seasonal effect
less evident.
Data limitations and assumptions
It is important to note that we are assuming that the identifications of the causes of death are reliable,
although it is a probable death cause, with absence of necropsy. In addition, we also assume that the
probability of detecting anthropogenic death is the same as in detecting natural death.
To examine population dynamics, we rely on marked individuals. We have shown that different
tracking technologies and transmitter weights under 6.76% of body weight did not influence Little
Bustard survival. We want to note that, although we tried to eliminate all bias related to tagging and
tracking techniques, we cannot distinguish survival between marked individuals and non-marked
individuals.
Conservation implications
Our work shows how poorly understood and previously unknown threats are affecting the survival of
the most important western Little Bustard European population. Reducing anthropogenic mortality can
have a major impact on the species viability particularly with populations that show low breeding
productivity. Awareness campaigns and law enforcement at key conservation areas could reduce
poaching, that alone affects almost 12% of the population annually.
Anthropogenic caused deaths seem to have higher importance than what was initially foreseen in this
species, which has a threatened conservation status and is subjected to conservation measures. A
tighter control during hunting seasons, together with the enforcement of hunting legislation and
possibly the creation of additional no hunting zones in classified areas, should be major contributions
to the decrease of anthropogenic mortality. Low awareness of the species conservation status is a
problem among the general population and hunters, and should be promoted.
The unexpected high impact of collision with transmission power lines, highlights the importance to
adapt the overhead electric power line network to conservation needs. This may include the
relocation of existing hazardous power lines and the routing of new ones away from areas with greater
collision risk (Silva et al., 2014b). New power line designs, that minimizes collision, can also be
considered (Silva et al., 2010b, 2014b; Alcazar, 2013). Legislation should be drawn up at national
level to ensure the integration of these preventive measures into the design of new power lines
nationwide and not limited to the Natura 2000 network.

35
Taken together, our results suggest that climate and sex are the main factors affecting Little Bustard's
survival. This species decline may be accentuated by the recent changes in climate, characterized by
decreasing precipitation, temperature rise and frequency of heat waves. We hypothesize that in
addition to rainfall, temperature could be affecting Little Bustard's survival, and that should be
considered in future survival studies. Survival modeling under different climatic conditions could be the
next step for understanding the Little Bustard climatic requirements.
ACKNOWLEDGEMENTS
This article will be later submitted for publishing with the following authors: Joana Marcelino (CEABN-InBIO/DBA - University of Lisbon), João Paulo Silva (CEABN-InBIO/DBA - University of Lisbon), Santiago Mañosa (DBA-IRBio, Universitat de Barcelona), Francesc Cuscó Martínez (DBA-IRBio, Universitat de Barcelona), Manuel B. Morales (TEG - Universidad Autónoma de Madrid), Eladio Garcia de La Morena (TEG - Universidad Autónoma de Madrid), Gerard Bota (BAC-Lab - Forest Sciences Center of Catalonia), Jorge Manuel Palmeirim (DBA - University of Lisbon) and Francisco Moreira (CEABN-InBIO/DBA - University of Lisbon).
The Portuguese tracking data from 2000 and 2005 was funded by the European Union program INTERREG III-A - FAUNATRANS project, and between 2009 and 2012 was funded by EDP S.A. ‘‘Fundo EDP Biodiversidade’’. Tracking data provided by the Autonomous University of Madrid was funded by Proyectos del Ministerio de Ciencia español REN 2000-0765 and CGL2004-06147-C02-02. University of Barcelona tracking program was funded by proyectos del Ministerio de Ciencia Español CGL2004-06147-C02-01 and CGL2009-13029/BOS, and the companies REGSEGA, ASG and Infraestructures de la Generalitat de Catalunya, SAU. Aragón tracking data was funded by the Dirección General de Conservación del Medio Natural del Departamento de Agricultura, Ganadería y Medio Ambiente del Gobierno de Aragón. Birdlife International and NatureServe provided bird species distribution maps of the world.

36
DISCUSSION
Conservation and development of management programs on threatened bird species, as well as
species recovery plans, crucially benefit from information derived from survival studies on free-ranging
animals (e.g., Lebreton et al., 1992; Beissinger and Westphal, 1998; McCallum, 2000; Reed et al.,
2002; Le Gouar et al., 2008). These kind of studies is key to assess the relevance of the main threats.
It can also provide a valuable understanding of population dynamics, as the probability of survival may
vary with individual characteristics and as a function of biotic and abiotic environmental variables
(Lebreton et al., 1992).
Survival data require specialized analytical techniques, and field studies are not always implemented
to take into account all the assumptions associated with this kind of analysis. Accordingly, an
important concern is that survival rates derived from ecological studies have associated bias and lack
of precision (McCallum, 2000; Fox, 2001; Winterstein et al., 2001; Williams et al., 2002; Zens and
Peart, 2003). An effort should be made to improve the planning of field work, especially to obtain a
more precise time of death. This could be achieved by increasing the field work effort when searching
for carcasses, or by using tracking devices with accelerometers and sensors that
measure physiological parameters (Grant et al., 1971; Butler and Woakes, 1979). The development of
new, lighter and low cost devices it is also essential to obtain more data, since the overall available
devices are expensive, not allowing the tagging of a large number of animals.
Telemetry is the most reliable technology used in wildlife survival estimation, but has some constrains
that turn robust survival estimation in wildlife studies challenging (Murray, 2002). It is a common
practice to assume that transmitters do not affect subject survival, and consequently adding bias to the
study (White and Garrott, 1990; Winterstein et al., 2001). In our case-study we managed to test the
influence of transmitter weight, tracking method and eliminate the presence of deaths by myopathy.
Transmitter weight under 6.76% of body weight and the use of different tracking methods did not have
influence on Little Bustard's survival, not adding bias to the study. Probable deaths by myopathy
where rejected from the study.
Telemetry studies have user defined frequency of monitoring observations, which can lead to
uncertainty in the timing of the death event. Daily or biweekly monitoring should be adequate for
unbiased survival studies, while greater time intervals make it unreliable (Murray, 2002). As we used
data from multiple sources and consequently with different frequencies of monitoring observations
(daily and biweekly), we had to homogenise the data to the lowest frequency. This was a good
compromise and allowed us to standardize the data to a greater scale, and also qualify it, by removing
cases where the data acquisition had errors .

37
Recently, wildlife survival estimation had significant improvements in the development of software for
the analysis of complex survival functions (Williams et al., 2002). Although there are many available
software products that perform survival analysis, such as MARK (White and Burnham, 1999), SAS
(Allison, 1995), SPSS (IBM Corp, 2013), XLSTAT-Life (Addinsoft, 2014) or Stata (StataCorp, 2009), R
(R Development Core Team 2009) is a free and open-source software that allow for high data
flexibility and provides interfaces to other programs such as QGIS (Quantum GIS Development Team
2012) or GRASS-GIS (Neteler and Mitasova, 2008). It also provides the user with very active and
engaged community that provides high quality support, allowing the user to solve conceptual problems
quicker.
Overall, survival analysis using Cox proportional hazards model was successfully applied to an
ecological case-study and proved capable of accommodating problems resultant from the estimation
of survival rates of free-ranging animals like time-dependent covariates, tied events and interval-
censored deaths. We found that bioclimatic region is the most important variable influencing Little
Bustard's survival, higher mortality being associated with dryer climates and higher temperatures. This
knowledge might be crucial for planning future studies, focused on climatic effects on this species. We
also found that females have a higher risk of mortality than males. This is probably due to energy carry
over effects of the breeding and post-breeding season, given that parental care is provided solely by
the female (Cramp and Simmons, 1980). This problem is possibly aggravated in low habitat quality
areas, where habitats do not provide the sufficient amount of food in post-breeding season (Silva et
al., 2007). Although it was initially foreseen that land use was the main driver of survival, this was not
confirmed. Dispersion due to inadequate habitat leads to an extra energy expense that can lead to
higher mortality probability. Season was the factor with the least impact in mortality.
Cause-specific mortality rates were also successfully computed using Heisey and Fuller estimator
(Heisey and Fuller, 1985), with MICROMORT 1.3. The software was found to have low flexibility and
provide a difficult graphical interpretation. We found that anthropogenic mortality has almost the same
impact as mortality by natural causes, probably not being sustainable at short-term, especially when
associated with low productivity. Hunting was also found to be the main direct human-caused threat,
followed by collision with power lines, with a much higher prevalence than what was initially expected.
38
REFERENCES
Addinsoft, 2014. Addinsoft SARL. URL: http://www.xlstat.com/en/products-solutions/life.html (accessed 9.28.14).
Águas, A., Ferreira, A., Maia, P., Fernandes, P.M., Roxo, L., Keizer, J., Silva, J.S., Rego, F.C., Moreira, F., 2014. Natural establishment of Eucalyptus globulus Labill. in burnt stands in Portugal. For. Ecol. Manage. 323, 47–56. doi:10.1016/j.foreco.2014.03.012
Akaike, H., 1974. A new look at the statistical model identification. IEEE Trans. Automat. Contr. 19.
Alcazar, R., 2013. Conservation of Great Bustard, Little Bustard and Lesser Kestrel in the Baixo Alentejo cereal steppes - Final LIFE Report. Liga para a Protecção da Natureza (LPN).
Allison, P., 1995. Survival analysis using SAS: a practical guide. AMC.
Altman, D., 1992. Analysis of survival times. In: Practical statistics for Medical research. Chapman & Hall, pp. 365–93.
Andersen, P., Gill, R., 1982. Cox’s regression model for counting processes: a large sample study. Ann. Stat.
Barton, K., 2014. MuMIn: Multi-model inference. R package version 1.10.0. http://CRAN.R-project.org/package=MuMIn.
Beissinger, S., Westphal, M., 1998. On the use of demographic models of population viability in endangered species management. J. Wildl. Manage. 62, 821–841.
Bender, L.C., Lomas, L. a., Browning, J., 2007. Condition, Survival, and Cause-Specific Mortality of Adult Female Mule Deer in North-Central New Mexico. J. Wildl. Manage. 71, 1118–1124. doi:10.2193/2006-226
Bevanger, K., 1998. Biological and conservation aspects of bird mortality caused by electricity power lines: a review. Biol. Conserv. 86, 67–76.
Bignal, E., McCracken, D., 1996. Low-intensity farming systems in the conservation of the countryside. J. Appl. Ecol. 33, 413–424.
BirdLife International, NatureServe, 2014. Bird species distribution maps of the world.
Blanco, G., Tella, J.L., Torre, I., 1998. Traditional farming and key foraging habitats for chough Pyrrhocorax pyrrhocorax conservation in a Spanish pseudosteppe landscape. J. Appl. Ecol. 35, 232–239. doi:10.1046/j.1365-2664.1998.00296.x
Bouma, J., Varallyay, G., Batjes, N.., 1998. Principal land use changes anticipated in Europe. Agric. Ecosyst. Environ. 67, 103–119. doi:10.1016/S0167-8809(97)00109-6
Brooks, C., Bonyongo, C., Harris, S., 2008. Effects of Global Positioning System Collar Weight on Zebra Behavior and Location Error. J. Wildl. Manage. 72, 527–534. doi:10.2193/2007-061
Burnham, K.P., Anderson, D.R., 2001. Model Selection and Multimodel Inference, 2nd ed, Angewandte Chemie International Edition. Springer-Verlag, New York.
Burnham, K.P., Anderson, D.R., Huyvaert, K.P., 2010. AIC model selection and multimodel inference in behavioral ecology: some background, observations, and comparisons. Behav. Ecol. Sociobiol. 65, 23–35. doi:10.1007/s00265-010-1029-6
Butler, P., Woakes, A., 1979. Changes in heart rate and respiratory frequency during natural behaviour of ducks, with particular reference to diving. J. Exp. Biol. 79, 283–300.
Buuveibaatar, B., Young, J.K., Berger, J., Fine, A.E., Lkhagvasuren, B., Zahler, P., Fuller, T.K., 2013. Factors affecting survival and cause-specific mortality of saiga calves in Mongolia. J. Mammal. 94, 127–136. doi:10.1644/11-MAMM-A-077.1
Cabral, M.J., Almeida, J., Almeida, P.R., Ferrand de Almeida, N., Oliveira, M.E., Palmeirim, J.M., Queiroz, A., Rogado, L., Santos-Reis, M., 2005. Livro Vermelho dos Vertebrados de Portugal. Instituto da Conservação da Natureza, Lisboa.
Casper, R.M., 2009. Guidelines for the instrumentation of wild birds and mammals. Anim. Behav. 78, 1477–1483. doi:10.1016/j.anbehav.2009.09.023
Chamberlain, D., Fuller, R., 2000. Changes in the abundance of farmland birds in relation to the timing of agricultural intensification in England and Wales. J. Appl. Ecol. 37, 771–788.

39
Collar, N.J., Crosby, M.J., Stattersfield, A.J., 1994. Birds to Watch 2: The World List of Threatened Birds. Cambridge.
Collecte Localisation Satellites, 2014. Argos User’s Manual [WWW Document]. Toulouse, Fr. URL http://www.argos-system.org/files/pmedia/public/r363_9_argos_users_manual-v1.6.3.pdf (accessed 11.7.14).
Cox, D.R., 1972. Regression Models and Life-Tables. J. R. Stat. Soc. Ser. B 34, 187–220.
Cramp, I.S., Simmons, K.E.L., 1980. Handbook of the Birds of Europe, the Middle East and North Africa: The Birds of the Western Palearctic, Vol. 2: Hawks to Bustards Vol 2, 1st ed. Oxford University Press, London.
De Juana, E., 2009. The Dramatic Decline of th Little Bustard Tetrax tetrax in Extremadura (Spain). Ardeola 56, 119–125.
De Juana, E., Martínez, C., 1996. Distribution and conservation status of the Little Bustard Tetrax tetrax in the Iberian Peninsula. Ardeola 43, 157–167.
Del Hoyo, J., Elliott, A., Sargatal, J., 1996. Handbook of the Birds of the World. Lynx Edicions.
Delgado, A., Moreira, F., 2000. Bird assemblages of an Iberian cereal steppe. Agric. Ecosyst. Environ. 78, 65–76. doi:10.1016/S0167-8809(99)00114-0
Delgado, A., Moreira, F., 2010. Between-year variations in Little Bustard Tetrax tetrax population densities are influenced by agricultural intensification and rainfall. Ibis (Lond. 1859). 152, 633–642.
Delgado, M., Traba, J., Morales, M., 2011. Climate niche constraints in two coexisting steppe birds: the little and the great bustards. Ardeola 58, 223–238.
Delgado, M.P., Morales, M.B., Traba, J., Garcia De La Morena, E.L., 2009. Determining the effects of habitat management and climate on the population trends of a declining steppe bird. Ibis (Lond. 1859). 151, 440–451. doi:10.1111/j.1474-919X.2009.00927.x
Domingues, P., Alaminos, J., García-Garrido, S., Hachero-Cruzado, I., Rosas, C., 2012. Growth and survival of juvenile spider crabs, Maja brachydactyla (Balss, 1922), fed with fresh or frozen mussels. Aquac. Res. 43, 167–177. doi:10.1111/j.1365-2109.2011.02813.x
Donald, P.F., Green, R.E., Heath, M.F., 2001. Agricultural intensification and the collapse of Europe’s farmland bird populations. Proc. Biol. Sci. 268, 25–29. doi:10.1098/rspb.2000.1325
Donázar, J., Negro, J., Hiraldo, F., 1993. Foraging habitat selection, land-use changes and population decline in the lesser kestrel Falco naumanni. J. Appl. Ecol. 30, 515–522.
Evelsizer, D.D., Bollinger, T.K., Dufour, K.W., Clark, R.G., 2010. Survival of radio-marked mallards in relation to management of avian botulism. J. Wildl. Dis. 46, 864–877. doi:10.7589/0090-3558-46.3.864
Faria, N., Rabaça, J., Morales, M., 2012. The importance of grazing regime in the provision of breeding habitat for grassland birds: The case of the endangered little bustard (Tetrax tetrax). J. Nat. Conserv. 20, 211–218. doi:10.1016/j.jnc.2012.03.003
Fellows, I., 2012. Deducer: A Data Analysis GUI for R. J. Stat. Softw. 49, 1–15.
Fox, G.A., 2001. Failure-time analysis, in: Schreiner, S.M., Gurevitch, J. (Eds.), Design and Analysis of Ecological Experiments. Oxford University Press, New York, USA, pp. 235–266.
García de la Morena, E.L., Bota, G., Ponjoan, A., Morales, M.., 2006. El sisón común en España. I censo Nacional.
García, J., Suárez-Seoane, S., Miguélezc, D., Osborned, P.E., Zumalacárreguie, C., 2007. Spatial analysis of habitat quality in a fragmented population of little bustard (Tetrax tetrax): Implications for conservation. Biol. Conserv. 7, 45–56. doi:10.1016/j.biocon.2007.01.013
Gauger, K., 2007. Occurrence, ecology and conservation of wintering Little Bustards Tetrax tetrax in Azerbaijan. Arch. für Naturschutz und Landschaftsforsch. 46, 5–27.
Gauthier, G., Pradel, R., Menu, S., Lebreton, J., 2001. Seasonal survival of greater snow geese and effect of hunting under dependence in sighting probability. Ecology 82, 3105–3119.
Goel, M.K., Khanna, P., Kishore, J., 2010. Understanding survival analysis: Kaplan-Meier estimate. Int. J. Ayurveda Res. 1, 274–278. doi:10.4103/0974-7788.76794

40
Goriup, P., 1994. Little bustard Tetrax tetrax, in: Tucker, G.M., Heath, M.F. (Eds.), Birds in Europe: Their Conservation Status. Birdlife International, Cambridge, pp. 236–237.
Grambsch, P.M., Therneau, T.M., 1994. Propotional Hazards tests and diagnostics based on weighted residuals. Biometrika 81, 515–526.
Grant, C., Thompson, R., Corner, G., 1971. Determining avian ECG and respiration with a single-channel radio transmitter. J. appl. Physiol 30, 302–303.
Haines, A., Tewes, M., Laack, L., 2005. Survival and sources of mortality in ocelots. J. Wildl. Manage. 69, 255–263.
Harrington, D., Fleming, T., 1982. A class of rank test procedures for censored survival data. Biometrika 69, 553–566.
Heisey, D., Fuller, T., 1985. Evaluation of survival and cause-specific mortality rates using telemetry data. J. Wildl. Manage. 49, 668–674.
Hupp, J., Schmutz, J., Ely, C., 2008. Seasonal survival of radiomarked emperor geese in western Alaska. J. Wildl. Manage. 72, 1584–1595.
IBM Corp, 2013. IBM SPSS Statistics for Linux.
Inchausti, P., Bretagnolle, V., 2005. Predicting short-term extinction risk for the declining Little Bustard (Tetrax tetrax) in intensive agricultural habitats. Biol. Conserv. 122, 375–384. doi:10.1016/j.biocon.2004.08.001
Infante, S., Neves, J., Ministro, J., Brandão, R., 2005. Estudo sobre o Impacto das Linhas Eléctricas de Média e Alta Tensão na Avifauna em Portugal. Quercus Associação Nacional de Conservação da Natureza e SPEA Sociedade Portuguesa para o Estudo das Aves, Castelo Branco (relatório não publicado).
Iñigo, A., Barov, B., 2010. Action plan for the little bustard Tetrax tetrax in the European Union. SEO|BirdLife and BirdLife International for the European Commission.
Irvine, R.J., Leckie, F., Redpath, S.M., 2007. Cost of Carrying Radio Transmitters: a Test with Racing Pigeons Columba Livia. Wildlife Biol. 13, 238–243. doi:10.2981/0909-6396(2007)13[238:COCRTA]2.0.CO;2
Janss, G., 2000. Avian mortality from power lines: a morphologic approach of a species-specific mortality. Biol. Conserv. 95, 353–359.
Jiguet, F., 2002. Arthropods in diet of Little Bustards Tetrax tetrax during the breeding season in western France. Bird Study 49, 105–109.
Jolivet, C., 1997. L’Outarde canepetière, Tetrax Tetrax, en France: le dèclin s'accentue. Ornithos 4, 73–77.
Jolivet, C., Bretagnolle, V., 2002. L’outarde canepetiere en France: évolution récente des populations, bilan des mesures de sauvegarde et perspectives d'avenir. Alauda 70, 93–96.
Kaplan, E., Meier, P., 1958. Nonparametric estimation from incomplete observations. J. Am. Stat. Assoc. 53, 457–481.
Kenward, R., 2001. A manual for wildlife radio tagging. Academic Press, London, UK.
Kleinbaum, D.G., Klein, M., 2005. Survival analysis: a self-learning text. Springer.
Krebs, C.J., 1999. Ecological Methodology. Benjamin Cummings, Menlo Park, California, USA.
Lapiedra, O., Ponjoan, A., Gamero, A., 2011. Brood ranging behaviour and breeding success of the threatened little bustard in an intensified cereal farmland area. Biol. Conserv. 144, 2882–2890. doi:10.1016/j.biocon.2011.08.005
Le Gouar, P., Robert, A., Choisy, J.-P., Henriquet, S., Lecuyer, P., Tessier, C., Sarrazin, F., 2008. Roles of survival and dispersal in reintroduction success of Griffon vulture (Gyps fulvus). Ecol. Appl. 18, 859–72.
Lebreton, J.-D., Burnham, K.P., Clobert, J., Anderson, D.R., 1992. Modeling Survival and Testing Biological Hypotheses Using Marked Animals: A Unified Approach with Case Studies. Ecol. Monogr. 62, 67–118. doi:10.2307/2937171
Lukacs, P.M., Burnham, K.P., Anderson, D.R., 2009. Model selection bias and Freedman’s paradox. Ann. Inst. Stat. Math. 62, 117–125. doi:10.1007/s10463-009-0234-4
41
Ma, Z. (Sam), Bechinski, E.J., 2008. A survival-analysis-based simulation model for Russian wheat aphid population dynamics. Ecol. Modell. 216, 323–332.
Madroño, A., González, G., Atienza, J.C., 2004. Libro rojo de las Aves de España. Sociedad Española de Ornitología (SEO/BirdLife).
Marco, I., Mentaberre, G., Ponjoan, A., Bota, G., Mañosa, S., Lavín, S., 2006. Capture myopathy in Little Bustards (Tetrax tetrax) alter trapping and marking. J. Wildl. Dis. 42, 889–891.
Martínez, C., 1994. Habitat selection by the little bustard Tetrax tetrax in cultivated areas of Central Spain. Biol. Conserv. 67, 125–128.
Martínez, C., Tapia, G., 2002. Density of the Little Bustard Tetrax tetrax in relation to agricultural intensification in Central Spain. Ardeola 49, 301–304.
McCallum, H., 2000. Population parameters: estimation for ecological models. Blackwell-Science, Oxford University, New York, USA.
Melis, C., Nilsen, E., Panzacchi, M., 2013. Roe deer face competing risks between predators along a gradient in abundance. Ecosphere 4, 1–12.
Millspaugh, J., Marzluff, J., 2001. Radio tracking and animal populations, 1st ed. Academic Press, San Diego, California, USA.
Morales, M., Traba, J., Carriles, E., Delgado, M.P., Paula, A., García de la Morena, E.L., 2008. Sexual differences in microhabitat selection of breeding little bustards Tetrax tetrax: Ecological segregation based on vegetation structure. Acta Oecologica 34, 345–353. doi:10.1016/j.actao.2008.06.009
Morales, M.B., Bretagnolle, V., Arroyo, B., 2005a. Viability of the Endangered Little Bustard Tetrax tetrax Population of Western France. Biodivers. Conserv. 14, 3135–3150. doi:10.1007/s10531-004-0382-z
Morales, M.B., Garcia de la Morena, E.L., Delgado, M.P., Traba, J., 2006a. Tendencia Reciente y Viabilidad Futura de las Poblaciones de Sisón Común (Tetrax tetrax) en la Comunidad de Madrid. Madrid.
Morales, M.B., García, J.T., Arroyo, B., 2005b. Can landscape composition changes predict spatial and annual variation of little bustard male abundance? Anim. Conserv. 8, 167–174. doi:10.1017/S1367943005001988
Morales, M.B., Suarez, F., Garcia de la Morena, E.L., 2006b. Réponses des oiseaux de steppe aux différents niveaux de mise en culture et d’intensification du paysage agricole : analyse comparative de leurs effets sur la densité de population et la sélection de l'habitat chez l'Outarde canepetière Tetrax tetrax et l. Rev. d’écologie 61, 261–270.
Moreira, F., 1999. Relationships between vegetation structure and breeding bird densities in fallow cereal steppes in Castro Verde, Portugal. Bird Study 46, 309–318.
Moreira, F., Leitão, P.J., Synes, N.W., Alcazar, R., Catry, I., Carrapato, C., Delgado, A., Estanque, B., Ferreira, R., Geraldes, P., Gomes, M., Guilherme, J., Lecoq, M., Leitão, D., Marques, A.T., Morgado, R., Pedroso, R., 2012a. Population trends in the steppe birds of Castro Verde in the period of 2006-2011: consequences of a drought event and land use changes? Airo 22, 79–89.
Moreira, F., Silva, J.P., Estanque, B., Palmeirim, J.M., Lecoq, M., Pinto, M., Leitão, D., Alonso, I., Pedroso, R., Santos, E., Catry, T., Silva, P., Henriques, I., Delgado, A., 2012b. Mosaic-level inference of the impact of land cover changes in agricultural landscapes on biodiversity: a case-study with a threatened grassland bird. PLoS One 7, e38876. doi:10.1371/journal.pone.0038876
Murray, D., Patterson, B., 2006. Wildlife survival estimation: recent advances and future directions. J. Wildl. Manage. 76, 1499–1503.
Murray, D.L., 2002. On Improving Telemetry-Based Survival Estimation. J. Wildl. Manage. 70, 1530–1543.
Neteler, M., Mitasova, H., 2008. Open source GIS: A GRASS GIS approach, Open Source GIS: A GRASS GIS Approach. doi:10.1007/978-0-387-68574-8
Neves, J., Infante, S., Ministro, J., 2005. Estudo sobre o Impacto das Linhas Eléctricas de Muito Alta Tensão na Avifauna em Portugal. SPEA Sociedade Portuguesa para o Estudo das Aves e
42
Quercus Associação Nacional de Conservação da Natureza, Castelo Branco (relatório não publicado).
Olson, K. a., Larsen, E. a., Mueller, T., Leimgruber, P., Fuller, T.K., Schaller, G.B., Fagan, W.F., 2014. Survival probabilities of adult Mongolian gazelles. J. Wildl. Manage. 78, 35–41. doi:10.1002/jwmg.640
Osborne, P.E., Suárez-Seoane, S., 2006. Identifying Core Areas in a Species’ Range Using Temporal Suitability Analysis: an Example Using Little Bustards Tetrax Tetrax L. in Spain. Biodivers. Conserv. 16, 3505–3518. doi:10.1007/s10531-006-9058-1
Palacín, C., Alonso, J.C., 2009. Probable population decline of the Little Bustard Tetrax tetrax in north-west Africa. Ostrich 80, 165–170. doi:10.2989/OSTRICH.2009.80.3.6.969
Peel, M.C., Finlayson, B.L., McMahon, T.A., 2007. Updated world map of the Köppen-Geiger climate classification. Hydrol. Earth Syst. Sci. Discuss. 11, 1633–1644. doi:10.5194/hessd-4-439-2007
Persson, J., Ericsson, G., Segerström, P., 2009. Human caused mortality in the endangered Scandinavian wolverine population. Biol. Conserv. 142, 325–331. doi:10.1016/j.biocon.2008.10.028
Pollock, K., Winterstein, S., 1989. Survival analysis in telemetry studies: the staggered entry design. J. Wildl. Manage. 53, 7–15.
Ponjoan, A., Bota, G., De La Morena, E.L.G., Morales, M.B., Wolff, A., Marco, I., Mañosa, S., 2008. Adverse Effects of Capture and Handling Little Bustard. J. Wildl. Manage. 72, 315–319. doi:10.2193/2006-443
Ponjoan, A., Bota, G., Mañosa, S., 2010. Trapping techniques for Little Bustards Tetrax tetrax according to age, sex and season. Bird Study 57, 252–255. doi:10.1080/00063650903449953
Poole, I., 2003. Newnes guide to radio and communications technology. Elsevier Ltd, Oxford.
Reed, J., Mills, L., Dunning, J., 2002. Emerging issues in population viability analysis. Conserv. Biol. 16, 7–19.
Salamolard, M., Moreau, C., 1999. Habitat selection by Little Bustard Tetrax tetrax in a cultivated area of France. Bird Study 700, 25–33.
Sanderson, F.J., Donald, P.F., Burfield, I.J., 2005. Farmland birds in Europe: from policy change to population decline and back again, in: Bota, G., Morales, M.B., Mañosa, S., Camprodon, J. (Eds.), Ecology and Conservation of Steppe-Land Birds. Lynx Editions, Barcelona, pp. 211–236.
Santos, T., Suárez, F., 2005. Biogeography and population trends of Iberian steppe birds, in: Bota, G., Morales, M.B., Mañosa, S., Camprodon, J. (Eds.), Ecology and Conservation of Steppe-Land Birds. Lynx Editions, Barcelona, pp. 69–102.
Schulz, H., 1985. Grundlagenforschung zur Biologie der Zwergtrappe Tetrax tetrax. Staatlichen Naturhistorischen Museum, Braunschweig.
Schulz, H., 1987. Biologie et protection de l’Outarde canepetière Tetrax tetrax. Rapport de synthèse d’un projet de recheches des Communautés Européennes avec une bibliographie sur l’Outarde canepetière. Faune de Provence (C.E.E.P.) 8, 54–78.
Silva, J., Faria, N., Catry, T., 2007. Summer habitat selection and abundance of the threatened little bustard in Iberian agricultural landscapes. Biol. Conserv. 39, 186–194. doi:10.1016/j.biocon.2007.06.013
Silva, J., Palmeirim, J., Moreira, F., 2010a. Higher breeding densities of the threatened little bustard Tetrax tetrax occur in larger grassland fields: Implications for conservation. Biol. Conserv. 143, 2553–2558. doi:10.1016/j.biocon.2010.06.023
Silva, J., Santos, M., Queirós, L., Leitão, D., 2010b. Estimating the influence of overhead transmission power lines and landscape context on the density of little bustard Tetrax tetrax breeding populations. Ecol. Modell. 221, 1954–1963. doi:10.1016/j.ecolmodel.2010.03.027
Silva, J.P., Estanque, B., Moreira, F., Palmeirim, J.M., 2014a. Population density and use of grasslands by female Little Bustards during lek attendance, nesting and brood-rearing. J. Ornithol. 155, 53–63. doi:10.1007/s10336-013-0986-8

43
Silva, J.P., Palmeirim, J.M., Alcazar, R., Correia, R., Delgado, A., Moreira, F., 2014b. A spatially explicit approach to assess the collision risk between birds and overhead power lines: A case study with the little bustard. Biol. Conserv. 170, 256–263. doi:10.1016/j.biocon.2013.12.026
Silva, J.P., Pinto, M., 2006. Relatório Final da Acção A2 do Projecto Life Natureza (LIFE02NAT/P/8476), Tetrax: Conservação do Sisão no Alentejo - Inventário dos núcleos de Sisão no Alentejo, Instituto da Conservação da Natureza. Unpublished report.
Silva, J.P., Pinto, M., Palmeirim, J.M., 2004. Managing landscapes for the little bustard Tetrax tetrax: lessons from the study of winter habitat selection. Biol. Conserv. 117, 521–528. doi:10.1016/j.biocon.2003.09.001
Siriwardena, G.M., Baillie, S.R., Crick, H.Q.P., Wilson, J.D., 2000. The importance of variation in the breeding performance of seed-eating birds in determining their population trends on farmland. J. Appl. Ecol. 37, 128–148. doi:10.1046/j.1365-2664.2000.00484.x
StataCorp, 2009. Stata Statistical Software: Release 11. Econ. J. doi:10.2307/2234838
Suárez-Seoane, S., 2002. Large-scale habitat selection by agricultural steppe birds in Spain: identifying species–habitat responses using generalized additive models. J. Appl. Ecol. 39, 755–771.
Tarjuelo, R., Delgado, M.P., Bota, G., Morales, M.B., Traba, J., Ponjoan, A., Hervás, I., Mañosa, S., 2013. Not Only Habitat But Also Sex: Factors Affecting Spatial Distribution of Little Bustard Tetrax tetrax Families. Acta Ornithol. 48, 119–128. doi:10.3161/000164513X670070
Therneau, T.M., 2014. A Package for Survival Analysis in S. R package version 2.37-7, http://CRAN.R-project.org/package=survival.
Therneau, T.M., Grambsch, P.M., 2000. Modeling Survival Data: Extending the Cox Model, International Encyclopedia of Statistical Science. Springer.
Ward, D., Schmutz, J., Sedinger, J., 2004. Temporal and geographic variation in survival of juvenile black brant. Condor 106, 263–274.
White, G., Garrott, R., 1990. Analysis of wildlife radio-tracking data. Academic Press Limited, San Diego, California, USA.
White, G.C., Burnham, K.P., 1999. Program MARK: survival estimation from populations of marked animals. Bird Study 46, 120–139. doi:10.1080/00063659909477239
Williams, B.K., Nichols, J.D., Conroy, M.J., 2002. Analysis and management of animal populations, 1st ed. Academic Press.
Williams, E.S., Thorne, E.T., 1996. Exertional myopathy (capture myopathy), in: Fairbrother, A., Locke, L.N., Hoff, G.L. (Eds.), Non Infectious Diseases of Wildlife. The Veterinary Press, London, pp. 181–193.
Wilson, R., McMahon, C., 2006. Measuring devices on wild animals: what constitutes acceptable practice? Front. Ecol. Environ. 4, 147–154.
Winterstein, S.R., Pollock, K.P., Bunck, C.M., 2001. Analysis of survival data from radiotelemetry studies, in: Millspaugh, J.J., Marzluff, J.M. (Eds.), Radio Tracking and Animal Populations. Academic, New York, USA, pp. 351–380.
Wolff, A., Dieuleveut, T., Martin, J., Bretagnolle, V., 2002a. Landscape context and little bustard abundance in a fragmented steppe : implications for reserve management in mosaic landscapes 107, 211–220.
Wolff, A., Paul, J.-P., Martin, J.-L., Bretagnolle, V., 2002b. The benefits of extensive agriculture to birds: the case of the little bustard. J. Appl. Ecol. 38, 963–975. doi:10.1046/j.1365-2664.2001.00651.x
Xin, X., Horrocks, J., Darlington, G. a, 2013. Ties between event times and jump times in the Cox model. Stat. Med. 32, 2374–89. doi:10.1002/sim.5683
Zens, M.S., Peart, D.R., 2003. Dealing with death data: individual hazards, mortality and bias. Trends Ecol. Evol. 18, 366–373. doi:10.1016/S0169-5347(03)00096-X
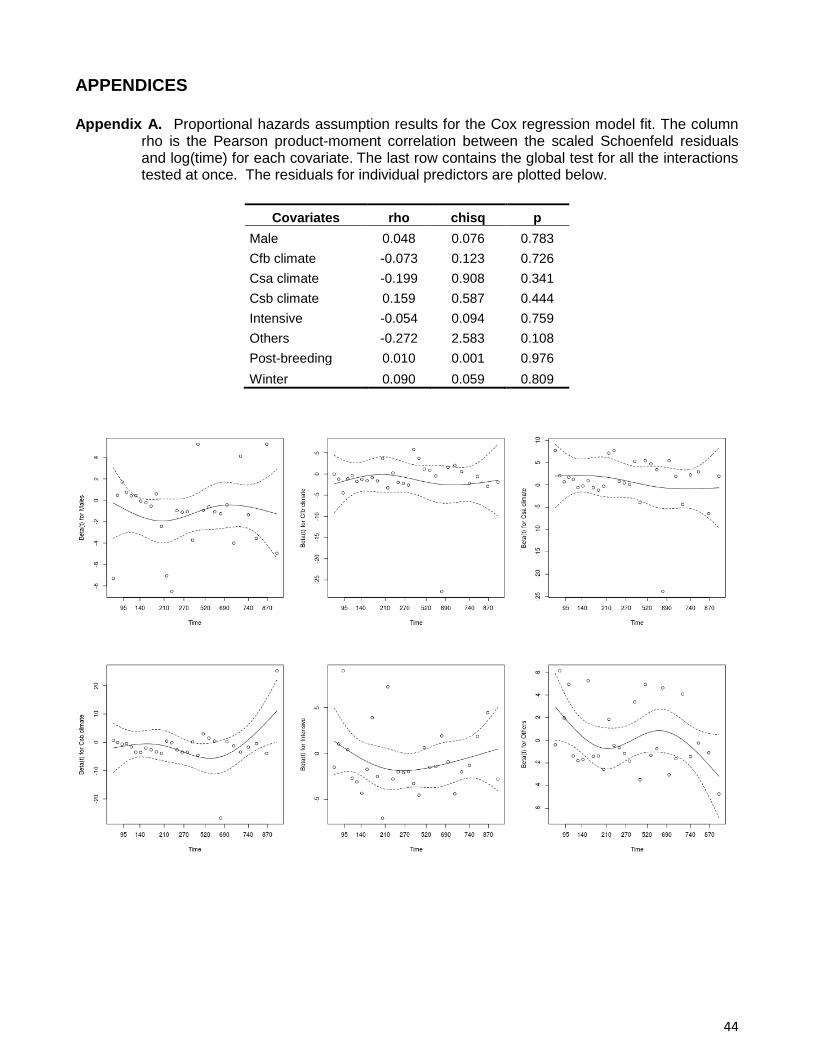
44
APPENDICES
Appendix A. Proportional hazards assumption results for the Cox regression model fit. The column rho is the Pearson product-moment correlation between the scaled Schoenfeld residuals and log(time) for each covariate. The last row contains the global test for all the interactions tested at once. The residuals for individual predictors are plotted below.
Covariates rho chisq p
Male 0.048 0.076 0.783
Cfb climate -0.073 0.123 0.726
Csa climate -0.199 0.908 0.341
Csb climate 0.159 0.587 0.444
Intensive -0.054 0.094 0.759
Others -0.272 2.583 0.108
Post-breeding 0.010 0.001 0.976
Winter 0.090 0.059 0.809

45