SURVEYS SECTION FIELD PROCEDURE MANUAL
87
SURVEYS SECTION FIELD PROCEDURE MANUAL INDIANA DEPARTMENT OF ENVIRONMENTAL MANAGEMENT Office of Water Quality Assessment Branch Surveys Section IDEM 32/02/055/2002 DRAFT June 2002
Transcript of SURVEYS SECTION FIELD PROCEDURE MANUAL

SURVEYS SECTIONFIELD PROCEDURE MANUAL
INDIANA DEPARTMENT OF ENVIRONMENTAL MANAGEMENTOffice of Water Quality
Assessment BranchSurveys Section
IDEM 32/02/055/2002DRAFT June 2002
Surveys Section SOPDRAFT Ver. #: 1
Date: June 2002Page 1 of 86
SURVEYS SECTIONFIELD PROCEDURE MANUAL
Edited byTim Beckman, Environmental Manager
Revised June 2002
Compilation and development of the final report was the primary responsibility of the Surveys SectionArthur C. Garceau, Surveys Section Chief
INDIANA DEPARTMENT OF ENVIRONMENTAL MANAGEMENTOFFICE OF WATER QUALITY
ASSESSMENT BRANCHSURVEYS SECTION
IDEM 032/02/055/2001June 2002

Surveys Section SOPDRAFT Ver. #: 1
Date: June 2002Page 2 of 86
NOTICE AND DISCLAIMER:
The Indiana Department of Environmental Management intends use of this document for the facilitation ofinformation exchange. Mention of pesticide trade names or other commercial products does not constituteendorsement or recommendation of use.
When citing this document:Beckman T, Editor. 2002. Surveys Section Field Procedure Manual. Revised June 2002. IndianaDepartment of Environmental Management, Office of Water Quality, Assessment Branch,Surveys Section, Indianapolis, Indiana. IDEM 032/02/055/2002

Surveys Section SOPDRAFT Ver. #: 1
Date: June 2002Page 3 of 86
TABLE OF CONTENTS
1.0 OVERVIEW.......................................................................................................................................................... 7
1.1 INTRODUCTION .................................................................................................................................................. 71.2 THE WATERSHED MONITORING PROGRAM..................................................................................................... 71.3 THE FIXED STATION MONITORING PROGRAM ................................................................................................ 71.4 THE SPECIAL PROJECTS PROGRAM.................................................................................................................. 81.5 THE DATA ADMINISTRATION GROUP PROGRAM ............................................................................................. 8
2.0 PROCEDURAL GUIDELINES .......................................................................................................................... 8
2.1 SAMPLING PROCEDURES................................................................................................................................... 82.1.1 General....................................................................................................................................................... 82.1.2 Sampling Location ................................................................................................................................... 102.1.3 Sampling Methods.................................................................................................................................... 10
2.1.3.1 Manual Sampling Procedures ......................................................................................................................... 102.1.3.1.1 Bridge Sampling Procedures ...................................................................................................................... 112.1.3.1.2 In-Stream Sampling Procedures ................................................................................................................. 12
2.1.4 Sample Preservation ................................................................................................................................ 122.1.4.1 Preservative Vials ........................................................................................................................................... 12
2.1.5 Delivering Samples to the Laboratory ..................................................................................................... 132.1.6 Duties to Perform Upon Return to Office................................................................................................. 132.1.7 Chain of Custody Procedures .................................................................................................................. 13
2.1.7.1 Introduction..................................................................................................................................................... 132.1.7.2 Definition ........................................................................................................................................................ 132.1.7.3 Procedures....................................................................................................................................................... 14
2.2 SAMPLING PROCEDURES FOR THE COLLECTION OF TRACE METALS USING CLEAN SAMPLING
TECHNIQUES.......................................................................................................................................................... 142.2.1 Scope and Application ............................................................................................................................. 14Figure 2.1 Sampling Equipment Checklist........................................................................................................ 152.2.2 Sample Bottle and Sampling Equipment Requirements ........................................................................... 162.2.3 Sample Collection .................................................................................................................................... 162.2.4 Collection of Field Blanks and Field Duplicates ..................................................................................... 172.2.5 Preservation, Packing, Refrigeration, and Shipment of Water Samples .................................................. 17
2.3 GUIDELINES FOR THE OPERATION OF THE E. COLI MOBILE LABORATORY .............................................. 182.3.1 Sample Collection, Handling, and Preservation...................................................................................... 18
2.3.1.1 Sample Collector............................................................................................................................................. 182.3.1.2 Sampling ......................................................................................................................................................... 182.3.1.3 Sample Information Form ............................................................................................................................... 182.3.1.4 Sample Icing ................................................................................................................................................... 192.3.1.5 Sample Holding/Travel Time .......................................................................................................................... 192.3.1.6 Chain-of-Custody............................................................................................................................................ 192.3.1.7 Laboratory Facilities ....................................................................................................................................... 192.3.1.8 Temperature Monitoring Devices ................................................................................................................... 192.3.1.9 Incubator Unit ................................................................................................................................................. 202.3.1.10 Reagent-Grade Water........................................................................................................................................ 202.3.1.11 Pipets ................................................................................................................................................................ 212.3.1.12 Laboratory Equipment and Supplies................................................................................................................. 21
2.3.2 Analytical Methodology for Colilert ........................................................................................................ 212.3.2.1 Use of Colilert Media...................................................................................................................................... 212.3.2.2 Use of Quanti-tray 2000.................................................................................................................................. 21
2.4 ISCO AUTOMATIC SAMPLER PROCEDURES ............................................................................................... 242.4.1 General..................................................................................................................................................... 24

Surveys Section SOPDRAFT Ver. #: 1
Date: June 2002Page 4 of 86
2.4.2 Time Composite Sampling........................................................................................................................ 252.4.3 Sequential Flow Sampling........................................................................................................................ 25
2.4.3.1 Programming Samplers with Flow Meters for Sequential Flow...................................................................... 262.4.3.1.1 Programming Sampler with ISCO 2870 Flow Meter.................................................................................. 262.4.3.1.2 Programming Sampler with ISCO 3230 Flow Meter.................................................................................. 27
2.4.3.2 Automatic Sampler Sequential Flow Set-up Example .................................................................................... 282.4.4 Model 2700 Addendum ............................................................................................................................ 302.4.5 Churn Usage for Mixing and Splitting Samples....................................................................................... 302.4.6 ISCO Sampler Equipment Maintenance................................................................................................... 31
2.5 SAMPLING PROCEDURES FOR TOXIC SUBSTANCES........................................................................................ 312.5.1 Introduction.............................................................................................................................................. 312.5.2 Methods and Forms of Toxic Sampling.................................................................................................... 312.5.3 Equipment Preparation............................................................................................................................ 32
2.5.3.1 Automatic Sampler Preparation for Composite Sampling Collection ............................................................. 322.5.3.2 Sample Container Preparation......................................................................................................................... 322.5.3.3 Manual Sampling Preparation......................................................................................................................... 33
2.5.4 On-Site Sample Collection ....................................................................................................................... 332.5.4.1 Automatic Sampler Set Up for Compositing Samples .................................................................................... 332.5.4.2 Collection of Volatile Organic Samples.......................................................................................................... 332.5.4.3 Collection of Sludge and Sediment Samples................................................................................................... 342.5.4.4 Collection of Metals, Mercury and Cyanide Samples ..................................................................................... 35
2.5.5 Split Sampling Methods............................................................................................................................ 362.5.6 Transport and Storage of Samples ........................................................................................................... 36
2.6 FLOW MEASUREMENT .................................................................................................................................... 362.6.1 Introduction.............................................................................................................................................. 362.6.2 Primary Flow Devices Commonly Used for Measuring Flow in Wastewater Treatment Facilities ........ 36
2.6.2.1 Weirs............................................................................................................................................................... 362.6.2.2 Weir Design Requirements ............................................................................................................................. 372.6.2.3 Flumes............................................................................................................................................................. 38
2.6.2.3.1 Flume Design Requirements....................................................................................................................... 392.6.3 ISCO Flow Meter ..................................................................................................................................... 39
2.6.3.1 Instructions for ISCO Flow Rate Measurement Model 2870.......................................................................... 392.6.3.2 Instructions for ISCO Flow Rate Measurement Model 3230.......................................................................... 412.6.3.3 Programming Flow Equations With the ISCO Model 3230 Flow Meter ........................................................ 42
2.6.3.3.1 Weirs .......................................................................................................................................................... 422.6.3.3.2 Example...................................................................................................................................................... 422.6.3.3.3 Flumes: ....................................................................................................................................................... 43
2.6.3.4 Conclusion:......................................................................................................................................................... 432.6.4 Maintenance and Calibration of ISCO Flow Meter Equipment............................................................... 43
2.6.4.1 General............................................................................................................................................................ 432.6.4.2 Calibration of Isco Flow Meters...................................................................................................................... 44
2.6.5 Measuring Stream Flow Using Current Velocity Meters ......................................................................... 442.6.5.1 Price Current Velocity Meter .......................................................................................................................... 442.6.5.2 Marsh-McBirney Model 201, 201D, and 2000 Current Meters ...................................................................... 46
2.6.5.2.1 Operation .................................................................................................................................................... 462.6.5.2.2 Maintenance and Calibration...................................................................................................................... 47
2.6.5.3 Measuring Flow From a Bridge with a USGS Type-A Crane............................................................................. 473.6.5.3.1 Procedures: ........................................................................................................................................... 472.6.5.3.2 Problems Affecting Flow Measurement From Bridges............................................................................... 48
2.6.5.4 Measuring Stream Flow...................................................................................................................................... 482.6.5.4.1 General ....................................................................................................................................................... 482.6.5.4.2 Selecting the Best Cross-Section of a Stream for In-stream Flow Measurement........................................ 492.6.5.4.3 General Operation of Current Velocity Meter with Top Setting Rod......................................................... 50
2.7 MEASUREMENT OF TIME-OF-TRAVEL (T.O.T.)............................................................................................. 502.7.1 Introduction.............................................................................................................................................. 50

Surveys Section SOPDRAFT Ver. #: 1
Date: June 2002Page 5 of 86
2.7.2 T.O.T. Measurement Procedures ............................................................................................................. 512.7.2.1 Preparation of Standards for Fluorometer ...................................................................................................... 53
2.8 STREAM REACH STUDY PROCEDURES............................................................................................................ 562.8.1 Introduction.............................................................................................................................................. 562.8.2 Data Requirements................................................................................................................................... 562.8.3 Summary of Survey................................................................................................................................... 56
2.9 MEASUREMENT OF SEDIMENT (BENTHIC) OXYGEN DEMAND ...................................................................... 572.9.1 General..................................................................................................................................................... 572.9.2 Sampling Methodologies and Procedures................................................................................................ 57
2.10 FIELD DATA COLLECTION PROCEDURES............................................................................................... 582.10.1 Turbidity................................................................................................................................................. 58
2.10.1.1 Instructions for Use of Hach Portable Turbidimeter Model 2100P .................................................................. 582.10.1.1.1 Turbidimeter Operation ............................................................................................................................ 592.10.1.1.2 Turbidimeter Calibration Checks.............................................................................................................. 59
2.10.2 pH........................................................................................................................................................... 592.10.2.1 Calibration of Cole-Parmer Model 5985-80 Digi-Sense pH Meter .................................................................. 60
2.10.2.1.1 General ..................................................................................................................................................... 602.10.2.1.2 Operation .................................................................................................................................................. 612.10.2.1.3 Additional Notes................................................................................................................................... 61
2.10.2.2 Calibration of Hach Model EC20 pH Meter ..................................................................................................... 612.10.2.2.1 Operation .................................................................................................................................................. 622.10.2.2.2 Additional Notes....................................................................................................................................... 62
2.10.2.3 Calibration of Oakton pH 6 Acorn Series Meter............................................................................................... 622.10.2.3.1 Operation .................................................................................................................................................. 632.10.2.3.2 Additional Notes................................................................................................................................... 63
2.10.3 Measurement of Dissolved Oxygen (DO)............................................................................................... 632.10.3.1 Winkler Method................................................................................................................................................ 64
2.10.3.1.1 Field Equipment for Winkler Method ...................................................................................................... 642.10.3.1.2 Sampling Methods for Winkler Method................................................................................................... 642.10.3.1.3 Winkler Method Sample Preparation and Analysis .................................................................................. 652.10.3.1.4 General Notes ........................................................................................................................................... 66
2.10.4 Total Residual Chlorine ......................................................................................................................... 662.10.4.1 Operation of HACH Pocket Colorimeter Test (0-2 MG/l) ................................................................................. 66
2.11 THE HYDROLAB
H20 MULTIPROBE SYSTEM ........................................................................................... 67
2.11.1 Introduction............................................................................................................................................ 672.11.1.1 Components of the Hydrolab H20 System........................................................................................................ 672.11.1.2 Assembly of the H20 Unit ................................................................................................................................ 682.11.1.3 Scout 2 Display Functions .............................................................................................................................. 682.11.1.4 Field Calibration Checks of the Hydrolab H20 Unit......................................................................................... 69
2.11.2 How to Record Field Data Using a Field Sheet..................................................................................... 692.11.3 Operating the Hydrolab H20 System for Field Data Collection............................................................ 722.11.4 Additional Operating Notes for the Hydrolab Unit................................................................................ 722.11.5 Operating Range, Response Time, and Drifts for the H20 Unit............................................................. 722.11.6 Hydrolab Troubleshooting ..................................................................................................................... 73
2.11.6.1 Dissolved Oxygen............................................................................................................................................. 732.11.6.2 pH ..................................................................................................................................................................... 732.11.6.3 Conductivity ..................................................................................................................................................... 742.11.6.4 Turbidity ........................................................................................................................................................... 74
2.11.7 Hydrolab H20 System Calibration Procedures .................................................................................. 742.11.7.1 Dissolved Oxygen (Air Calibration) ................................................................................................................. 742.11.7.2 pH ..................................................................................................................................................................... 752.11.7.3 Specific Conductance ....................................................................................................................................... 762.11.7.4 Turbidity ........................................................................................................................................................... 76
2.11.8 Hydrolab Maintenance Procedures ....................................................................................................... 772.12 THE HYDROLAB
MINISONDE
MULTIPROBE SYSTEM ........................................................................ 78

Surveys Section SOPDRAFT Ver. #: 1
Date: June 2002Page 6 of 86
2.12.1 Introduction............................................................................................................................................ 782.12.1.1 Components of the Hydrolab Minisonde System.............................................................................................. 782.12.1.2 Assembly of the Minisonde Unit ...................................................................................................................... 782.12.1.3 The Surveyor 4 Display Functions.................................................................................................................. 79
2.12.2 Hydrolab Minisonde System Calibration Procedures............................................................................ 792.13 THE HYDROLAB
DATASONDE
................................................................................................................... 792.13.1 Introduction............................................................................................................................................ 792.13.2 Procedures for Deployment of Datasonde ............................................................................................. 80
3.0 QUALITY CONTROL AND QUALITY ASSURANCE ............................................................................. 80
3.1 COLLECTION OF BLANKS ................................................................................................................................ 803.2 COLLECTION OF DUPLICATES ........................................................................................................................ 803.3 COLLECTION OF MATRIX SPIKES/MATRIX SPIKE DUPLICATES (MS/MSD) ................................................... 813.4 DATA QUALITY ASSESSMENT (DQA) LEVELS FOR FIELD DATA................................................................... 81
3.4.1 Control Limits for Field Data Quality Assurance/Quality Control Checks ............................................. 813.5 MAINTENANCE AND CALIBRATION LOG BOOKS ............................................................................................ 84
REFERENCES.......................................................................................................................................................... 84
4.1 GENERAL REFERENCES................................................................................................................................... 844.2 INSTRUMENT MANUAL REFERENCES ............................................................................................................. 854.3 HEALTH AND SAFETY REFERENCES............................................................................................................... 86
List of TablesTABLE 1.1 SURVEYS SECTION STAFFING TABLE ............................................................................................................ 9TABLE 1.2 SURVEYS SECTION CONTACT PERSONS ........................................................................................................ 9TABLE 2.3 SAMPLE PRESERVATION REQUIREMENTS .................................................................................................... 12TABLE 2.2 REAGENT WATER QUALITY CRITERIA FOR BACTERIOLOGICAL ANALYSIS .................................................. 20TABLE 2.3 E. COLI EQUIPMENT CHECKLIST ................................................................................................................. 23TABLE 2.4 SET UP EXAMPLE FOR ISCO 2870 FLOW METER ....................................................................................... 27TABLE 2.5 PROGRAM INSTRUCTIONS FOR ISCO MODEL 2700 AUTOMATIC SAMPLER .............................................. 28TABLE 2.6 TIME-OF-TRAVEL APPROXIMATION ............................................................................................................ 52TABLE 2.7 FLUOROMETER SETTINGS ........................................................................................................................... 53TABLE 2.8 STREAM REACH STUDY MINIMUM DATA REQUIREMENTS .......................................................................... 56TABLE 2.9 MAIN SCREEN PARAMETERS OF THE SCOUT 2 DISPLAY UNIT ..................................................................... 69TABLE 2.10 HYDROLAB OPERATIONAL PARAMETERS.................................................................................................. 73TABLE 3.1 ACCEPTANCE CRITERIA FOR SURVEYS SECTION FIELD DATA QA/QC CHECKS .......................................... 81TABLE 3.2 QUALITY ASSESSMENT (DQA) LEVELS FOR FIELD DATA ........................................................................... 83
List of FiguresFIGURE 2.2 STYLIZED CROSS SECTION OF STREAM DEMONSTRATING FLOW MEASUREMENT ...................................... 49FIGURE 2.3 EXAMPLE OF TIME OF TRAVEL WORKSHEET ............................................................................................ 54FIGURE 2.4 TIME OF TRAVEL FIELD SHEET .................................................................................................................. 55FIGURE 2.5 STREAM SAMPLING FIELD DATA SHEET .................................................................................................... 71

Surveys Section SOPDRAFT Ver. #: 1
Date: June 2002Page 7 of 86
1.0 OVERVIEW
1.1 INTRODUCTION
The Surveys Section is part of the Water Quality Assessment Branch of the Office of WaterQuality. The Surveys Section’s primary function is to provide water quality and hydrological datato assess Indiana's surface waters. This is accomplished by conducting watershed basin surveysand stream reach surveys throughout the state. As part of the Surface Water Quality MonitoringStrategy, the Surveys Section is conducting a five-year sampling plan of the State's ten majorwatershed basins. Information collected will be reviewed by the Environmental Toxicology andChemistry Section and integrated with data from Biological Studies Section to complete athorough assessment of the State's surface waters.
The Surveys Section is organized into four work groups: Watershed Monitoring, Fixed StationMonitoring, Special Projects, and Data Administration. Staffing charts listing areas ofresponsibility are presented in Table 1.1 and Table 1.2.
During the summer months, student assistants who are assigned by the Governor’s internshipprogram augment the staff. Office, laboratory, and equipment storage space is located at theShadeland Avenue Office. The Surveys Section is also assisted through the cooperative efforts ofthe Indiana State Department of Health's Water Quality Laboratory and the U.S. EnvironmentalProtection Agency (U.S. EPA). The Surveys Section also utilizes the contract services of the U.S.Geological Survey and various commercial contract laboratories. A brief discussion of the workgroup programs follows.
1.2 THE WATERSHED MONITORING PROGRAM
This program uses a statistically valid number of randomly selected sites throughout major riverbasins to assess and characterize the overall water quality and biological integrity. Selection ofsites focuses on all streams within the targeted river basin. Sampling is performed during the lateSpring to early Fall low-flow time frame (May-October) and is conducted simultaneously withother program areas. Data sets collected and assessed are water and fish tissue samples forlaboratory analysis, in-situ water chemistry, channel morphology data, fish communityassessments, and habitat assessment. The results of this program further contribute to the Indiana305(b) Report and the pending Section 303(d) list of impaired streams. The results are applied tothe Indiana Fish Consumption Advisory, as well as provide for support of the EnvironmentalPerformance Partnership Agreement (EnPPA) and the development of biocriteria for Indiana'ssurface waters. This program is conducted through the cooperative sampling efforts of theSurveys Section and Biological Studies Section of the Assessment Branch, and through thesupport of the U.S. EPA Research Laboratory in Corvallis, Oregon.
1.3 THE FIXED STATION MONITORING PROGRAM
The objective of this program is to provide basic information that would reveal recurring surfacewater quality trends and provide data for the many impacted users of surface water in Indiana.

Surveys Section SOPDRAFT Ver. #: 1
Date: June 2002Page 8 of 86
The program was developed to determine chemical, physical, bacteriological, and biologicalcharacteristics of Indiana water under changing conditions. The information has been used indetermining background data for certain types of pollutants, such as chlorides and phosphorous;in the development of wasteload allocations and NPDES permits for wastewater treatment plants;for other municipal, industrial, agricultural, and recreational uses; for future pollution abatementactivities such as review of non-point pollution sources; and in procuring data to secure publicaction toward the preservation of streams for all beneficial uses. The fixed station network wasestablished in 1957, and currently samples 160 stations throughout the state on a monthly basis.The Indiana State Department of Health (ISDH) Water Quality Laboratory performs sampleanalyses.
1.4 THE SPECIAL PROJECTS PROGRAM
This group's activities include: the Pesticide Monitoring Program, the E. coli MonitoringProgram, and other various specialized water quality monitoring projects. These "specialprojects" include but are not limited to Wasteload Allocation (WLA) studies, stream reachstudies, and site specific monitoring in support of the NPDES permitting program.
1.5 THE DATA ADMINISTRATION GROUP PROGRAM
The Data Administration group is responsible for the development of reports and disseminationof information collected by the Surveys section. The Data Administration group maintainsresponsibility for final editing, publication and distribution of documents produced by theSurveys section. Documents produced by the section are published on the Internet. Mapping andgraphical representation of data are provided to the Surveys section and the Assessment Branchstaff, as well as other Agency personnel by the Data Administration group. Data requests frominterested parties outside of the section are received and filled. The Data Administration grouphas also been assigned responsibility for maintaining the Assessment Branch's database, theAssessment Information Management System or AIMS.
2.0 PROCEDURAL GUIDELINES
2.1 SAMPLING PROCEDURES
2.1.1 GENERAL
These procedures apply to all water samples collected by Surveys section personnel forlaboratory chemical analysis during surface water monitoring and stream surveys. It isnecessary to know how to take a sample that is most representative of the stream, lake, orwastewater. It is obvious that improper sampling will give erroneous results. It is alsoimportant to maintain the integrity of that sample by preservation if necessary and to get thesample to the laboratory for analysis within the required holding time.

Surveys Section SOPDRAFT Ver. #: 1
Date: June 2002Page 9 of 86
Table 1.1 Surveys Section Staffing Table
Art GarceauSurveys Section Chief
308-3381
WatershedMonitoring Group
Fixed StationMonitoring Group
Special ProjectsGroup
Data AdministrationGroup
Larry McFallSenior Environmental
Manager
308-3200
Mark HoldemanSenior Environmental
Manager
308-3198
Steve BoswellSenior Environmental
Manager
308-3201
Chuck BellSenior Environmental
Manager
308-3203
VacantEnvironmental Manager
Sam GibsonEnvironmental Manager
308-3197
Tim BeckmanEnvironmental Manager
308-3195
Joanna WoodEnvironmental Manager
308-3211
Jim ButlerEnvironmental Scientist
308-3199
Joel ArmstrongEnvironmental Scientist
308-3196
Roseann HirschingerEnvironmental Scientist
308-3204
Cindy MartinEnvironmental Scientist
308-3081
Elizabeth KlickerEnvironmental Scientist
308-3361
David ArnoldEnvironmental Scientist
308-3398
Ryan McDuffeeEnvironmental Scientist
308-3194
VacantLaboratory Tech 3
Table 1.2 Surveys Section Contact PersonsTim Beckman Hydrolab, turbidimeter, and pH meter maintenance
Calibration standardsDI water system maintenance, digital camera
Steve Boswell ISCO Automatic SamplersCurrent Meter maintenance
Ryan McDuffee Boat and boat trailer maintenance
Larry McFall Flow measurement equipment and automatic sampler maintenanceSummer intern coordinator
Sam Gibson Vehicle maintenance
Chuck Bell Laptop computers
Mark Holdeman Health and safety
Elizabeth Klicker Cellular phone maintenance

Surveys Section SOPDRAFT Ver. #: 1
Date: June 2002Page 10 of 86
2.1.2 SAMPLING LOCATION
If an NPDES permit holder is sampled, generally at least the effluent is taken, and in someinstances the influent might also need to be tested. Since no two treatment systems areidentical, it is difficult to be precise about the sampling locations until the layout of the plantis known by the sampler. In surveying the effect that the wastewater treatment plant effluenthas on the receiving stream, generally one upstream sample is taken and as few as one toseveral samples are taken downstream, preferable after the effluent is completely mixed withthe stream. However, the difficulty comes in knowing exactly where the area of thecompletely mixed water begins. Quantity and quality of wastewater may change in thedischarge. Also, the stream flow may vary within the sampling period. Hence, no specificguidelines are given on the exact location for sampling.
2.1.3 SAMPLING METHODS
Sampling methods are either manual or automatic. The quality of the sample depends directlyon the care used in collecting the sample. To get a representative sample with either method,samples generally are collected just under the surface of the water in the main stream of flow.Skimming the surface of the water or dragging the bottom must be avoided.
2.1.3.1 Manual Sampling ProceduresEvery effort is put forth to collect the sample directly into a sample bottle. A samplecollection device containing the sample bottle(s) is lowered from a rope if direct access tothe waterbody is not possible. When direct access is possible, hold the bottles in a glovedhand and fill just under the surface of the water while facing upstream to collect a sample.A special sampling device for sample collection provides a way to put the samples directlyinto certified clean disposable plastic or glass bottles from a bridge or other structure. If asample collection device is used, clean it thoroughly in the bottle washer at the end of eachsampling event. Water taken for field tests (dissolved oxygen, pH, conductivity, etc.) iscollected in the above manner, or it can also come from a plastic or stainless steel bucketused to grab samples, after the bucket has been thoroughly rinsed with the sample water. Insome cases, temperature of the water changes rapidly and this parameter must be measuredas soon as possible after the sample is collected. Also, it is important to keep the samplewell mixed in the bucket if turbidity is required because the suspended solids in the samplewill settle to the bottom of the bucket in a very short time.
Sampling from the stream bank is permissible providing the collector can reach the mainflow. Any deviations from these general procedures must be noted on the field sheet by thecollector. The quality of a sample depends directly on the cleanliness and reliability of thesampling method. Preventing the contamination of a sample during the sampling process isthe greatest challenge in collecting reliable results and representative samples. Therefore, itis imperative that care be taken to avoid or minimize contamination when collectingsamples.

Surveys Section SOPDRAFT Ver. #: 1
Date: June 2002Page 11 of 86
The following step-by-step procedures result in clean and reliable samples.
2.1.3.1.1 Bridge Sampling Procedures
Park as close to the sampling site as possible, turn on the vehicle's hazard lights and thestrobe light.1. Turn the vehicle off and open the tailgate.
2. Put on new, non-talc sampling gloves.
3. Remove sampling device from the transportation container and place it in thecarrying tote.
4. Remove bottles to be used at site. Label if necessary, including date, site number,IDEM sample number (AA number), and parameter abbreviation (G.C., Nx,Metals, Blank, etc.). Place bottles in carrying tote.
5. Note: Carrying tote should already contain a clean rope and a ziplock bag.
6. Take carrying tote with sampler, bottles, and rope to sample collection site.
7. At site, attach rope and insert collection bottle(s) into sampling device. Alwayscollect metals first.
8. Remove caps from the bottles and place caps in a ziplock bag. Secure the bag.
9. Retrieve sample from downstream side of bridge.
10. Replace sampling bottle caps and remove bottles. Place full bottles in carrying tote.
11. Insert the remaining sample collection bottles into sampling device.
12. Repeat steps 10 through 12 until all samples have been collected.
13. Return to vehicle with tote and equipment. Put on safety glasses. Preserve allsamples and properly dispose of preservative vials
14. Rinse sampling equipment with deionized water, including sampling device,bottles, and the rope if it was immersed during sample collection.
15. Place sample collection bottles into cooler with ice.
16. Detach sampling device from rope. Put rope in storage bag or carrying tote.
17. Place clean sampling device into transportation container.
18. Discard gloves and close vehicle.
19. Proceed to next site.
20. At last site, make sure samples are well iced to ensure proper preservation.
21. Return to station.

Surveys Section SOPDRAFT Ver. #: 1
Date: June 2002Page 12 of 86
2.1.3.1.2 In-Stream Sampling Procedures
1. Put on new non-talc sampling gloves.
2. Obtain bottles to be used at site. Label bottle, if necessary, with the date, sitenumber, IDEM sample number (AA number), and parameter abbreviation (G.C.,Nx., Metals, Blank, etc.). Place bottles in carrying tote.
3. Put on Personal Floatation Device per Safety Manual.
4. Approach sampling site and wade into stream at a location downstream of the sitein order to not stir up the stream bed sediments.
5. While facing upstream remove bottle cap and insert the bottle directly into thestream just below the surface making sure to fill the bottles up to one inch belowthe opening.
6. Re-cap the sample bottle and repeat as necessary until all of the bottles are filled up.
7. Return to vehicle with tote and equipment. Put on safety glasses. Preserve allsamples and properly dispose of preservative vials.
8. Rinse the outside of the sample bottles with deionized rinse water and placecollection bottles into cooler.
9. Make sure the samples are well iced.
10. Remove gloves and proceed to next site.
2.1.4 SAMPLE PRESERVATION
Table 2.3 Sample Preservation RequirementsGeneral Chemistry Sample (G.C.) Ice only. No other preservation required.
Nutrient Sample (Nx): Preserve with 2 ml of 50% Sulfuric Acid(H2SO4).
Metal Sample (Metals) Preserve with 5 ml of concentrated Nitric Acid(HNO3).
Cyanide Sample (CN): Preserve with Sodium Hydroxide Crystals(NaOH).
Bacteriological Sample, E. coli (Bug): Ice only. No other preservation required.NOTE: Always wear safety glasses and latex gloves when preserving samples.
2.1.4.1 Preservative VialsPreservative vials are provided in the appropriate volumes to preserve the one liter samplestypically collected by the Surveys section. The preservative vials come with screw caps andare used for normal field preservation. Simply unscrew the cap and poor the contents intothe appropriate sample bottle. When finished, replace the vial cap and dispose of the vial ina sealable plastic container or ziplock bag. Bring this container back to the office for properdisposal.

Surveys Section SOPDRAFT Ver. #: 1
Date: June 2002Page 13 of 86
2.1.5 DELIVERING SAMPLES TO THE LABORATORY
1. Never assume that the laboratory personnel know anything about the samples!
2. Always wear clean gloves when handling sample bottles.
3. Set up bottles in sequential IDEM sample number.
4. Make sure all bottles are labeled properly and put laboratory labels with preservativeidentification on bottles.
5. Ensure field sheets, laboratory sheets, and chain of custody (COC) forms are properlyfilled out and signed.
6. Secure a photocopy of the chain of custody form after it is signed.
7. Return to station.
2.1.6 DUTIES TO PERFORM UPON RETURN TO OFFICE
1. Unload all equipment from vehicle.
2. Remove all trash from vehicle and clean the interior.
3. Wipe down the interior with a damp cloth if it is dusty or dirty.
4. Wash all equipment that will not fit into washer by hand and allow to air dry. Empty andclean all used coolers immediately upon return.
5. Wash smaller equipment in the washer (sampling device, plastic sampling tote, plasticbucket, rope, etc.).
6. Place clean and dried sampling rope into ziplock bags and put other clean equipment backon equipment room shelf.
7. Report any equipment or vehicle problems to supervisor and to person in charge of thatspecific equipment. See Page 9 of this manual for the equipment contact person.
2.1.7 CHAIN OF CUSTODY PROCEDURES
2.1.7.1 IntroductionThe procedures and definitions described below shall be used to maintain data validity andcontrol. This includes the sample numbering system, custody of samples in the field, viacertified carrier, and at the laboratory and all associated transfers of custody.
2.1.7.2 Definition1. A sample is in someone's custody if:
2. It is in his/her actual possession, or
3. It is in his/her view, after being in his/her possession, or

Surveys Section SOPDRAFT Ver. #: 1
Date: June 2002Page 14 of 86
4. It is in his/her physical possession and locked up so that no one could tamper with it,or
5. It is kept in a secured area restricted to authorized personnel only.
2.1.7.3 ProceduresTo assure proper handling and custody of samples collected by field personnel of theSurveys section the following procedures will be followed in the field. These proceduresshould document the people who have had charge of the sample from the time of thecollection until it was delivered to the laboratory. The laboratory also has chain of custodyprocedures which will be followed after it receives the sample.
The collector will keep field notes. This is to record conditions and activities related toeach sample collection. The sample will be placed in a container appropriately markedwith the sample site, date of collection, and type of sample. If the sample remains in thecustody of the sampler, as described above, no sample seals will be required. However, ifthe sample will leave the custody of the sampler, a sample seal should be used.
When the sample is delivered to the laboratory for analysis, the person who delivers thesample and the person who receives the sample for the laboratory will sign the chain ofcustody sheet in the appropriate spaces. At this time the laboratory takes custody of thesample and their chain of custody procedures will be followed. Upon arrival at thelaboratory, the sample collector presents to the laboratory personnel laboratory analysisrequest sheets, chain of custody sheets, and duplicates and/or blanks. The laboratoryanalysis request sheets can be computer generated.
2.2 SAMPLING PROCEDURES FOR THE COLLECTION OF TRACE METALS USING CLEAN SAMPLING TECHNIQUES
2.2.1 SCOPE AND APPLICATION
This Standard Operating Procedure (SOP) describes methods for the collection of ambientwater using EPA method 1669 (USEPA, 1996) for the determination of mercury,methylmercury, trace metals, and hexavalent chromium by EPA test methods 1631, 1630(Draft), 1638, and 1636, respectively. In 1998, IDEM had undertaken a Trace Metals PilotProject to develop expertise in collecting ambient water samples using clean samplingtechniques and metal analyses by low detect ultra-clean analytical test methods (Ratcliff, B.L.and GhiasUd din, S.M., 1999). This SOP is an extension of this Trace Metals Pilot Project forsimilar work at IDEM. Adherence to this SOP can be expected to minimize contaminationfrom the sample bottle, any necessary sampling equipment used, and external sources.
This SOP is for the collection of a grab sample directly into the sample bottle with or withoutthe aid of a sampling pump, Teflon and C-Flex tubing, capsule filters, and the appropriateTeflon fittings necessary to join the various types of tubing to the capsule filter.

Surveys Section SOPDRAFT Ver. #: 1
Date: June 2002Page 15 of 86
FIGURE 2.1 SAMPLING EQUIPMENT CHECKLIST
q Two (2) sampling devices.*
q Two (2) sections of nylon rope, bagged separately for sampling device.*
q Two (2) clean, plastic stream buckets with rope for field measurements.*
q One (1) Hydrolab with a display unit and one (1) sampling tube.
q Two (2) sampling equipment storage containers (totes).*
q Adequate Tupperware containers for bacterium sample storage.
q Several equipment bags, ziplock bags, rubber bands, extra sample device tubing, trashbags, and tape.
q One (1) pH meter.
q One (1) turbidimeter (if needed).
q One (1) D.O. kit, including two (2) bottles, fresh reagents, extra pipets, extra pipettepump, and Millipore rinse water.
q Two (2) boxes of new, non-talc gloves.
q One (1) bottle of sanitizing gel.
q One (1) eyewash bottle filled with DI water.
q Two (2) carboys with Millipore rinse water and extension tubes.
q Coolers containing labeled sample bottles and bacteria bottles. Always wear gloves whenhandling sample bottles.
q Two (2) small red coolers, one for blanks and extra reagents, and one for Hydrolabstorage, if needed.
q Extra cooler full of ice from equipment room ice machine.
q One (1) large ziplock bag, containing marking pens and bottle labels.
q Waders.
q One (1) set of USGS gage keys.
q Required preservatives for sampling event.
q All field, laboratory, and chain of custody sheets for route with clipboard.
q Route maps, topographic maps, and state map.
q One (1) cell phone for every vehicle.
q Safety Glasses. (*indicates non-wadeable/bridge sampling sites only).

Surveys Section SOPDRAFT Ver. #: 1
Date: June 2002Page 16 of 86
2.2.2 SAMPLE BOTTLE AND SAMPLING EQUIPMENT REQUIREMENTS
Only Teflon sample bottles and any necessary sampling equipment which have beencleaned, tested, and double bagged in a Class-100 clean bench (or equivalent) and certifiedclean through appropriate testing relative to the relevant EPA test methods can be used. Uncertified Teflon sample bottles and sampling equipment cannot be used because they maybe a source of possible contamination.
Teflon sample bottles and any necessary sampling equipment are to be obtained from thecontract laboratory performing the desired analyses.
2.2.3 SAMPLE COLLECTION
The collection of samples is performed using the "clean hands-dirty hands" techniquedescribed in EPA method 1669 (USEPA, 1996). Bottles are sealed tightly and re-baggedusing the opposite series of steps as were used to open them. Samples are preservedimmediately upon collection and are shipped to the contract laboratory via overnight courierfor the desired analyses.
Ideally, at least two people each wearing fresh talc free polyethylene gloves (wrist size) orequivalent are required on a sampling crew. Fresh gloves should be worn at all times whenhandling samples or sampling equipment.
1. One person (designated "dirty hands") removes a bagged bottle from the box or cooler,and opens the outer bag, avoiding touching the inside surface of the bag.
2. The other person (designated "clean hands") reaches in, opens the inner bag, and removesthe sample bottle. "Clean hands" should not touch anything but the outside surface of thesample bottle and cap. If anything other than the sample bottle, cap, or water is touched,"clean hands" must change gloves.
3. “Clean hands" opens the sample bottle and holds the bottle in one hand and the cap in theother. If it is necessary to set the cap down, it should be placed in the inner bag fromwhich the sample bottle was removed. The sample is collected from just below thesurface of the water at or near the centroid of flow or transferred from a bigger pre-cleaned bottle used for sample collection. Sampling locations are selected as far awayfrom bridges as possible in order to minimize contamination from road or bridge dust anddebris. Due to the potential for contamination, sampling will not occur during a rainevent because rain is known to contain mercury (wet atmospheric deposition). Thepeople collecting the sample should be wary of disturbing the flow upstream of thesampling point.
4. Rinse the sample bottle and the inside surface of the cap three times with sample water,and fill the bottle to the top with sample while leaving enough void volume toaccommodate the appropriate volume of the various preservatives. Replace the cap, andtighten securely.

Surveys Section SOPDRAFT Ver. #: 1
Date: June 2002Page 17 of 86
5. Re-bag the bottle in the opposite order it was removed.
6. If during sampling a sampling pump, Teflon and C-Flex tubing, capsule filters, andthe appropriate Teflon fittings necessary to join the various types of tubing to thecapsule filter are utilized, this equipment must be handled in the same manner as thesample bottles are handled using the "clean hands-dirty hands" technique.
7. If a sampling pump, Teflon and C-Flex tubing, capsule filters, and the appropriateTeflon fittings necessary to join the various types of tubing to the capsule filter areutilized, this equipment must be purged with sample for one minute before the sample iscollected.
8. Gloves should be changed between samples and whenever anything not known to be tracemetal clean is touched.
2.2.4 COLLECTION OF FIELD BLANKS AND FIELD DUPLICATES
A field blank will be collected with every 10 samples or as described in the sampling plan. Asample bottle for the field blank should be requested from the laboratory. A separate bottle orcarboy filled with reagent water is used for the field blank and provided by the contractlaboratory.
1. To collect the field blank, open an empty sample bottle using the "clean hands-dirty hands"technique described above. Also, open the bottle or carboy containing the reagent water.
2. Pour the reagent water into the empty sample bottle. This is now the field blank. If asampling pump, Teflon and C-Flex tubing, capsule filters, and the appropriate Teflonfittings necessary to join the various types of tubing to the capsule filter are utilized, thereagent water must be pumped through this equipment prior to pouring into the samplebottle. The field blank is collected prior to the collection of a sample. After field blankcollection, the Teflon and C-Flex tubing, capsule filters, and the appropriate Teflonfittings necessary to join the various types of tubing to the capsule filter do not have to bechanged prior to actual sample collection if this equipment is utilized.
3. Re-bag the field blank in the opposite order it was removed.
4. A field duplicate will be collected with every 10 samples or as described in the samplingplan. A sample bottle for the field duplicate should be requested from the laboratory. Aseparate sample bottle is used to collect the field duplicate. The field duplicate is collectedin the same manner as an actual water sample. The field duplicate is collected immediatelyafter the original sample without changing the Teflon and C-Flex tubing, capsule filters,and the appropriate Teflon fittings necessary to join the various types of tubing to thecapsule filter if this equipment is utilized.
2.2.5 PRESERVATION, PACKING, REFRIGERATION, AND SHIPMENT OF WATER SAMPLES
All water samples must be preserved in the field or in the laboratory in accordance withsampling and analysis work plan requirements, capped tightly, and maintained at 4° Celsius

Surveys Section SOPDRAFT Ver. #: 1
Date: June 2002Page 18 of 86
with ice from the time of collection until receipt by the contract laboratory.
The double-bagged samples are bagged in a large "sampling location bag" which providesprotection from the ice and the resultant water from melting ice.
A Chain of Custody sealed in a plastic bag will accompany the samples during shipment to thecontract laboratory. The coolers containing the samples will be thoroughly sealed withadhesive tape in order to provide protection from spillage as well as a forming a custody seal. All bottle and preservative lot numbers supplied by the contract laboratory are recorded on theappropriate field sheets.
Samples will be shipped via overnight courier to contract laboratory at the conclusion of eachsampling event.
2.3 GUIDELINES FOR THE OPERATION OF THE E. COLI MOBILELABORATORY
NOTE: Sampling and analysis procedures described in this section are preliminary. Proceduresare being refined during the current sampling season. Revisions will be published in the nextversion of this manual.
2.3.1 SAMPLE COLLECTION, HANDLING, AND PRESERVATION
2.3.1.1 Sample CollectorThe sample collectors shall be trained in aseptic sampling procedures.
2.3.1.2 SamplingAt least 100 mL of sample must be collected, allowing at least a 1-inch air space tofacilitate mixing of the sample by shaking. Immediately after collection, a sampleinformation form should be completed.
2.3.1.3 Sample Information FormAfter collection, the sampler should enter on a sample information form, or field sheet inindelible ink, the following information:
§ Name of site, or identification number§ Sample identification #§ Sample site location§ Sample type

Surveys Section SOPDRAFT Ver. #: 1
Date: June 2002Page 19 of 86
§ Date and time of collection§ Analysis required§ Disinfectant residual§ Name of sampler and organization § Sampler's initials§ Person(s) transporting the samples to the laboratory (if not the sampler)§ Transportation condition (e.g., <10°C, protection from sunlight).§ Any remarks
Source water samples must be representative of the source of supply, collected not too farfrom the point of intake, but at a reasonable distance from the bank or shore. The samplevolume should be sufficient to perform all the tests required.
2.3.1.4 Sample Icing
Water samples must be held at <10°C.
2.3.1.5 Sample Holding/Travel TimeThe time from sample collection to initiation of analysis for total coliforms and fecalcoliforms in source water and heterotrophic bacteria in drinking water must not exceed sixhours.
2.3.1.6 Chain-of-CustodySample collectors and laboratories must follow applicable Field Procedure Manualrequirements pertaining to chain-of-custody. Even if custody is never transferred, a chainof custody form shall be filled out and filed as part of the data set.
2.3.1.7 Laboratory FacilitiesLaboratory facilities should be clean, temperature- and humidity-controlled, and haveadequate lighting at benches. There will be provisions for disposal of microbiologicalwaste.
Laboratory facilities should have sufficient bench-top area for processing samples; storagespace for media, glassware, and portable equipment; and floor space for stationaryequipment such as incubators, water baths, refrigerators, etc.
2.3.1.8 Temperature Monitoring DevicesGlass, dial, or electronic thermometers must be graduated in 0.5ºC increments or less. Thefluid column in glass thermometers should not be separated. Dial thermometers that cannotbe calibrated should not be used. Calibrations of glass and electronic thermometers shouldbe checked annually and dial thermometers quarterly, at the temperature used, against a

Surveys Section SOPDRAFT Ver. #: 1
Date: June 2002Page 20 of 86
reference National Institute of Standards and Technology (formerly National Bureau ofStandards [NBS]) thermometer or one that meets the requirements of NBS Monograph SP250-23. The calibration factor should be indicated on the thermometer. Also, the laboratoryshould record the date the thermometer was calibrated and the calibration factor in a QCrecord book.
If a thermometer differs by more than 1ºC from the reference thermometer, it should bediscarded. Reference thermometers should be recalibrated every three years.
2.3.1.9 Incubator UnitIncubator units must have an internal temperature monitoring device and maintain atemperature of 35 ±0.5EC. Air-type incubators, especially small ones, may not be able tobring a cold 100 mL water sample(s) to the specified incubation temperature of 35°C forseveral hours. This problem may be further aggravated if several cold water samples areplaced in the incubator at the same time. The problem may cause false-negative resultswith the chromogenic/fluorogenic substrate tests. Therefore, laboratories with air-typeincubators should check the time it takes for a 100 mL water sample (or a set of 100 mLwater samples, depending on normal use) to reach 35EC, and ensure that the specifiedincubation period at that temperature is followed. This check should be repeated wheneverthere is a significant change in the sample load.
Calibration-corrected temperature should be recorded for days in use at least twice per daywith readings separated by at least 4 hours.
2.3.1.10 Reagent-Grade WaterOnly satisfactorily tested reagent water from stills or deionization units may be used toprepare media, reagents, and dilution/rinse water for performing bacteriological analyses.Reagent water quality criteria are listed in Table 2.4.
Table 2.2 Reagent Water Quality Criteria for Bacteriological AnalysisParameter Limits Frequency
Conductivity <2 micromhos/cm at 25°C Monthly
Pb, Cd, Cr, Cu, Ni, Zn <0.05 mg/L per contaminant* Annually(*Collectively, no greater than0.1mg/L)
Heterotrophic Plate Count ** < 500/mL Monthly(** Pour Plate Method. See StandardMethods 9215B)
Surveys Section SOPDRAFT Ver. #: 1
Date: June 2002Page 21 of 86
2.3.1.11 PipetsTo sterilize and maintain sterility of glass pipets, stainless steel or aluminum canisters canbe used or individual pipets should be wrapped in char-resistant paper or aluminum foil.Pipets must have legible markings and should not be chipped or etched. Opened packs ofdisposable sterile pipets should be resealed between use periods. Pipets delivering volumesof 10 mL or less must be accurate within a 2.5% tolerance.
2.3.1.12 Laboratory Equipment and SuppliesThe laboratory must have the equipment and supplies needed to perform the approvedmethods.
2.3.2 ANALYTICAL METHODOLOGY FOR COLILERT
Water samples should be shaken vigorously about 25 times before adding media.
2.3.2.1 Use of Colilert MediaEach new lot of dehydrated or prepared commercial medium should be checked before usewith positive and negative culture controls. In addition, each batch of laboratory-preparedmedium should include positive and negative culture controls. These control organisms canbe stock cultures (periodically checked for purity) or commercially available disksimpregnated with the organism. Results should be recorded.
These media must not be prepared from basic ingredients, but rather purchased from acommercially available source. The media must be protected from light.
Some lots of fluorogenic media have been known to autofluoresce. Therefore, each lot ofmedium should be checked before use with a 366-nm ultraviolet light with a 6-watt bulb. Ifthe media exhibit faint fluorescence, the laboratory should use another lot that does notfluoresce. If the samples plus a medium exhibit a color change before incubation, it shouldbe discarded and another batch of medium used.
For each lot of medium, a quality control check must be performed by inoculating sterilewater containing the medium with a MUG-positive E. coli strain, a MUG-negativecoliforms, and a non-coliforms and analyzing them.
2.3.2.2 Use of Quanti-tray 2000Laboratories may also use Quanti-Tray test or Quanti-Tray 2000 test for drinking water andsource waters. Both tests use the Colilert medium. If the Quanti-Tray or Quanti-Tray 2000test is used, the sealer should be checked monthly by adding a dye (e.g., bromcresol purple)to the water. If dye is observed outside the wells, another sealer should be obtained.

Surveys Section SOPDRAFT Ver. #: 1
Date: June 2002Page 22 of 86
For enumerating total coliforms with the Colilert test, Quanti-Tray or Quanti-Tray 2000must be used for each sample dilution tested. Dilution water (for thechromogenic/fluorogenic substrate test only), if used, must be sterile dechlorinated tapwater, deionized water, or distilled water.
For the Colilert test, samples must be incubated at 35 ±0.5ºC for 24 hours. A yellow colorin the medium equal to or greater than the reference comparator indicates the presence oftotal coliforms and must be reported as a total coliforms positive. If the sample is yellow,but lighter than the comparator, it must be incubated for another four hours. Do notincubate more than 28 hours total. If the color is still lighter than the reference comparatorat 28 hours, the sample should be reported as negative.

Surveys Section SOPDRAFT Ver. #: 1
Date: June 2002Page 23 of 86
Table 2.3 E. coli Equipment ChecklistExpendable Supplies Capital Supplies
SAMPLE BOTTLES UV lamp
Quanti-trays 2 Incubators
Colilert Enzyme Substrate Quanti- tray Sealer
10 mL disposable PIPETS Thermometers
LATEX GLOVES CLEAN Ropes in ZIPLOCK bags
Hand sanitizer 4 medium COOLERS
Bench Sanitizer 2 FOR BOTTLE STORAGE
2 CARBOYS FULL OF DI WATER 1 W/ ICE
Heavy Duty Trash Bags 1 for dilution water
EXTRA ZIPLOCK BAGS 2 TOTES
Bio-Hazard Bags 1 To Store CLEAN Sampler
Record-keeping 1 To Take on BRIDGES
E. coli Field Sheets STAINLESS STEEL BUCKET
SHARPEE MARKERS PLASTIC BUCKET WITH ROPE
PENS AND PENCILS SAMPLER AND SPARE SAMPLER
CLIPBOARD INDIVIDUALS SAFETY GEAR
Laptop computer HYDROLAB
2 disks SMALL RED COOLER
PHONE DO KIT
Work Plan and SOP for van pH METER
Operations Turbidity meter
Lab log
Incubator logs
MAPS

Surveys Section SOPDRAFT Ver. #: 1
Date: June 2002Page 24 of 86
2.4 ISCO AUTOMATIC SAMPLER PROCEDURES
2.4.1 GENERAL
Currently, four types of ISCO samplers are being used by the Surveys section. They aremodels 2700, 2900, 3700, and 6000. The primary difference in these models is size andsample capacity. The 2700 and 3700 models are the larger samplers and each contain 24plastic bottles of 1000 mL capacity. The 2900 model is a smaller sampler with each of its 24bottles having a 500 mL capacity. The ISCO model 6000 is used for collecting volatileorganic compounds (VOCs) and utilizes 40 mL vials for collection of samples. All four ofthese samplers function by means of peristaltic pumps and can be operated by means of aNickel-Cadmium battery pack or by an external direct current source. The samplersincorporate sealed control boxes with electronic keypads for easy programming. Theprogramming capabilities of each model allow for numerous sampling possibilities. Theoperating instructions are listed, in condensed form, on the top of each control box. Thesesamplers are primarily used in a timed-interval mode in which discrete aliquots or samples arecollected at fixed intervals. A flow weighted sample is then achieved by proportioning thealiquots according to a continuous flow recording which is made during the sampling period.A further explanation of this method can be found in the U.S. EPA NPDES ComplianceManual (USEPA 1977). All sampler models can be used with the ISCO flow meter models2870 and 3230 to produce automatically flow-weighted composites. However, it must beknown with some accuracy what the total flow for the 24-hour sampling period will be inorder for this technique to be used. See page 14 of this Manual in reference to setting upsequential flow sampling. With the exception of the model 6000, the plastic bottles used inthese samplers restrict sample collection to general chemistry (BOD, suspended solids, pH,etc.), nutrients (ammonia, phosphorus, TKN, etc.), and metals parameters. Some of the 2700models have been modified to hold a single 2 1/2 gallon glass container for toxic pollutantsample collection. Samples for toxic pollutants should contact only tetrafluoroethylene(Teflon), glass, and/or medical-grade silicone rubber in the peristaltic pump transport system.Refer to the toxic sample collection section of this SOP for an in-depth explanation of thismethod.
Important considerations when setting up automatic samplers include water quality and flowrate in a given flow stream. These parameters can vary considerably from one moment to thenext. Sampler programming may dictate frequent aliquot collection in some samplingsituations to obtain an accurate representation of flow over a given period of time. A flowwaste stream may also be highly stratified, nonhomogeneous, and may present a less thanideal medium from which to take a representative sample. Current assessment of samplingmethods (USEPA 1977), suggest that strainer placement should be at 60% of the stream depthin an area of maximum turbulence. The selection of 60% depth is based on velocity andsedimentation charts from the same report. Strainer intakes should definitely not rest on thebottom of the flow stream where sediments collect, or against side walls of tanks where solidsor bacteriological buildups might artificially enrich the sample.

Surveys Section SOPDRAFT Ver. #: 1
Date: June 2002Page 25 of 86
Sample preservation should be performed immediately upon sample collection. For compositechemical samples, each aliquot should be preserved at the time of collection. When use of anautomated sampler makes it impossible to preserve each aliquot, chemical samples may bepreserved by maintaining at 4°C until compositing and sample splitting is completed.
These samplers are cleaned after each use by rinsing appropriate parts (funnels, bases, etc.) inhot water. If necessary, a detergent will be used. A 50% HCl solution is run through thepumps, followed by several rinses of distilled water. All bottles are cleaned in the Surveyssection laboratory bottle washer. After the bottles are cleaned, they are capped until used toprevent contamination. Records concerning the use and maintenance of samplers are found inthe sign-in/sign-out log kept in the Surveys section office. Additional information onautomatic samplers can be found in the instruction manuals for these instruments.
2.4.2 TIME COMPOSITE SAMPLING
The object of composite time sampling using the Model 2700 is to collect a series of discrete,equal volume samples at a known regular time interval, and to place these samples into asingle composite sample container. When programming the sampler in a composite timemode, two quantities must be calculated to allow the sampler to be programmed in a rationalmanner:
1. the total number of samples to be collected, and
2. the volume of each individual sample.
3. To determine the total number of samples to be collected, two quantities must beknown.
4. the time increment between samples, and
5. the total time over which the composite samples are to be taken.
2.4.3 SEQUENTIAL FLOW SAMPLING
Use of the sequential flow mode (#2) on the ISCO automatic sampler permitsflow-proportioning of the composite sample at the time of collection. This eliminates the timeconsuming tasks of averaging the flow, calculating, measuring, and pouring individual timesequential aliquots.
In order to use this option, a primary flow measuring device, which is compatible with anISCO flow meter, must be located near the sampling site. It is also recommended that thisset-up be employed only where a power source is available. If it is necessary to use batterypower, install a battery on both the flow meter and the sampler. When using power packs, theflow meter can be powered by the power pack on the sampler. In addition to the flow meterand sampler, the six (6) prong connector cable is required to complete the set-up. If it isdesired to run two samplers off the same flow meter, the splitter cable must be used. The

Surveys Section SOPDRAFT Ver. #: 1
Date: June 2002Page 26 of 86
splitter cable is connected to the flow meter and then the connector cables are fitted to thesamplers. Each of the samplers can then be programmed as desired. It is not necessary toprogram both samplers in the same way.
Prior to programming the samplers, a reliable estimate of the anticipated volume of flow forthe survey period is required. This estimate can be obtained from plant Monthly Reports ofOperations (MRO) if the facility meter is considered reliable. It is usually advantageous toestimate a little low on the flow volume. This will result in a larger aliquot being takenwhereas a high estimate may result in an insufficient volume of the sample.
2.4.3.1 Programming Samplers with Flow Meters for Sequential FlowThe object of sequential flow sampling using the model 2700 is to collect a sequentialseries of discrete equal volume samples in an identifiable series of sample bottles. Aspreviously discussed, the Model 2700 will accept flow proportional inputs of a certainnature from an external flow meter. These electronic flow input signals are transmitted tothe sampler at fixed increments of total flow, for example, every 10,000 gallons. That is,each time 10,000 gallons of liquid has flowed past the flow meter, a signal is sent to thesampler, which registers it as a single flow pulse. The Model 2700 Sampler can beprogrammed to totalize any number of flow pulses from 1 to 9999 before a sampling cycleis initiated. For example, if the sampler were programmed to totalize 5 flow pulses andeach flow pulse represented 10,000 gallons of total flow, a sample would be collected eachtime 50,000 gallons (5 flow pulses of 10,000 gallons each) had flowed past the flow meter.
2.4.3.1.1 Programming Sampler with ISCO 2870 Flow Meter
1. Detailed programming instructions are provided in the ISCO 2700 sampler manual,pages 2- 43 through 2-46, and are listed in Table 6.
2. The volumetric unit/flow pulse switch may be set to 10, 100, or 1000 volumetricunits.
3. The scaling constant determines the total gallons per volumetric unit. For example:
Scaling ConstantX.XX + 0 = X1X.XX + 1 = X10X.XX + 2 = X100
SCALING CONSTANT value establishes multiplying factor for ISCO Flow meter2870. It is extremely important to note that the setting on the SCALINGCONSTANT switches establishes the volumetric units for the flow meter.
For example, if the SCALING CONSTANT switches were set in terms of gallons persecond, the flow rate would be measured and transmitted to an external recording devicein gallons per second, flow would be totalized in gallons, and an associated sampler

Surveys Section SOPDRAFT Ver. #: 1
Date: June 2002Page 27 of 86
would be paced in a flow proportional mode in gallons. The exponential portion of thesetting on the SCALING CONSTANT switches also establishes a multiplying factorwhich must be applied to the reading on the TOTAL FLOW counter and the settings ofthe SAMPLER INITIATION SIGNAL switch.
Table 2.4 Set Up Example for ISCO 2870 Flow Meterq Set Up Example for ISCO 2870 Flow Meter Primary device: 90 degree v-notch weir
q Scaling constant (1 ft): 18.7 GPS = 1.87 +1
q Estimated flow: .450 MGD
q Total sample volume: 15.0 liters
q Number of samples: 45 (@ 300 mL/sample)
q 450,000 divided by 45 samples + 10,000 gallons/sample
q 10,000 gallons = interval between samples
q Set volumetric units/flow pulse switch at 100 (100 x scaling constant = x.xx + 1 = 100 x 10 =1,000 gallons/flow pulse)
q Set sampler for 10 flow pulses sample interval.
q Set sampler to collect 300 mL/sample
q Three samples/bottle
For example, consider a SCALING CONSTANT setting of 6.42 + 1 gallons per second.The exponential portion of this setting is:
+1 = 101 = 10This multiplying factor of x10 must be applied to the items listed above. The reading onthe TOTAL FLOW counter should be multiplied by 10. The possible settings of theSAMPLER INITIATION SIGNAL switch should also be multiplied by 10, resulting inpossible settings of 100, 1,000, and 10,000.
2.4.3.1.2 Programming Sampler with ISCO 3230 Flow Meter
The volumetric flow pulse can be set to any volume. For example, the flowmeter/sampler setup would be as follows:§ estimated flow: 0.450 MGD
§ total sample volume: 15 liters (15 sampler bottles)
§ number of sampling periods: 45 (15 bottles x 3 samples per bottle)
§ 450,000 (0.450 MGD) divided by 45 samples = 10,000
§ sample every 10,000 gallons
§ ISCO 3230 flow meter flow pulse interval: 1,000 gallons
§ set sampler initiation interval for 10 flow pulses

Surveys Section SOPDRAFT Ver. #: 1
Date: June 2002Page 28 of 86
§ set sampler to collect 300 ml per sample (three samples per bottle)
2.4.3.2 Automatic Sampler Sequential Flow Set-up ExampleTo program the sampler for automatic operation in a sequential flow mode, the use of thefollowing set of step-by-step instructions is recommended. These instructions assume thatthe sampler is off and that the sample bottle tub has been properly prepared with 24 plasticor glass sample bottles.
Table 2.5 Program Instructions for ISCO MODEL 2700 Automatic Sampler
STEP NO.INDICATORLIGHT ON DISPLAY
1. Press ON key. This places the samplerinto the standby state.
1. None 1. Depending upon mode previously programmed,rotates between four dashes ("----") and the bottlenumber ("-01-"*) or shows the dashes ("----") only. Ifsampling program previously completed, rotatesbetween four dashes ("----") and "FULL".
2. Press PROGRAM/STEP PROGRAMkey. This places the sampler into theprogram state.
2. MODE 2. Previously programmed mode ("3"*).
3. Enter on the numeric keypad Mode 2(SEQ. FLOW).
3. MODE 3. "2".
4. Press ENTER VALUE key. MODE 4. "2".5. Press PROGRAM/STEP PROGRAMkey.
5. INTERVALBETWEENSAMPLES
1. Previously programmed interval in flow pulses("15"*).
6. Enter on the numeric keypad the desiredinterval between samples in flow pulses (upto 9999 flow pulses). For example, assume itis desired to collect samples at 100,000gallon intervals, and each flow pulserepresents 20,000 gallons-enter 5(100,000/20,000=5) on the numeric keypad.
6. INTERVALBETWEENSAMPLES
6. "5".
7. Press ENTER VALUE key. 7. INTERVALBETWEENSAMPLES
2. "5".
See attached addendum sheet regarding delay to first sample.8. Press PROGRAM/STEP PROGRAMkey.
8. NOMINALSAMPLEVOLUME
8. Previously programmed nominal sample volumein 10's of ml ("50"*).
9. Enter on the numeric keypad the desirednominal sample volume in 10's of milliliters(to a maximum of 99). For example, assumethat it is desired to collect samples with avolume of 750 ml-enter 75 on the numerickeypad.
9. NOMINALSAMPLEVOLUME
9. "75".
10. Press ENTER VALUE key. 10. NOMINAL 10. "75".

Surveys Section SOPDRAFT Ver. #: 1
Date: June 2002Page 29 of 86
STEP NO.INDICATORLIGHT ON DISPLAY
SAMPLEVOLUME
11. Press PROGRAM/STEP PROGRAMkey.
11. Type ofSUCTION LINE
11. Previously programmed type of suction line("3"*)
12. Enter on the numeric keypad thenumber corresponding to the desired type ofsuction line. For example, assume that a ¼"ID by 25' long suction line is being used-enter type 2 (1/4" X 25') on the numerickeypad.
12. TYPE OFSUCTION LINE
12. "2".
13. Press ENTER VALUE key. 13. TYPE OFSUCTION LINE
13. "2".
14. Press PROGRAM/STOP PROGRAMkey.
14. SUCTIONHEAD
14. Previously programmed suction head in feet("10").
15. Enter on the numeric keypad the suctionhead in feet, to a maximum of 20 ft. Thesuction head is the vertical distance from thesurface of the liquid source to the pumpinlet. For example, assume that the suctionhead is 12 ft-enter 12 on the numerickeypad.
15. SUCTIONHEAD
15. "12".
16. Press ENTER VALUE key. 16. SUCTIONHEAD
16. "12".
17. Press PROGRAM/STOP PROGRAMkey.
17. MULTIPLEXMODE
17. Previously programmed multiplex mode ("2"*).
18. Enter the number corresponding to thedesired mode of multiplex operation on thenumeric keypad. For example, assume thatno multiplex operation is desired-enterMODE 1 on the numeric keypad
18. MULTIPLEXMODE
18. "1".
19. Press ENTER VALUE key. 19. MULTIPLEXMODE
"1".
20. Press PROGRAM/ STEP PROGRAMkey. This returns the sampler to the standbystate.
20. NONE 20. Rotates between four dashes ("----") and thebottle number ("-01"*) of "FULL", if samplingpreviously completed.
21. Press the START PROGRAM/RESETDISTRIBUTOR key. This places thesampler in the RUN state. If the displaypreviously had read "FULL", the distributorwill automatically be repositioned to thebottle number 1 position.
21. None 21. Rotates between the interval in flow pulses untilthe first/next sample is collected ("0042"*) and thebottle number into which this sample will be placed("-01"*).
* Example - may be other value.
This completes the programming of the Model 2700 Sampler in a sequential flow mode.Following the example, the sampler will collect the first 750 mL sample in the first samplebottle after 5 flow pulses (100,000 gallons) have been received from the external flow

Surveys Section SOPDRAFT Ver. #: 1
Date: June 2002Page 30 of 86
meter. The display will continue to rotate between the interval in flow pulses remaininguntil the next sample is collected (for example,"0004") and the bottle number into whichthe sample will be placed (for example, "-02-"). The flow pulse interval to the next sampleis reset to the programmed value of 5 when the START PROGRAM/RESETDISTRIBUTOR key is pressed in step 21. As flow pulses are received from the externalflow meter, the flow pulse interval to the next sample shown in the display will decrementto zero, at which point a sample will be collected, the display will be reset to theprogrammed value of 5 and the decrementing process will begin again as flow pulses arereceived. The 750 mL samples will continue to be collected at 5 flow pulse (100,000gallon) intervals until the 24th and last sample bottle has been filled, at which time thesampler will shut off, and the display will read "FULL".
2.4.4 MODEL 2700 ADDENDUM
The Model 2700 software has been updated resulting in operational changes to the controller. These changes are present on units beginning with the serial number of 5349-001 or on allunits with software revision 7.23 or greater.
The following controller operations will be affected:1. While programming modes 2, 4, and 6, the sampler will now accept a value for "DELAY TO
FIRST/NEXT SAMPLE", this will cause the sampler to delay a fixed amount of time beforeaccepting flow pulses. If it is desired that the unit start sampling immediately after the"START PROGRAM/RESET DISTRIBUTOR" key is depressed, a zero should be entered atthe 'DELAY TO FIRST/NEXT SAMPLE" prompt. If a time delay was entered for the"DELAY TO FIRST/NEXT SAMPLE", when the program is started, the four digit displaywill alternate between the time delay left and "HHHH" until the time expires.
2. In all modes that accept a value for "DELAY TO FIRST/NEXT SAMPLE", the unit will nowaccept a zero. This is useful in the case of modes 2, 4, and 6 where it is desired that thesampler start sampling immediately. In the other modes, entering a zero will cause the delayto the first sample to be set at the number entered at the "INTERVAL BETWEENSAMPLES" prompt.
3. When ordering a replacement eprom be sure to order part number 60-2703-152 to receive the2700 EPROM (Rev. 7.25). Do not order part number 60-2703-134 as shown in thereplacement parts list or the 2700 EPROM (Rev. 4) will be sent.
2.4.5 CHURN USAGE FOR MIXING AND SPLITTING SAMPLES
The Surveys section uses a fifteen liter polyethylene churns for mixing, homogenizing, andsplitting samples for most parameters except for organic toxic pollutants. Aliquots areproportioned, according to flow measurement, into the churn at the end of the samplingperiod. Calculations for total sample volume should allow for an excess of 3 liters of sample.The excess volume barely clears the outlet spigot located on the side of the churn and shouldbe discarded after the actual sample has been mixed and drawn into the sample bottles. To

Surveys Section SOPDRAFT Ver. #: 1
Date: June 2002Page 31 of 86
insure thorough mixing of sample, at least 20 strokes of the churn handle should be effectedbefore the first sample is drawn. Agitation during sample removal is also necessary to preventsettling and keep the sample homogenous. All churns should be cleaned with hot water anddetergent and thoroughly rinsed after each survey.
2.4.6 ISCO SAMPLER EQUIPMENT MAINTENANCE
In order to insure adequate confidence levels in the survey activities, the maintenance of all ofthe ISCO Samplers are of prime importance. A logbook has been set up for these samplers.Maintenance and calibration instructions are contained in the manufacturer supplied manuals.The following duties always apply to all personnel using the ISCO automatic samplers:
1. Use all sign in/out log books. The personnel in charge of the automatic samplers willhave the responsibility to make sure that you do. Relate verbally any equipmentproblems you might have had to the person in charge of that equipment and notatethis problem in the log.
2. Make sure desiccant is dry when checking out or in. Change if pink. Clean equipmentpromptly. DO NOT LEAVE IT SITTING AROUND. Acid rinse pump tubing with50% HCl. Then follow with a distilled water rinse. Wash sampler bottom tub andany other parts which came into contact with sampled water. If necessary, washwith detergent and wipe down the outside of the sampler top to bottom. Wash alldirty bottles, and/or churns, in the laboratory bottle washer.
2.5 SAMPLING PROCEDURES FOR TOXIC SUBSTANCES
2.5.1 INTRODUCTION
A priority pollutant toxic organic chemical survey is a sampling for those contaminants forwhich the U.S. EPA has developed water quality and human health criteria recommendations.Generally referred to as a "toxic scan" survey, it is a particular sampling of those designated126 "priority pollutant compounds." These parameters have been separated into eightcategories based on the different specific laboratory analysis, yet each dictating various meansof field collection and handling. These categories are metals, halogenated volatile organics,nonhalogenated volatile organics, aromatic organics, base/neutral fraction, organochlorinepesticides, phenols, and polychlorinated biphenyls (PCBs).
2.5.2 METHODS AND FORMS OF TOXIC SAMPLING
The terms "manual sampling", "automatic sampling", "grab sample" and "composite sample",all retain the same meaning with respect to toxic parameters as they do with the moretraditional parameters. Each of the eight categories of priority pollutants mentioned in theintroduction may be sampled in the manner defined by the above terms. "Sampling location"is likewise dictated by the same criteria that govern the more traditional parameters.

Surveys Section SOPDRAFT Ver. #: 1
Date: June 2002Page 32 of 86
2.5.3 EQUIPMENT PREPARATION
2.5.3.1 Automatic Sampler Preparation for Composite Sampling CollectionCurrently, the ISCO Sampler, Model 2700, is used to collect composite samples of thesetoxic parameters: Base/Neutral Fraction, Organochlorine Pesticides, Phenols, and PCB's.The sample is collected in a single glass container at equal time intervals. Proper samplertubing and strainer preparation are extremely important aspects in preventing interferencewith and contamination of samples. Only 3/8-inch I.D. medical grade silastic tubingmanufactured by Dow Corning is the standard approved tubing used in the peristalticsampler pumps. Teflon tubing is the approved sampling line-tubing used, but medicalgrade silastic tubing can also be used for the sampling line-tubing. The strainer is made ofstainless steel. All surfaces which have contact with the sample must be rinsed withacetone to remove any moisture or water followed by a petroleum ether rinse to make anyresidual organic toxics soluble for removal. These solvents must be passed through allsampler tubing and over the strainer. The ends of the tubing are then sealed with aluminumfoil and secured by taping for protection against contamination until usage at the samplingsite. The strainer is similarly protected by wrapping in aluminum foil after solvent rinsing.Because of hazardous fumes, this solvent-rinsing procedure should be conducted underventilation hoods. Presently this rinsing is carried out by the ISDH Laboratory.
2.5.3.2 Sample Container PreparationThe base/neutral fractions, pesticides, phenols and PCBs are collected with the ISCOsamplers. The present method is to pump the sample into a 2½ gallon glass jug and thendivide as needed into solvent rinsed, one liter glass containers. Good quality controlrequires that acetone, petroleum ether, hexane, or methylene chloride be used to solventrinse sampling containers for collection of the aforementioned parameter groups. If achlorinated sample is to be collected, sodium thiosulfate crystals equal to ~.008 percent,approximately one crystal/liter of sample, should be added to the jug to deactivate chlorine.Once sampling is completed, the sample is shaken up thoroughly and poured into theone-liter glass solvent rinsed bottles and then sealed with Teflon lined caps. If split samplesare requested by the inspected facility, then additional bottles are poured according tofacility analytical needs.
Halogenated volatile organics, nonhalogenated volatile organics, and aromatic volatileorganics are all collected in 40 mL purgeable vials with a Teflon lined septum cap. Thesecontainers are prepared by laboratory staff along with two field blanks that mustaccompany all samples for quality control checks. The chemical instability of theseparameters prohibits composite sampling. Thus, individual discrete samples are collectedat times and intervals dictated by facility operation changes or other survey conditions.Volatile samples are collected in two 40 mL vials at each time and sampling location to

Surveys Section SOPDRAFT Ver. #: 1
Date: June 2002Page 33 of 86
permit quality assurance by duplication of analysis in those instances where parameters arefound just above detection levels. It is important to remember to account for these extravials when projecting the number required for a survey. As with the glass composite jugs,sodium thiosulfate crystals must be added to the vials when sampling chlorinated effluents.
Sludge samples for all toxic parameters except the volatile organics must be collected inone pint glass solvent rinsed jars with aluminum foil lined caps. Two jars per sludgesampling site will assure sufficient sample. Sludge sample collection for VOCs iscollected in the 40 mL purgeable vials simply by pushing the vial directly into the sludgeforcing out all air and bubbles in the process. One vial per sampling site is sufficient foranalyses of all VOCs. If the sludge is in a liquid state, more sample might be needed.
All heavy metal parameters and mercury are composited into one two-liter plastic bottle. Aone-liter plastic bottle is used for each cyanide composite sample to be collected.Preservatives are added on site. Standard blanks should also be prepared, using the samepreservatives.
2.5.3.3 Manual Sampling PreparationSolvent rinsed stainless steel buckets should be used in these instances where manualsampling is required. The buckets should be covered by aluminum foil immediately aftersolvent rinsing in the laboratory to prevent contamination during transport to the samplingsite.
2.5.4 ON-SITE SAMPLE COLLECTION
2.5.4.1 Automatic Sampler Set Up for Compositing SamplesRefer to the ISCO sampler, Model 2700, operation manual for basic information on set up.Currently, only equal volume composites for the base/neutral fraction, organochlorinepesticides, phenols and PCBs are collected in the single glass jug using an automaticsamplers. When assembling a sampler for toxic sampling, the tubing should be extendedtwo (2) inches into the amber jug. If tubing is more than two (2) inches, it is possible thatwhen the jug is nearly full, sample will be withdrawn during the postpurge cycle. Thesampler tubing and strainer should be unwrapped just prior to set up, with care being givento handling to minimize contamination. One hour sequences for aliquot collection is themost commonly used programming interval. The staff person should evaluate thecircumstances at a particular sampling site and determine the intervals needed to make themost representative sample. Upon completion of sampler programming, ice should beadded to the sampler tub to preserve the sample at 4°C during collection.
2.5.4.2 Collection of Volatile Organic Samples

Surveys Section SOPDRAFT Ver. #: 1
Date: June 2002Page 34 of 86
Ideally, VOCs should be sampled below the surface of a liquid source to minimizevolatilization, which would occur by turbulence of the liquid entering the vials. In practicalsampling situations this is difficult to achieve without some aeration while transferring thesample from the manual collection apparatus to the sample vial. If at all possible, thesample should not be skimmed from the surface of the sampling site or poured as a meansof transferring the sample. A good approach is to use a solvent rinsed glass, stainless steel,Teflon, or silastic pump tube and, by placing one end into the liquid source, seal the otherend with your thumb or clamp, place the sampling end into the bottom of the vial, slowlyrelieve the pressure on the other end and allow the sample to fill the vial. Slowly withdrawthe tube while allowing the tube to drain, so that the vial is filled and a convex meniscusdevelops over the top. The septum inside the cap is rather loose fitting and can be easilylost or contaminated by handling or dropping. The Teflon side of the cap must be placedinward. After the cap is secure, the vial should be inverted and tapped to determine if thesample is completely free of air bubbles. The collector should practice this samplingtechnique numerous times so that proficiency is developed in avoiding entrapment of airbubbles. The ISCO sampler model 6000 can also be used in collection of VOCs.
When a 24-hour composite sampling survey is warranted, VOCs are commonly collectedonce per eight hour shift. Again this interval may vary depending on the collectorsevaluation of survey conditions.
2.5.4.3 Collection of Sludge and Sediment SamplesSurveys staff are sometimes required to sample sewage and industrial sludge, and bottomsediments of waterways. Collection and analysis of these materials can give importantinformation about the present and past status of the overlying water column with regard toits chemical constituents, especially those that may persist for longer periods of time.
Sewage and industrial sludge samples as well as stream sediment samples for all toxicparameters except the volatile organics must be collected in one pint glass solvent rinsedjars with aluminum foil lined caps. Sludge and sediment sample collection for VOCs is in40 mL purgeable vials, simply by pushing the vial directly into the sludge/sediment forcingout all air and bubbles in the process. No preservatives are needed for sludge/sedimentsamples. Samples should be placed on ice or put into a refrigerator and stored at 4°C untildelivery to the laboratory.
When sludge sampling, consider where the sample should be collected. In most cases, thiswill be the oldest or final dry state just before ultimate disposal. Solid or dry sludge shouldbe packed into the purgeable vials leaving as little air space as possible. A solvent rinsedstainless steel utensil is useful for this purpose. A few situations may warrant collectingVOCs at a liquid sludge source before dewatering. The liquid source would give analysisof levels in the ripe sludge since VOCs disperse easily in the drying process. All otherpriority pollutant sludge samples are collected in one pint solvent rinsed jars either by

Surveys Section SOPDRAFT Ver. #: 1
Date: June 2002Page 35 of 86
scooping of a dry sample or collection at a liquid source. Sludge collection is an obvioussituation where protective gloves should be worn.
Collection of stream sediment samples for all analyses, with the exception of VOCs, are inglass pint jars rinsed with either hexane or acetone solvent. Jars should be sealed witheither aluminum foil or Teflon lined screw-on lids. A suitable site for sediment collectionis one that does not contain large areas of sand or gravel. In most cases, sediment samplescan be collected by hand using a solvent rinsed stainless steel scoop and mixing pan.Sediment is scooped up from several areas across the stream bottom, put into the mixingpan, and thoroughly stirred in order to acquire a homogenous sample. A portion of thismixture is then put in a solvent-rinsed glass jar and as much of the water as possible ispoured from the jar, taking care not to lose any of the sediment.
Samples to be analyzed for purgeable organics (VOCs) are collected in 40 mL screw capvials fitted with a Teflon lined silicon septum. Usually the sediment sample can becollected in the manner described above, but there are some additional procedures to befollowed. The vials are filled as full as possible with the sediment, and then the cap, withthe Teflon face of the septum down, is placed on the vial. Care must be taken to prevent airbeing trapped in the vial. Staff members have found that holding the vial beneath thesurface of the water while screwing the cap on usually prevents air from being trapped inthe vial. If this is not possible, water should be added to the vial to form a convex meniscusat the vial mouth, and the cap carefully screwed on the vial. After sealing, the vial shouldbe checked for air bubbles by inverting it. If air bubbles are present, the vial should beresealed by removing the cap, adding more water to form the convex meniscus andreplacing the cap as before.
If sampling of the sediment cannot be done by hand, some type of mechanical sampler suchas a Ponar is used. The sampler is cleaned and solvent rinsed before each sample is taken.Care must be taken to lower the sampler slowly to the bottom so as to minimize thedisturbance of the surface layers of the sediment. The sample is then brought to the surfaceand the sediment either collected as described above, or the sediment is pushed into thesample jar using a clean, solvent rinsed piece of aluminum foil.
If a core sampler is used, the sampler is cleaned and solvent rinsed before each use.Samples are placed in solvent rinsed pint glass jars with aluminum foil or Teflon lined lids.If samples from different layers of the sediment core are required, the core is wrapped insolvent rinsed aluminum foil. Care must be taken to preserve the vertical integrity of thecore sample in this case.
2.5.4.4 Collection of Metals, Mercury and Cyanide SamplesMetals and mercury are collected together by means of an ISCO Automatic Sampler andflow weighted by measuring the individual discrete samples in a glass graduated cylinder in

Surveys Section SOPDRAFT Ver. #: 1
Date: June 2002Page 36 of 86
proportion to the flow measurements. The sample is composited into a two-liter plasticbottle, and preserved with 10 milliliters of concentrated nitric acid. Samples are preservedat the end of the 24-hour collection period rather than each individual sampler bottle at thetime of set-up. This is due to the corrosive affect of the nitric fumes on metal parts insidethe sampler. Automatic samplers are also used in cyanide sampling, but each individualone-liter sampler bottle should be preserved at the time of set-up with one milliliter of 50percent sodium hydroxide (pH 12). For chlorinated samples, ascorbic acid (0.6g) shouldalso be added during set-up to nullify the destructive affect of chlorine on the cyanide. Theflow-weighted cyanide sample aliquots are composited into a one liter plastic bottle at theend of the 24-hour sampling period.
2.5.5 SPLIT SAMPLING METHODS
Sometimes a facility will request a "split sample." Splitting volatile organic parameters isdone by simply collecting additional purgeable vials during each sampling event. Metals,mercury, and cyanide samples can be flow weighted and split by first measuring the samplesin proportion to flow and then pouring them into a medium density polyethylene churn forthorough mixing. Then while churning, draw off individual samples. Due to the cyanidesample being preserved at set-up, churning and splitting must be done separately from themetals and mercury sample. All other "toxic" parameters can be split by means of pouring thecomposited sample from the glass jug.
2.5.6 TRANSPORT AND STORAGE OF SAMPLES
All samples should be iced while being transported to the laboratory. Care should be taken tonot submerge the purgeable vials in the ice, because it is possible for water to move throughthe septum cap.
2.6 FLOW MEASUREMENT
2.6.1 INTRODUCTION
For the most part, the following are summaries of the methods employed in the field and arenot intended to replace the documents mentioned above. Each of the instruments and/ormethods utilized by the Surveys section personnel are discussed in some detail below.
2.6.2 PRIMARY FLOW DEVICES COMMONLY USED FOR MEASURING FLOW IN WASTEWATER
TREATMENT FACILITIES
2.6.2.1 Weirs1. The standard contracted rectangular weir
2. The standard suppressed rectangular weir

Surveys Section SOPDRAFT Ver. #: 1
Date: June 2002Page 37 of 86
3. The standard Cipolletti weir
4. The V-notch weir
2.6.2.2 Weir Design RequirementsTo assure accurate discharge measurement, there are certain general weir designrequirements that apply to all types:
1. The weir should consist of a thin plate 1/8 to 1/4 inch thick with a straight edge ora thicker plate with a downstream chamfered edge. The upstream sharp edgeprevents the nappe from adhering to the crest. Knife edges should be avoidedbecause they are difficult to maintain. However, the upstream edge of the weirmust be sharp with right angle corners, since rounded edges will decrease the headfor a given flow rate.
2. The upstream face of the weir should be smooth and perpendicular to the axis ofthe channel in both horizontal and vertical directions. The crest of the weir shouldalso be exactly level to insure a uniform depth of flow.
3. The connection of the weir to the channel should be waterproof. Therefore, thejoint between the weir plate and channel should be packed with chemically inertcement or asphalt type roofing compound.
4. The length of the weir crest or the notch angle must be accurately determined,because the percentage error in measured flow rate will be proportional to theerror in determining these dimensions.
5. The weir should be ventilated, if necessary, to prevent a vacuum from forming onthe underside of the nappe.
6. The height of the weir from the bottom of the channel to the crest should be atleast 2 times the maximum expected head of liquid above the crest. This isnecessary to lower the velocity of approach. The weir height should never be lessthan 1 foot.
7. The approach section should be straight upstream from the weir for a distance ofat least 20 times the maximum expected head of liquid, and should have little orno slope.
8. The crest must be set higher than the maximum downstream elevation of thewater surface, otherwise a submerged flow condition will occur instead of the freeflow condition required for reliable flow measurement.
9. The device for measuring the head (flow meter) should be placed upstream at adistance of at least 3 times the maximum expected head on the weir and should belocated in a quiet section of the channel away from all disturbances, preferable ina stilling well. Also, the zero point of the head measuring device must be setexactly level with the weir crest.
10. The crest of the weir must be kept clean. Fibers, stringy materials, and largerparticles tend to cling to the crest and should be removed periodically. The

Surveys Section SOPDRAFT Ver. #: 1
Date: June 2002Page 38 of 86
upstream side of the weir should also be periodically purged of accumulated siltand solids.
11. The weir size should be selected only after preliminary studies have determinedthe expected flow rates in the channel in question. The Manning formula cansometimes be used to estimate the flow rate in open channels.
12. The cross-sectional area of the approach channel should be at least 8 times that ofthe nappe at the crest for a distance upstream of 15 to 20 times the head of thecrest. This is necessary to minimize the velocity of approach. The approachchannel should also permit the liquid to approach the weir in a smooth stream freefrom turbulence, and the velocity should be uniformly distributed over thechannel; this may be accomplished through the use of baffle plates if necessary.
13. If the weir pool is smaller than defined by the above criteria, the velocity ofapproach may be too high and the head reading too low. Weirs should be installedand maintained to make the velocity of approach negligible, but where this is notpossible, appropriate corrections should be made.
2.6.2.3 Flumes1. The Palmer-Bowlus flume
2. The Leopold-Lagco flume
3. The Parshall flume
A Parshall flume is a specially-shaped open-channel flow section which may be installed ina channel, lateral, or ditch to measure the rate of flow of water. The constricted throat ofthe flume produces a differential head that can be related to discharge. The crest followedby the downwardly sloping floor, gives the Parshall flumes its ability to withstandrelatively high degrees of submergence without affecting the rate of flow. The convergingupstream portion of the flume accelerates the entering flow, thereby essentially eliminatingthe deposition of sediment which would otherwise reduce measurement accuracy. Velocityof approach, which often is a detrimental factor in the operation of weirs, usually has littleeffect on the rate of discharge of the flume. The approaching flow should, however, be welldistributed across the channel and should be relatively free of turbulence, eddies, andwaves. Flumes should not be located where they are subjected to high velocity due to pumpcycles or force mains.
Discharge through a Parshall flume can occur for two conditions of flow. The first, freeflow, occurs when there is insufficient backwater depth to reduce the discharge rate. Thesecond, submerged flow, occurs when the water surface downstream from the flume is farenough above the elevation of the flume crest to reduce the discharge. For free flow, onlythe head (two-thirds the distance back on the converging section) at the upstream gagelocation (Ha) is needed to determine the discharge. The free-flow range includes some ofthe range which might ordinarily be considered submerged flow because Parshall flumestolerate 50 to 80 percent submergence before the free-flow rate is measurably reduced. For

Surveys Section SOPDRAFT Ver. #: 1
Date: June 2002Page 39 of 86
submerged flows, that is, when submergence is greater than 50 to 80 percent, both theupstream head (Ha) and downstream head (Hb) are needed to determine the discharge. Hbis the measurement 1" to 2" from the downstream side of the throat at a depth the same asthe floor of the converging section.
Presently, there is no standard design plan for either the Palmer-Bowlus or Leopold Lagcoflumes. Each manufacturer has developed their own design and formula for each flume forits specific use. To measure flow in such a flume, it is necessary to obtain design criteriafor that flume.
2.6.2.3.1 Flume Design Requirements
To assure accurate discharge measurement, there are certain general requirements forthe installation of flumes that apply to all types and size of flumes:
1. A flume should be located in a straight section of the open channel, withoutbends immediately upstream.
2. The approaching flow should be well distributed across the channel, andrelatively free of turbulence and waves.
3. Generally, a site with high velocity of approach should not be selected for aflume installation. However, if the water surface just upstream is smooth withno surface boils, waves, or high velocity current concentrations, accuracy maynot be greatly affected by velocity of approach.
4. Consideration should be given to the height of upstream banks with regard totheir ability to sustain the increased depth caused by the flume installation.
5. Although less head is lost through flumes than over weirs, it should be notedthat significant losses may occur with large installations.
6. The possibility of submergence of the flume due to backwater fromdownstream should also be considered, although the effect of submergenceupon the accuracy of most flumes is much less than is the case with weirs.
2.6.3 ISCO FLOW METER
The Model 2870 and 3230 Flow Meters are a compact, easily transported devices intended tomeasure and record flow rate or level in an open channel. These flow meters are normallyused in conjunction with some type of primary measuring device. This could be a weir, flume,or any other open channel flow situation for which a known relationship exists between leveland flow rate. These two meters measure the liquid level in the primary device using abubbler system, and electronically converts the level into a corresponding flow rate. Flow rateis permanently recorded on an integral strip chart recorder and total flow is continuouslydisplayed on a totalizer. Alternately, liquid level only may be recorded.
2.6.3.1 Instructions for ISCO Flow Rate Measurement Model 2870

Surveys Section SOPDRAFT Ver. #: 1
Date: June 2002Page 40 of 86
(Refer to the ISCO Instruction Manual - Model 2870 for additional operating instructions)
1. Turn the POWER switch off and remove the Primary Device characterizationModule from the flow meter.
2. Select Device No. 1 on the module's DEVICE NO. switch. This corresponds to thedevice cell containing level flow rate information for the primary device being used,a 6-inch Palmer-Bowlus flume. Then, set a value of 5.16 -1 on the moduleSCALING CONSTANT switches. This is the scientific notation of the flow rate(0.516 cubic feet per second) through a 6-inch Palmer-Bowlus flume at a 0.469 ft.head, expressed in the desired volumetric units of cubic feet. The setting establishesthe volumetric units of the system as cubic feet, and also establish a multiplyingfactor of 0.1 (10-1) for the TOTAL FLOW counter and the SAMPLER INITIATIONSIGNAL switch.
3. Reinstall the module in the flow meter.
4. Place the POWER switch in the ON position. For highest accuracy, allow the flowmeter to warm-up for 5 to 10 minutes after being turned on, providing the levelmeasurement system time to stabilize.
5. Place the DISPLAY SELECT switch in the SCALING CONSTANT setting. Asetting of 5.16 -1 should be shown on the display. If desired, the maximum headprogrammed into the module may also be verified by placing the DISPLAY SELECTswitch in the MAXIMUM LEVEL position. A level of 0.469 should be shown onthe display.
6. Adjust the BUBBLE RATE valve to obtain a bubble rate of approximately 1 to 2bubbles per second.
7. Place the DISPLAY SELECT switch in the CALIBRATE RECORDER ZEROposition and confirm (or set) the zero position of the recorder pen.
8. Place the DISPLAY SELECT switch in the RECORDER FULL-SCALE position.
9. Select the desired flow rate span on the RECORDER MODE/SPAN switch. Since itis desired to obtain precise flow rate information from the chart, the AUTOMATICSCALING method of selecting the flow rate span should probably be used. Thismethod results in "even" chart divisions making subsequent reading of the chartmuch easier. The value set on the module's SCALING CONSTANT switches is 5.16-1 (5.16 X 10-1 = 0.516) cubic feet per second. For the AUTOMATIC SCALINGmethod of selecting the flow rate span, the three available RECORDERMODE/SPAN switch settings are:
10. NORMAL = 1.0 CFS
11. EXPAND 1 = 0.50 CFS
12. EXPAND 2 = 0.20 CFS
13. With the DISPLAY SELECT switch in the RECORDER FULL-SCALE position, thefull-scale values associated with the three AUTOMATIC SCALING positions of the

Surveys Section SOPDRAFT Ver. #: 1
Date: June 2002Page 41 of 86
RECORDER MODE/ SPAN switch may be observed on the display as the switch isrotated through the positions. The NORMAL and EXPAND 1 positions of the switchwould assure that the chart cannot go off-scale, since the full-scale spans associatedwith these positions, 1.0 CFS and 0.5 CFS, respectively, are greater than themaximum expected flow rate of 0.38 CFS. However, since it is known that theaverage flow rate for the majority of the day is only 0.15 CFS, a full-scale span of 1.0CFS would result in a chart record for the majority of the day at only 15 percent offull-scale limiting the resolution of the chart record. To increase the resolution of theflow rate record for the majority of the day, one of the two lower full-scale spanscould be selected. In the EXPAND 1 position, the full-scale span of 0.5 CFS wouldassure that the maximum flow rate of 0.38 CFS would remain on-scale, and stillmaintain adequate resolution at the average flow rate of 0.15 CFS. In the EXPAND 2position, the full-scale span of 0.2 CFS would maximize the resolution for theaverage flow rate of 0.15 CFS, and allow the automatic over-ranging feature of theflow meter to record the daily peak flow of 0.38 CFS. In this case, either theEXPAND 1 or EXPAND 2 positions of the switch would be suitable; to illustrate theautomatic over-ranging feature of the flow meter, the EXPAND 2 position will bechosen for this example. Thus, place the RECORDER MODE/SPAN switch in theEXPAND 2 position, establishing the recorder full-scale as 0.2 CFS.
14. Place the CHART SPEED switch in the 1 INCH PER HOUR position.
15. Using the Chart Manual Advance thumb wheel, synchronize the pen position on thechart with the real time of day.
16. Assuming the a moderate amount of sediment will accumulate upstream of the flumeat the level measuring point, select a moderate automatic purge rate by placing thePURGE switch in the 15 MINUTES position.
17. To conserve power, place the PEN OPERATION switch in the NORMAL position.
18. Place the DISPLAY SELECT switch in the LEVEL position to allow the levelcurrently being measured by the flow meter to be shown on the display.
19. Using the LEVEL ADJUST control, adjust the level indicated on the display tomatch the actual level at the measuring point in the flume. Note that with aPalmer-Bowlus flume, the zero reference level is not the invert of the sewer, butrather is the floor of the flume.
20. Since there is no sampler in the system, the SAMPLER INITIATION SIGNALswitch may be left in any position.
21. Depress the TOTAL FLOW counter to reset the counter to zero. The volumetric unitsof cubic feet may be written in the VOLUMETRIC UNITS box to the side of thecounter. The multiplying factor of 0.1 may also be written in the space provided.
2.6.3.2 Instructions for ISCO Flow Rate Measurement Model 3230(Refer to the ISCO Instruction Manual - Model 3230 for additional operating instructions)

Surveys Section SOPDRAFT Ver. #: 1
Date: June 2002Page 42 of 86
The ISCO model 3230 flow meter allows for programming of multiple primary flowdevices without the need of the user to program in specific flow equations or scalingconstants. Programming is very "user friendly" with on-line menus. Programming involves"stepping through" 12 different program steps.
2.6.3.3 Programming Flow Equations With the ISCO Model 3230 Flow Meter
2.6.3.3.1 Weirs
Rectangular weirs without end contractions are linear. Rectangular weirs with endcontractions are not linear.
All rectangular weirs without end contractions have the following flow equation:CFS = 3.330LH1.5WHERE: L = Weir Crest LengthH = Maximum Head
2.6.3.3.2 Example
To calculate the flow equation for a 12 foot crest length rectangular weir without endcontractions, take the flow equation for the 1 foot crest length rectangular weir withoutcontractions, and multiply 3.330 by 12 which equals 39.96. This is the flow equation fora 12 foot rectangular weir without end contractions provided the maximum head is 1foot. The display on the 3230 ISCO flowmeter will look similar to this:
CFS = 1.000 H ^ 2.00 + 001.000 H ^ 2.00
Then punch in 39.96, and then punch in 1.5 for the exponent of the H (maximum head).The part of the equation after the "+" sign is not used for these purposes because it doesnot pertain to weirs and flumes. Since the part of the equation after the "+" sign is notimportant to this use, make this part of the equation equal zero. This is done by settingthe whole integer to zero and setting the power to one. The display should then look likethis:
CFS = 39.96 H ^ 1.5 + 0.000 H ^ 1.00
After this equation is set up, the next program step will be to select the value for themaximum head. Punch in the maximum head and the flow meter will automaticallyadjust the previously entered equation for that given head.
Setting up a flow equation for a rectangular weir with end contractions is a littledifferent. This type of weir is not linear, but it is not difficult to determine. All

Surveys Section SOPDRAFT Ver. #: 1
Date: June 2002Page 43 of 86
rectangular weirs with end contractions have the following flow equation:
CFS = 3.330 (L-0.2H)H1.5WHERE: L = Crest Length of Weir.H = Maximum Head
Once the flow equation is determined, plug in the result and follow the same proceduresas previously mentioned above making sure that the part of the equation after the "+"sign equals zero.
V-notch weirs have different flow equations for each particular type. Once the flowequation is determined for the particular v-notch weir in question, just plug in the resultand follow the same procedures as previously mentioned above, again making sure thatthe part of the equation after the "+" sign equals zero.
2.6.3.3.3 Flumes:
All flumes have different equations for each particular type. The Parshall flume is the most common type of flume you will encounter. Once you determine the flow equationfor the particular flume you are working on, just plug in the result and follow the sameprocedures as previously mentioned above, again making sure that the part of theequation after the "+" sign equals zero.
2.6.3.4 Conclusion:Most of the problems that are experienced will be with "odd" sized rectangular weirs, bothwith and without end contractions. Since the ISCO 3230 flow meter standard programmenu will not allow programming for over a 10 foot weir crest length, the flow equationmust be entered manually in order to set up a weir with a crest length greater than 10 foot.All other "normal" sized primary flow devices (v-notch weirs, Parshall flumes, etc.) shouldbe able to be programmed using the standard program menu.
2.6.4 MAINTENANCE AND CALIBRATION OF ISCO FLOW METER EQUIPMENT
2.6.4.1 GeneralIn order to insure adequate confidence levels in the survey activities, the maintenance of allof the ISCO Flow Meters are of prime importance. A log book has been set up for theseFlow Meters. Maintenance and calibration instructions are contained in the manufacturersupplied manuals.
The following duties always apply to all personnel using the ISCO Flow Meters.1. Use all sign in/out log books. The personnel in charge of the ISCO Flow Meters will

Surveys Section SOPDRAFT Ver. #: 1
Date: June 2002Page 44 of 86
have the responsibility to make sure that you do. Relate verbally any equipmentproblems you might have had to the person in charge of that equipment and notatethis problem in the log.
2. Check desiccant for dryness. Do not forget their intakes; change if necessary; checkbubbler rod and line to make sure they are clear; check pen and paper.
3. Check all bubbler rods; make sure they are clear and free of cracks.
2.6.4.2 Calibration of Isco Flow MetersThe calibrations of the ISCO flow meters are performed in the field and in the laboratory.Surveys section staff can check the calibration in the field by timing with a stop watch thetotalizer counter which is measured in gallons per second. Also, the electronic readings canbe checked for accuracy by comparing the readings to a discharge table. When adiscrepancy occurs, the flow meter is then set-up in the laboratory and run under controlledconditions.
The method of calibration in the laboratory is to set the flow meter in a constant amount ofwater with the meter set for a certain primary device. The meter is allowed to run for 24hours and then the totalizer is compared to the discharge table for the level and primarydevice programmed into the meter. If the percent difference is greater than one or twopercent the flow meter is sent back to the manufacturer.
2.6.5 MEASURING STREAM FLOW USING CURRENT VELOCITY METERS
Personnel of the Office of Water Quality also measure stream flow using four types of currentmeters. These are the Price AA, and the Marsh-McBirney Models 201, 201D, and 2000meters. The proper way to measure flow in a stream and the operation of each of these metersis discussed below. Please consult the appropriate flow meter manuals for an in depthdiscussion of meter operation.
2.6.5.1 Price Current Velocity MeterThis instrument consists of a cup-type bucket wheel which rotates in flowing water and adevice for determining the number of revolutions. As the bucket wheel rotates, an electricalcontact is closed on either a single-contact cam or a penta gear. If a headset or counter isattached along with a battery series, a signal is produced each time the bucket wheelcompletes a revolution. If the headset is connected to the penta-contact post, a signal isproduced once every five revolutions. The penta-contact is very useful in fast water.
The velocity at the point of the current meter is measured by counting the number ofsignals (revolutions) in a specified time interval. Thus, a standard piece of equipmentaccompanying the use of a current meter is a stopwatch. Each meter is calibrated by thesupplier and an equation for the relationship between velocity and revolutions per unit time

Surveys Section SOPDRAFT Ver. #: 1
Date: June 2002Page 45 of 86
derived. For most Price meters, the meter is supplied with a rating table, which shows thevelocity for a given number of revolutions in a given time interval. Forty seconds is thesmallest time interval listed on the rating table. This time interval is required to obtain atime-average velocity at the point. The user would be well advised to memorize the "stopcounts" in the columns of the rating table as stopping the count in some intermediatenumber of revolutions (27, for example) negates the use of the table and requires the use ofan equation to calculate the velocity.
In order to ensure consistent accuracy with a current meter, good preventive maintenance isa must. For all vane-type meters such as the Price, a most important maintenance item isthe protection of the pivot and the pivot bearing. The pivot assembly provides alow-friction surface on which the bucket wheel is supported. If the pivot becomes blunted,or the pivot bearing damaged, the resistance increases and the meter will give low velocityreadings. The greatest potential for damage occurs when a meter is transported with thepivot bearing and pivot in contact. On the Price meters, a raising nut is provided. Whenscrewed down, the raising nut lifts the pivot bearing off the pivot and prevents contact.Whenever a Price meter is transported, if only across the river, the raising nut should bescrewed down. This pivot may be replaced by the operational pivot by loosening the setscrew at the front of the yoke and slipping one pivot out and the other in. Do not attempt tomeasure velocities with the travelling pivot in. Likewise, don't transport one of thesemeters with the operational pivot in.
Prior to and immediately following each use, the components of the meter should becleaned and lubricated. A light, water-resistant oil should be used for a lubricant. Key oilfor clarinets has been found to be a good, cheap lubricant. Oil should be applied to thepivot and pivot bearing, the penta gear and penta gear bushings, and the bearing lug. Ifmeasurements are made in silty or turbid water, the meter should be oiled frequently duringits use.
The condition of the bearings should be checked prior to each use by a "spin test". With theshaft in a vertical position and cups protected from wind currents, the cups are given aquick spin. If the meter is in good condition, the cups should not stop spinning for at leastthree minutes. If the duration of spin is more than 1 minute, the meter may be used for allbut very low velocities (less than one foot per second). A spin of less than one minuteindicates that the instrument should be reconditioned.
For fairly deep or fast water, the Price type meter is usually the most practical instrument.For depths of less than about 0.5 feet (15 cm) the Marsh McBirney meter is moreappropriate.
Current meters are suspended by a sounding system which allows concurrent measurementof depth and velocity. For shallow, wadeable rivers, the most convenient system is atop-setting wading rod. The top-set rod has a main column, 1/2 inch, hexagonal stock

Surveys Section SOPDRAFT Ver. #: 1
Date: June 2002Page 46 of 86
which is graduated in 0.1 foot increments for measuring the depth. Interval markingsfollow the convention of a single mark every 0.1 foot, a double mark for each 0.5 footincrement, and a triple mark at each whole foot increment.
For most suspension systems, the 0.2, 0.6, and 0.8 depths must be calculated from the totaldepth as determined by sounding, i.e., the meter (or sensor) will be positioned on thewading rod (or other suspension) at either 0.2, 0.6, or 0.8 of the depth as measured from thesurface. However, the top-set wading rod has a feature which allows the current meter orsensor to automatically be set at the 0.6 level. The depth of the vertical is read on thehexagonal sounding rod. Then the meter or sensor is placed in the 0.6 depth positionappropriate for the measured depth by the meter positioning rod. Example: if the depth is1.4 feet, the "1" mark of the meter positioning rod is set even with the "4" mark on the gripof the wading rod. To move the meter positioning rod, the brake must be released bypushing the brake in toward the grip with the thumb. When releasing the brake, hold on tothe positioning rod so that the meter does not slam into the ground. When the positioningrod is in this position, the meter will be suspended exactly 0.84 feet below the surface,which is 0.6 times 1.4, the depth of the vertical.
2.6.5.2 Marsh-McBirney Model 201, 201D, and 2000 Current MetersThese meters consist of a sensor probe with attached cables and an electronic processorwith a panel meter readout. The probe consists of an electromagnet inside a molded plastichousing with a pair of electrodes spaced 180° apart on the sensor surface. Water flowingaround the sensor probe interacts with the electromagnetic field to produce a small voltagein the water near the probe which is sensed by the electrodes. This extremely small voltageis amplified, demodulated, filtered, and displayed on the panel meter.
2.6.5.2.1 Operation
1. Open carrying case and set selector switch to the CAL position. The metershould read in the calibration sector of the meter scale on model 201 meters.On the model 201D meters the digital readout should fall between 9.8-10.2.This indicates the batteries are good and the instrument is operating properly. Ifthe meter needle does not come within the CAL range, replace the batteries andcheck CAL again. If the meter fails to attain the CAL position, then it shouldbe sent in for servicing by the manufacturer.
2. Place the rubber current probe on either a wading rod or cable suspension unit.Set selector switch to the 2.5, 5.0 or 10.0 range (represents foot per secondgradation up to that level) for velocity conditions present. Remember to wait atleast 20 seconds after positioning the probe before reading the panel meter.
3. Read the panel meter directly. This reading is in feet per second.

Surveys Section SOPDRAFT Ver. #: 1
Date: June 2002Page 47 of 86
2.6.5.2.2 Maintenance and Calibration
The Marsh-McBirney Meter is maintained by simply cleaning the sensor with mild soapand water to keep the carbon electrodes free of non-conductive grease or oils. Thecalibration of the Marsh-McBirney Meter is to check the electronic readings incalibration mode and if the meter readings do not calibrate on the calibration setting themeter is sent in for repair. In order to check the accuracy of the velocity readings of themeter, OWM personnel check measured stream velocities against each meter in thesame stream and location. Also the other current meters are checked in this samemanner. When a meter comes back from the manufacturer, a certificate of calibrationaccompanies the meter. This newly calibrated meter is then used to compare velocityreadings with other meters.
2.6.5.3 Measuring Flow From a Bridge with a USGS Type-A CraneFlow measurements from bridges are made by the Surveys section when wading the streamto obtain flow data is not possible. A USGS Type-A Crane with a three-wheel baseequipped with a Model #3100, A-55 reel with an 80 foot, 0.100" diameter cable is used. APrice AA meter is mounted on the end of the cable. A 15 lb. or 50 lb. C type weight,depending on the velocity of the current, is used with the meter in order to hold it asvertical as possible. A battery, headphone and stopwatch are used to monitor therevolutions of the meter.
To determine points of measurement from a bridge, the same criteria as those used whenwading are applied.
3.6.5.3.1 Procedures:
1. Inspect bridge; excessive debris in the channel will lessen accuracy ofmeasurement.
2. Clear path for crane.
3. Measure and mark bridge (usually on railing) where vertical measurements willbe made.
4. Assemble crane and attach meter, weight, headphone and battery. Make spintest. When attaching meter and weight, see procedure #6 to help determinedistance between the two.
5. Begin measurement by leaning crane against bridge railing at first vertical.
6. Zero the counter (computing depth indicator) on reel. This is accomplished bylowering the AA meter until the horizontal tailpiece touches the water. Thenpull out on small crank handle on the counter and adjust to "0" starting point.Push in handle to set.
7. Continue to lower the meter until the C type weight touches bottom. The value

Surveys Section SOPDRAFT Ver. #: 1
Date: June 2002Page 48 of 86
on the reel counter is the actual depth not counting the distance between thebottom of the C-weight and the mid-point (horizontal tailpiece) of the meter.The hanger bar on which the C-weight and AA meter are suspended hasvarious holes in order to adjust the distance between the two, depending on thesize of the weight. The distance between the weight and mid-point must betaken into account when calculating the actual measuring depths along theverticals. Since a depth of 1.25' is the minimum depth recommended for areading with the AA meter, then a distance of at least .50' is needed betweenthe bottom of the weight and the mid-point of the meter in this case in order toaccomplish a velocity measurement at .6 of the 1.25' depth.
8. At depths greater than 2.5', the two point method is used the same as whenwading. In order to set the .8 measurement easily the reel counter gage has aspiral scale which reads .8 of the depth registered directly on the scale aroundthe outside edge.
9. Example: If 3.0' is measured as the vertical depth (including the distancebetween the weight and the AA meter), then raise the AA meter from thestream bed until 3.0' is shown on the spiral scale. The AA meter will then besuspended at .8 of 3.0' depth or 2.4' on the outside scale.
10. Proceed across the bridge making all necessary measurements. Make the totalcalculation in the same manner as when wading. Make notes of all obstructionsand anomalies which might affect the total flow. When counting clicks fromthe headphone, count the first one as "0", i.e., 0, 1, 2, 3 etc. Initiate the stopwatch on the first count.
2.6.5.3.2 Problems Affecting Flow Measurement From Bridges
One of the most common problems to be resolved when measuring flow from bridges isdirection of flow. If the direction of the flow is not perpendicular to the cross section, acorrection must be made. The most convenient method is to use "USGS Form 9-275,Field Note Sheet". Around the outer margins are printed the cosine values of thepossible angles of flow. By aligning the point of origin "0" on the left side of the FieldSheet with the edge of the bridge rail and turning the sheet until the right edge alignswith the direction of flow, the cosine of the angle of flow can be read. The cosine is thenmultiplied times the measured velocity for the correct speed.
2.6.5.4 Measuring Stream Flow
2.6.5.4.1 General
In-stream flow measurements are taken by the Surveys Section in wadeable streamswhere there are no USGS stream-gaging stations. This method of measurement requiresthe stream to be divided into at least 20 sections with equal amounts of flow andvolume. The average velocity and area is then measured for each section. The product of

Surveys Section SOPDRAFT Ver. #: 1
Date: June 2002Page 49 of 86
each sections width, depth, and velocity is the "flow" for the section, which is measuredin feet per second (fps). The sum of flow for all the sections of a stream is equal to theflow of the stream in cubic feet per second (cfs).
Figure 2.2 Stylized Cross Section of Stream Demonstrating Flow Measurement
2.6.5.4.2 Selecting the Best Cross-Section of a Stream for In-stream FlowMeasurement
1. Examine the stream reach for cross sections and select the one that is most suitablebased on the following:
(i) The stream channel is straight and the cross section is perpendicular to thedirection of flow.
(ii) The stream bed and banks are as uniform as possible.
(iii) The minimum velocity is greater than 0.5 fps.
(iv) The stream is safely wadeable.
2. After selecting the best cross section, stretch a tape measure across the stream, withthe tape measure at right angles (perpendicular) to the direction of the current andsecure the tape. Determine the proper widths of the sections to be measured byobserving the total width of the stream and making sure you take at least 20-25sections to be measured. No one section is to make up more than 5% (10% in verysmall streams) of the total flow of the stream, so be sure to shorten the section widthif there is more flow in a particular area of the stream.
3. The number of vertical cross-sections varies with depth and width of the stream. Nofixed rules can be made for number of vertical, other than they should be spaced soas to disclose the real shape of the stream bed and the true mean velocity. Thisusually means one (1) foot or smaller spacing increments on smaller streams and

Surveys Section SOPDRAFT Ver. #: 1
Date: June 2002Page 50 of 86
two (2) foot spacing on larger, uniform streams. Note: Uneven spacing of verticalsmay be necessary when the stream bed is irregular.
4. Establish the initial point (IP) from which you will begin to measure sections offlow. This IP should be one half the predetermined section width from the streambank.
2.6.5.4.3 General Operation of Current Velocity Meter with Top Setting Rod
1. Turn the meter on and set it to read in "feet per second".
2. With flow rod facing the tape measure (upstream), stand 1-3 inches downstreamfrom the tape and 18 inches or more from meter rod.
3. Keep flow rod vertical and meter parallel to the direction of flow.
4. Read the depth of the cross section by viewing the flow rod from side, then adjustthe depth of the meter to the appropriate depth (read to half-tenths if possible). Thedepth can be measured with the depth gage rod. Each single mark represents 0.10of a foot, each double mark represents 0.50 of a foot, and each triple markrepresents 1.00 foot.
5. After meter is in place, allow a few moments for it to become stable in the currentbefore the velocity measurement is recorded. Allow extra time for velocities lessthan one foot per second.
6. If the depth of the vertical is less than 1.5 feet, measure the velocity at 0.6 (60%) ofthe depth. To set up the sensor at 0.6 of the depth, line up the foot scale on thesliding rod with the tenth scale on the top of the depth gauge rod. If, for example,the total depth is 1.3 feet, line up the 1 on the foot scale with the 3 on the tenthscale. If the depth of the vertical is 1.5 feet or greater, use the two-point method.Measure the velocity at 0.2 (20%) and 0.8 (80%) of the depth and average thereadings. To set the sensor at 0.2 depth, multiply water depth by 2 and set this valueas describe above. To set the sensor at 0.8 depth, divide the depth by 2 and set thisvalue as described above.
2.7 MEASUREMENT OF TIME-OF-TRAVEL (T.O.T.)
2.7.1 INTRODUCTION
Time-of-travel can be defined as the calculation of the average velocity of a flowingwaterbody over a given reach or distance of its length.
The Surveys section conducts time-of-travel (T.O.T.) measurements primarily in order toprovide data to the Office of Water Quality Modeling Section for wasteload allocationcalculations that are ultimately the basis of the NPDES permits. When the streams that arebeing modeled vary widely in topography so as to affect the flow with pools and riffles, itbecomes especially beneficial to supplement the hydrologic and geometric data with T.O.T.data using dye tracer techniques.

Surveys Section SOPDRAFT Ver. #: 1
Date: June 2002Page 51 of 86
Rhodamine WT (20%) is injected as the tracer. Measurements based on time are made using afluorometer to identify concentrations at various points along the studied stream reach.
2.7.2 T.O.T. MEASUREMENT PROCEDURES
In preparing and executing a T.O.T. measurement, the steps below should be followed:
1. Obtain maps and facility information of the area under study. Perform a reconnaissance anddetermine "when, where, how" and how much dye will be injected. "When, where, andhow" will be determined by the resources available in terms of manpower, equipment, andthe physical size of the waterbody segment under study. "How much" dye to be used iscalculated from the "Computation For Time-of-Travel Worksheet." Sometimes more thanone injection site may be used. This is done in order to save time when stream velocitiesare quite slow. Great care must be taken in this case, though, in order to avoid confusion inoverlapping the dye clouds. For purposes of modeling, the water body flow should notexceed 10X the Q7-10 at the time of the T.O.T study.
2. Determine the sites where waterbody sampling will be done and whether it will be manualor by automatic sampler in order to track the dye. The waterbody stream reach must bephysically inspected as much as possible for dams, water intakes, outfalls, pools, riffles, i.e.anything which could affect flow so that allowances can be made. How often samples willbe collected should be determined at this point in your planning. Usually 20 to 30 samplesare taken to define the time-concentration curve at each sampling location. Usually 3 to 4sites are used downstream for sampling over a distance of approximately 5 miles.Performpreliminary flow measurements. This must be accomplished just prior to the T.O.T study inorder to calculate the dye required and to estimate the T.O.T. to aid in sampling see the"Time-of-Travel Approximation" in Table 6 below. Markers can be set at this time to helpmonitor the stage of flow. This can be accomplished with something as simple as woodenstakes with increments. The study should be done at a steady state period.
3. Initiate study. Dye should be injected as a slug at the outfall point. This should be done asrapidly as possible since this represents a dye "peak" at this point. Automatic samplers orpersonnel should be in place down stream in order to start sampling at the estimated timesnecessary to capture the leading edge and peak of the dye cloud. It is also desirable tocapture the trailing edge, though sometimes not practical. It is common practice to definethe trailing edge as the time when the dye concentration drops to 10% of the peak value.Samples should be collected every 15 minutes until the dye arrives. Then sample at 10% ofthe travel time. Example: If the dye takes 30 minutes to arrive, then sample at 3 to 5minute intervals.

Surveys Section SOPDRAFT Ver. #: 1
Date: June 2002Page 52 of 86
Table 2.6 Time-of-Travel Approximation
Stream MilesVelocityFeet/Sec.
1HRS MIN
2HRS MIN
3HRS MIN
4HRS MIN
5HRS MIN
6HRS MIN
0.1 14 42 29 24 44 06 58 48 73 30 88 120.2 7 21 14 42 22 03 29 24 36 45 44 060.3 4 54 9 48 14 40 19 36 24 30 29 240.4 3 40 7 21 11 01 14 42 18 22 22 020.5 2 56 5 52 8 48 11 44 14 40 17 360.6 2 27 4 54 7 21 9 48 12 15 14 420.7 2 06 4 12 6 18 8 24 10 30 12 360.8 1 50 3 40 5 30 7 20 9 10 11 000.9 1 38 3 16 4 34 6 32 7 50 9 081.0 1 28 2 56 4 24 5 52 7 20 8 48
4. Collect and read dye samples with a fluorometer. The Surveys section uses a Turner Model10 fluorometer for this purpose. The operator of this fluorometer should be familiar withthe operating and service manual of this instrument. See the Table 7, "FluorometerSettings", below. Ideally the samples should be read using the fluorometer in the field andagain in the lab after the sampling is finished. Remember that temperature will affect thereadings. Avoid letting the samples warm in the sun or in the fluorometer. Samples for dyeshould be collected from just a few inches under the water surface at the centroid of theflow. Consistency in sample collection location is required. Clean glass cuvettes with capsare used for sample collection. Label each cuvette. Blanks made with DI water should beused to standardize the fluorometer, along with dye standards, which are prepared as serialdilutions (2, 4, 10, 20 ppb, etc). The collector should be sure to collect a background watersample prior to the arrival of the dye. The Form "TIME-OF-TRAVEL FIELD SHEET",Figure 3, should be used to log sampling information at each site. The data can bepresented directly as is on the form or it may be reduced further.
5. Equipment and supplies: fluorometer, power supply (auto battery), gloves, dye, measuringcontainer, waders, and cuvettes.

Surveys Section SOPDRAFT Ver. #: 1
Date: June 2002Page 53 of 86
Table 2.7 Fluorometer SettingsMin. Sensitivity Top Scale 0-10 ppbx3.16 Bottom Scale 0-3 ppbx10 Top Scale 0-1 ppb
100x
x31.6 Bottom Scale 0-0.316 ppbx31.6 Bottom Scale 0-31.6 ppbx10 Top Scale 0-100 ppbx3.16 Bottom Scale 0-316 ppb
1x
Min. Sensitivity Top Scale 0-1000 ppb
2.7.2.1 Preparation of Standards for FluorometerThe stock dye solution is 20% product which translates to 200,000 parts per million (ppm).Serial dilutions must be made in order to calibrate the instrument for field use. All dilutionsare to be made using de-ionized water.
Dilution #1-- 1 mL stock dye solution to 1000 mL DI water=200 ppm.
Dilution #2-- 1 mL of 200 ppm solution to 1000 mL = 200 ppb.
Using the 200 ppb stock solution, standards are prepared for ranges of 2, 4, 10, and 20 ppb.
Dilution #3--1 mL of stock to 100 mL water = 2 ppb
Dilution #4--2 mL of stock to 100 mL water = 4 ppb
Dilution #5--5 mL of stock to 100 mL water = 10 ppb
Dilution #6--10 mL of stock to 100 mL water = 20 ppb
Partially fill the volumetric flask with de-ionized water. Add the designated dose of dyestock and then finish filling the flask to the required amount. Mix thoroughly.
Use the volumetric pipets when possible, especially with the lower dose quantities. Pipetsof most size ranges should be located in the standards tray in the Surveys sectionlaboratory.

Surveys Section SOPDRAFT Ver. #: 1
Date: June 2002Page 54 of 86
Figure 2.3 Example of Time of Travel Worksheet
Computations For Time of Travel Worksheet
Stream__________________________________ Reach____________________________
L = distance, in miles. from drop to most downstream pickup Point______________________. Q = maximum discharge in reach, in cubic feet per second _____________________. V = estimated average velocity of flow in reach in feet per second _____________________. Cp = peak concentration desired at most downstream pickup points in Parts per billion___________________.
Vd = volume of Rhod. Wt 20% dye solution, in liters, needed for drop. (equation to solve Vd is below. 0.000227 is the known factor of Rhod.) Computation for Amount of Dye 0.000227 x________(L) x________(Q) x________(Cp) Vd = ____________________________________________________________ X________(V) Vd = ________________ liters Time of Drop Dropped_________ liters at________________________________________(Location)
At_________ (Time) on ______________________________(Date) Estimated Time of Pickup Leading edge ETA_____________________________ at_____________________(location)Peak ETA_____________________________ at_____________________(location) Leading edge ETA_____________________________ at_____________________(location)Peak ETA_____________________________ at_____________________(location)

Surveys Section SOPDRAFT Ver. #: 1
Date: June 2002Page 55 of 86
Figure 2.4 Time of Travel Field SheetTIME-OF-TRAVEL FIELD SHEET
INDIANA DEPARTMENT OF ENVIRONMENTAL MANAGEMENTTime-of-Travel Study on ___________________________________________________Sampling Section _________________________________________________________Dye Injected at _________________________ Time ____________ Date___________Amount Injected _______________ Type of Dye ___________ Conc. In % _________Sampling Section Discharge ____________ cfs Width ________ Mean Depth _______
BottleNo.
SamplePoint
SampleTime Fluorometer Readings (ppb) Bottle
No.SampleTime Fluorometer Readings (ppb)
M.S. x3.16 x10 x31.6 M.S. x3.16 x10 x31.61x 1x 1x 1x 1x 1x 1x 1x(Circle Range)100x 100x 100x 100x
(Circle Range)100x 100x 100x 100x
Column: 1 - 1 - Number on Sample Bottle.
2 - When more than one point in section is sampled, indicate as "A", "B", "C", etc., from left toright bank.
3 - Actual military time.
4 - Fluorometer dial reading on scales used.
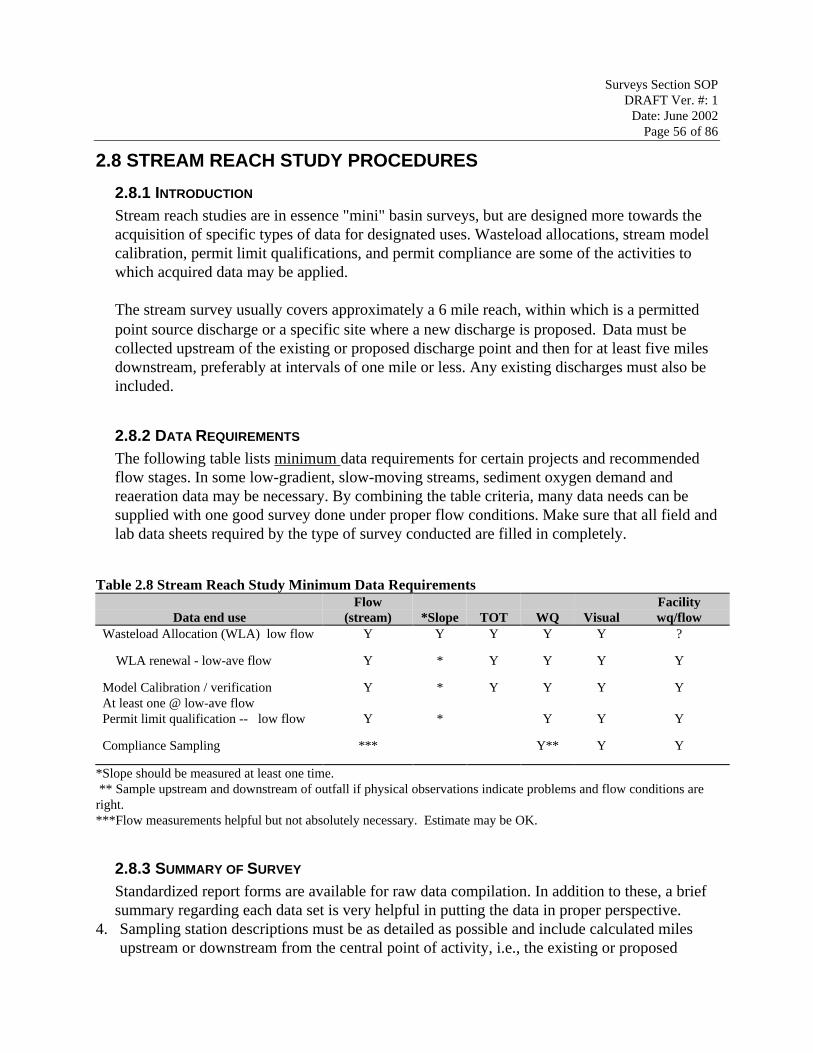
Surveys Section SOPDRAFT Ver. #: 1
Date: June 2002Page 56 of 86
2.8 STREAM REACH STUDY PROCEDURES
2.8.1 INTRODUCTION
Stream reach studies are in essence "mini" basin surveys, but are designed more towards theacquisition of specific types of data for designated uses. Wasteload allocations, stream modelcalibration, permit limit qualifications, and permit compliance are some of the activities towhich acquired data may be applied.
The stream survey usually covers approximately a 6 mile reach, within which is a permittedpoint source discharge or a specific site where a new discharge is proposed. Data must becollected upstream of the existing or proposed discharge point and then for at least five milesdownstream, preferably at intervals of one mile or less. Any existing discharges must also beincluded.
2.8.2 DATA REQUIREMENTS
The following table lists minimum data requirements for certain projects and recommendedflow stages. In some low-gradient, slow-moving streams, sediment oxygen demand andreaeration data may be necessary. By combining the table criteria, many data needs can besupplied with one good survey done under proper flow conditions. Make sure that all field andlab data sheets required by the type of survey conducted are filled in completely.
Table 2.8 Stream Reach Study Minimum Data Requirements
Data end useFlow
(stream) *Slope TOT WQ VisualFacilitywq/flow
Wasteload Allocation (WLA) low flow Y Y Y Y Y ?
WLA renewal - low-ave flow Y * Y Y Y Y
Model Calibration / verificationAt least one @ low-ave flow
Y * Y Y Y Y
Permit limit qualification -- low flow Y * Y Y Y
Compliance Sampling *** Y** Y Y
*Slope should be measured at least one time. ** Sample upstream and downstream of outfall if physical observations indicate problems and flow conditions areright.***Flow measurements helpful but not absolutely necessary. Estimate may be OK.
2.8.3 SUMMARY OF SURVEY
Standardized report forms are available for raw data compilation. In addition to these, a briefsummary regarding each data set is very helpful in putting the data in proper perspective.
4. Sampling station descriptions must be as detailed as possible and include calculated milesupstream or downstream from the central point of activity, i.e., the existing or proposed

Surveys Section SOPDRAFT Ver. #: 1
Date: June 2002Page 57 of 86
discharge point. Latitude and longitude are necessary for entry into data base. Provide mapof area with all sites of interest plainly discernible.
5. Flow measurements should be discussed in relation to the estimated Q7-10 which is ofparticular significance to stream modeling. Cross sections and velocities are listed on theindividual flow sheets but should be averaged at the bottom. Further evaluation of flow datafrom each site can be made by the user if necessary.
6. Provide physical descriptions of each site and the stream in general. General topography cansometimes be determined by slope and time of travel comparisons in conjunction with theactual observations made at each sample site. For example, very slow time of travel in an areaof fairly high gradient would indicate the long pool-riffle-pool genre of stream. Mention landuse and geography of reach under study.
7. Briefly discuss field data and laboratory data in relation to water quality standards. If afacility was sampled, compare data with permit limits.
8. Document anything else that is thought to be pertinent; such as riparian activities which maythreaten stream quality, i. e., livestock in stream, bank erosion, etc.
2.9 MEASUREMENT OF SEDIMENT (BENTHIC) OXYGEN DEMAND
2.9.1 GENERAL
Benthic oxygen demand may be broadly defined as the oxygen consumed from the overlayingwater by the biochemical oxygen demands of the assemblage of micro- and macro-organismsassociated with bottom sediments and substrates. Inorganic chemical oxidation reactions alsocontribute to the demand but are usually minor when compared with the biological demands.The on-site measurements of benthic oxygen demand are made by using a chamberrespirometer, with a means of internally circulating the water. This chamber is then sunk apredetermined depth into the bottom sediments. The operation consists essentially ofcontaining a known volume of water over a given bottom area with a chamber and measuringthe dissolved oxygen drop with a galvanic oxygen probe implanted in the chamber.
2.9.2 SAMPLING METHODOLOGIES AND PROCEDURES
The procedures for setting up and operating the benthic oxygen demand respirometer arerelatively simple:
9. After the galvanic dissolved oxygen probe and meter have been calibrated the DO probewith stirrer is secured inside the respirometer. See Section in this manual titled"Measurement of Dissolved Oxygen" for a discussion on methods for measuring dissolvedoxygen.
10. The electrical cables are taped to the inside and outside of the respirometer so that the sharpsides of the respirometer do not cut loose cables. Attach the DO probe and stirrer cables tothe meter and the respirometer is now ready to use.
11. Determine the consistency of the bottom deposits. If the bottom is not clearly visible, a Ponardredge sample should be taken and examined. If the sediments are mucky and watery,

Surveys Section SOPDRAFT Ver. #: 1
Date: June 2002Page 58 of 86
extension flanges may be added to prevent sinking of the unit beyond the desired depth.Rocky or compacted bottoms may not allow the respirometer to sink in far enough to sealitself. A successful run is made when the respirometer does not allow water to flow in or outof the chamber, and there is a continual dissolved oxygen drop.
12. When a site looks favorable, the respirometer is inverted underwater so that all air isexpelled. Flip the respirometer right side up (underwater) and check the cables once more forsecure attachments. Turn on the stirrer and probe switches and follow the procedure of thedissolved oxygen meter to check operation.
13. Note the surface DO and lower the respirometer to just above the bottom and note the DOthere.
14. Seat the respirometer and allow the DO to stabilize before recording the dissolved oxygen. This stabilization usually takes two to five minutes. A bad seal will be noticeable if within 15to 30 minutes there is not a DO drop, or there is a DO increase along with a surface DOincrease.
15. Dissolved oxygen concentrations are recorded manually either at 5 to 10 minute intervals ornoting the time when the DO changes every 0.1 ppm. A DO recorder should also be used toobtain a permanent record.
16. Readings should continue until the dissolved oxygen drop rate is the same or levels off butshould not continue over two hours. It can then be assumed that the DO will be used at thisrate until it is completely consumed.
17. All readings are placed on the appropriate form, the points plotted on the graph, and the ratecalculated.
18. A Winkler DO titration is taken at the bottom and at the surface. The respirometer is pulledfrom the bottom and DO readings taken at the bottom and surface and compared to theWinkler titration's to check accuracy of the probe. In some instances where a stream does notflow sufficiently to flush out the respirometer when it is lifted from the bottom, it may benecessary to pull the respirometer to the surface and flush it out before lowering it again tothe bottom.
19. The respirometer is cleaned of any mud or sediment and the DO meter turned off. The probeis detached from the stirrer and the membrane inspected for bubbles or leaks. Place theprotective cover on the DO probe.
2.10 FIELD DATA COLLECTION PROCEDURES
2.10.1 TURBIDITY
The Surveys section currently has the capability of analyzing turbidity either by a Hydrolabmultiprobe, or a separate portable turbidimeter. The instructions for operating a Hydrolabmultiprobe are discussed later in this document. The operation of a Hach turbidimeter isdiscussed below.
2.10.1.1 Instructions for Use of Hach Portable Turbidimeter Model 2100P

Surveys Section SOPDRAFT Ver. #: 1
Date: June 2002Page 59 of 86
The Hach Portable Turbidimeter allows for real time reading of turbidity in NephelometricTurbidity Units (NTU).
2.10.1.1.1 Turbidimeter Operation
1. Collect a well mixed and representative sample into a sample vial and fill tothe line.
2. Wipe the cell with a soft, lint free cloth to remove water spots and fingerprints.Apply a thin film of silicon oil on outside of vial, if necessary.
3. Press: I/O. The instrument will turn on. Place the instrument on a flat, sturdysurface. Do not hold the instrument while making measurements.
4. Put the sample cell in the instrument cell compartment so the diamond ororientation mark aligns with the raised orientation mark in front of the cellcompartment. Close the cover.
5. Press: Read. The display will show "----NTU" then the turbidity in NTU. Record the turbidity after the lamp symbol turns off.
2.10.1.1.2 Turbidimeter Calibration Checks
Before each sampling route or event, the turbidimeter should be checked against a GelexSecondary Standard. These standards can be found inside each carrying case and areonly valid with that particular unit. All calibration checks should be recorded on the logsheet. Choose a Gelex Standard vial that will closely resemble the actual sample valuei.e., if the water is relatively clear choose the 0-10 NTU vial. Be sure the Gelexstandard vial is aligned correctly when inserting them into the unit (diamond aligns withorientation mark). If the reading is not within 5% of the previously established value(the value in pencil in the white diamond area), make note of the difference on the fieldsheet and the log sheet and inform the personnel in charge of turbidimeters of thediscrepancy.
2.10.2 PHThe Surveys section currently has the capability of analyzing pH either by a Hydrolabmultiprobe, or a separate portable pH meter. The instructions for operating a Hydrolabmultiprobe are discussed later in this document. The operation of two different type of pHmeters are discussed below.
All permanent staff members are responsible for maintaining and calibrating individuallyassigned pH meters. A pH METER LOG must be kept with the pH meter at all times. Theselogs should be folded and kept in zip locked bags inside the pH meter case. A copy of the pHmeter operating instructions should also be kept in a zip locked bag inside the meter case. ThepH meter should be calibrated before every sampling period (route) using a 7.00 StandardUnits (su) buffer and 10.00 su slope buffer solution. Buffers should be replaced at least

Surveys Section SOPDRAFT Ver. #: 1
Date: June 2002Page 60 of 86
weekly and should be replaced more often in heavy use periods. All calibration dates andbuffer replacements should be recorded in the log. If the log is full, consult the personnel whois responsible for the pH meter maintenance for a new blank log and to file the old log sheet.
2.10.2.1 Calibration of Cole-Parmer Model 5985-80 Digi-Sense pH Meter
2.10.2.1.1 General
When calibrating field pH meters, it is best to use a slope buffer that will closelyresemble the pH of the waters that you are sampling. For Indiana surface waters a slopebuffer of 10.00 su should be used (Indiana surface waters tend to be more alkaline).With this in mind, each pH meter case should contain pH buffer 7.00 and 10.00 su. Arinse bottle full of distilled water should be used in place of the pH buffer 4.00. Thisrinse water should be replaced every time the buffers are replaced. When using the(ATC) probe, the meter automatically compensates for changes in buffer temperature.When not using the ATC probe, make sure that the temperature is set manually toreflect the temperature of the solution by using a separate thermometer. To do this, pushthe RANGE button until the degree Celsius symbol is displayed. Set the temperaturefrom the thermometer by using the arrow keys.
1. Connect the pH electrode and the ATC probe (if ATC probe is used).
2. Take plastic tip off of pH sensor end. Inspect bulb to make sure it is clean. Ifthe bulb has dried out, it will have to be rehydrated before calibration.Rehydrate the bulb by immersing in tap water for 30 minutes.
3. Place the electrode in a pH 7.00 buffer solution along with the ATC (orthermometer). Wait approximately 30 seconds for the sensors to stabilize andwrite down reading under "Meter Rd." column, and the press CAL.
4. If the electrode recognizes the pH 7.00 solution, the exact value will appear onthe display in accordance with the pH and temperature charts. If not, thesymbol "E4" will be displayed-see "error code guide" in the pH manual.
5. Wait 30 seconds and then push CON again to accept the buffer.
6. The first calibration is now finished. "E5" will appear on the display at thispoint, indicating that the instrument has entered the slope calibration mode.
7. Take the electrode and ATC (or thermometer) out of the 7.00 buffer, and rinse(dip) them with distilled water and dip it into the slope buffer (most likely10.00). "E5" will disappear when the electrode is placed in the slope buffer,and the value of the buffer will then appear on the display. Wait 30 seconds forthe sensors to stabilize and write down the reading under the "Meter Rd."column, and press CON. The pH meter is now calibrated.
8. Rinse electrode with distilled water and place black plastic tip with KCl(Potassium Chloride) solution back onto sensor end.

Surveys Section SOPDRAFT Ver. #: 1
Date: June 2002Page 61 of 86
2.10.2.1.2 Operation
1. Connect the pH electrode and the ATC probe (if ATC probe is used).
2. Take plastic tip off of pH sensor end. Inspect bulb to make sure it is clean.
3. Push the ON/OFF button to turn unit on.
4. Then push Range until the display indicates the desired mode. The unit shouldalready be in the pH mode when it is turned on. For the temperaturemeasurement press the RANGE key until the degrees Celsius symbol appears.Press the RANGE key again to get millivolts displayed as "mv". Thisparameter is not recorded so ignore this. Press the Range key again to displaythe pH mode.
5. Rinse electrode with distilled water and place black plastic tip with KClsolution back onto sensor end.
Note: When using the instrument, press the keys firmly and hold for a half second.Please consult the operating manual for further operating instructions.
2.10.2.1.3 Additional Notes
1. Disconnect pH sensor cable and the ATC cable from unit before closing pHmeter case. This will prevent damage to the senior cables.
2. Always keep sensor bulb moist with black storage tip. If KCl storage solutionis not available, use tap water or pH 4.0 buffer. Do not use Distilled water.
3. If readings start to drift and never really stabilize, it might be time for a newelectrode. Please instruct the personnel in charge of pH meter maintenance.
2.10.2.2 Calibration of Hach Model EC20 pH MeterWhen calibrating field pH meters, it is best to use a slope buffer that will closely resemblethe pH of the waters that you are sampling. For Indiana surface waters a slope buffer of10.00 su should be used (Indiana surface waters tend to be more alkaline). With this inmind, each pH meter case should contain pH buffer 7.00 and 10.00 su. A rinse bottle full ofdistilled water should be used in place of the pH buffer 4.00. This rinse water should bereplaced every time the buffers are replaced.
1. Connect the pH electrode to the meter.
2. Take plastic tip off of pH sensor end. Inspect bulb to make sure it is clean. If thebulb has dried out, it will have to be rehydrated before calibration. Rehydrate thebulb by immersing in tap water for 30 minutes.
3. Press the I/O key to turn on meter.
4. Press the MODE key until the pH mode indicator is displayed.
5. Place the electrode into the 7.0 Buffer.

Surveys Section SOPDRAFT Ver. #: 1
Date: June 2002Page 62 of 86
6. Wait 30 seconds and then push CON again to accept the buffer.
7. Press the CAL key. Calibrate will be displayed above the main field. After thecurrent calibration slope is displayed, P1 will be displayed in the lower field. P1indicates the meter is ready to accept the first buffer point. Make sure theelectrode is in the correct buffer.
8. When the electrode is stable, the meter will beep and READY will be displayedalong with the temperature-corrected value for the buffer (Flashing). Press theYES key to accept this point.
9. The display will remain fixed momentarily, then P2 will be displayed in the lowerfield. The meter is now ready for the second buffer.
10. Rinse the electrode and place it in the second buffer (10.0). Wait for a stable pHreading (the meter will beep) and for READY to be displayed. Press the YES keyto accept the second point. The screen will display P3 in the lower field.
11. Press the MODE key to end the calibration.
2.10.2.2.1 Operation
1. Connect the pH electrode to the meter.
2. Take plastic tip off of pH sensor end. Inspect bulb to make sure it is clean.
3. Press I/O key to turn meter on.
4. Place the electrode in the sample and wait for a stable pH reading (the meterwill beep) and for READY to be displayed.
5. Record the concentration directly from the upper meter display. Temperature isdisplayed in the lower field.
2.10.2.2.2 Additional Notes
1. Disconnect pH electrode cable from the meter before closing the case. Thiswill prevent damage to the electrode cable.
2. Always keep sensor bulb moist with black storage tip. If KCl storage solutionis not available, use tap water or pH 4.0 buffer. Do not use Distilled water.
3. Remove 9-volt battery from back of unit after each use. This will extendbattery life. A few extra batteries will be in each case for backups.
2.10.2.3 Calibration of Oakton pH 6 Acorn Series MeterWhen calibrating field pH meters, it is best to use a slope buffer that will closely resemblethe pH of the waters that you are sampling. For Indiana surface waters a slope buffer of10.00 su should be used (Indiana surface waters tend to be more alkaline). With this inmind, each pH meter case should contain pH buffer 7.00 and 10.00 su. A rinse bottle full ofdistilled water should be used in place of the pH buffer 4.00. This rinse water should be

Surveys Section SOPDRAFT Ver. #: 1
Date: June 2002Page 63 of 86
replaced every time the buffers are replaced.1. Connect the pH electrode to the meter.
2. Take plastic tip off of pH sensor end. Inspect bulb to make sure it is clean. If thebulb has dried out, it will have to be rehydrated before calibration. Rehydrate thebulb by immersing in tap water for 30 minutes.
3. Immerse probe tip into pH buffer 7.00 calibration standard and allow reading tostabilize.
4. Press CAL key.
5. Press HOLD/ENTER key to confirm value.
6. Repeat with the slope pH buffer 10.0 calibration standard (or 4.00 for acidwaters).
2.10.2.3.1 Operation
1. Connect the pH electrode and the temperature probe to the meter.
2. Take plastic tip off of pH sensor end. Inspect bulb to make sure it is clean andhydrated.
3. Press the ON/OFF key to power up the meter.
4. Place the electrode and temperature probe in the sample and wait for a stable pHreading.
5. Record the pH and temperature value from the meter display. Pressing theMODE/INC Key will toggle between the pH/mV/Temperature readings.
2.10.2.3.2 Additional Notes
1. Disconnect the pH sensor and temperature electrode from meter after use. Thiswill prevent damage to the cables when closing the carrying case.
2. Always keep sensor bulb moist with KCL. After use, always put the pH sensortip back into the storage cap filled with KCL. If KCL storage solution is notavailable, use tap water or pH 4.0 buffer. Do not use Distilled water.
3. Unstable pH readings usually indicate that the pH electrode should be replaced.
2.10.3 MEASUREMENT OF DISSOLVED OXYGEN (DO)Personnel of the Surveys section often make measurements of the dissolved oxygenconcentration in bodies of water they are surveying or studying. These measurements aremade either using the Winkler iodometric titration test method, or a Hydrolab multiprobe. TheWinkler Method is discussed in detail below. The instructions for operating a Hydrolabmultiprobe are discussed later in this document.

Surveys Section SOPDRAFT Ver. #: 1
Date: June 2002Page 64 of 86
2.10.3.1 Winkler MethodThe field test for dissolved oxygen is a very important aspect of a water pollution survey. Itis therefore necessary that each member of the survey team uses proper and consistenttechniques in performing this test. Reagents, procedures, equipment, and sampling methodare all important and will be explained in the following guidelines.
2.10.3.1.1 Field Equipment for Winkler Method
D.O. field equipment consists of the following items:1. Chemical reagents
2. A 500 mL Erlenmeyer flask or equivalent
3. A 10 ml titration pump
4. Tray of standard size calibrated 272 mL (+3 ml) DO bottles
5. A thermometer
6. A calibrated 10 mL pipette graduated in 0.1 ml increments
7. Sampling equipment
The reagents used for the Winkler method are manganous sulfate (MnSO4), alkalineiodine-azide solution (KI), 18N (50 %) sulfuric acid (H2SO4), starch solution, and0.0335N thiosulfate solution. These reagents are prepared by personnel of the ISDHLaboratories and are available upon request. All Surveys Section staff required tomaintain their respective D.O. kits.
When reagents are taken from the ISDH Laboratories, it is very important to mark thedate on the bottle. This is necessary in order to insure that fresh reagents are always onhand for the field tests. Starch and thiosulfate will breakdown readily in the heat andsun, so it is important to replace these reagents at least weekly during the summer, andmonthly during the winter. The thiosulfate should be kept in opaque bottles in the fieldD.O. kits. Starch and thiosulfate can be kept in significant quantities (2 to 3 liters) in theequipment room refrigerator to insure a fresh supply is always available.
Except for thiosulfate and starch, the reagents are dispensed from 250 mL plastic(Nalgene) squeeze bottles which deliver a measured 2 mL amount of liquid. Thethiosulfate solution is dispensed using the 10 mL pipette and titration pump.
2.10.3.1.2 Sampling Methods for Winkler Method
The D.O. sample can be collected from the stream by using a plastic bucket that has firstbeen rinsed with sample water. After the sample is collected, the D.O. bottle should berinsed with sample water. Then, either gently pour the sample from the bucket into theD.O. bottle or submerge the D.O. bottle directly into the bucket to allow it to slowly fillup. After the bottle is filled, the cap must be replaced carefully on the D.O. bottle toavoid entrapment of air bubbles. This can be done easily by recapping the D.O. bottle

Surveys Section SOPDRAFT Ver. #: 1
Date: June 2002Page 65 of 86
while it is still submerged in the bucket or by gently tapping on the side of the bottleuntil all of the bubbles have escaped. After the bottle is capped, follow the instructionsin the Winkler Method Sample Preparation and Analysis section below.
When insufficient water depth or other factors prohibit the use of a bucket, collection ofthe sample must be done by hand. This is accomplished by holding the D.O. bottleslightly under the water surface and allowing the water to run slowly down the inside ofthe bottle. When the bottle is full, submerge the bottle and replace the cap, againavoiding air entrapment.
When dissolved oxygen sampling is required on municipal or industrial effluents, it issometimes necessary to collect the sample from an outfall where excessive turbulence orother conditions make both the above methods impractical. In this situation, fill a bucketwith the effluent and allow several minutes for quiescence. Then collect the D.O.sample from the bucket using the hand technique described above.
samples should always be collected from a point in the stream where maximum mixinghas occurred. Very turbulent riffles and extremely static pools should be avoided.
Whichever collection methods are used, the water temperature must be recorded as soonas possible. This is a very necessary factor in data interpretation.
2.10.3.1.3 Winkler Method Sample Preparation and Analysis
1. Obtain and wear Safety Glasses.
2. Remove the stopper and add 2 mL of KI and 2 mL MnSO4 from squeezebottles. Make sure the squeeze bottle is pointed away from all personnel.
3. Place stopper in bottle, drain excess water from around stopper and rinse bottlein sample water.
4. Mix sample by inverting D.O. bottle several times. Allow bottle to set until thesolids settle to within approximately one inch of the bottom of the bottle.
5. Repeat step four (4).
6. After the solids have settled, remove stopper and add 2 mL of 50% H2SO4.
7. Rinse bottle in sample water.
8. Invert D.O. bottle several times. If solid precipitate persists, add an additional 2mL 50% H2SO4, replace the stopper, rinse the bottle as before, and invertseveral more times.
9. Pour contents of D.O. bottle into titration flask.
10. Titrate sample using a burette, with 0.0344 N sodium thiosulfate solution, to apale straw yellow color.
11. Add starch solution from squeeze bottle until the sample water turns dark blue.

Surveys Section SOPDRAFT Ver. #: 1
Date: June 2002Page 66 of 86
12. Continue titrating until the sample becomes completely clear. Check sampleagainst something white to be sure.
13. On the field sheet, record the amount of sodium thiosulfate used as the D.O.measurement.
14. Rinse all glassware when finished, and put back into kit.
2.10.3.1.4 General Notes
A general description of the analytical methods, reagents, and equipment needed to runthe azide modification of the Winkler Method can be found in Standard Methods, 20thEdition. This method is modified slightly when used by Surveys section personnel.These modifications involve changes in the volume of solution titrated and thenormality of the sodium thiosulfate titrant. The normality of the thiosulfate titrant hasbeen changed from the 0.025N solution described in Standard Methods to 0.0335Nsodium thiosulfate. This more concentrated solution is used to titrate 272 mL (+3 mL)of the water solution prepared for dissolved oxygen analysis. The 272 mL (+3 mL)volume is the volume of the D.O. bottle used to collect the sample. Thus, the fieldinvestigator does not have to measure the 200 mL volume called for in the procedure inStandard Methods. The bottles used by field personnel have been selected for thisvolume (272+3 mL) by water laboratory personnel. Studies conducted by waterlaboratory personnel show that no significant differences were found in values whendissolved oxygen analyses were done in this manner, compared to the procedureoutlined in Standard Methods.
2.10.4 TOTAL RESIDUAL CHLORINE
2.10.4.1 Operation of HACH Pocket Colorimeter Test (0-2 MG/l)1. Fill a 10 mL cell to the 10 mL line with sample and cap. Note: Samples must be
analyzed immediately and cannot be preserved for later analysis.
2. Note: Be sure the instrument is in the low range mode. See the instructionmanual, page 18.
3. Add the continents of one DPD Total Chlorine Powder Pillow to the sample cell(the prepared sample). Cap the cell and gently shake for 20 seconds.
4. Note: A pink color will develop if chlorine is present.
5. Note: Accuracy is not affected by undissolved powder.
6. Note: Gently shaking the cell dissipates bubbles which may form in samplescontaining dissolved gases.
7. Wait at least 3 minutes, but no longer than 6 minutes. During this period, proceedwith step 8 - 12.
8. Fill a 10 mL cell to the 10 mL line with sample (the blank) and cap.

Surveys Section SOPDRAFT Ver. #: 1
Date: June 2002Page 67 of 86
9. Remove the instrument cap.
10. Note: For best results, zero the instrument and read the sample under the samelighting conditions.
11. Place the blank in the cell holder, making sure the diamond mark faces the frontof the instrument. Cover the cell with instrument cap. Flat side should face theback of the instrument. Be sure it fits tightly against the instrument.
12. Press: ZERO. The instrument will turn on and the display will show --- followedby 0.00.
13. Note: The instrument automatically shuts off after 1 minute. If this occurs, thelast zero is stored in memory. Press READ to turn the instrument on and completesample analysis.
14. Remove the cell from the cell holder.
15. Within 3 minutes after the 3-minute period, place the prepared sample in the cellholder.
16. Cover the cell with the instrument cap.
17. Press: READ. The instrument will show --- followed by the results in mg/L totalchlorine (Cl2).
Note: If the sample temporarily turns yellow after reagent addition, or shows over range(flashing 2.20 in display), dilute a fresh sample and repeat the test. A slight loss of chlorinemay occur because of the dilution. Multiply the result by the appropriate dilution factor.
2.11 THE HYDROLAB H20 MULTIPROBE SYSTEM
2.11.1 INTRODUCTION
The Hydrolab H20 multiparameter sensor unit allows for a real time readout of dissolvedoxygen, pH, temperature, specific conductance, depth, total dissolved solids, and turbidity.The unit is compact in size and helps eliminate the need to carry multiple pieces of equipmentand reagent chemicals.
2.11.1.1 Components of the Hydrolab H20 SystemThere are 6 different components that should be utilized in most deployments of theHydrolab H20 unit.
1. The "H20" Transmitter sonde
2. The "Scout 2" display unit
3. Rechargeable battery pack
4. Stirrer Unit
5. Cable (various lengths)
6. PVC tube

Surveys Section SOPDRAFT Ver. #: 1
Date: June 2002Page 68 of 86
2.11.1.2 Assembly of the H20 Unit1. At the first site, take the H20 sonde out of the carrying case and remove the storage
cup.
2. Note: The assembly might take place in the equipment room before departure.
3. Screw the stirrer unit clockwise onto the sonde until tight.
4. Note: on units # 4, 5, 8, 9, 10, and 11 pay special attention to the web of the sensorguard to make sure the turbidity sensor has a "clear line of sight". That is, make surethat one of the sensor guard webs lines up just below the U-shaped turbidity sensor asthe sonde is held horizontally.
5. Remove pin from the V-shaped metal handle from top of sonde and line up eye hookfrom the connector cables and reinsert pin.
6. Connect the cable to the end of the sonde (six pin) making sure to line up the roundnotch on the outside of the connector with the largest pin on the sonde. When makingthis connection, make sure to remove any trapped air in the connector by squeezingconnector until you feel or hear the air escape.
7. Connect stirrer cable (2 pin) into 2 pin connector on cable. Again, remove any trappedair in connector, as in step 4.
8. Connect the round six pin screw connector cable into the left side of the Scout 2 displayunit. Line up notches, push in, and turn clockwise until pins latch securely
9. Connect the rechargeable battery cable to the right side of the Scout 2 display unit.Again, line up the notches, push in, and turn clockwise until pins latch securely.
2.11.1.3 Scout 2 Display FunctionsPush the "On/Off" button on the display unit to turn on the display unit and to "power-up"the sonde. The "Main Screen" should be displayed first, if not, push the "Screen Escape"button.

Surveys Section SOPDRAFT Ver. #: 1
Date: June 2002Page 69 of 86
Table 2.9 Main Screen Parameters of the Scout 2 Display UnitTemperature(degrees Celsius) Dissolved Oxygen(mg/l) Depth(for units #4 and #5 (Ft)
only, otherwise blank)
Conductivity (us/cm) pH(su) Blank
Push the "Screen Escape" button for the "Alt Screen" parameters which should be displayed in thefollowing arrangements and units:
Total Dissolved Solids(g/l)(Units #8-#12 only, otherwise,blank)
Turbidity(Units #8-#12 only,otherwise, blank )(ntu)
Battery(Volts)
Turbidity (*For units #4 and #5only)(ntu)
Time (amount of time unit hasbeen turned on)
orDissolved Oxygen % Sat. (Units#1-#3, and #8-#12 only)Note: The "Calibrate", "Variables", and "Enter" buttons are not used during ordinary field operation.
2.11.1.4 Field Calibration Checks of the Hydrolab H20 UnitRecord the Hydrolab Unit number being used in the appropriate space on the field sheet.D.O. and pH Hydrolab readings should be checked against a Winkler titration, and aseparate pH meter, respectively. In addition, temperature and turbidity Hydrolab readingsshould also be checked and compared with separate meters. The Hydrolab temperaturereading should be compared to the temperature reading from the pH meter and theHydrolab turbidity reading should be compared to a separate field turbidimeter. All ofthese QC check analyses should be collected from the leftover sample water remaining inthe plastic bucket after the PVC tube is filled. All field calibration checks should becollected at the first sample site of the day and recorded in the appropriate space on thefield sheet. Make sure to record the Hydrolab unit number on the sheet. If the D.O.difference between the Winkler titration and the Hydrolab is 0.6 mg/L or greater, thenanother Winkler check should be run at the next sampling site. If this discrepancy stillexists, continue to collect/record D.O. readings using the Hydrolab, but be sure to reportthis problem to the assigned Hydrolab maintenance personnel upon return to office. Collectthe pH calibration check reading at the same site as the D.O. check. If the pH differencebetween the portable meter and the Hydrolab is 0.6 su or greater, check the portable pHmeter calibration and run QC check again at the next sampling site. If discrepancy stillexist, continue to collect/record pH readings using the Hydrolab, but report problem to theassigned pH and Hydrolab maintenance personnel upon return.
2.11.2 HOW TO RECORD FIELD DATA USING A FIELD SHEET
(See Figure 2.5, Stream Sampling Field Data Sheet)Prior to the sampling event, The Surveys Section AIMS database will automatically generatefield sheets for each project or sampling event. These preprinted field sheets should already

Surveys Section SOPDRAFT Ver. #: 1
Date: June 2002Page 70 of 86
contain all of the site identification information as well as the sample numbers. Whenrecording field data, make sure to fill in the following areas on the field sheet: Date Sampled,Hydrolab #, Water Depth/Gage Ht (if applicable), Water Flow (if applicable), Flow Estimated(if applicable), and all of the stream physical description checks boxes. In addition, record allthe field data readings that are applicable to the type of sampling being conducted, in theappropriate area. Please write legibly as this is the only place that field data is recorded. Also, do not forget to record the bottle lot numbers and the preservative lot numbers, ifapplicable.

Surveys Section SOPDRAFT Ver. #: 1
Date: June 2002Page 71 of 86
Figure 2.5 Stream Sampling Field Data Sheet

Surveys Section SOPDRAFT Ver. #: 1
Date: June 2002Page 72 of 86
2.11.3 OPERATING THE HYDROLAB H20 SYSTEM FOR FIELD DATA COLLECTION
Collect the field data sample using a separate rope and a 5 gallon plastic bucket. Rinse bucketonce with sample water, dump so as not to disturb stream, and then retrieve sample wateragain. Take bucket full of sample water back to vehicle and rinse PVC tube and Hydrolab unitthoroughly with sample water. Rinse the PVC tube by turning it so all rinse water comes incontact with the whole inside surface area of the tube. Refill the PVC tube half way with thesample water. Pour sample water slowly into PVC tube, so as to minimize any artificialaeration that might occur. Turn on the scout display unit and slowly submerge Hydrolab unit,with stirrer attached, into tube. Rotate Hydrolab unit while in tube ½ turn in a back and forthagitation motion a couple of times. This will allow any trapped air bubbles to escape fromaround the turbidity sensor. Hydrolab turbidity readings might drift plus or minus 2-3 ntu andmight never really "stabilize". Use Best Professional Judgement (BPJ) when recording thisreading. Allow sufficient time for readings to stabilize. Sensors need to equilibrate tosample temperature, and a longer than normal stabilization period should be expected at thefirst site, maybe as long as 5 to 10 minutes, especially if the sonde was left in a very hotvehicle. The sonde unit should be left submerged in the PVC tube with the previous samplesite water during transit between sampling sites. A small red cooler should be used to hold thePVC tube in a somewhat upright position between sampling sites. Current sampling site watershould be used to thoroughly rinse the Hydrolab unit and the PVC tube before the final currentsample water is poured into the PVC tube for analysis.
2.11.4 ADDITIONAL OPERATING NOTES FOR THE HYDROLAB UNIT
1. Do not let the Hydrolab sensors dry-out. Clean sample water or tap water should beused in the screw on cup for storage after sampling run is complete. Do not use DIwater in the storage cup under any circumstances.
2. Never let the Hydrolab unit freeze. Units should not be kept in vehicles overnight ifthe temperature is expected to drop below freezing.
3. Keep an eye on the battery voltage. If it drops below 10 volts, the battery should berecharged. If the battery volts drop below 9, the sonde will stop operating. Arecharging pack adapter should be in the battery pack. Simply connect the battery packcable to the charging adapter and plug into electrical outlet. An overnight rechargetime is probably sufficient.
4. Do not sharply bend or kink the cables. Watch the cable when shutting thetailgate of the vehicle. Do not get in a hurry and slam it in the door. These cables areexpensive to replace. Keep the cables rolled up as best as possible.
5. Try not to drop the plastic PVC tubes. The tubes will crack on the bottom and startleaking.
2.11.5 OPERATING RANGE, RESPONSE TIME, AND DRIFTS FOR THE H20 UNIT
If the Hydrolab readings fall outside any of these ranges, response times, or drift, please

Surveys Section SOPDRAFT Ver. #: 1
Date: June 2002Page 73 of 86
consult the Hydrolab Troubleshooting section for in-field diagnostics. Stability time refers tothe expected time needed for the reading to become stable. The drift refers to the drift of theHydrolab reading after appropriate stability time has been allowed for sensor equilibrium.Note: Even under "ideal" sampling conditions some of the Hydrolab readings will not totallystabilize.
Table 2.10 Hydrolab Operational Parameters
Parameter Range Stability Time Drift
Dissolved Oxygen 2-14 mg/L 1-5 minutes 0.1 mg/L
PH 6-9 su 1 minute 0.1 su
Conductivity 100-3,000 us/cm 1 minute 1 us/cm
Turbidity 1-800 NTU < 1 minute 5 NTU
Temperature 0-40 degrees Celsius < 1 minute 0.1 degrees Celsius
2.11.6 HYDROLAB TROUBLESHOOTING
Note: Any problems or concerns with Hydrolab equipment should be related to the Hydrolabmaintenance personnel (page 9) upon return to the office.
2.11.6.1 Dissolved Oxygen1. Is there enough water in sampling tube to fully submerge D.O. sensor?
2. Is the stirrer operating properly?
3. Lift up sonde while unit is turned on. Is the stirrer rotating?
4. Move around stirrer cable. Does stirrer go on and off indicating a short in cable?
5. Unplug and plug back in stirrer connector cable from sonde cable. Is this connectiontight and free of air pockets?
6. Inspect D.O. membrane for any noticeable tears or deformities. If holes or tears areobserved, stop recording the Hydrolab D.O. and use the Winkler method.
7. If still in doubt, re-sample with fresh sample water. If problems still exist, record theWinkler method for comparison purposes. If the difference between the Hydrolab andthe Winkler is greater than 0.6 mg/L, record the Winkler concentration on the fieldsheet, but make note of problem on the field sheet and check the Hydrolab D.O. valueagainst the Winkler value at the very next sampling site.
2.11.6.2 pH1. Is there enough water in sampling tube to fully submerge the two pH sensors?
2. Is there debris covering the pH bulb or the reference sleeve?

Surveys Section SOPDRAFT Ver. #: 1
Date: June 2002Page 74 of 86
3. If still in doubt, re-sample with fresh sample water. If problems still exist, use theportable pH meter for comparison purposes. If the difference is greater than 0.6 su,record the portable pH meter reading on the field sheet, but make note of problem onthe field sheet and check the Hydrolab pH reading against the portable pH meter atthe very next sampling site.
2.11.6.3 Conductivity1. Is there enough water in sampling tube to fully submerge the conductivity block?
2. Is the conductivity block free of debris? Is there any ice forming on the pins?
3. Is the stirrer operating properly? (see the dissolved oxygen troubleshooting section.)
4. If still in doubt, re-sample with fresh sample water. If problems still exist, record thevalue, but make note of problem on the field sheet.
2.11.6.4 Turbidity1. Is there enough water in the sampling tube to fully submerge the u-shaped turbidity
sensor?
2. If the concentration is greater than 800 NTU, rotate sensor unit ½ turn back and forth acouple of times while in sampling tube. This will release trapped bubbles possiblycaught inside of sensor. Also, observe clarity of sample water. If water appears verymuddy, it is possible in some circumstances that the reading is accurate.
3. If turbidity is less than 1 NTU, agitate sample water in tube to re-suspend any solidsthat might have settled to the bottom of the tube.
4. If still in doubt, re-sample with fresh sample water. If problems still exist, record thevalue, but make note of problem on the field sheet.
2.11.7 HYDROLAB H20 SYSTEM CALIBRATION PROCEDURES
Note: Calibration procedures are listed in the order that they should be conducted.
2.11.7.1 Dissolved Oxygen (Air Calibration)Note: It easier to calibrate the D.O. using air calibration, than a Winkler. It has also beenfound that the calibration results are the same no matter which procedure is used. Betterrepeatability is achieved with the air calibration method. It is recommended that aircalibration be used for most calibration events.
1. With the transmitter oriented so that the sensors are pointed toward the ceiling, pullthe white D.O. sensor guard off of the sensor housing and gently remove any waterdroplets from the membrane.
2. Screw on the calibration cup and fill with tap water until the water is just level with

Surveys Section SOPDRAFT Ver. #: 1
Date: June 2002Page 75 of 86
the small black o-ring that is used to secure the membrane and making sure not to getthe membrane wet. Any water that gets on the membrane can be removed with thecorner of a paper towel.
3. Turn the blue or black rubber calibration cover upside down (concave up) and lay itover the top of the calibration cup.
4. Turn on the "Scout 2" display unit and wait until the D.O. reading stabilizes.
5. Get the current barometric pressure from a calibrated barometer or the local weatherservice (or call the weather line at 635-5959). First you must convert this pressurereading from inches of mercury to millimeters of mercury. Look at the chart on thecalibration room wall for the conversion. Next you must convert this number to an"un-corrected" atmospheric pressure. For the Shadeland office, you need to subtract21.2 millimeters of mercury from the previously converted millimeters of mercurypressure. (Note: If you are out in the field and you do not know your elevation and/oryour barometric pressure, you can use the default setting of 760, but this might inducea little bit of error. In this situation, it might be best to calibrate against a Winklerproviding the Winkler reagents are fresh).
6. After the reading has stabilized, note the value. Chose "calibrate" on the display unitand choose "%" (D.O. % sat) by using the right or left arrow keys. Now use the arrowkeys to enter the millimeters of mercury value you obtained in step 5. Press the"enter" key and select "Y" to save new calibration.
7. Enter the drift value in the "Hydrolab Log Book". This drift value is the differencebetween the initial D.O. value in mg/L before calibration and the D.O. value in mg/Lafter calibration. If the post-calibration value was higher indicate with a "-" before thevalue and if it was lower indicate with a "+" before the value. The D.O. air calibrationis complete.
2.11.7.2 pH1. With the transmitter oriented so that the sensors are pointed toward the ceiling, and
with the calibration cup screwed on, rinse with DI water and then with once used "pH7 Rinse." Discard the rinse and unscrew calibration cup and dry with paper towel.Also dry the sensors as best you can.
2. Fill calibration cup with fresh pH 7.00 buffer making sure to fill calibration cup sobuffer is just over the D.O. sensor.
3. Wait for the pH reading to stabilize and make note of the value.
4. Select "Calibrate" from display unit and then use arrow keys to select "P" and select"enter." Enter the value of your zero buffer (7.00) by using the arrow keys, and thenselect "enter." Select "Y" to save calibration.
5. Enter the drift value in the "Hydrolab Log Book". This drift value is the differencebetween the initial pH value before calibration and the pH value after calibration. Ifthe post calibration value was higher, indicate with a "-" before the value, and if it was

Surveys Section SOPDRAFT Ver. #: 1
Date: June 2002Page 76 of 86
lower indicate with a "+" before the value.
6. Dump "used" pH 7 buffer in extra cup marked "pH 7 Rinse" and use this for next "pH 7 buffer calibration.
7. Rinse sensors with DI water and then with once used "pH 10 Rinse" and discard.Wipe calibration cup dry with a paper towel and dry all sensors as best you can.
8. Fill calibration cup with fresh pH 10.00 (slope) buffer making sure to fill calibrationcup so buffer is just over the D.O. sensor.
9. Select "Calibrate" from display unit and then "P" (pH) and select "enter." Enter thevalue of your slope buffer (10.00) by using the arrow keys, and then select "enter."Select "Y" to save calibration.
10. Dump "used" pH 10 buffer in extra cup marked "pH 10 Rinse." This can be used forfuture calibration. The pH calibration is complete.
2.11.7.3 Specific Conductance1. With the transmitter oriented so that the sensors are pointed toward the ceiling, and
with the calibration cup screwed on, rinse with DI water and then with once used"conductivity rinse." Discard the rinse and unscrew calibration cup and dry with papertowel. Also dry the sensors as best you can.
2. Fill calibration cup with fresh conductivity solution making sure to fill calibration cupso solution is just over the D.O. sensor.
3. Wait for the conductivity reading to stabilize and note the value.
4. Select "Calibrate" from display unit and then "C" (Sp Cond) and select "enter." Enterthe value of your conductivity solution (most likely 718 µs/cm) by using the arrowkeys, and then select "enter." Select "Y" to save calibration.
5. Enter the drift value in the "Hydrolab Log Book". This drift value is the differencebetween the initial conductivity value before calibration and the conductivity valueafter calibration. If the post calibration value was higher, indicate with a "-" beforethe value, and if it was lower indicate with a "+" before the value.
6. Dump "used" conductivity solution in extra cup marked "Cond. Rinse." This can beused for future specific conductance calibration. The conductivity calibration iscomplete.
2.11.7.4 Turbidity1. With the transmitter oriented so that the sensors are pointed toward the ceiling, and
with the calibration cup screwed on, rinse with DI water and then with "TurbidityFree Water". After this rinse, discard and unscrew calibration cup and dry with papertowel. Also dry the sensors as best you can.
2. Fill calibration cup with unused "Turbidity Free Water" (0 ntu) solution making sure

Surveys Section SOPDRAFT Ver. #: 1
Date: June 2002Page 77 of 86
not to trap any air bubbles in the U-shaped turbidity sensor, and fill calibration cup sosolution is just over the D.O. sensor.
3. Wait for the turbidity reading to stabilize and make note of the value.
4. Select "Calibrate" from display unit and then "P". Enter the value of the "TurbidityFree Water" (0.0 ntu) by using the arrow keys, and then select "enter". Select "Y" tosave calibration.
5. Enter the drift value in the "Hydrolab Log Book". This drift value is the differencebetween the initial turbidity value before calibration and the turbidity value aftercalibration. If the post calibration value was higher, indicate with a "-" before thevalue, and if it was lower indicate with a "+" before the value.
6. Rinse sensors with once used "Turbidity Rinse" (typically 40 ntu for slope) anddiscard. Wipe calibration cup dry with a paper towel and dry all sensors as best youcan.
7. Fill calibration cup with fresh slope (40 ntu) solution. Shake this solution rigorouslybefore filling calibration cup. Again, make sure not to trap any air bubbles in theU-shaped turbidity sensor, and fill calibration cup so solution is just over the D.O.sensor.
8. Select "Calibrate" from display unit and then "Y". Enter the value of your slopesolution (40 ntu) by using the arrow keys, and then select "enter". Select "Y" to savecalibration.
9. Dump "used" turbidity 40 ntu solution in extra cup marked "40 ntu Rinse." This canbe used for future calibration. The turbidity calibration is complete.
2.11.8 HYDROLAB MAINTENANCE PROCEDURES
All sensors should be continuously checked for objectionable deposits and kept clean. Allmaintenance and calibration for each unit should be recorded in the Hydrolab Log Book.During all calibration procedures, the drift (difference between the standard solution value andthe reading before calibration is set) should be noted and recorded in the log book. The drift isimportant because it can aid in determining an undetectable fouling of sensors, a shift in thecalibration of the system, or a slowly failing sensor.
The dissolved oxygen sensor membrane and electrolyte should be changed on a regular basis.The manufacturer, however, does not specify how often this should be done. From experience,it is felt that changing the membrane and electrolyte every two months is probably sufficient ifno fouling has occurred. In heavy use periods i.e. summer, the membrane and electrolytemight need to be changed more often. The sonde should be allowed to sit overnight to allowthe dissolved oxygen membrane to "relax" before calibration.
The pH measurement system consist of a pH glass electrode and a pH reference electrode. ThepH glass electrode requires maintenance only when a coating of oil, dirt, or biological growth

Surveys Section SOPDRAFT Ver. #: 1
Date: June 2002Page 78 of 86
is observed. The pH glass electrode should be cleaned with a cotton ball wetted with rubbingalcohol. The pH reference electrolyte should be replaced every two months.
Maintenance on the pH reference electrode should definitely be conducted if the pH readingsseem to drift, or if the porous junction is observed to be dirty or coated with biologicalgrowth. Maintenance on the specific conductance sensor, consisting of six pin-shaped nickelelectrodes located under the white cell block, should be cleaned at least once a year, or soonerif fouling is observed.
2.12 THE HYDROLAB MINISONDE MULTIPROBE SYSTEM
2.12.1 INTRODUCTION
The Hydrolab Minisonde multiparameter sensor unit allows for a real time readout ofdissolved oxygen, pH, temperature, specific conductance, depth, total dissolved solids, andturbidity. The unit is compact in size and helps eliminate the need to carry multiple pieces ofequipment and reagent chemicals.
2.12.1.1 Components of the Hydrolab Minisonde SystemThere are 5 different components that should be utilized in most deployments of theHydrolab H20 unit. Currently, Surveys has two Minisonde units available, Units # 6 and #7.
1. The Minisonde Transmitter sonde
2. The Surveyor 4 display unit
3. The weighted sensor guard
4. Minisonde Cable
5. PVC tube
2.12.1.2 Assembly of the Minisonde Unit1. At the first site, take the sonde out of the carrying case and remove the storage cup.
Note: The assembly might take place in the Surveys Section equipment room beforedeparture.
2. Screw the weighted sensor guard onto the sonde until tight. Pay special attention tothe web of the sensor guard to make sure the turbidity sensor, if installed, has a "clearline of sight” between the webs of the sensor guard.
3. Connect the cable to the end of the sonde (the six pin connector) making sure to lineup the round notch on the outside of the connector with the largest pin on the sonde.When making this connection, make sure to remove any trapped air in the connectorby squeezing connector until you feel or hear the air escape. Secure the bulkheadcable guard to the sonde by turning clockwise until snug.
4. Connect the square nine pin connector to the Surveyor 4 display unit and secure by

Surveys Section SOPDRAFT Ver. #: 1
Date: June 2002Page 79 of 86
rotating the two screws clockwise.
2.12.1.3 The Surveyor 4 Display FunctionsPush the "On/Off" key on the display unit (the key located in the top right corner of theunit) to turn on the display unit and to "power-up" the sonde. After a short moment, all ofthe parameters will be displayed line by line on the screen in the following order:
D/T: Date and Time (MMDDYY,HHMMSS)DO: Dissolved Oxygen (mg/L)Tem: Temperature (degrees C)SPC: Specific Conductance (us/cm)DO%: Dissolved Oxygen (percent saturation)IBV: Internal Battery VoltageIB%: Internal Battery percent of full charge
The turbidity sensor is currently not installed on either Unit # 6 or # 7.
2.12.2 HYDROLAB MINISONDE SYSTEM CALIBRATION PROCEDURES
To calibrate the Minisonde using the Surveyor 4 display unit, a password will have to beentered. A password is needed for calibration or to make any changes to the sonde set-up orthe Surveyor 4 display set-up. The password for both Surveyor 4 units # 6 and # 7 is “ABC”(without the quotes). The fresh flow circulator (the stirrer) is an integrated sensor that issituated next to the dissolved oxygen sensor, and as such, should be shut off duringcalibration. The general calibration procedure as described in the Hydrolab H20 SystemCalibration Procedures section should be followed. To calibrate the Hydrolab Minisondeutilizing the Surveyor 4 display unit, press the key “Calibrate” and then “Sonde.” Nextchoose each individual parameter for calibration as follows:
DO%: Sat - for dissolved oxygen calibration.SpCond: us/cm - for specific conductance calibration.Turb: NTUs - for turbidity calibration (if turbidity sensors are installed).pH: Units - for pH calibration.
2.13 THE HYDROLAB DATASONDE
2.13.1 INTRODUCTION
The Hydrolab Datasonde 3 and Datasonde 4 loggers are off-line units that are completelysubmersible. They can be deployed and left for unattended monitoring until recovered at theend of their deployment period. These datasondes can monitor dissolved oxygen, pH,temperature and conductivity. Each Datasonde unit should be calibrated before and after eachdeployment period. The post calibration procedures should be conducted on sensors that

Surveys Section SOPDRAFT Ver. #: 1
Date: June 2002Page 80 of 86
have not been cleaned of any biological fouling. This is especially important for thedissolved oxygen sensor, because this sensor is the mostly likely to become fouled duringdeployment. The post calibration of datasondes is very important in order to account for anychanges that have occurred during the deployment period. Calibration, programming, anddownloading of these units require the use of a personal computer with a communicationsoftware package. All calibration procedures are the same as for the H20 units. Please consultthat section for details.
2.13.2 PROCEDURES FOR DEPLOYMENT OF DATASONDE
1. If you are not the person calibrating and programming the Datasonde give at least 72hours notice to the individual doing the set-up.
2. Always use a weighted sensor guard or a stirrer to protect the probes.
3. Datasondes must be secured and locked when deployed. Use the protective aluminumcasings along with cables and locks to secure and weight the sondes. Usual anchoringlocations are tank rails or trees on the river banks.
4. Place loggers in a flowing area of the stream, not a stagnant area. Also, be sure probeswill not be inhibited from working by sedimentation or biological growth from thestream. It might be necessary to suspend the weighted datasonde from a buoy to keep itoff of the bottom of a stream.
5. After recovering the logger, the probes should be stored in tap water or clean samplewater. Do not store sensors in distilled water.
6. Return sonde to laboratory for post-calibration and downloading of data.
3.0 QUALITY CONTROL AND QUALITY ASSURANCE
3.1 COLLECTION OF BLANKS
A field blank sample should be collected for each sample event (route). The Assessment BranchAIMS database automatically assigns field blanks when each specific project is scheduled and atthe frequency designated by the project leader, but never less than one per sample event. Theblank may be collected in the Surveys Section laboratory prior to the sample event using ultrapure blank water or in the field using the same ultra pure water. The field blank serves both as atrip blank and as a preservative blank. A trip blank shows that contamination was not introducedinto the sample during handling and transport. A preservative blank shows that contaminationwas not introduced into the sample by the preservative.
3.2 COLLECTION OF DUPLICATES
Field precision is assessed through the collection of field duplicates at a rate of one duplicate for

Surveys Section SOPDRAFT Ver. #: 1
Date: June 2002Page 81 of 86
every ten samples collected. The Assessment Branch AIMS database automatically assigns fieldduplicates when each specific project is scheduled and at the frequency designated by the projectleader, but never less than one duplicate for every ten samples collected. All original andduplicate samples should be collected at the same time and side by side if possible for eachparameter (original nutrient sample with duplicate nutrient sample, and original metal samplewith duplicate metal sample, etc.)
3.3 COLLECTION OF MATRIX SPIKES/MATRIX SPIKE DUPLICATES(MS/MSD)
A Matrix Spike/Matrix Spike Duplicate (MS/MSD) sample is collected for a laboratory analysiscontrol at the rate of one MS/MSD sample for every ten samples collected. The AssessmentBranch AIMS database automatically assigns MS/MSD samples when each specific project isscheduled and at the frequency designated by the project leader, but never less than oneMS/MSD sample for every ten samples collected. The MS/MSD sampling should follow theduplicate sampling protocol in order to collect a representative MS/MSD sample.
3.4 DATA QUALITY ASSESSMENT (DQA) LEVELS FOR FIELD DATA
The following table contains DQA levels, calibration QA/QC Requirements, and acceptancecriteria for field data parameters collected by Surveys Section personnel.
3.4.1 CONTROL LIMITS FOR FIELD DATA QUALITY ASSURANCE/QUALITY CONTROL CHECKS
The following table list control limits for dissolved oxygen and pH as promulgated from theSurveys Section field data QA/QC checks for the years 1999 through 2001.
Table 3.1 Acceptance Criteria for Surveys Section Field Data QA/QC Checks
Field ParameterControl Limit
(Relative Percent Difference [RPD])
Dissolved Oxygen 20pH 11
If the Relative Percent Difference (RPD) calculated from any field result for the above listedparameter and its respective field QA/QC check result is less than or equal to the ControlLimit for the listed parameter, then all the field results obtained for the indicated parameterduring a given sampling event will be considered “in control.” If the Relative PercentDifference (RPD) calculated from any field result for the above listed parameter and itsrespective field QA/QC check is greater than the Control Limit for the listed parameter, thenall the field results obtained for the indicated parameter during a given sampling event will beconsidered “out of control.” Out of control field results will be considered as estimatedresults and assigned the data qualifier (data flag) “QJ.”

Surveys Section SOPDRAFT Ver. #: 1
Date: June 2002Page 82 of 86
The Relative Percent Difference (RPD) is calculated in the following manner:
RPD = {(|Field Result – QA/QC Check Result|) ÷ (Field Result + QA/QC Check Result)} × 200
The QA/QC field check control limits for the various field parameters were calculated in thefollowing manner:
Control Limit = (Mean RPD) + (3 × Standard Deviation of RPDs [n = > 200] for each parameter)
Note: The Control Limits represent a 99.7% Confidence Limit.

Surveys Section SOPDRAFT Ver. #: 1
Date: June 2002Page 83 of 86
Table 3.2 Quality Assessment (DQA) Levels for Field DataDQA Level Parameter
Analytical TestMethod
Description of Analytical TestMethod
Calibration and QA/QCRequirements
QA/QCAcceptance Criteria
Chloride YSI1. Not an EPA Approved AnalyticalTest Method2. Ion Selective Electrode (ISE)
1 point calibration performed weekly Not enough confidence in data; lacksQA/QC data
1Chlorophyll A(Uncalibrated)
EPA445.0(Modified)
1. Modification of an EPA ApprovedAnalytical Test Method2. Fluorescence
Baseline is zeroed weekly and YSIdefault calibration used
Not enough confidence in data; lacksQA/QC data
Specific ConductanceEPA120.1
1. EPA Approved Analytical TestMethod2. Conductivity Bridge
Calibrated once per year unless out ofcontrol
Check performed weekly (+/- 5%)
2
Chlorophyll A (Calibrated)EPA445.0(Modified)
1. Modification of an EPA ApprovedAnalytical Test Method2. Fluorescence
1. Baseline is zeroed weekly and YSIdefault calibration used.2. Actual calibration is from contractlaboratory results
QA/QC is performed by the contractlaboratory in accordance with EPA 445.0.
PHEPA150.1
1. EPA Approved Analytical TestMethod2. Electrometric
Calibration performed weekly 1. Checked using secondary stand-aloneinstrumentation during each samplingevent2. Frequency is section specific(# Control Limit).
Dissolved Oxygen(DO)
EPA360.1
1. EPA Approved Analytical TestMethod2. Membrane Electrode
Calibration performed weekly 1. Checked using a different analyticaltest method during each sampling event2. Frequency is section specific(# Control Limit).
TurbidityEPA180.1(Modified)
1. Modification of an EPA ApprovedAnalytical Test Method2. Nephelometric3. Light Emitting Diode
1. Calibration performed weekly2. Calibration performed yearly ifchecked by a Check Standard from asecond source prior to each samplingevent
1. Checked using secondary stand-aloneinstrumentation or check by a standardfrom a second source prior to or duringeach sampling event2. Frequency is section specific(#Control Limit).
3
TemperatureEPA170.1
1. EPA Approved Analytical TestMethod2. Thermometric Thermistor
Calibration is checked against NISTTraceable Thermometer once per yearunless out of control.
1. Checked using secondary stand-aloneinstrumentation during each samplingevent2. Frequency is section specific(#Control Limit).

Surveys Section SOPDRAFT Ver. #: 1
Date: June 2002Page 84 of 86
3.5 MAINTENANCE AND CALIBRATION LOG BOOKS
Log books should be maintained for all field equipment used by the Surveys Section. Allcalibration and maintenance activities should be recorded in their respective equipment logs. Please be sure to initial and date each entry of the log book.
REFERENCES
4.1 GENERAL REFERENCES
American Public Health Association, American Water Works Association, and the WaterEnvironment Federation. 1998. Standard Methods for the Examination of Water and Wastewater,Twentieth Edition. Washington, D.C.
Bowren, Timothy and Ghiasuddin, Syed. 1999. Quality Assurance Project Plan for IndianaSurface Water Quality Monitoring Programs, Revision 2. Indiana Department of EnvironmentalManagement. IDEM/32/01/1442/1999.
Butts, Thomas A. and Ralph L. Evans, 1978. Sediment Oxygen Demand Studies of SelectedNortheastern Illinois Stream (Circular 129). Illinois State Water Survey.
GhiasUddin, S.M., Ratcliff, B.L., and Boswell, S.H. 2000. "Determination of Trace Metals inAmbient Waters at Water Quality Criteria Levels Using Ultra-Clean Techniques," Proceedings ofthe 21st Annual Water Resources Symposium, June 14 – 16, 2000, Mitchell, Indiana, IndianaWater Resources Association (IWRA).
Grant, Douglas M. and Dawson, Brian D. 1995. Fourth Edition. ISCO Open Channel FlowMeasurement Handbook. ISCO Environmental Division, Lincoln, Nebraska.
Kilpatrick F.A. and Wilson J.F. 1989. Measurement of Time of Travel in Streams by DyeTracing. From Techniques of Water-Resources Investigations of the United States Geological Survey, Chapter A9. U.S. Department of Interior
U.S. Department of the Interior, Bureau of Reclamation. 1967. Water Measurement Manual, 2ndEdition. Denver, Colorado.
Rantz, S.E., and others, 1982, Measurement and computation of streamflow: U.S. GeologicalSurvey. Water-Supply Paper 2175.
Ratcliff, B.L. and GhiasUddin, S.M. 1999. "Trace Metals Pilot Project 1998 Fall CreekWatershed Study Report," Indiana Department of Environmental Management, November 1999.
Roseboom, D. P., R. L. Evans, W. Wany, T. A. Butts, and R. M. Twait. 1979. Effects of Bottom

Surveys Section SOPDRAFT Ver. #: 1
Date: June 2002Page 85 of 86
Conditions of Eutrophy of Impoundment's. (circular 139). Illinois Natural History Survey,Urbana, Illinois.
U.S. Department of the Interior. 1965. Surface Water Techniques, Measurement of Discharge byDye-Dilution Methods, Book 1, Chapter 14. Washington, D.C.
U.S. Department of the Interior. 1968. Techniques of Water Resources Investigations of the U.S.Geological Survey. Fluorometric Procedures for Dye Tracing. U.S. Government Printing Office,Washington, D.C.
U.S. Geological Survey Water Supply Paper 2175 titled Measurement and Computation ofStream flow: Volume 1. Measurement of Stage and Discharge. Volume 2. Computation ofdischarge. U.S. Government Printing Office, Washington: 1982.
U.S. Environmental Protection Agency. 1977. NPDES Compliance Sampling Manual. U. S.Environmental Protection Agency, Enforcement Division, Office of Water Enforcement,Compliance Branch, Washington, D.C.
U.S. Environmental Protection Agency. 1996. Method 1669, "Sampling Ambient Water forTrace Metals at EPA Water Quality Criteria Levels," U.S. Environmental Protection Agency,July 1996.
U.S. Environmental Protection Agency. 1995. Guidance for the Preparation of StandardOperating Procedures (SOP’s) for Quality-Related Documents. U. S. Environmental ProtectionAgency, Office of Research and Development, Washington, D.C. EPA/600/R-96/027.
4.2 INSTRUMENT MANUAL REFERENCES
Cole-Parmer Digi-Sense pH Meter Operating Instructions Model 5985-80.
Hach Company Portable Turbidimeter Instruction Manual, Model 2100P. 1991-1995.
Hach Company Portable pH/ISE Meter Manual, Model 50075
Hach Company Pocket Colorimeter Chlorine Manual. 1991, 1992.
Hydrolab H20 Water Quality Multiprobe Operating Manual. April 1995, Revision B.
Hydrolab Scout 2 Display Unit Operating Manual. January 1994, Revision D.
HydrolabDatasonde 3 Multiprobe Logger Operating Manual. January 1994, Revision F.

Surveys Section SOPDRAFT Ver. #: 1
Date: June 2002Page 86 of 86
Hydrolab Datasonde 4 and Minisonde Water Quality Multiprobe User's Manual. August 1997,Revision D.
Hydrolab Surveyor 4 Water Quality Data Display. July 1997, Revision B.
Isco Instrument Manual - Model 2700 Sampler. Copyrighted 1998.
Isco Instrument Manual - Model 2900 Sampler. Copyrighted 1986.
Isco Instrument Manual - Model 2870 Sampler. Copyrighted 1986.
Isco Instrument Manual - Model 3230 Flow Meter. Revision H. Copyrighted 1990.
Isco Instruction Manual - Model 6100 Volatile Organic Sampler. Revision D. Copyrighted 1993,1995
Isco Instruction Manual - Model 1680 Sampler With LED Readout. Copyright 1975.
Marsh-McBirney, Inc. - Model 2000 Portable Water Flowmeter Instruction Manual. December1990.
Oakton – Operating Instructions for pH 5 and pH 6 Acorn Series Meters. Printed 8/98.
Turner Designs - Model 10 series Fluorometer User's Manual. October 1990.
YSI Incorporated – 6 Series Environmental Monitoring Systems Operations Manual.
4.3 HEALTH AND SAFETY REFERENCES
Water Quality Surveys Section, Laboratory and Field Hazard Communication Plan Supplement,document number: IDEM 032/02/018/1998
Water Quality Surveys Section, Hazcom Safety Manual
Material Safety Data Sheets Notebook for the Surveys Section