
SurveyMonkey 2012 Presidential Election Poll
7
"#$" %&'()*'+,)-. /.'0,)1+ %1.. "#$%$& '()%(*+, "#-.-, /" 012#3+3%345 .(61 '3%+71)4, 89: ;$(*( 9&<21$*, "#-.-, =1*$3) 012#3+3%34$<2
-
Upload
surveymonkey -
Category
Documents
-
view
26.503 -
download
2
description
Below is our newest wave of data from our presidential election poll. These results will be displayed here in two different ways: first, as popular vote percentages and second as Electoral College distributions. SurveyMonkey has surveyed more than a million people from August 17th to October 30th. The results below, however, will be based only on the roughly 500,000 people surveyed from October 3rd through October 30th.
Transcript of SurveyMonkey 2012 Presidential Election Poll

! ! ! "#$"!%&'()*'+,)-.!/.'0,)1+!%1..!! ! ! "#$%$&!'()%(*+,!"#-.-,!/"!012#3+3%345!! ! ! .(61!'3%+71)4,!89:! ;$(*(!9&<21$*,!"#-.-,!=1*$3)!012#3+3%34$<2

!
!
"!
2345/6789:/6!!"#$"!%4/2;</9=;>?!/?/@=;89!%8??!
! !
SurveyMonkey (SM) facilitates survey deployment to 60 million respondents each month for 13 million researchers worldwide. Roughly half of this activity occurs in the United States. Due to this wide usage of our products and services, our monthly traffic broken down geographically provides a good approximation of the actual population density of the US. (See Figure 1.) A;B34/!$C SM Traffic and US Population Densities
32!%1DE.-,)1+!<'+(),F!
!
!
!
!
!
!
!
!
2E&G'F71+H'F!71+,I.F!=&-JJ)0!<'+(),F!
9<2$>(2$*4!2#1!"3&?%(2$3*!
=3?)@1A!!B)11#?441)-@3>,!CDDE!
!
!
#!
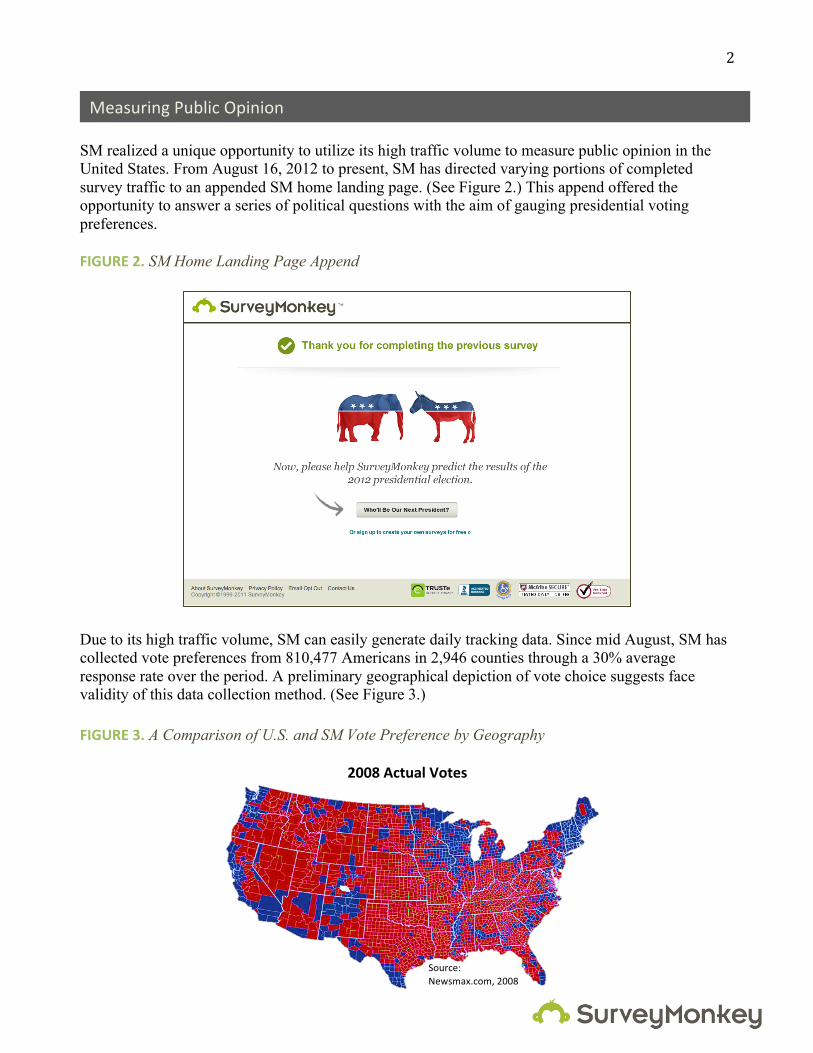
SM realized a unique opportunity to utilize its high traffic volume to measure public opinion in the United States. From August 16, 2012 to present, SM has directed varying portions of completed survey traffic to an appended SM home landing page. (See Figure 2.) This append offered the opportunity to answer a series of political questions with the aim of gauging presidential voting preferences.
A;B34/!"C SM Home Landing Page Append
Due to its high traffic volume, SM can easily generate daily tracking data. Since mid August, SM has collected vote preferences from 810,477 Americans in 2,946 counties through a 30% average response rate over the period. A preliminary geographical depiction of vote choice suggests face validity of this data collection method. (See Figure 3.) A;B34/!KC A Comparison of U.S. and SM Vote Preference by Geography
"##L!>0,E-.!51,'(!
01(<?)$*4!"?7%$@!:&$*$3*!
=3?)@1A!!F1G<>(H-@3>,!CDDI!

!
!
$!
2E&G'F71+H'F!"#$"!/.'0,)1+!2,E*F!
Respondents provided four pieces of information: their zip code, voting registration status, voting likelihood, and candidate preference. (See Appendix for the exact question wordings.) To gauge voting likelihood respondents were asked one of eleven different likely voter questions that are currently used by other polling firms.
The SM polling results below include only registered, likely voters. Of the 248,786 responses SM has recorded from October, 3 to October, 18, 91% were registered voters and 93% of those registered were likely voters. These remaining 191,387 registered, likely voters are summarized in the tables below. The data in Table 1 and Figure 4 show SM’s recent estimates of the national popular vote for Barack Obama and Mitt Romney using three and seven day trailing averages among likely voters. =>M?/!$C National Popular Vote Trailing Averages Among Likely Voters in October KN<>6! ONP! LN$#! PN$$! $#N$"! $$N$K! $"N$Q! $KN$R! $QN$S! $RN$O! $SN$L!
!"#$#%JE-KLM! JE-LLM! JE-JCM! JE-IDM! JN-DIM! JN-JCM! JE-CNM! JE-OPM! JE-EJM! JN-DDM!
!"#!$%& '!#'%(& ')#!$$& ''#"$*& !*#%%*& !!#"$*& !'#!(+& !(#,"+& !%#$)(& !%#+'*&
&'$()*%JE-CKM! JE-EOM! JE-LNM! JK-NJM! JK-JKM! JK-DJM! JE-ODM! JE-CKM! JE-LDM! JK-KNM!
!"#!()& '!#"('& ')#(%,& ''#(*%& !*#("$& !!#(("& !'#!!*& !(#,'%& !%#%)"& !%#,!!&
ON<>6! KNP! QN$#! RN$$! SN$"! ON$K! LN$Q! PN$R! $#N$S! $$N$O! $"N$L!
!"#$#%JE-ONM! JE-OLM! JE-KIM! JE-ICM! JE-EIM! JE-KEM! JE-EDM! JE-ENM! JE-IKM! JE-IEM!
)*#"))& )$#%*%& )+#)"!& ,(#(('& ,(#%'$& ,(#*,)& ,'#'!)& )"#+(!& )$#)%*& )"#$$*&
&'$()*%JE-DKM! JE-CDM! JK-PKM! JK-NKM! JK-POM! JE-DEM! JK-PIM! JK-IPM! JK-NLM! JK-NJM!
)*#'*'& )$#"$%& )$#$'(& )+#($"& )+#+*%& ,(#'+$& ,!#%"!& )"#'++& )*#,,(& )"#('$&
-./01! Q2(%$@$R1+!*?>71)<!()1!2#1!@3?*2<!3S!)1<&3*+1*2<!<?)6151+!S3)!2#(2!@1%%-! !
=0!"3%%$*4!T1<?%2<!

!
!
%!
Different telephone polling firms use slightly different methodologies, but they all face the common obstacles of hand-dialing mobile numbers and randomizing the dialing of landline numbers with computer aided telephone interviewing (CATI) software. Moreover, all studies require extensive “call-backs” to achieve adequate sample sizes. Once this arduous data collection is finished, data cleaning, collation, and analyses add additional time to the project before polling firms are able to release the data. The fact that SM can collect meaningful sample sizes to track trends on a daily basis allows for a high degree of sensitivity to media and political events. This method of tracking public opinion drastically reduces the lag-time between any given event and the publication of the impact of that even on public opinion. The large number of daily respondents allows SM to generate sensitive, daily estimates of the national popular vote. (See Figure 4 for the daily tracking history.) The figures below summarize the voting preferences of 753,685 likely voters (taken from a total pool of 852,674 respondents) surveyed by SM from 8/17/12 – 10/18/12. To compare the SM data to that which is publicly available, historical poll averages from 8/17/12 – 10/18/12 were downloaded from Real Clear Politics (RCP). (For more information about the polls that are included in these averages, see: www.RealClearPolitics.com.) A;B34/!QC Daily National Popular Vote Trailing Averages Among Likely Voters
The daily SM data is only weakly aligned with the RCP curve, with an r2 of .20 for Obama and an r2 of .21 for Romney. This daily tracker, however, is quite different from how poll data is typically reported. The RCP daily average is essentially a "poll of polls". It is a rolling, historical average of past poll data; the polls included in these RCP numbers span anywhere from a two to twelve day range. This time-lapse makes the numbers that are reported less volatile. Thus, a 3-day trailing average of SM data doubles the fit with the RCP curve, increasing r2 to .41 for Obama and .40 for Romney. Our 7-day average aligns even more closely to the RCP data, with r2 further increasing to .56 for Obama and.57 for Romney. (See Figure 5.)
T3>*15!!TF8!<&11@#!
:7(>(!.F8!<&11@#!
;$75(!(22(@U!
JNM!6$+13!%1(U1+!
L<2!+17(21!V")1<-W!
C*+!+17(21!V/"W!
O)+!+17(21!V")1<-W!
;$75(!7(@U%(<#!
!
!
&!
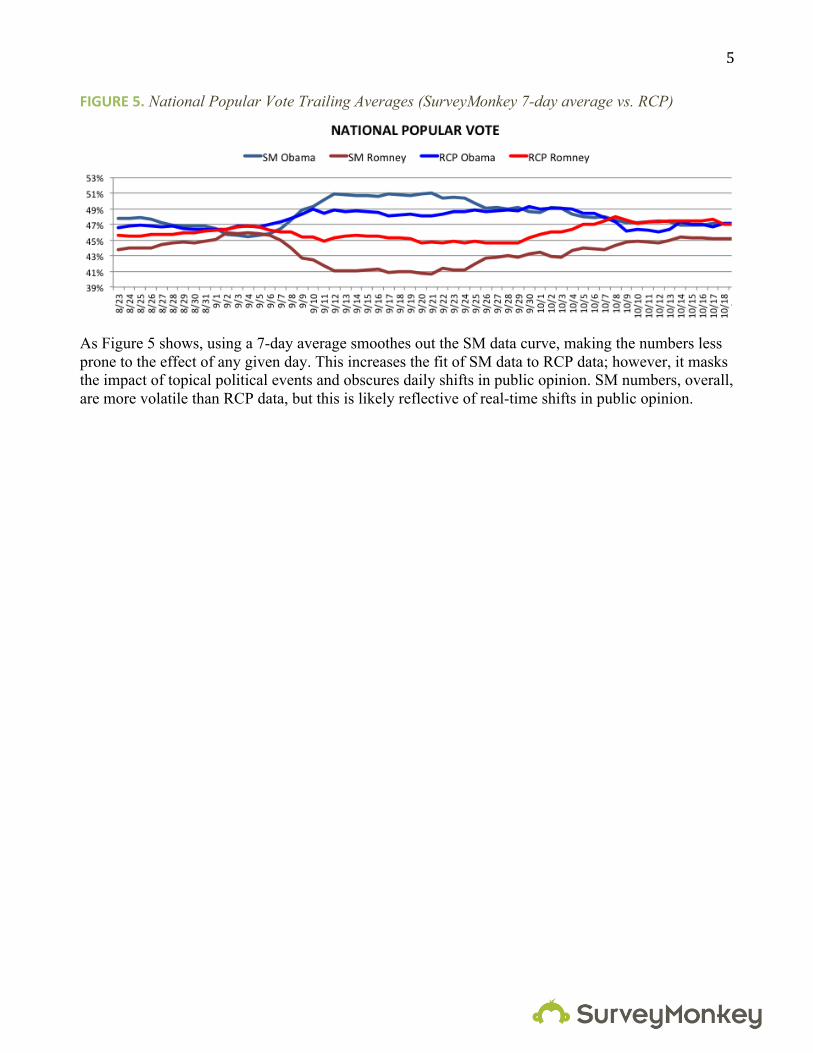
A;B34/!RC National Popular Vote Trailing Averages (SurveyMonkey 7-day average vs. RCP)
As Figure 5 shows, using a 7-day average smoothes out the SM data curve, making the numbers less prone to the effect of any given day. This increases the fit of SM data to RCP data; however, it masks the impact of topical political events and obscures daily shifts in public opinion. SM numbers, overall, are more volatile than RCP data, but this is likely reflective of real-time shifts in public opinion.

Voting Registration.
• X)1!53?!@?))1*2%5!(!)14$<21)1+!(*+!1%$4$7%1!6321),!3)!*32Y!
203&-.&!
Zip Code.
• Z#(2!$<!2#1!S$61[+$4$2!R$&!@3+1!S3)!2#1!(++)1<<!53?!)14$<21)1+!23!6321!S)3>,!3)!$S!53?\)1!*32!)14$<21)1+!23!6321,!G#(2!$<!2#1!R$&!@3+1!53?!G3?%+!?<1Y!
4.5067068089&
Voting Likelihood.
L- ]3G!>?@#!2#3?4#2!#(61!53?!4$61*!23!2#1!?&@3>$*4!1%1@2$3*!S3)!&)1<$+1*2Y!
:;</0&=&>./&?.@0&A6>B&=&><//>0&-.60&C.6D/&E6.F&!
C- .3!53?!#(&&1*!23!U*3G!G#1)1!&13&%1!G#3!%$61!$*!53?)!*1$4#73)#33+!43!23!6321Y!
203&-.&C.6D/&E6.F&!
O- ](61!53?!161)!6321+!$*!53?)!&)1@$*@2!3)!1%1@2$3*!+$<2)$@2Y!
203&-.&C.6D/&E6.F&!
J- ]3G!3S21*!G3?%+!53?!<(5!53?!6321!^!(%G(5<,!*1()%5!(%G(5<,!&()2!3S!2#1!2$>1,!3)!<1%+3>Y!
G>F=B3&-0=H>B&=>F=B3&I=H/&.J&/K0&/<@0&?0>8.@&-0L0H&C.6D/&E6.F&!
K- .3!53?,!53?)<1%S,!&%(*!23!6321!$*!2#1!1%1@2$3*!2#$<!F361>71),!3)!*32Y!
203&-.&C.6D/&E6.F&
!
!E- ]3G!@1)2($*!()1!53?!2#(2!53?!G$%%!6321Y!
GM3.>;/0>B&N0H/=<6&O=<H>B&N0H/=<6&-./&N0H/=<6&C.6D/&E6.F&!
N- ]3G!%$U1%5!()1!53?!23!6321!$*!F361>71)\<!&)1<$+1*2$(%!1%1@2$3*Y!
PQ/H0@0>B&><E0>B&R0HB&><E0>B&?.@0FK=/&><E0>B&?><SK/>B&><E0>B&-./&=/&=>>&><E0>B&!
I- B#$*U$*4!7(@U!23!2#1!1%1@2$3*<!#1%+!S3)!83*4)1<<!$*!F361>71)!CDLD,!+$+!2#$*4<!@3>1!?&!2#(2!U1&2!53?!S)3>!632$*4,!3)!+$+!53?!#(&&1*!23!6321Y!
203#&L./08&-.#&8<8&6./&L./0&C.6D/&E6.F&!
P- ]3G!$>&3)2(*2!$<!2#1!&)1<$+1*2$(%!1%1@2$3*!23!53?Y!
PQ/H0@0>B&<@5.H/=6/&R0HB&<@5.H/=6/&?.@0FK=/&<@5.H/=6/&?><SK/>B&<@5.H/=6/&-./&=/&=>>&<@5.H/=6/&!
LD- QS!2#1!1%1@2$3*!G1)1!#1%+!23>3))3G,!G3?%+!53?!U*3G!G#1)1!23!43!6321Y!
203&-.&!
LL- B#$*U$*4!7(@U!23!2#1!1%1@2$3*<!#1%+!S3)!83*4)1<<!$*!F361>71)!CDLD,!+$+!53?!6321Y!
203#&L./08&-.#&8<8&6./&L./0&!
Voting Preference. • =?&&3<1!2#1!&)1<$+1*2$(%!1%1@2$3*!G1)1!#1%+!
23+(5-!Z#3!G3?%+!53?!71!%$U1%5!23!6321!S3)Y!T=H=NE&AM=@=&U<//&V.@60B&C.6D/&E6.F&W&A/K0H&
X&&1*+$H!^!_?1<2$3**($)1!


