Survey Results for Citizens and Neighborhood Contacts...
55
01-2004A Performance Audit Survey Results for Citizens and Neighborhood Contacts November 2004 City Auditor’s Office City of Kansas City, Missouri
Transcript of Survey Results for Citizens and Neighborhood Contacts...
01-2004A
Performance Audit Survey Results for Citizens and Neighborhood Contacts
November 2004
City Auditor’s Office
City of Kansas City, Missouri
November 16, 2004 Honorable Mayor and Members of the City Council: The City Manager requested that, while surveying residents’ perceptions of city services for our third annual city services performance report, we also survey citizens identified as contacts for the city’s neighborhood organizations. Using a list of neighborhood contacts provided by the Neighborhood and Community Services Department, we obtained their perceptions of city services. Residents’ perceptions of service quality are related to their overall perception of the city. In other words, residents who are more satisfied with city services also tend to be more satisfied with Kansas City and their neighborhoods. The perceptions of neighborhood contacts may also reflect the concerns of the neighborhood organizations as they seek to improve government responsiveness. Because the neighborhood contacts may have more direct contact with city government, information on the perceptions of both residents and neighborhood contacts can be important when examining the effective distribution of scarce resources. However, while the City Auditor’s Office has annually sought the opinions of residents, we do not anticipate surveying neighborhood contacts as frequently. Most responses from the neighborhood contacts mirrored those received from our randomly selected residents, however, there were instances when the survey responses were significantly different. While more than half of residents were satisfied with the overall services provided by the city, only about a third of neighborhood contacts felt the same. Twice as many residents as neighborhood contacts were satisfied with specific services such as code enforcement and storm runoff efforts. Neighborhood contacts were also less satisfied with street-related maintenance efforts, specifically sidewalk conditions, street cleanliness, and mowing and trimming along city streets. In the area of public safety, more residents than neighborhood contacts were satisfied with animal control services. No significant differences were found in satisfaction with Parks and Recreation services, except for adult athletic programs where more residents than neighborhood contacts reported satisfaction. Neighborhood contacts appear to visit the city’s parks more frequently. While about a quarter of neighborhood contacts report seldom or never visiting any parks in the last 12 months, over 40 percent of residents gave the same response. Still, for many parks and recreation activities, large portions from both groups responded “don’t know” when asked to rate their satisfaction with these services.

In the area of codes enforcement, neighborhood contacts were significantly less satisfied with the services provided by the city than residents. No more than 20 percent of neighborhood contacts were satisfied with sign regulation efforts, weed cutting, clean up of private property, and enforcement of illegal dumping. In all cases, resident satisfaction was much higher. We would like to thank Dr. Robert Herman, Professor of Organizational Behavior at the L. P. Cookingham Institute, Bloch School of Business and Public Administration, University of Missouri at Kansas City, for his assistance in identifying significant differences between resident and neighborhood contact responses. The audit team for this report was Joan Pu and Gary White. Mark Funkhouser City Auditor

_____________________________________________________________________________________ Survey Results for Citizens and Neighborhood Contacts _____________________________________________________________________________________ Table of Contents
Introduction 1 Objectives 1 Scope and Methodology 2
Survey Methodology 2 Background 4
Demographic Differences 4
Results 7 Summary of Resident and Neighborhood Contact Opinions 7
Overall Satisfaction with City Services 8 Street Maintenance and Related Activities 11 Public Safety 13 Parks and Recreation 14 Neighborhood Livability 16
Appendix A 21 Survey Results 21
_____________________________________________________________________________________ Survey Results for Citizens and Neighborhood Contacts _____________________________________________________________________________________ List of Exhibits Exhibit 1. Comparison of Survey Respondent Demographics to 2000 Census - Gender 2 Exhibit 2. Comparison of Survey Respondent Demographics to 2000 Census – Race/Ethnicity 2 Exhibit 3. Comparison of Survey Respondent Demographics Regarding Home Ownership 4 Exhibit 4. Comparison of Survey Respondent Demographics Regarding Race/Ethnicity 4 Exhibit 5. Comparison of Survey Respondent Demographics Regarding Years of Age 5 Exhibit 6. Comparison of Survey Respondent Demographics Regarding Household Income 5 Exhibit 7. Comparison of Survey Respondent Demographics Regarding Internet Usage from Home 5 Exhibit 8. Comparison of Survey Respondent Demographics Regarding Interest in Meeting
to Discuss Stormwater Issues 5 Exhibit 9. How Do You Feel About City Provided Services? 8 Exhibit 10. Percent Satisfied with Individual City Services 9 Exhibit 11. How Do You Feel About Code Enforcement Efforts? 9 Exhibit 12. How Do You Feel About Stormwater Runoff/Management Efforts? 10 Exhibit 13. How Do You Feel About Local Public Health Services? 10 Exhibit 14. City Services That Should Be Emphasized Over the Next Two Years 11 Exhibit 15. How Do You Feel About Sidewalk Conditions? 11 Exhibit 16. How Do You Feel About Mowing/Trimming Along City Streets? 12 Exhibit 17. How Do You Feel About Street Cleanliness? 12 Exhibit 18. Street Maintenance and Related Activities that Should Be Emphasized Over
the Next Two Years 13 Exhibit 19. How Do You Feel About Animal Control Activities? 13 Exhibit 20. Public Safety Activities That Should Be Emphasized Over the Next Two Years 14 Exhibit 21. How Do You Feel About Adult Recreation Programs? 14 Exhibit 22. How Many Times Have You Visited a KCMO Park in the Past 12 Months? 15 Exhibit 23. Parks and Recreation Activities That Should Be Emphasized Over the Next Two Years 15 Exhibit 24. Percent of “Don’t Know” Responses When Asked to Assess Individual Parks
and Recreation Services 16 Exhibit 25. How Do You Feel About the Enforcement of Requirements to Clean Up Litter
and Debris on Private Property? 17 Exhibit 26. How Do You Feel About the Enforcement of Weed Mowing/Cutting Requirements
on Private Property? 17 Exhibit 27. How Do You Feel About the Enforcement of Residential Property Maintenance
Requirements? 18 Exhibit 28. How Do You Feel About the Enforcement of Exterior Business Property Maintenance
Requirements? 18 Exhibit 29. How Do You Feel About Efforts to Enforce Codes Designed to Protect Public Health and
Safety? 19 Exhibit 30. How Do You Feel About Efforts to Enforce Sign Regulations? 19 Exhibit 31. How Do You Feel About Efforts to Prevent Illegal Dumping? 20 Exhibit 32. Code Enforcement Activities That Should be Emphasized Over the Next Two Years 20

1
_____________________________________________________________________________ Introduction _____________________________________________________________________________ Objectives
We conducted this performance audit pursuant to Article II, Section 13 of the Charter of Kansas City, Missouri, which establishes the Office of the City Auditor and outlines the City Auditor’s primary duties. In late 2003, we contracted with ETC Institute to conduct a telephone survey to measure citizen satisfaction with city services and identify which services should receive the most emphasis over the next two years. Specific services included in the survey were streets, public safety (including police, fire, and ambulance service), parks and recreation, water and sewer services, services related to neighborhood livability, and the overall quality of life. The results of these surveys were reported in our 2003 City Services Performance Report.1 The City Manager requested that, while completing the resident surveys, we also survey citizens identified as contacts for the city’s neighborhood organizations. The purpose of this audit is to report the results of surveying the neighborhood contacts and compare them to the perceptions of surveyed residents.
A performance audit systematically examines evidence to independently assess the performance and management of a program against objective criteria. Performance audits provide information to improve program operations and facilitate decision-making.2 This audit was designed to answer the following question:
• Do the opinions of neighborhood contacts match those of a random sample of Kansas Citians?
1 City Services Performance Report for Fiscal Year 2003, Office of the City Auditor, Kansas City, Missouri, March 2004. 2 Comptroller General of the United States, Government Auditing Standards (Washington, DC: U.S. Government Printing Office, 2003), p. 21.

Survey Results for Citizens and Neighborhood Contacts
2
_____________________________________________________________________________ Scope and Methodology
Survey Methodology Citizens surveyed. Telephone surveys with randomly selected residents were conducted in November and December 2003 and administered to 1,210 households throughout the city. At least 200 surveys were completed in each of the city’s six council districts. The survey had an overall response rate of 52 percent and adequately represents the city’s gender, based on the 2000 Census. (See Exhibit 1.) Exhibit 1. Comparison of Survey Respondent Demographics to 2000 Census – Gender
Male Female Census 47.6% 52.4% 2003 Survey 45.0% 55.0%
Sources: ETC Institute DirectionFinder Survey 2003 and Census 2000 Supplementary Survey Summary Tables.
The survey also adequately represents the city’s race/ethnicity characteristics. (See Exhibit 2.) Exhibit 2. Comparison of Survey Respondent Demographics to 2000 Census – Race/Ethnicity
White
Black/African American
Other3
Census 59.6% 35.4% 5.0% 2003 Survey 61.7% 35.1% 3.2% Sources: ETC Institute DirectionFinder Survey 2003 and Census 2000
Supplementary Survey Summary Tables.
Survey results have a 95 percent confidence level and a margin of error up to +/- 2.8 percent. This means that out of 100 samples drawn in the same manner, we would expect 95 to yield results within the specified error range. Neighborhood contacts surveyed. A list identifying 256 contacts representing neighborhood groups who registered with the city’s Neighborhood and Community Services Department (NCSD) was also provided to ETC. One hundred and sixty neighborhood contacts completed our survey. Twenty-two were not contacted because the telephone numbers provided were invalid. The remaining 74 were not
3 The “other” category includes Asian/Pacific Islander, American Indian/Eskimo, Other, and those who refused to answer the question.

Introduction
3
reached after at least six attempts. The responses from the 160 contacts were used to identify the opinions of all neighborhood contacts with a 95 percent confidence level and a margin of error up to +/- 4.8 percent. According to NCSD staff, the neighborhood contacts have more interaction with city staff than residents. They invite city staff to attend meetings where their concerns and issues are addressed. They receive quarterly newsletters from NCSD, more frequently communicate with individual city staff through phone calls and e-mails, and more frequently attend council committee meetings. Significant differences defined. We sought to identify significant differences in the perceptions of city services by randomly selected citizens and specifically identified neighborhood contacts. For this effort, we defined significant differences as responses that are at least 10 percentage points apart, after accounting for the error ranges of each set of responses. For example, citizens and neighborhood contacts were asked about their overall satisfaction with services provided by the city. For citizens, 32.9 percent responded “neutral” compared to 43.1 percent of neighborhood contacts. While the percentage difference in “neutral” responses is more than 10 percent, accounting for the error ranges of the two responses results in a difference of less than three percent. Therefore the differences in the two responses are not considered significant. The citizen survey questions covered six specific areas: • Streets • Public Safety • Parks and Recreation • Water and Sewer Services • Neighborhood Livability • Overall Quality of Life Using the above criteria, we did not identify any significant differences in resident and neighborhood contact responses for questions involving water and sewer services or overall quality of life. We conducted this audit in accordance with generally accepted government auditing standards. No information was omitted from this report because it was deemed privileged or confidential.
Survey Results for Citizens and Neighborhood Contacts
4
_____________________________________________________________________________ Background
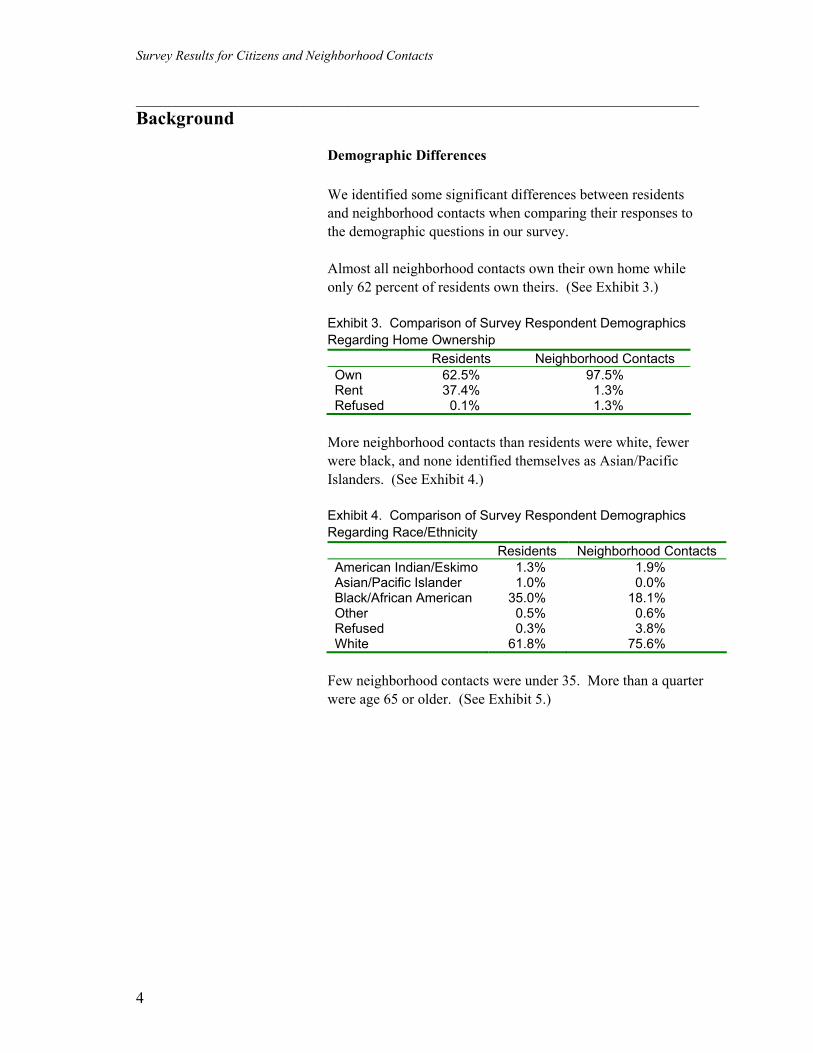
Demographic Differences We identified some significant differences between residents and neighborhood contacts when comparing their responses to the demographic questions in our survey. Almost all neighborhood contacts own their own home while only 62 percent of residents own theirs. (See Exhibit 3.) Exhibit 3. Comparison of Survey Respondent Demographics Regarding Home Ownership Residents Neighborhood Contacts Own 62.5% 97.5% Rent 37.4% 1.3% Refused 0.1% 1.3%
More neighborhood contacts than residents were white, fewer were black, and none identified themselves as Asian/Pacific Islanders. (See Exhibit 4.) Exhibit 4. Comparison of Survey Respondent Demographics Regarding Race/Ethnicity Residents Neighborhood Contacts American Indian/Eskimo 1.3% 1.9% Asian/Pacific Islander 1.0% 0.0% Black/African American 35.0% 18.1% Other 0.5% 0.6% Refused 0.3% 3.8% White 61.8% 75.6%
Few neighborhood contacts were under 35. More than a quarter were age 65 or older. (See Exhibit 5.)
Introduction
5
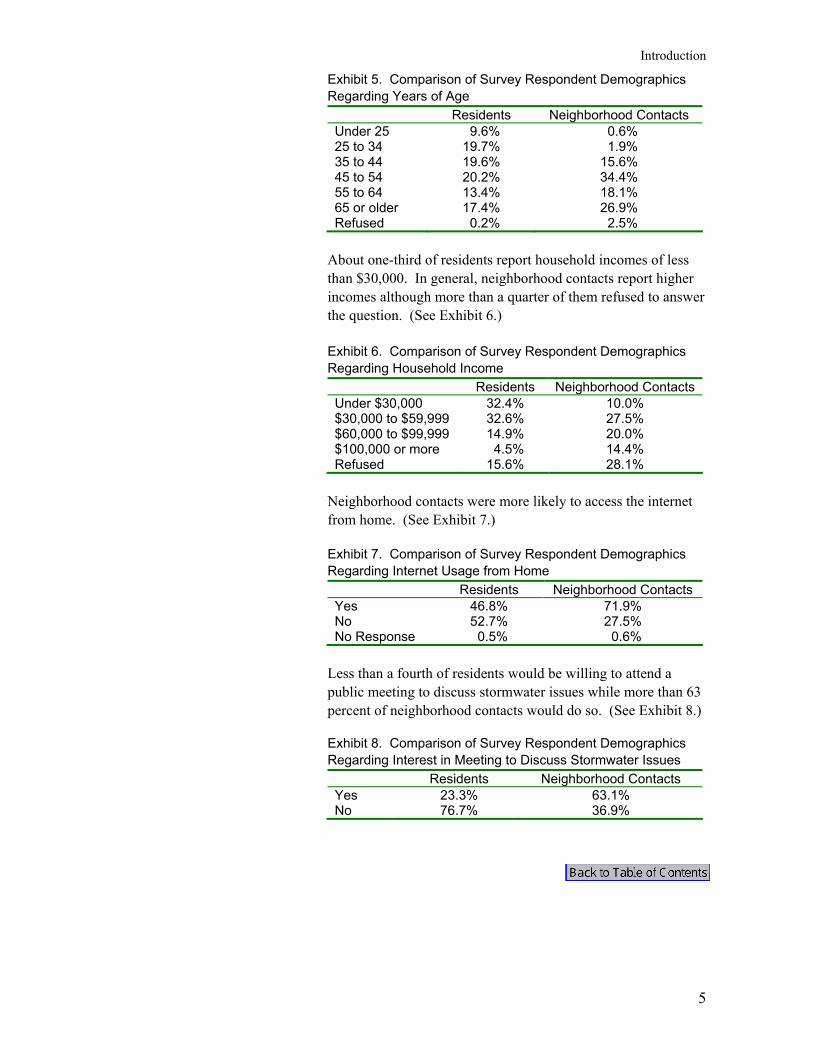
Exhibit 5. Comparison of Survey Respondent Demographics Regarding Years of Age Residents Neighborhood Contacts Under 25 9.6% 0.6% 25 to 34 19.7% 1.9% 35 to 44 19.6% 15.6% 45 to 54 20.2% 34.4% 55 to 64 13.4% 18.1% 65 or older 17.4% 26.9% Refused 0.2% 2.5%
About one-third of residents report household incomes of less than $30,000. In general, neighborhood contacts report higher incomes although more than a quarter of them refused to answer the question. (See Exhibit 6.) Exhibit 6. Comparison of Survey Respondent Demographics Regarding Household Income Residents Neighborhood Contacts Under $30,000 32.4% 10.0% $30,000 to $59,999 32.6% 27.5% $60,000 to $99,999 14.9% 20.0% $100,000 or more 4.5% 14.4% Refused 15.6% 28.1%
Neighborhood contacts were more likely to access the internet from home. (See Exhibit 7.) Exhibit 7. Comparison of Survey Respondent Demographics Regarding Internet Usage from Home Residents Neighborhood Contacts Yes 46.8% 71.9% No 52.7% 27.5% No Response 0.5% 0.6%
Less than a fourth of residents would be willing to attend a public meeting to discuss stormwater issues while more than 63 percent of neighborhood contacts would do so. (See Exhibit 8.) Exhibit 8. Comparison of Survey Respondent Demographics Regarding Interest in Meeting to Discuss Stormwater Issues Residents Neighborhood Contacts Yes 23.3% 63.1% No 76.7% 36.9%

Survey Results for Citizens and Neighborhood Contacts
6
7
______________________________________________________________________________ Results ______________________________________________________________________________ Summary of Resident and Neighborhood Contact Opinions
This report identifies differences in the level of satisfaction with city services provided by a random sample of city residents and identified neighborhood contacts. The City Manager requested surveying neighborhood contacts for their opinions of city services. Most neighborhood contact responses mirrored those received from our randomly selected residents, however, there were instances when the survey responses were significantly different. While more than half of residents were satisfied with the overall services provided by the city, only about a third of neighborhood contacts felt the same. For specific services such as code enforcement and storm runoff efforts, twice as many residents were satisfied as the neighborhood contacts. Neighborhood contacts were less satisfied than residents with the condition of sidewalks, street cleanliness, and mowing and trimming along city streets. In the public safety area, more residents than neighborhood contacts were satisfied with animal control services. No significant differences were found in satisfaction with Parks and Recreation services, except more residents were satisfied with adult athletic programs than neighborhood contacts. Neighborhood contacts also appear to visit the city’s parks more frequently. Still, for many parks and recreation activities, large portions from both groups responded “don’t know” when asked about individual parks and recreation activities. For codes enforcement efforts, no more than 20 percent of neighborhood contacts were satisfied with sign regulations, weed cutting, requirements to clean up private property and enforcement of illegal dumping prohibitions. In all cases, resident satisfaction was much higher.

Survey Results for Citizens and Neighborhood Contacts
8
Overall Satisfaction with City Services More than half of residents were either satisfied or very satisfied with the services provided by the city. Only a third of neighborhood contacts felt the same. (See Exhibit 9.) Exhibit 9. How do you feel about city provided services?
52%
33%
13%
2%
34%
43%
14%
9%
0%
10%
20%
30%
40%
50%
60%
satisified neutral dissatisfied don't know
Residents Neighborhood Contacts
Neighborhood contacts are also generally less satisfied with individual city services. Residents were generally more satisfied with individual city services than neighborhood contacts. More residents than neighborhood contacts were satisfied with parks and recreation programs and facilities; maintenance of streets, buildings, and facilities; water services; city communications, local public health services, traffic flow, and city convention facilities. More neighborhood contacts than residents were satisfied with police, fire, and ambulance services; airport facilities; and customer service. (See Exhibit 10.) However, none of these identified differences are significant, according to our criteria.

Results
9
Exhibit 10. Percent satisfied with individual city services
0% 10% 20% 30% 40% 50% 60% 70% 80%
city convention facilities?
airport facilities?
flow of traff ic?
local public health services?
city's stormw ater runoff/management system?
effectiveness of city communication w ith the public?
customer service received from employees?
enforcement of city codes & ordinances?
city w ater utilities?
maintenance of city streets/bldgs/facilities?
city parks & recreation programs & facilities?
police, f ire & ambulance services?
Residents Neighborhood Contacts
Significant differences in satisfaction were found with codes enforcement and stormwater runoff. Twice as many residents as neighborhood contacts were satisfied with the city’s codes enforcement efforts (includes enforcing the clean up of litter and debris on private property, mowing and weed cutting on private property, exterior maintenance on business and residential property, and illegal dumping prohibitions). Twice as many residents as neighborhood contacts were satisfied with the city’s stormwater runoff/management system (the city’s efforts to control the volume/quantity of storm water generated by area rainfall) then neighborhood contacts. (See Exhibits 11 and 12.) Exhibit 11. How do you feel about code enforcement efforts?
42%
25%
20%
12%
20%
31%
46%
4%
0%
10%
20%
30%
40%
50%
satisfied neutral dissatisfied don't know
Residents Neighborhood Contacts

Survey Results for Citizens and Neighborhood Contacts
10
Exhibit 12. How do you feel about stormwater runoff/management efforts?
42%
26%23%
10%
21%
26%
42%
11%
0%
10%
20%
30%
40%
50%
satisfied neutral dissatisfied don't know
Residents Neighborhood Contacts
More neighborhood contacts unable to evaluate local health services. When asked how satisfied they were with local health services, a third of neighborhood contacts responded “don’t know,” while about 16 percent of residents gave the same response. (See Exhibit 13.) Exhibit 13. How do you feel about local public health services?
51%
20%
13%16%
36%
23%
9%
33%
0%
10%
20%
30%
40%
50%
60%
satisified neutral dissatisfied don't know
Residents Neighborhood Contacts
Differences in service priorities were also found. When asked which city services should receive the most emphasis from city leaders over the next two years, both groups agreed the maintenance of city streets, buildings, and facilities as their top choice, although half of the neighborhood contacts selected this activity, compared to over 70 percent of residents. For residents, the second choice was flow of traffic, while for neighborhood contacts, that selection ranked seventh. The second
Results
11
highest priority of the neighborhood contacts was the enforcement of city codes and ordinances. (See Exhibit 14.)
Exhibit 14. City Services That Should Be Emphasized Over the Next Two Years Residents Percent Neighborhood Contacts Percent
Maintenance of Streets/Buildings/Facilities
72.4%
Maintenance of Streets/Buildings/Facilities
50.0%
Flow of Traffic 27.9% Codes Enforcement 33.1% Stormwater Runoff/Management 24.3% Stormwater Runoff/Management 28.1% Codes Enforcement 23.8% Parks and Recreation 19.4% Effectiveness of City Communications 22.2% Police, Fire and Ambulance Services 18.1% Police, Fire and Ambulance Services 22.1% Effectiveness of City Communications 13.8% Parks and Recreation 19.0% Flow of Traffic 13.1% Water Utilities 15.0% Convention Facilities 12.5% Quality of Customer Service 13.3% Quality of Customer Service 8.1% Public Health Services 12.6% Water Utilities 7.5% Convention Facilities 6.5% Public Health Services 4.4% Airport Facilities 4.8% Airport Facilities 4.4%
Street Maintenance and Related Activities
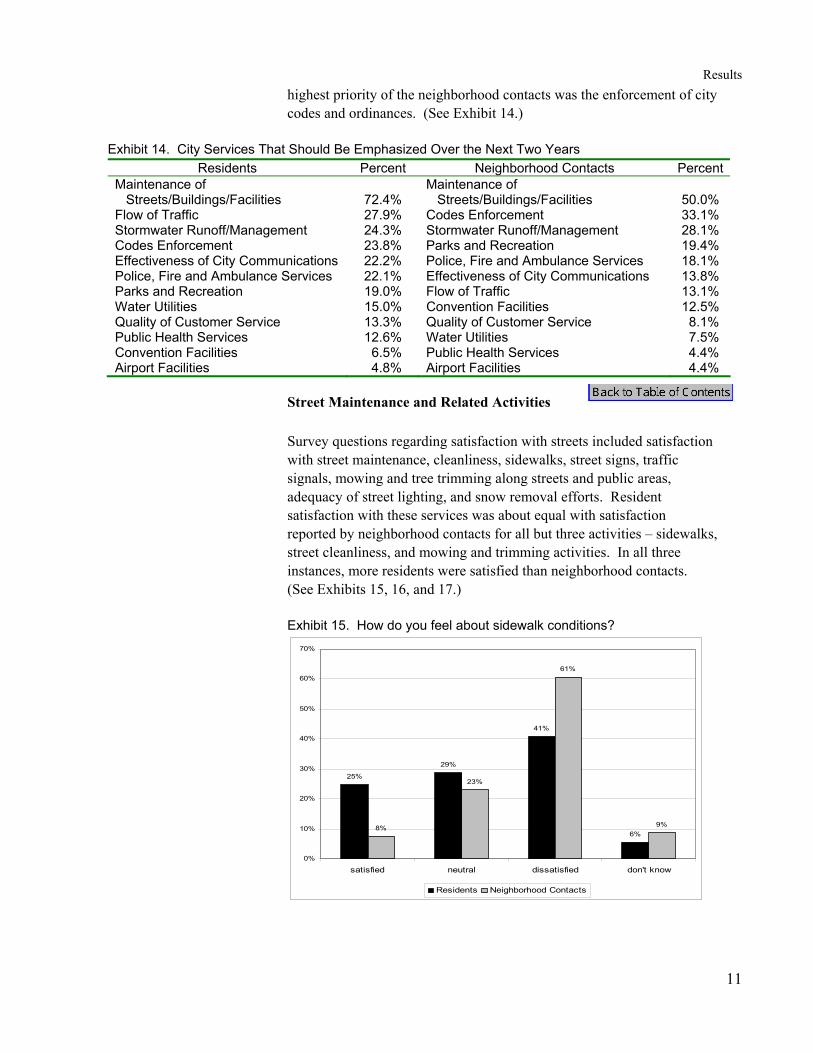
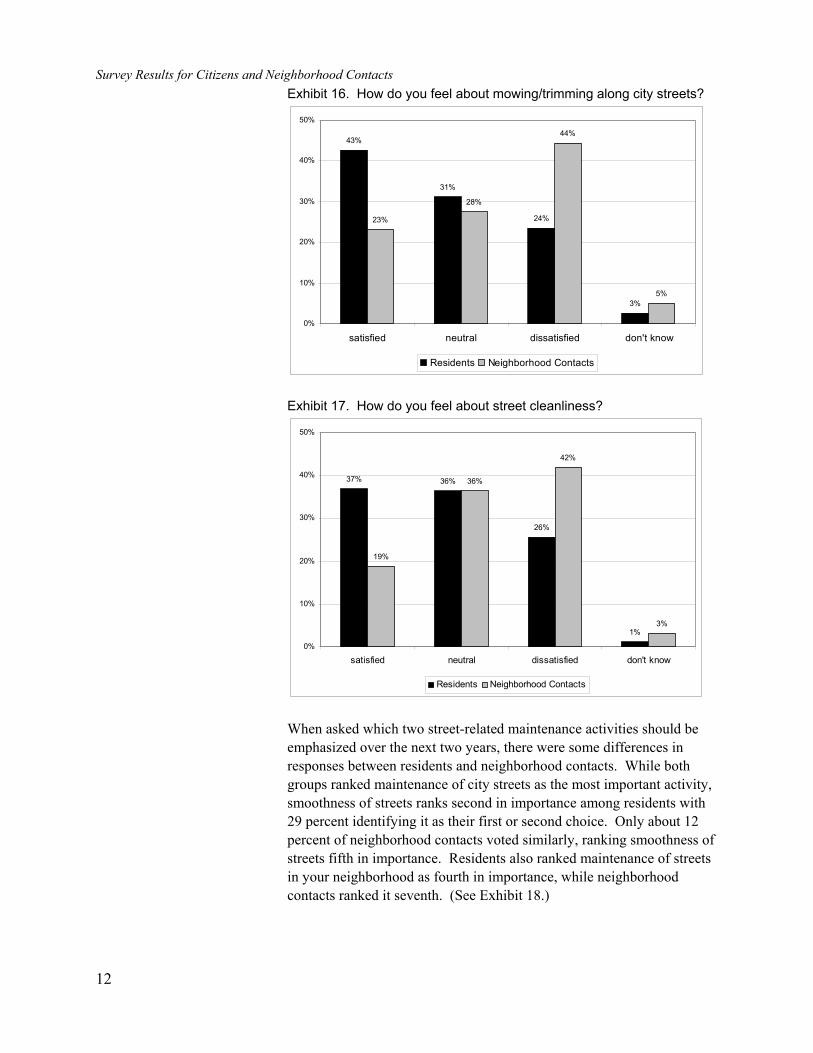
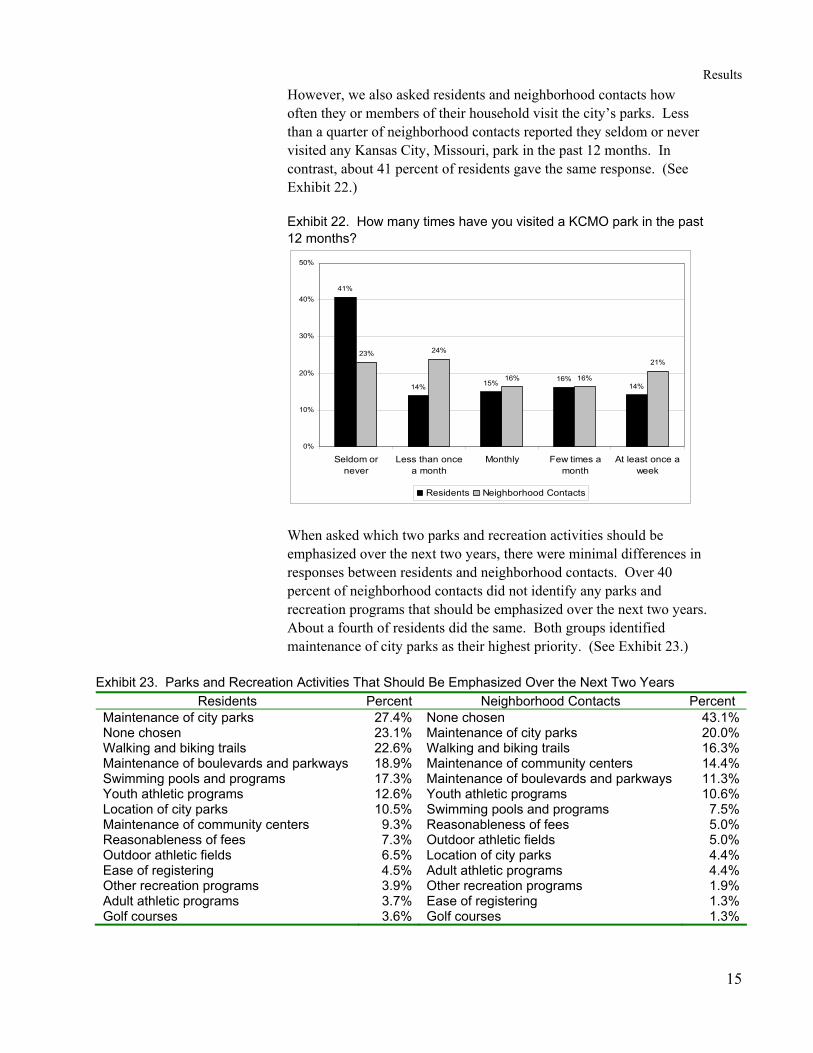
Survey questions regarding satisfaction with streets included satisfaction with street maintenance, cleanliness, sidewalks, street signs, traffic signals, mowing and tree trimming along streets and public areas, adequacy of street lighting, and snow removal efforts. Resident satisfaction with these services was about equal with satisfaction reported by neighborhood contacts for all but three activities – sidewalks, street cleanliness, and mowing and trimming activities. In all three instances, more residents were satisfied than neighborhood contacts. (See Exhibits 15, 16, and 17.) Exhibit 15. How do you feel about sidewalk conditions?
25%
29%
41%
6%8%
23%
61%
9%
0%
10%
20%
30%
40%
50%
60%
70%
satisfied neutral dissatisfied don't know
Residents Neighborhood Contacts
Survey Results for Citizens and Neighborhood Contacts
12
Exhibit 16. How do you feel about mowing/trimming along city streets?
43%
31%
24%
3%
23%
28%
44%
5%
0%
10%
20%
30%
40%
50%
satisfied neutral dissatisfied don't know
Residents Neighborhood Contacts
Exhibit 17. How do you feel about street cleanliness?
37% 36%
26%
1%
19%
36%
42%
3%
0%
10%
20%
30%
40%
50%
satisfied neutral dissatisfied don't know
Residents Neighborhood Contacts
When asked which two street-related maintenance activities should be emphasized over the next two years, there were some differences in responses between residents and neighborhood contacts. While both groups ranked maintenance of city streets as the most important activity, smoothness of streets ranks second in importance among residents with 29 percent identifying it as their first or second choice. Only about 12 percent of neighborhood contacts voted similarly, ranking smoothness of streets fifth in importance. Residents also ranked maintenance of streets in your neighborhood as fourth in importance, while neighborhood contacts ranked it seventh. (See Exhibit 18.)

Results
13
Exhibit 18. Street Maintenance and Related Activities That Should Be Emphasized Over the Next Two Years Residents Percent Neighborhood Contacts Percent
Maintenance of city streets 41.9% Maintenance of city streets 35.0% Smoothness of streets 29.0% Condition of sidewalks in city 19.4% Snow removal in residential areas 22.7% Timeliness of the removal of
abandoned cars 18.8%
Maintenance of streets in your neighborhood
20.9% Snow removal in residential areas 15.6%
Condition of sidewalks in city 13.1% Smoothness of city streets 12.5% Maintenance/preservation of downtown KCMO
11.1% Cleanliness of streets & public areas 11.3%
Timeliness of the removal of abandoned cars
9.8% Mowing/trimming along city streets 11.3%
Cleanliness of city streets & public areas
8.6% Maintenance of streets in your neighborhood
6.9%
Mowing/trimming along city streets 6.2% Quality of trash collection services 6.9% Snow removal on major city streets 5.0% Adequacy of city street lighting 6.9% Quality of trash collection services 4.7% Maintenance of street signs 6.3% Adequacy of city street lighting 4.1% Maintenance/preservation of
downtown KCMO 5.0%
Maintenance of traffic signals 3.4% Snow removal on major city streets 4.4% Maintenance of street signs 2.6% Maintenance of traffic signals 1.3% Maintenance of city buildings 1.9% Maintenance of city buildings 0.0%
Public Safety Questions regarding satisfaction with public safety included police activities, fire and ambulance efforts, municipal court, and animal control. There were no significant differences in satisfaction with police, fire, ambulance, and municipal court activities. For animal control, more residents reported satisfaction with animal control activities than neighborhood contacts. (See Exhibit 19.) Exhibit 19. How do you feel about animal control activities?
43%
26%
21%
10%
24% 24%
39%
13%
0%
10%
20%
30%
40%
50%
satisfied neutral dissatisfied don't know
Residents Neighborhood Contacts

Survey Results for Citizens and Neighborhood Contacts
14
When asked which public safety activities (including police activities, fire, ambulance, municipal court, and animal control efforts) should be emphasized over the next two years, there were some differences in priorities between residents and neighborhood organization contacts. About a third of residents thought local police protection was most important, while a fourth of neighborhood contacts reported that either a police presence in neighbor-hoods or animal control efforts should be emphasized. (See Exhibit 20.)
Exhibit 20. Public Safety Activities That Should Be Emphasized Over the Next Two Years
Residents Percent Neighborhood Contacts PercentLocal police protection 30.2% Visibility of police in neighborhoods 23.8%Efforts to prevent crime 29.3% Animal Control 23.8%Visibility of police in neighborhoods 29.2% Enforcement of local traffic laws 22.5%Animal Control 19.4% Local police protection 18.8%Visibility of police in retail areas 17.4% Municipal Court 13.1%Enforcement of local traffic laws 15.5% Visibility of police in retail areas 10.6%Municipal Court 10.4% Quick response to emergencies 10.6%Quick response to emergencies 8.8% Fire protection & rescue services 9.4%Local ambulance service 6.8% Efforts to prevent crime 8.8%Fire protection & rescue services 5.1% Local ambulance service 8.1%Efforts to enhance fire protection 3.7% Efforts to enhance fire protection 1.3%
Parks and Recreation Survey questions regarding parks and recreation efforts asked opinions about park and community center maintenance, the location of parks, and satisfaction with swimming pools, golf courses, walking/hiking trails, athletic fields, and recreation programs. There were no significant differences in satisfaction between residents and neighborhood contacts, except when asked about adult athletic programs. In that case, while almost a quarter of residents reported satisfaction, the percentage was less than eight percent for neighborhood contacts. (See Exhibit 21.) Exhibit 21. How do you feel about adult recreation programs?
23% 22%
13%
43%
8%
23%
14%
55%
0%
10%
20%
30%
40%
50%
60%
satisfied neutral dissatisfied don't know
Residents Neighborhood Contacts
Results
15
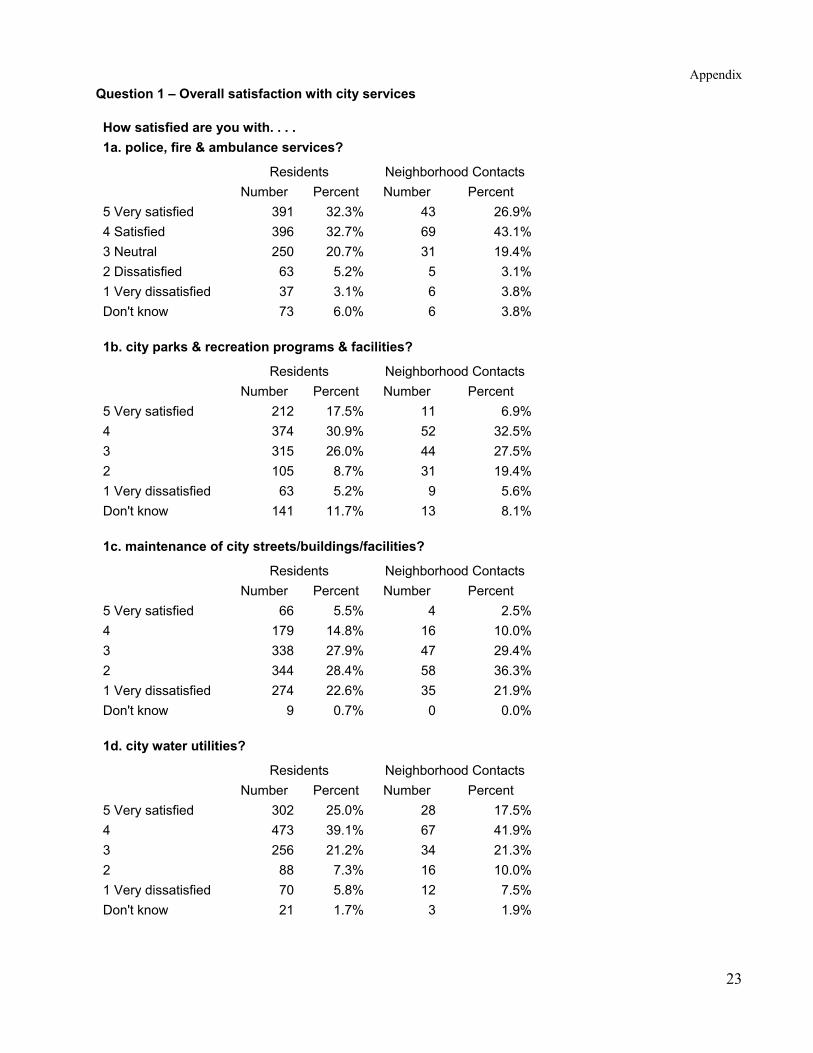
However, we also asked residents and neighborhood contacts how often they or members of their household visit the city’s parks. Less than a quarter of neighborhood contacts reported they seldom or never visited any Kansas City, Missouri, park in the past 12 months. In contrast, about 41 percent of residents gave the same response. (See Exhibit 22.) Exhibit 22. How many times have you visited a KCMO park in the past 12 months?
41%
14% 15% 16%14%
23% 24%
16% 16%
21%
0%
10%
20%
30%
40%
50%
Seldom ornever
Less than oncea month
Monthly Few times amonth
At least once aweek
Residents Neighborhood Contacts
When asked which two parks and recreation activities should be emphasized over the next two years, there were minimal differences in responses between residents and neighborhood contacts. Over 40 percent of neighborhood contacts did not identify any parks and recreation programs that should be emphasized over the next two years. About a fourth of residents did the same. Both groups identified maintenance of city parks as their highest priority. (See Exhibit 23.)
Exhibit 23. Parks and Recreation Activities That Should Be Emphasized Over the Next Two Years
Residents Percent Neighborhood Contacts Percent Maintenance of city parks 27.4% None chosen 43.1%None chosen 23.1% Maintenance of city parks 20.0%Walking and biking trails 22.6% Walking and biking trails 16.3%Maintenance of boulevards and parkways 18.9% Maintenance of community centers 14.4%Swimming pools and programs 17.3% Maintenance of boulevards and parkways 11.3%Youth athletic programs 12.6% Youth athletic programs 10.6%Location of city parks 10.5% Swimming pools and programs 7.5%Maintenance of community centers 9.3% Reasonableness of fees 5.0%Reasonableness of fees 7.3% Outdoor athletic fields 5.0%Outdoor athletic fields 6.5% Location of city parks 4.4%Ease of registering 4.5% Adult athletic programs 4.4%Other recreation programs 3.9% Other recreation programs 1.9%Adult athletic programs 3.7% Ease of registering 1.3%Golf courses 3.6% Golf courses 1.3%

Survey Results for Citizens and Neighborhood Contacts
16
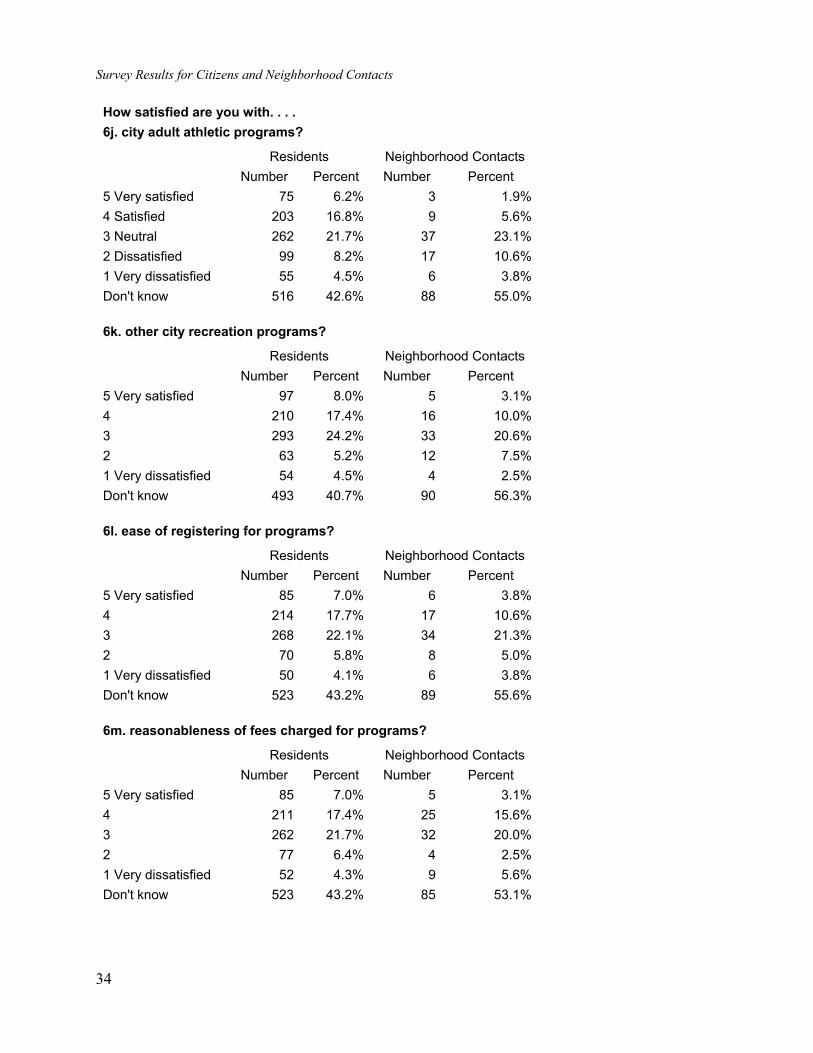
Knowledge of parks and recreation services is limited. When asked for their opinions of parks and recreation activities, many residents and neighborhood contacts responded “don’t know.” Just under half of residents responded “don’t know” when asked to rate their satisfaction with city golf courses. More than half of the neighborhood contacts responded “don’t know” when asked about city golf courses and aspects of the department’s recreation programs. (See Exhibit 24.)
Exhibit 24. Percent of “Don’t Know” Responses When Asked to Assess Individual Parks and Recreation Services Question – How satisfied are you with. . . .
Residents
Neighborhood Contacts
City golf courses? 47.4% 51.9% Ease of registering for programs? 43.2% 55.6% Reasonableness of fees charged for programs? 43.2% 53.1% City adult athletic programs? 42.6% 55.0% Other city recreation programs? 40.7% 56.3% City youth athletic programs? 37.9% 50.0% City swimming pools and programs? 33.2% 45.0% Maintenance of city community centers? 29.6% 29.4% Outdoor athletic fields? 28.8% 35.0% Walking and biking trails in the city parks? 19.3% 9.4% Maintenance of city parks? 13.5% 10.0% Location of city parks? 11.8% 6.9% Maintenance of boulevards and parkways? 9.9% 3.1%
Neighborhood Livability Questions regarding neighborhood livability focused on code enforcement activities. With the exception of efforts to ensure equal protection among all citizens, neighborhood contacts were significantly less satisfied with codes enforcement services provided by the city than residents. Twenty percent or fewer neighborhood contacts were either satisfied or very satisfied with the clean up of litter and debris on private property, mowing and cutting of weeds on private property, enforcement of residential property maintenance requirements, sign regulations, exterior maintenance requirements for business property, and enforcement of illegal dumping prohibitions. Thirty percent of residents were either satisfied or very satisfied with the clean up of litter and debris on private property. For neighborhood contacts, the percent was only 11 percent. Just under 30 percent of residents were either dissatisfied or very dissatisfied with the city’s efforts. For neighborhood contacts, more than half were dissatisfied. (See Exhibit 25.)

Results
17
Exhibit 25. How do you feel about the enforcement of requirements to clean up litter and debris on private property?
30%28%
29%
13%11%
20%
55%
14%
0%
10%
20%
30%
40%
50%
60%
satisfied neutral dissatisfied don't know
Residents Neighborhood Contacts
Similar satisfaction levels were found when asked about the enforcement of weed mowing and cutting on private property. Once again, about a third of residents were either satisfied or very satisfied, compared to about 13 percent of neighborhood contacts. Thirty percent of residents were dissatisfied or very dissatisfied, compared to over 55 percent of neighborhood contacts. (See Exhibit 26.) Exhibit 26. How do you feel about the enforcement of weed mowing/cutting requirements on private property?
31%
26%
30%
13%13%16%
56%
16%
0%
10%
20%
30%
40%
50%
60%
satisfied neutral dissatisfied don't know
Residents Neighborhood Contacts
Almost half of neighborhood contacts were either dissatisfied or very dissatisfied with the enforcement of maintenance requirements for

Survey Results for Citizens and Neighborhood Contacts
18
residential property. For residents, just over a quarter reported dissatisfaction with this activity. (See Exhibit 27.) Exhibit 27. How do you feel about the enforcement of residential property maintenance requirements?
32% 31%
26%
12%
16%
24%
49%
11%
0%
10%
20%
30%
40%
50%
60%
satisfied neutral dissatisfied don't know
Residents Neighborhood Contacts
Neighborhood contacts were similarly more dissatisfied with efforts to enforce exterior maintenance requirements for business property. Thirty-eight percent of neighborhood contacts were either dissatisfied or very dissatisfied with enforcement of business property maintenance regulations compared to less than 14 percent of residents. In contrast, 38 percent of residents were either satisfied or very satisfied, compared to only 15 percent of neighborhood contacts. (See Exhibit 28.) Exhibit 28. How do you feel about the enforcement of exterior business property maintenance requirements?
38%
32%
14%16%15%
28%
38%
19%
0%
10%
20%
30%
40%
50%
satisfied neutral dissatisfied don't know
Residents Neighborhood Contacts

Results
19
Almost a third of neighborhood contacts were dissatisfied with the city’s efforts to enforce codes designed to protect public health and safety. Less than 13 percent of residents felt the same. (See Exhibit 29.) Exhibit 29. How do you feel about efforts to enforce codes designed to protect public health and safety?
41%
31%
13%15%
27% 27%
31%
16%
0%
10%
20%
30%
40%
50%
satisfied neutral dissatisfied don't know
Residents Neighborhood Contacts
Neighborhood contacts were also less satisfied with efforts to enforce sign regulations. Only 20 percent of contacts were either satisfied or very satisfied with these efforts while over 41 percent of residents gave the same response. (See Exhibit 30.) Exhibit 30. How do you feel about efforts to enforce sign regulations?
41%
29%
12%
18%20%
36%
25%
19%
0%
10%
20%
30%
40%
50%
satisf ied neutral dissatisf ied don't know
Residents Neighborhood Contacts
Finally, neighborhood contacts were less satisfied with efforts to enforce prohibitions against illegal dumping. One fourth of residents were either satisfied or very satisfied with the city’s efforts, while less than ten percent of neighborhood contacts gave the same response. About a third

Survey Results for Citizens and Neighborhood Contacts
20
of residents were either dissatisfied or very dissatisfied, compared to more than half of the neighborhood contacts. (See Exhibit 31.) Exhibit 31. How do you feel about efforts to prevent illegal dumping?
25% 26%
31%
18%
8%
19%
56%
18%
0%
10%
20%
30%
40%
50%
60%
satisfied neutral dissatisfied don't know
Residents Neighborhood Contacts
When asked to prioritize code enforcement activities, both groups identified the first priority to be enforcement of illegal dumping prohibitions. Both groups identified efforts to enforce the clean up of litter on private property as the second priority. After that, residents were concerned about efforts to provide equal opportunity to all citizens while neighborhood contacts favored enforcement of maintenance requirements on residential property. (See Exhibit 32.)
Exhibit 32. Code Enforcement Activities That Should Be Emphasized Over the Next Two Years Residents Percent Neighborhood Contacts Percent
Illegal dumping activities 32.9% Illegal dumping activities 36.3% Clean up litter on private property 31.3% Clean up litter on private property 31.9% Equal opportunity among all citizens 22.7% Maintenance of residential property 23.8% Mow and cut weeds on private property 19.8% Mow and cut weeds on private property 16.9% Maintenance of residential property 19.7% Equal opportunity among all citizens 9.4% Protect public safety and health 12.0% Exterior maintenance of business
property 8.8%
Exterior maintenance of business property
8.5% Protect public safety and health 7.5%
Sign regulation 7.0% Sign regulation 5.6%

21
________________________________________________________________________________________ Appendix A ________________________________________________________________________________________ Survey Results

Survey Results for Citizens and Neighborhood Contacts
22
Appendix
23
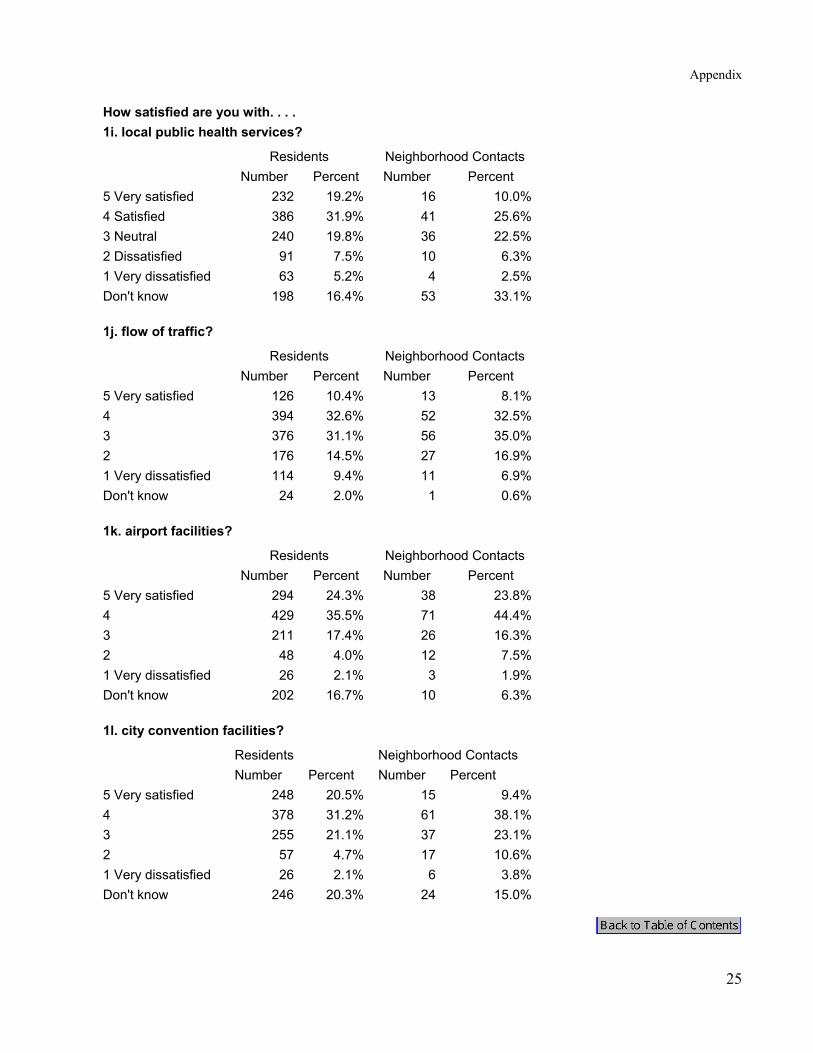
Question 1 – Overall satisfaction with city services How satisfied are you with. . . . 1a. police, fire & ambulance services?
Residents Neighborhood Contacts Number Percent Number Percent
5 Very satisfied 391 32.3% 43 26.9%4 Satisfied 396 32.7% 69 43.1%3 Neutral 250 20.7% 31 19.4%2 Dissatisfied 63 5.2% 5 3.1%1 Very dissatisfied 37 3.1% 6 3.8%Don't know 73 6.0% 6 3.8% 1b. city parks & recreation programs & facilities?
Residents Neighborhood Contacts Number Percent Number Percent
5 Very satisfied 212 17.5% 11 6.9%4 374 30.9% 52 32.5%3 315 26.0% 44 27.5%2 105 8.7% 31 19.4%1 Very dissatisfied 63 5.2% 9 5.6%Don't know 141 11.7% 13 8.1% 1c. maintenance of city streets/buildings/facilities?
Residents Neighborhood Contacts Number Percent Number Percent
5 Very satisfied 66 5.5% 4 2.5%4 179 14.8% 16 10.0%3 338 27.9% 47 29.4%2 344 28.4% 58 36.3%1 Very dissatisfied 274 22.6% 35 21.9%Don't know 9 0.7% 0 0.0% 1d. city water utilities?
Residents Neighborhood Contacts Number Percent Number Percent
5 Very satisfied 302 25.0% 28 17.5%4 473 39.1% 67 41.9%3 256 21.2% 34 21.3%2 88 7.3% 16 10.0%1 Very dissatisfied 70 5.8% 12 7.5%Don't know 21 1.7% 3 1.9%

Survey Results for Citizens and Neighborhood Contacts
24
How satisfied are you with. . . . 1e. enforcement of city codes & ordinances? Residents Neighborhood Contacts Number Percent Number Percent 5 Very satisfied 182 15.0% 9 5.6%4 Satisfied 331 27.4% 23 14.4%3 Neutral 307 25.4% 49 30.6%2 Dissatisfied 138 11.4% 42 26.3%1 Very dissatisfied 104 8.6% 31 19.4%Don't know 148 12.2% 6 3.8% 1f. customer service received from employees? Residents Neighborhood Contacts Number Percent Number Percent 5 Very satisfied 244 20.2% 27 16.9%4 382 31.6% 57 35.6%3 288 23.8% 37 23.1%2 120 9.9% 24 15.0%1 Very dissatisfied 87 7.2% 10 6.3%Don't know 89 7.4% 5 3.1% 1g. effectiveness of city communication with the public? Residents Neighborhood Contacts Number Percent Number Percent 5 Very satisfied 150 12.4% 13 8.1%4 341 28.2% 35 21.9%3 395 32.6% 57 35.6%2 159 13.1% 39 24.4%1 Very dissatisfied 104 8.6% 14 8.8%Don't know 61 5.0% 2 1.3% 1h. city’s stormwater runoff/management system? Residents Neighborhood Contacts Number Percent Number Percent 5 Very satisfied 167 13.8% 9 5.6%4 335 27.7% 25 15.6%3 314 26.0% 42 26.3%2 151 12.5% 34 21.3%1 Very dissatisfied 125 10.3% 33 20.6%Don't know 118 9.8% 17 10.6%
Appendix
25
How satisfied are you with. . . . 1i. local public health services? Residents Neighborhood Contacts Number Percent Number Percent 5 Very satisfied 232 19.2% 16 10.0%4 Satisfied 386 31.9% 41 25.6%3 Neutral 240 19.8% 36 22.5%2 Dissatisfied 91 7.5% 10 6.3%1 Very dissatisfied 63 5.2% 4 2.5%Don't know 198 16.4% 53 33.1% 1j. flow of traffic? Residents Neighborhood Contacts Number Percent Number Percent 5 Very satisfied 126 10.4% 13 8.1%4 394 32.6% 52 32.5%3 376 31.1% 56 35.0%2 176 14.5% 27 16.9%1 Very dissatisfied 114 9.4% 11 6.9%Don't know 24 2.0% 1 0.6% 1k. airport facilities? Residents Neighborhood Contacts Number Percent Number Percent 5 Very satisfied 294 24.3% 38 23.8%4 429 35.5% 71 44.4%3 211 17.4% 26 16.3%2 48 4.0% 12 7.5%1 Very dissatisfied 26 2.1% 3 1.9%Don't know 202 16.7% 10 6.3% 1l. city convention facilities? Residents Neighborhood Contacts Number Percent Number Percent 5 Very satisfied 248 20.5% 15 9.4%4 378 31.2% 61 38.1%3 255 21.1% 37 23.1%2 57 4.7% 17 10.6%1 Very dissatisfied 26 2.1% 6 3.8%Don't know 246 20.3% 24 15.0%

Survey Results for Citizens and Neighborhood Contacts
26
Question 2 – Which three of these items do you think should receive the most emphasis from city leaders over the next two years?
1st Choice 2nd Choice 3rd Choice Sum of all Choices Res. N. C. Res. N. C. Res. N. C. Res. N. C. Maintenance of city streets/bldgs./facilities 47.6% 33.1% 17.9% 10.0% 6.9% 6.9% 72.4% 50.0%Flow of traffic 6.0% 5.0% 10.7% 6.3% 11.2% 1.9% 27.9% 13.1%Stormwater runoff/ management 4.7% 11.9% 9.3% 10.0% 10.3% 6.3% 24.3% 28.1%Enforcement of city codes/ordinances 5.2% 12.5% 10.2% 15.0% 8.3% 5.6% 23.8% 33.1%Effectiveness of city communication 3.2% 5.6% 7.3% 5.0% 11.7% 3.1% 22.2% 13.8%Police, fire and ambulance services 10.2% 8.8% 6.6% 5.6% 5.3% 3.8% 22.1% 18.1%City parks and rec. programs 6.0% 4.4% 6.7% 8.8% 6.3% 6.3% 19.0% 19.4%City water utilities 4.7% 2.5% 6.8% 5.0% 3.6% 0.0% 15.0% 7.5%Quality of customer service 2.8% 1.9% 5.8% 1.9% 4.7% 4.4% 13.3% 8.1%Local public health services 2.4% 1.3% 3.7% 1.3% 6.4% 1.9% 12.6% 4.4%City convention facilities 1.0% 5.6% 1.9% 3.1% 3.6% 3.8% 6.5% 12.5%None chosen 5.0% 6.9% 11.8% 25.6% 19.3% 55.0% 5.0% 6.9%Airport facilities 1.2% 0.6% 1.3% 2.5% 2.2% 1.3% 4.8% 4.4%
Question 3 – General satisfaction with city activities How satisfied are you with. . . . 3a. services provided by the city? Residents Neighborhood Contacts Number Percent Number Percent 5 Very satisfied 164 13.6% 5 3.1%4 Satisfied 470 38.8% 49 30.6%3 Neutral 398 32.9% 69 43.1%2 Dissatisfied 117 9.7% 14 8.8%1 Very dissatisfied 41 3.4% 8 5.0%Don't know 20 1.7% 15 9.4%

Appendix
27
How satisfied are you with. . . . 3b. value received for city tax dollars? Residents Neighborhood Contacts Number Percent Number Percent 5 Very satisfied 99 8.2% 3 1.9%4 Satisfied 324 26.8% 31 19.4%3 Neutral 396 32.7% 69 43.1%2 Dissatisfied 199 16.4% 33 20.6%1 Very dissatisfied 141 11.7% 22 13.8%Don't know 51 4.2% 2 1.3% 3c. overall image of the city? Residents Neighborhood Contacts Number Percent Number Percent 5 Very satisfied 179 14.8% 12 7.5%4 456 37.7% 53 33.1%3 331 27.4% 61 38.1%2 160 13.2% 22 13.8%1 Very dissatisfied 70 5.8% 8 5.0%Don't know 14 1.2% 4 2.5% 3d. how well the city is planning for growth? Residents Neighborhood Contacts Number Percent Number Percent 5 Very satisfied 130 10.7% 10 6.3%4 312 25.8% 34 21.3%3 341 28.2% 46 28.8%2 215 17.8% 29 18.1%1 Very dissatisfied 101 8.3% 27 16.9%Don't know 111 9.2% 14 8.8% 3e. overall quality of life in the city? Residents Neighborhood Contacts Number Percent Number Percent 5 Very satisfied 188 15.5% 22 13.8%4 507 41.9% 68 42.5%3 347 28.7% 53 33.1%2 106 8.8% 9 5.6%1 Very dissatisfied 41 3.4% 4 2.5%Don't know 21 1.7% 4 2.5%

Survey Results for Citizens and Neighborhood Contacts
28
How satisfied are you with. . . . 3f. overall feeling of safety in the city? Residents Neighborhood Contacts Number Percent Number Percent 5 Very satisfied 125 10.3% 9 5.6%4 Satisfied 403 33.3% 59 36.9%3 Neutral 389 32.1% 60 37.5%2 Dissatisfied 196 16.2% 20 12.5%1 Very dissatisfied 91 7.5% 12 7.5%Don't know 6 0.5% 0 0.0%
Question 4 – Satisfaction with public safety How satisfied are you with. . . . 4a. quality of local police protection? Residents Neighborhood Contacts Number Percent Number Percent 5 Very satisfied 211 17.4% 31 19.4%4 457 37.8% 66 41.3%3 295 24.4% 43 26.9%2 146 12.1% 12 7.5%1 Very dissatisfied 77 6.4% 7 4.4%Don't know 24 2.0% 1 0.6% 4b. visibility of police in neighborhoods? Residents Neighborhood Contacts Number Percent Number Percent 5 Very satisfied 199 16.4% 16 10.0%4 415 34.3% 49 30.6%3 321 26.5% 50 31.3%2 165 13.6% 27 16.9%1 Very dissatisfied 100 8.3% 18 11.3%Don't know 10 0.8% 0 0.0% 4c. visibility of police in retail areas? Residents Neighborhood Contacts Number Percent Number Percent 5 Very satisfied 165 13.6% 15 9.4%4 404 33.4% 40 25.0%3 349 28.8% 47 29.4%2 180 14.9% 29 18.1%1 Very dissatisfied 53 4.4% 11 6.9%Don't know 59 4.9% 18 11.3%

Appendix
29
How satisfied are you with. . . . 4d. city’s overall efforts to prevent crime? Residents Neighborhood Contacts Number Percent Number Percent 5 Very satisfied 164 13.6% 18 11.3%4 Satisfied 397 32.8% 52 32.5%3 Neutral 364 30.1% 53 33.1%2 Dissatisfied 151 12.5% 20 12.5%1 Very dissatisfied 78 6.4% 10 6.3%Don't know 56 4.6% 7 4.4% 4e. enforcement of local traffic laws? Residents Neighborhood Contacts Number Percent Number Percent 5 Very satisfied 224 18.5% 6 3.8%4 409 33.8% 57 35.6%3 343 28.3% 56 35.0%2 116 9.6% 24 15.0%1 Very dissatisfied 71 5.9% 13 8.1%Don't know 47 3.9% 4 2.5% 4f. quality of fire protection and rescue services? Residents Neighborhood Contacts Number Percent Number Percent 5 Very satisfied 456 37.7% 46 28.8%4 500 41.3% 78 48.8%3 151 12.5% 24 15.0%2 21 1.7% 0 0.0%1 Very dissatisfied 13 1.1% 0 0.0%Don't know 69 5.7% 12 7.5% 4g. quality of local ambulance services? Residents Neighborhood Contacts Number Percent Number Percent 5 Very satisfied 369 30.5% 29 18.1%4 430 35.5% 49 30.6%3 186 15.4% 30 18.8%2 36 3.0% 10 6.3%1 Very dissatisfied 22 1.8% 5 3.1%Don't know 167 13.8% 37 23.1%

Survey Results for Citizens and Neighborhood Contacts
30
How satisfied are you with. . . . 4h. how quickly public safety personnel respond to emergencies? Residents Neighborhood Contacts Number Percent Number Percent 5 Very satisfied 310 25.6% 27 16.9%4 Satisfied 401 33.1% 62 38.8%3 Neutral 225 18.6% 37 23.1%2 Dissatisfied 84 6.9% 15 9.4%1 Very dissatisfied 33 2.7% 6 3.8%Don't know 157 13.0% 13 8.1% 4i. the quality of animal control? Residents Neighborhood Contacts Number Percent Number Percent 5 Very satisfied 160 13.2% 5 3.1%4 360 29.8% 34 21.3%3 313 25.9% 39 24.4%2 154 12.7% 39 24.4%1 Very dissatisfied 100 8.3% 23 14.4%Don't know 123 10.2% 20 12.5% 4j. the city’s efforts to enhance fire protection? Residents Neighborhood Contacts Number Percent Number Percent 5 Very satisfied 252 20.8% 22 13.8%4 440 36.4% 51 31.9%3 259 21.4% 45 28.1%2 45 3.7% 7 4.4%1 Very dissatisfied 17 1.4% 2 1.3%Don't know 197 16.3% 33 20.6% 4k. the city’s Municipal Court? Residents Neighborhood Contacts Number Percent Number Percent 5 Very satisfied 132 10.9% 8 5.0%4 300 24.8% 22 13.8%3 299 24.7% 35 21.9%2 87 7.2% 17 10.6%1 Very dissatisfied 76 6.3% 13 8.1%Don't know 316 26.1% 65 40.6%

Appendix
31
Question 5 – Which two public safety items do you think should receive the most emphasis from city leaders over the next two years? 1st Choice 2nd Choice Sum of both Choices Res. N. C. Res. N. C. Res. N. C. Local police protection 20.7% 14.4% 9.4% 4.4% 30.2% 18.8%Efforts to prevent crime 14.8% 5.0% 14.5% 3.8% 29.3% 8.8%Visibility of police in neighborhoods 17.3% 17.5% 11.9% 6.3% 29.2% 23.8%Animal Control 8.1% 13.8% 11.3% 10.0% 19.4% 23.8%Visibility of police in retail areas 7.4% 3.8% 10.0% 6.9% 17.4% 10.6%Enforcement of local traffic laws 6.7% 10.0% 8.8% 12.5% 15.5% 22.5%Municipal Court 5.0% 8.1% 5.4% 5.0% 10.4% 13.1%None chosen 9.4% 15.0% 14.8% 34.4% 9.4% 15.0%Quick response to emergencies 3.1% 5.0% 5.6% 5.6% 8.8% 10.6%Local ambulance service 2.6% 5.0% 4.2% 3.1% 6.8% 8.1%Fire protection & rescue services 3.1% 2.5% 2.1% 6.9% 5.1% 9.4%Efforts to enhance fire protection 1.7% 0.0% 2.0% 1.3% 3.7% 1.3%
Question 6 - Parks and Recreation Services. How satisfied are you with. . . . 6a. maintenance of city parks? Residents Neighborhood Contacts Number Percent Number Percent 5 Very satisfied 169 14.0% 12 7.5%4 Satisfied 390 32.2% 49 30.6%3 Neutral 325 26.9% 42 26.3%2 Dissatisfied 98 8.1% 30 18.8%1 Very dissatisfied 65 5.4% 11 6.9%Don't know 163 13.5% 16 10.0%

Survey Results for Citizens and Neighborhood Contacts
32
How satisfied are you with. . . . 6b. maintenance of boulevards & parkways? Residents Neighborhood Contacts Number Percent Number Percent 5 Very satisfied 148 12.2% 19 11.9%4 Satisfied 413 34.1% 68 42.5%3 Neutral 350 28.9% 37 23.1%2 Dissatisfied 127 10.5% 21 13.1%1 Very dissatisfied 52 4.3% 10 6.3%Don't know 120 9.9% 5 3.1% 6c. the location of city parks? Residents Neighborhood Contacts Number Percent Number Percent 5 Very satisfied 212 17.5% 21 13.1%4 420 34.7% 67 41.9%3 317 26.2% 41 25.6%2 72 6.0% 13 8.1%1 Very dissatisfied 46 3.8% 7 4.4%Don't know 143 11.8% 11 6.9% 6d. walking and biking trails in the city parks? Residents Neighborhood Contacts Number Percent Number Percent 5 Very satisfied 124 10.2% 9 5.6%4 277 22.9% 43 26.9%3 300 24.8% 31 19.4%2 181 15.0% 37 23.1%1 Very dissatisfied 94 7.8% 25 15.6%Don't know 234 19.3% 15 9.4% 6e. the maintenance of city community centers? Residents Neighborhood Contacts Number Percent Number Percent 5 Very satisfied 119 9.8% 10 6.3%4 296 24.5% 30 18.8%3 302 25.0% 35 21.9%2 95 7.9% 19 11.9%1 Very dissatisfied 40 3.3% 19 11.9%Don't know 358 29.6% 47 29.4%

Appendix
33
How satisfied are you with. . . . 6f. city swimming pools and programs? Residents Neighborhood Contacts Number Percent Number Percent 5 Very satisfied 83 6.9% 2 1.3%4 Satisfied 186 15.4% 13 8.1%3 Neutral 280 23.1% 27 16.9%2 Dissatisfied 164 13.6% 23 14.4%1 Very dissatisfied 95 7.9% 23 14.4%Don't know 402 33.2% 72 45.0% 6g. city golf courses? Residents Neighborhood Contacts Number Percent Number Percent 5 Very satisfied 124 10.2% 8 5.0%4 223 18.4% 29 18.1%3 205 16.9% 33 20.6%2 41 3.4% 3 1.9%1 Very dissatisfied 44 3.6% 4 2.5%Don't know 573 47.4% 83 51.9% 6h. outdoor athletic fields? Residents Neighborhood Contacts Number Percent Number Percent 5 Very satisfied 114 9.4% 4 2.5%4 318 26.3% 32 20.0%3 294 24.3% 48 30.0%2 87 7.2% 12 7.5%1 Very dissatisfied 48 4.0% 8 5.0%Don't know 349 28.8% 56 35.0% 6i. city youth athletic programs? Residents Neighborhood Contacts Number Percent Number Percent 5 Very satisfied 95 7.9% 6 3.8%4 212 17.5% 15 9.4%3 286 23.6% 30 18.8%2 107 8.8% 18 11.3%1 Very dissatisfied 51 4.2% 11 6.9%Don't know 459 37.9% 80 50.0%
Survey Results for Citizens and Neighborhood Contacts
34
How satisfied are you with. . . . 6j. city adult athletic programs? Residents Neighborhood Contacts Number Percent Number Percent 5 Very satisfied 75 6.2% 3 1.9%4 Satisfied 203 16.8% 9 5.6%3 Neutral 262 21.7% 37 23.1%2 Dissatisfied 99 8.2% 17 10.6%1 Very dissatisfied 55 4.5% 6 3.8%Don't know 516 42.6% 88 55.0% 6k. other city recreation programs? Residents Neighborhood Contacts Number Percent Number Percent 5 Very satisfied 97 8.0% 5 3.1%4 210 17.4% 16 10.0%3 293 24.2% 33 20.6%2 63 5.2% 12 7.5%1 Very dissatisfied 54 4.5% 4 2.5%Don't know 493 40.7% 90 56.3% 6l. ease of registering for programs? Residents Neighborhood Contacts Number Percent Number Percent 5 Very satisfied 85 7.0% 6 3.8%4 214 17.7% 17 10.6%3 268 22.1% 34 21.3%2 70 5.8% 8 5.0%1 Very dissatisfied 50 4.1% 6 3.8%Don't know 523 43.2% 89 55.6% 6m. reasonableness of fees charged for programs? Residents Neighborhood Contacts Number Percent Number Percent 5 Very satisfied 85 7.0% 5 3.1%4 211 17.4% 25 15.6%3 262 21.7% 32 20.0%2 77 6.4% 4 2.5%1 Very dissatisfied 52 4.3% 9 5.6%Don't know 523 43.2% 85 53.1%

Appendix
35
Question 7 – Which two of these parks & recreation items do you think should receive the most emphasis from city leaders over the next two years?
1st Choice 2nd Choice Sum of both
Choices Res. N. C. Res. N. C. Res. N. C. Maintenance of city parks 18.6% 13.8% 8.8% 6.3% 27.4% 20.0%None chosen 23.1% 43.1% 28.8% 53.8% 23.1% 43.1%Walking and biking trails 12.0% 8.8% 10.6% 7.5% 22.6% 16.3%Maintenance of boulevards and parkways 10.0% 5.6% 8.9% 5.6% 18.9% 11.3%Swimming pools and programs 8.5% 5.0% 8.8% 2.5% 17.3% 7.5%Youth athletic programs 6.4% 7.5% 6.2% 3.1% 12.6% 10.6%Location of city parks 5.0% 1.9% 5.5% 2.5% 10.5% 4.4%Maintenance of community centers 4.1% 6.9% 5.1% 7.5% 9.3% 14.4%Reasonableness of fees 3.4% 2.5% 3.9% 2.5% 7.3% 5.0%Outdoor athletic fields 2.1% 2.5% 4.5% 2.5% 6.5% 5.0%Ease of registering 2.0% 0.6% 2.5% 0.6% 4.5% 1.3%Other recreation programs 1.9% 0.6% 2.0% 1.3% 3.9% 1.9%Adult athletic programs 1.5% 0.6% 2.2% 3.8% 3.7% 4.4%Golf courses 1.3% 0.6% 2.3% 0.6% 3.6% 1.3%
Question 8 – Maintenance activities. How satisfied are you with. . . . 8a. maintenance of city streets? Residents Neighborhood Contacts Number Percent Number Percent 5 Very satisfied 41 3.4% 3 1.9%4 Satisfied 198 16.4% 12 7.5%3 Neutral 299 24.7% 49 30.6%2 Dissatisfied 368 30.4% 49 30.6%1 Very dissatisfied 297 24.5% 43 26.9%Don't know 7 0.6% 4 2.5% 8b. maintenance of streets in your neighborhood? Residents Neighborhood Contacts Number Percent Number Percent 5 Very satisfied 81 6.7% 7 4.4%4 264 21.8% 31 19.4%3 314 26.0% 51 31.9%2 280 23.1% 37 23.1%1 Very dissatisfied 267 22.1% 34 21.3%Don't know 4 0.3% 0 0.0%
Survey Results for Citizens and Neighborhood Contacts
36
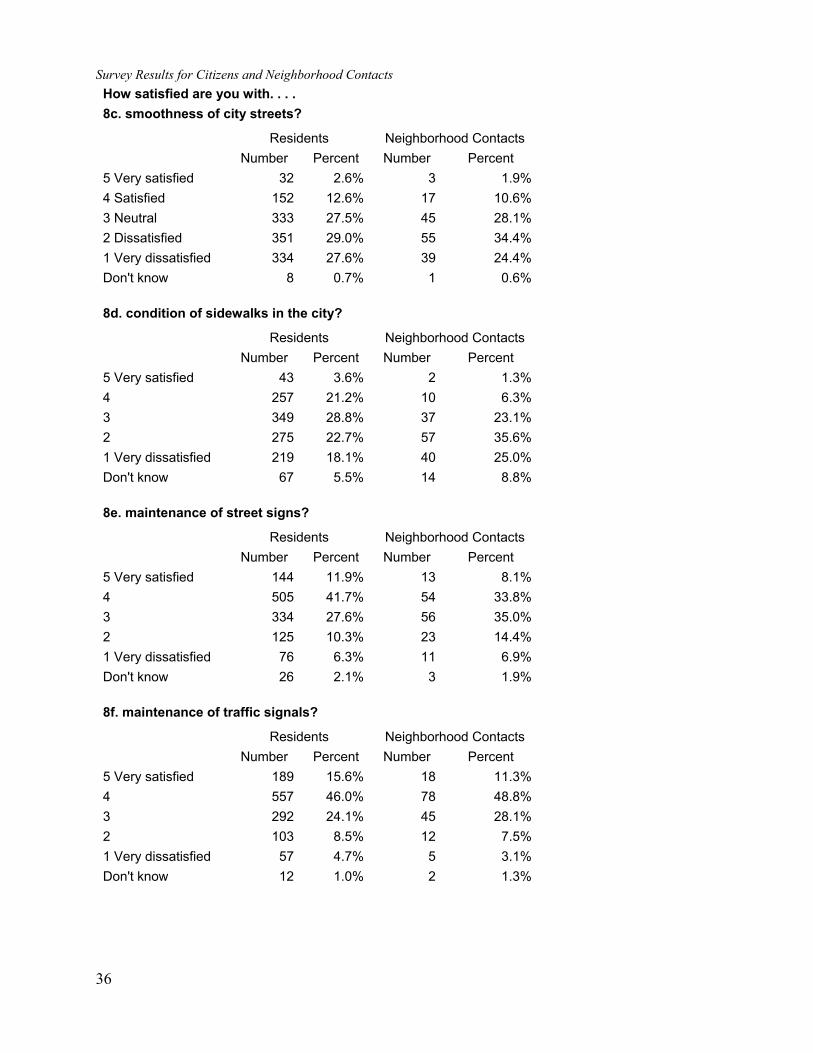
How satisfied are you with. . . . 8c. smoothness of city streets? Residents Neighborhood Contacts Number Percent Number Percent 5 Very satisfied 32 2.6% 3 1.9%4 Satisfied 152 12.6% 17 10.6%3 Neutral 333 27.5% 45 28.1%2 Dissatisfied 351 29.0% 55 34.4%1 Very dissatisfied 334 27.6% 39 24.4%Don't know 8 0.7% 1 0.6% 8d. condition of sidewalks in the city? Residents Neighborhood Contacts Number Percent Number Percent 5 Very satisfied 43 3.6% 2 1.3%4 257 21.2% 10 6.3%3 349 28.8% 37 23.1%2 275 22.7% 57 35.6%1 Very dissatisfied 219 18.1% 40 25.0%Don't know 67 5.5% 14 8.8% 8e. maintenance of street signs? Residents Neighborhood Contacts Number Percent Number Percent 5 Very satisfied 144 11.9% 13 8.1%4 505 41.7% 54 33.8%3 334 27.6% 56 35.0%2 125 10.3% 23 14.4%1 Very dissatisfied 76 6.3% 11 6.9%Don't know 26 2.1% 3 1.9% 8f. maintenance of traffic signals? Residents Neighborhood Contacts Number Percent Number Percent 5 Very satisfied 189 15.6% 18 11.3%4 557 46.0% 78 48.8%3 292 24.1% 45 28.1%2 103 8.5% 12 7.5%1 Very dissatisfied 57 4.7% 5 3.1%Don't know 12 1.0% 2 1.3%

Appendix
37
How satisfied are you with. . . . 8g. maintenance/preservation of downtown KCMO? Residents Neighborhood Contacts Number Percent Number Percent 5 Very satisfied 114 9.4% 5 3.1%4 Satisfied 331 27.4% 31 19.4%3 Neutral 332 27.4% 45 28.1%2 Dissatisfied 179 14.8% 39 24.4%1 Very dissatisfied 161 13.3% 31 19.4%Don't know 93 7.7% 9 5.6% 8h. maintenance of city buildings? Residents Neighborhood Contacts Number Percent Number Percent 5 Very satisfied 165 13.6% 16 10.0%4 431 35.6% 54 33.8%3 334 27.6% 52 32.5%2 72 6.0% 14 8.8%1 Very dissatisfied 51 4.2% 4 2.5%Don't know 157 13.0% 20 12.5% 8i. snow removal on major city streets? Residents Neighborhood Contacts Number Percent Number Percent 5 Very satisfied 217 17.9% 14 8.8%4 475 39.3% 65 40.6%3 304 25.1% 46 28.8%2 111 9.2% 17 10.6%1 Very dissatisfied 83 6.9% 15 9.4%Don't know 20 1.7% 3 1.9% 8j. snow removal in residential areas? Residents Neighborhood Contacts Number Percent Number Percent 5 Very satisfied 67 5.5% 4 2.5%4 250 20.7% 32 20.0%3 342 28.3% 44 27.5%2 276 22.8% 37 23.1%1 Very dissatisfied 253 20.9% 39 24.4%Don't know 22 1.8% 4 2.5%

Survey Results for Citizens and Neighborhood Contacts
38
How satisfied are you with. . . . 8k. mowing/trimming along city streets? Residents Neighborhood Contacts Number Percent Number Percent 5 Very satisfied 122 10.1% 5 3.1%4 Satisfied 395 32.6% 32 20.0%3 Neutral 376 31.1% 44 27.5%2 Dissatisfied 161 13.3% 40 25.0%1 Very dissatisfied 124 10.2% 31 19.4%Don't know 32 2.6% 8 5.0% 8l. cleanliness of city streets and public areas? Residents Neighborhood Contacts Number Percent Number Percent 5 Very satisfied 71 5.9% 6 3.8%4 375 31.0% 24 15.0%3 440 36.4% 58 36.3%2 205 16.9% 46 28.8%1 Very dissatisfied 105 8.7% 21 13.1%Don't know 14 1.2% 5 3.1% 8m. quality of trash collection services? Residents Neighborhood Contacts Number Percent Number Percent 5 Very satisfied 270 22.3% 28 17.5%4 494 40.8% 71 44.4%3 249 20.6% 33 20.6%2 111 9.2% 11 6.9%1 Very dissatisfied 53 4.4% 13 8.1%Don't know 33 2.7% 4 2.5% 8n. adequacy of city street lighting? Residents Neighborhood Contacts Number Percent Number Percent 5 Very satisfied 229 18.9% 31 19.4%4 539 44.5% 75 46.9%3 293 24.2% 36 22.5%2 95 7.9% 9 5.6%1 Very dissatisfied 44 3.6% 6 3.8%Don't know 10 0.8% 3 1.9%

Appendix
39
How satisfied are you with. . . . 8o. timeliness of the removal of abandoned cars? Residents Neighborhood Contacts Number Percent Number Percent 5 Very satisfied 113 9.3% 5 3.1%4 Satisfied 283 23.4% 29 18.1%3 Neutral 305 25.2% 29 18.1%2 Dissatisfied 172 14.2% 35 21.9%1 Very dissatisfied 131 10.8% 32 20.0%Don't know 206 17.0% 30 18.8%
Question 9 – Which two of these maintenance items do you think should receive the most emphasis from city leaders over the next two years?
1st Choice 2nd Choice Sum of both
Choices Res. N. C. Res. N. C. Res. N. C. Maintenance of city streets 29.9% 22.5% 12.0% 12.5% 41.9% 35.0%Smoothness of city streets 12.6% 3.1% 16.4% 9.4% 29.0% 12.5%Snow removal in residential areas 9.5% 10.0% 13.2% 5.6% 22.7% 15.6%Maintenance of streets in your Neighborhood 9.7% 1.9% 11.2% 5.0% 20.9% 6.9%Condition of sidewalks in city 5.7% 10.0% 7.4% 9.4% 13.1% 19.4%Maintenance/preservation of downtown KCMO 5.7% 3.8% 5.4% 1.3% 11.1% 5.0%Timeliness of the removal of abandoned Cars 5.5% 11.9% 4.3% 6.9% 9.8% 18.8%Cleanliness of city streets & public areas 2.9% 6.3% 5.7% 5.0% 8.6% 11.3%None chosen 6.3% 11.3% 8.7% 27.5% 6.3% 11.3%Mowing/trimming along city streets 1.8% 3.8% 4.4% 7.5% 6.2% 11.3%Snow removal on major city streets 2.6% 1.9% 2.3% 2.5% 5.0% 4.4%Quality of trash collection services 2.2% 5.6% 2.5% 1.3% 4.7% 6.9%Adequacy of city street lighting 1.9% 5.0% 2.2% 1.9% 4.1% 6.9%Maintenance of traffic signals 1.7% 0.6% 1.7% 0.6% 3.4% 1.3%Maintenance of street signs 1.2% 2.5% 1.4% 3.8% 2.6% 6.3%Maintenance of city buildings 0.8% 0.0% 1.1% 0.0% 1.9% 0.0%

Survey Results for Citizens and Neighborhood Contacts
40
Question 10 – Code enforcement activities. How satisfied are you with. . . . 10a. clean up of litter and debris on private property? Residents Neighborhood Contacts Number Percent Number Percent 5 Very satisfied 89 7.4% 6 3.8%4 Satisfied 277 22.9% 12 7.5%3 Neutral 334 27.6% 32 20.0%2 Dissatisfied 202 16.7% 50 31.3%1 Very dissatisfied 151 12.5% 38 23.8%Don't know 157 13.0% 22 13.8% 10b. mowing and cleaning of weeds on private property? Residents Neighborhood Contacts Number Percent Number Percent 5 Very satisfied 103 8.5% 5 3.1%4 267 22.1% 16 10.0%3 316 26.1% 25 15.6%2 223 18.4% 46 28.8%1 Very dissatisfied 144 11.9% 43 26.9%Don't know 157 13.0% 25 15.6% 10c. maintenance of residential property? Residents Neighborhood Contacts Number Percent Number Percent 5 Very satisfied 102 8.4% 7 4.4%4 285 23.6% 19 11.9%3 370 30.6% 38 23.8%2 189 15.6% 49 30.6%1 Very dissatisfied 122 10.1% 29 18.1%Don't know 142 11.7% 18 11.3% 10d. exterior maintenance of business property? Residents Neighborhood Contacts Number Percent Number Percent 5 Very satisfied 108 8.9% 5 3.1%4 355 29.3% 19 11.9%3 391 32.3% 44 27.5%2 103 8.5% 41 25.6%1 Very dissatisfied 61 5.0% 20 12.5%Don't know 192 15.9% 31 19.4%
Appendix
41
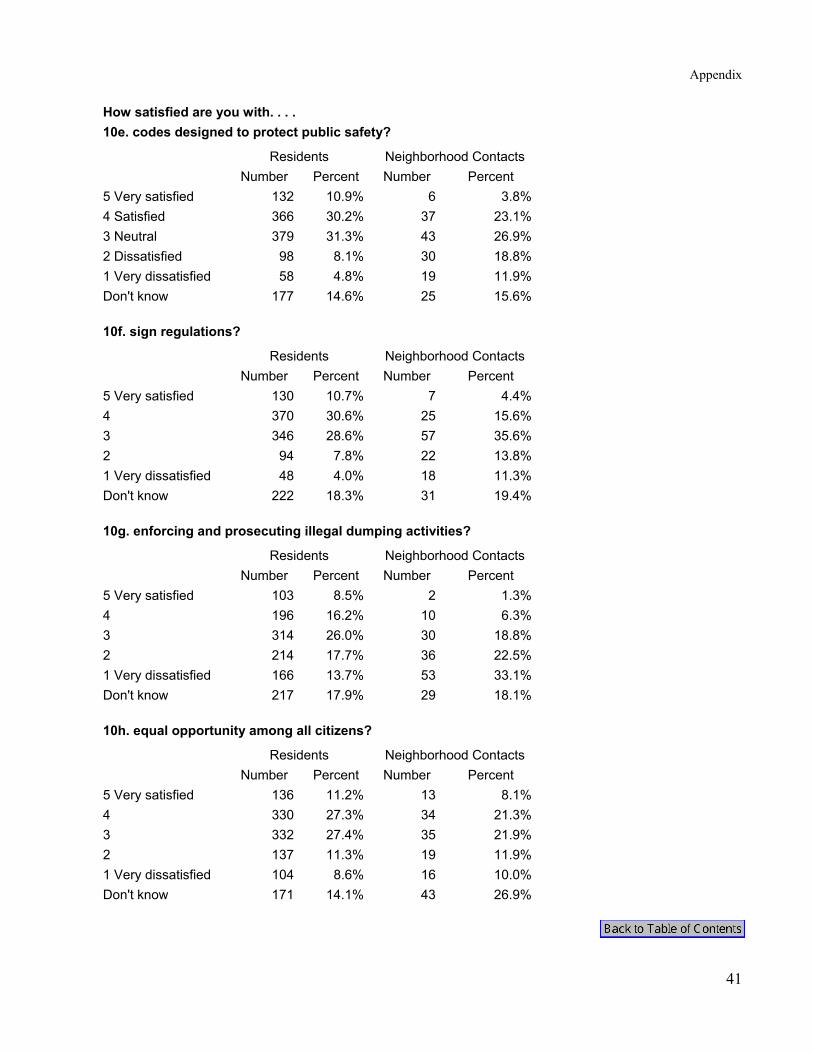
How satisfied are you with. . . . 10e. codes designed to protect public safety? Residents Neighborhood Contacts Number Percent Number Percent 5 Very satisfied 132 10.9% 6 3.8%4 Satisfied 366 30.2% 37 23.1%3 Neutral 379 31.3% 43 26.9%2 Dissatisfied 98 8.1% 30 18.8%1 Very dissatisfied 58 4.8% 19 11.9%Don't know 177 14.6% 25 15.6% 10f. sign regulations? Residents Neighborhood Contacts Number Percent Number Percent 5 Very satisfied 130 10.7% 7 4.4%4 370 30.6% 25 15.6%3 346 28.6% 57 35.6%2 94 7.8% 22 13.8%1 Very dissatisfied 48 4.0% 18 11.3%Don't know 222 18.3% 31 19.4% 10g. enforcing and prosecuting illegal dumping activities? Residents Neighborhood Contacts Number Percent Number Percent 5 Very satisfied 103 8.5% 2 1.3%4 196 16.2% 10 6.3%3 314 26.0% 30 18.8%2 214 17.7% 36 22.5%1 Very dissatisfied 166 13.7% 53 33.1%Don't know 217 17.9% 29 18.1% 10h. equal opportunity among all citizens? Residents Neighborhood Contacts Number Percent Number Percent 5 Very satisfied 136 11.2% 13 8.1%4 330 27.3% 34 21.3%3 332 27.4% 35 21.9%2 137 11.3% 19 11.9%1 Very dissatisfied 104 8.6% 16 10.0%Don't know 171 14.1% 43 26.9%

Survey Results for Citizens and Neighborhood Contacts
42
Question 11 – Which two of these code enforcement items do you think should receive the most emphasis from city leaders over the next two years?
1st Choice 2nd Choice Sum of both
Choices Res. N. C. Res. N. C. Res. N. C. Illegal dumping activities 18.1% 28.8% 14.8% 7.5% 32.9% 36.3%Clean up litter 21.6% 15.6% 9.8% 16.3% 31.3% 31.9%Equal opportunity among all citizens 11.2% 6.3% 11.6% 3.1% 22.7% 9.4%None chosen 20.6% 23.1% 25.5% 36.9% 20.6% 23.1%Mow and cut weeds on private property 7.1% 5.6% 12.7% 11.3% 19.8% 16.9%Maintenance of residential property 7.5% 13.8% 12.1% 10.0% 19.7% 23.8%Protect public safety and health 6.0% 1.9% 6.0% 5.6% 12.0% 7.5%Exterior maintenance business property 5.2% 1.9% 3.3% 6.9% 8.5% 8.8%Sign regulation 2.7% 3.1% 4.3% 2.5% 7.0% 5.6%
Question 12 – City management. How satisfied are you with. . . . 12a. the quality of leadership provided? Residents Neighborhood Contacts Number Percent Number Percent 5 Very satisfied 84 6.9% 12 7.5%4 Satisfied 336 27.8% 40 25.0%3 Neutral 421 34.8% 60 37.5%2 Dissatisfied 161 13.3% 29 18.1%1 Very dissatisfied 98 8.1% 18 11.3%Don't know 110 9.1% 1 0.6% 12b. the effectiveness of appointed boards and commissions? Residents Neighborhood Contacts Number Percent Number Percent 5 Very satisfied 83 6.9% 7 4.4%4 276 22.8% 31 19.4%3 400 33.1% 63 39.4%2 178 14.7% 31 19.4%1 Very dissatisfied 87 7.2% 12 7.5%Don't know 186 15.4% 16 10.0%

Appendix
43
How satisfied are you with. . . . 12c. the effectiveness of city manager and appointed staff? Residents Neighborhood Contacts Number Percent Number Percent 5 Very satisfied 87 7.2% 19 11.9%4 Satisfied 315 26.0% 42 26.3%3 Neutral 400 33.1% 52 32.5%2 Dissatisfied 142 11.7% 18 11.3%1 Very dissatisfied 77 6.4% 7 4.4%Don't know 189 15.6% 22 13.8%
Question 13 – City Communications. How satisfied are you with. . . . 13a. the information about programs and services? Residents Neighborhood Contacts Number Percent Number Percent 5 Very satisfied 131 10.8% 16 10.0%4 342 28.3% 52 32.5%3 361 29.8% 47 29.4%2 195 16.1% 29 18.1%1 Very dissatisfied 94 7.8% 15 9.4%Don't know 87 7.2% 1 0.6% 13b. city efforts to keep you informed about local issues? Residents Neighborhood Contacts Number Percent Number Percent 5 Very satisfied 134 11.1% 15 9.4%4 334 27.6% 46 28.8%3 356 29.4% 47 29.4%2 213 17.6% 31 19.4%1 Very dissatisfied 110 9.1% 20 12.5%Don't know 63 5.2% 1 0.6% 13c. the level of public involvement in local decision making? Residents Neighborhood Contacts Number Percent Number Percent 5 Very satisfied 77 6.4% 8 5.0%4 251 20.7% 24 15.0%3 394 32.6% 50 31.3%2 231 19.1% 39 24.4%1 Very dissatisfied 133 11.0% 28 17.5%Don't know 124 10.2% 11 6.9%

Survey Results for Citizens and Neighborhood Contacts
44
Question 14 – How much do you watch the City’s cable television Channel 2? Residents Neighborhood Contacts Number Percent Number Percent Zero/Did not watch 762 63.0% 74 46.3%Less than 15 minutes 171 14.1% 26 16.3%15-59 minutes 147 12.1% 33 20.6%1 to 3 hours 73 6.0% 17 10.6%More than 3 hours 54 4.5% 10 6.3%Don't know 3 0.2% 0 0.0%
Question 15 – Rating Kansas City, Missouri. How would you rate Kansas City, Missouri. . . . 15a. as a place to live? Residents Neighborhood Contacts Number Percent Number Percent 5 Excellent 280 23.1% 47 29.4%4 Good 518 42.8% 80 50.0%3 Neutral 294 24.3% 25 15.6%2 Below Average 72 6.0% 7 4.4%1 Poor 37 3.1% 1 0.6%Don't know 9 0.7% 0 0.0% 15b. as a place to raise children? Residents Neighborhood Contacts Number Percent Number Percent Excellent 211 17.4% 34 21.3%Good 423 35.0% 60 37.5%Neutral 308 25.5% 33 20.6%Below Average 128 10.6% 15 9.4%Poor 86 7.1% 10 6.3%Don't know 54 4.5% 8 5.0% 15c. as a place to work? Residents Neighborhood Contacts Number Percent Number Percent Excellent 221 18.3% 32 20.0%Good 468 38.7% 78 48.8%Neutral 308 25.5% 35 21.9%Below Average 97 8.0% 7 4.4%Poor 65 5.4% 5 3.1%Don't know 51 4.2% 3 1.9%
Appendix
45
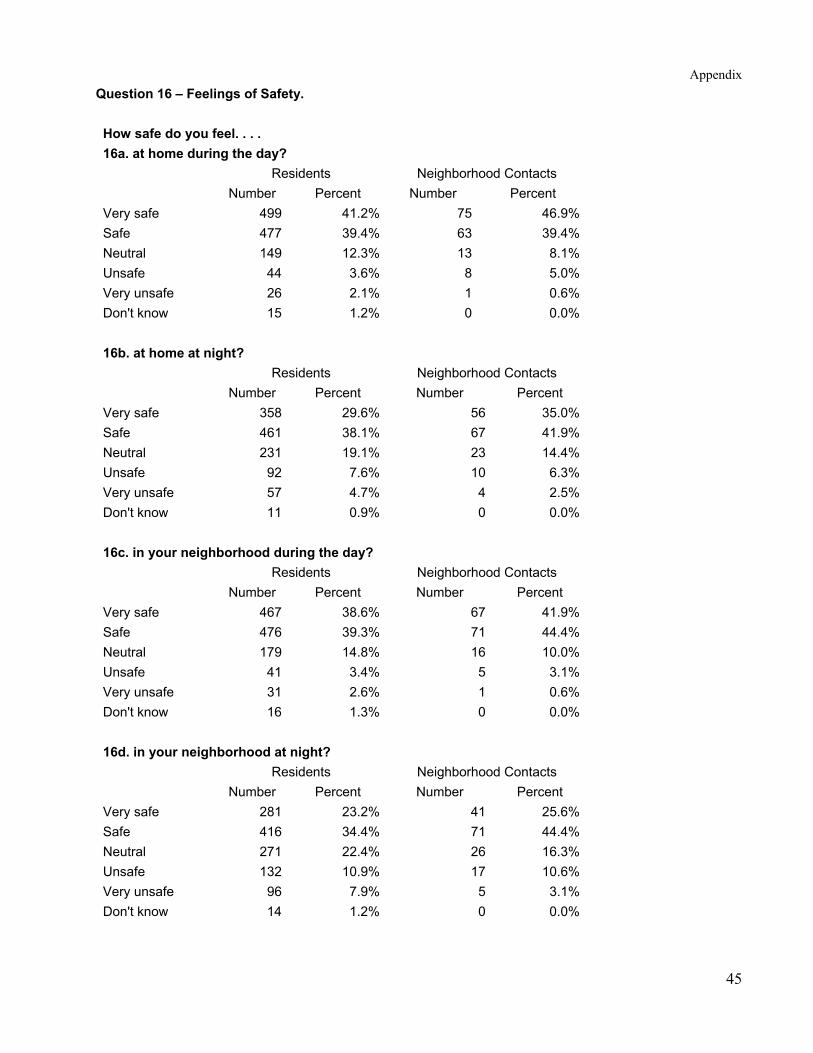
Question 16 – Feelings of Safety. How safe do you feel. . . . 16a. at home during the day? Residents Neighborhood Contacts Number Percent Number Percent Very safe 499 41.2% 75 46.9% Safe 477 39.4% 63 39.4% Neutral 149 12.3% 13 8.1% Unsafe 44 3.6% 8 5.0% Very unsafe 26 2.1% 1 0.6% Don't know 15 1.2% 0 0.0% 16b. at home at night? Residents Neighborhood Contacts Number Percent Number Percent Very safe 358 29.6% 56 35.0% Safe 461 38.1% 67 41.9% Neutral 231 19.1% 23 14.4% Unsafe 92 7.6% 10 6.3% Very unsafe 57 4.7% 4 2.5% Don't know 11 0.9% 0 0.0% 16c. in your neighborhood during the day? Residents Neighborhood Contacts Number Percent Number Percent Very safe 467 38.6% 67 41.9% Safe 476 39.3% 71 44.4% Neutral 179 14.8% 16 10.0% Unsafe 41 3.4% 5 3.1% Very unsafe 31 2.6% 1 0.6% Don't know 16 1.3% 0 0.0% 16d. in your neighborhood at night? Residents Neighborhood Contacts Number Percent Number Percent Very safe 281 23.2% 41 25.6% Safe 416 34.4% 71 44.4% Neutral 271 22.4% 26 16.3% Unsafe 132 10.9% 17 10.6% Very unsafe 96 7.9% 5 3.1% Don't know 14 1.2% 0 0.0%
Survey Results for Citizens and Neighborhood Contacts
46
How safe do you feel. . . . 16e. in the city parks during the day? Residents Neighborhood Contacts Number Percent Number Percent Very safe 207 17.1% 14 8.8% Safe 381 31.5% 60 37.5% Neutral 244 20.2% 31 19.4% Unsafe 86 7.1% 18 11.3% Very unsafe 58 4.8% 8 5.0% Don't know 234 19.3% 29 18.1% 16f. in city parks at night? Residents Neighborhood Contacts Number Percent Number Percent Very safe 46 3.8% 1 0.6% Safe 86 7.1% 2 1.3% Neutral 174 14.4% 22 13.8% Unsafe 214 17.7% 41 25.6% Very unsafe 360 29.8% 46 28.8% Don't know 330 27.3% 48 30.0%
Questions 17, 18, 19 – Visits to parks and park facilities. 17. During the past 12 months, approximately how many times did you or other members of your household visit any parks in Kansas City, Missouri? Residents Neighborhood Contacts Number Percent Number Percent At least once a week 171 14.1% 33 20.6%A few times a month 196 16.2% 26 16.3%Monthly 181 15.0% 26 16.3%Less than once a month 170 14.0% 38 23.8%Seldom or never 492 40.7% 37 23.1% 18. During the past 12 months, approximately how many times did you or other members of your household visit a city park in KCMO that is near your home? Residents Neighborhood Contacts Number Percent Number Percent At least once a week 163 13.5% 28 17.5%A few times a month 177 14.6% 22 13.8%Monthly 151 12.5% 21 13.1%Less than once a month 164 13.6% 41 25.6%Seldom or never 555 45.9% 48 30.0%
Appendix
47
19. During the past 12 months, approximately how many times did you or other members of your household use city recreation facilities, such as swimming pools, community centers, sports fields, golf courses, playgrounds, trails/paths, or ice arenas? Residents Neighborhood Contacts Number Percent Number Percent At least once a week 120 9.9% 18 11.3%A few times a month 164 13.6% 18 11.3%Monthly 120 9.9% 22 13.8%Less than once a month 131 10.8% 36 22.5%Seldom or never 673 55.6% 66 41.3%Don’t know 2 0.2% 0 0.0%
Questions 20 and 21 – Health insurance. 20. How many persons in your household are covered by some type of health insurance? Residents Neighborhood Contacts
Number Percent Number Percent 1 352 29.1% 36 22.5% 2 330 27.3% 65 40.6% 3 183 15.1% 23 14.4% 4 134 11.1% 25 15.6%
5+ 113 9.4% 8 5.0% 0 96 7.9% 3 1.9%
No response 2 0.2% 21. What types of health insurance do people in your household have? Residents Neighborhood Contacts Number Percent Number Percent Employer/school provided 665 55.0% 114 71.3% Medicare 201 16.6% 26 16.2% Medicare supplemental policy 53 4.4% 1 0.6% Medicaid 97 8.0% 1 0.6% MC+ 16 1.3% 0 0.0% Other type 72 6.0% 13 8.1% None 94 7.8% 3 1.9% Refused 12 0.9% 2 1.3%

Survey Results for Citizens and Neighborhood Contacts
48
Questions 22, 244, 25, 26, 27, 27a, 28, 29, 30, 31 – Demographic Information Question 22 – Household members. 22. Counting yourself, how many people regularly live in your household? Residents Neighborhood Contacts
Number Percent Number Percent 1 336 27.8% 34 21.2%2 340 28.1% 68 42.5%3 223 18.4% 22 13.8%4 165 13.6% 27 16.9%
5 or more 145 12.0% 7 4.4%Blank 1 0.1% 2 1.3%
24. Approximately how many years have you lived in the City of Kansas City, Missouri? Residents Neighborhood Contacts Number Percent Number Percent Under 3 years 77 6.4% 1 0.6%3 to 5 years 121 10.0% 5 3.1%6 to 10 years 117 9.7% 15 9.4%11 to 15 years 82 6.8% 11 6.9%16 to 20 years 74 6.1% 10 6.3%21 to 30 years 175 14.5% 24 15.0%31+ years 563 46.6% 92 57.5%Blank 1 0.1% 2 1.3%
25. Do you own or rent your current residence? Residents Neighborhood Contacts Number Percent Number Percent Own 755 62.5% 156 97.5%Rent 454 37.4% 2 1.3%Refused 1 0.1% 2 1.3%
4 Question 23 asked respondents to identify the number of household occupants under age 5, ages 5-9, ages 10 to 14, ages 15 to 19, etc. The results did not yield any meaningful differences between residents and neighborhood contacts.

Appendix
49
26. Which of the following best describes your race/ethnicity? Residents Neighborhood Contacts Number Percent Number Percent Asian/Pacific Islander 13 1.1% 0 0.0%White 747 61.7% 121 75.6%American Indian/Eskimo 16 1.3% 3 1.9%Black/African American 424 35.1% 29 18.1%Other 6 0.5% 1 0.6%Refused 4 0.3% 6 3.8% 27. Are any members Hispanic/Latino/Spanish ancestry? Residents Neighborhood Contacts Number Percent Number Percent Yes 126 10.4% 7 4.4%No 1080 89.3% 150 93.8%Refused 4 0.3% 3 1.9% 27a. (If yes to question 27) Do you or other members of your household speak Spanish as your primary language? Residents Neighborhood Contacts Number Percent Number Percent Yes 44 34.9% 2 28.6%No 72 57.1% 5 71.4%Refused 10 7.9% 0 0.0%
28. What is your age? Residents Neighborhood Contacts Number Percent Number Percent Under 25 116 9.6% 1 0.6%25 to 34 238 19.7% 3 1.9%35 to 44 237 19.6% 25 15.6%45 to 54 244 20.2% 55 34.4%55 to 64 162 13.4% 29 18.1%65+ 211 17.4% 43 26.9%Refused 2 0.2% 4 2.5%

Survey Results for Citizens and Neighborhood Contacts
50
29. What would you say your total household income is? Residents Neighborhood Contacts Number Percent Number Percent Under $30,000 404 32.4% 16 10.0%$30,000 to $59,999 395 32.6% 44 27.5%$60,000 to $99,999 168 14.9% 32 20.0%$100,000+ 54 4.5% 23 14.4%Refused 189 15.6% 45 28.1% 30. Respondent’s gender? Residents Neighborhood Contacts Number Percent Number Percent Male 544 45.0% 73 45.6%Female 666 55.0% 87 54.4% 31. Have you or other adult members of your household used the internet from your home during the past week? Residents Neighborhood Contacts Number Percent Number Percent Yes 567 46.8% 115 71.9%No 637 52.7% 44 27.5%No response 6 0.5% 1 0.6% 32. Would you be willing to attend a focus group or public meeting to discuss stormwater issues? Residents Neighborhood Contacts Number Percent Number Percent Yes 282 23.3% 101 63.1%No 928 76.7% 59 36.9%