Survey Research Results Sharon Gotter November 19, 2002
27
Survey Research Results Sharon Gotter November 19, 2002
-
Upload
tashya-hampton -
Category
Documents
-
view
27 -
download
0
description
Survey Research Results Sharon Gotter November 19, 2002. 2002 Survey. 603 interviews Field work late October, 2002 55 questions (including demographics) 15 minutes to complete each telephone interview ± 3.9% margin of error. Location of Respondents. - PowerPoint PPT Presentation
Transcript of Survey Research Results Sharon Gotter November 19, 2002

Survey Research Results
Sharon Gotter
November 19, 2002

2002 Survey 603 interviews
Field work late October, 2002
55 questions (including demographics)
15 minutes to complete each telephone interview
± 3.9% margin of error

Location of Respondents
0.0% 10.0% 20.0% 30.0% 40.0%
Jefferson County
St. Charles County
Madison County
St. Clair County
St. Louis City
St. Louis County
Franklin County
Monroe County

Priority of Local Challenges Priority of Local Challenges (%’s = very high priority)(%’s = very high priority)
1998 1999 2000 2001 2002
EconomicDevelopment
60.0% 60.0% 55.3% 65.9% 63.7%
EnvironmentalProblems
48.8% 54.1% 50.7% 53.0% 48.8%
Traffic andCongestion
56.8% 58.7% 56.3% 57.1% 56.9%
Fighting UrbanSprawl
30.9% 26.8% 29.8% 30.1% 27.0%

Seriousness of Environmental Issues (%’s = Very and moderately serious problem)
‘98 ‘99 ‘00 ‘01 ‘02
Lack oflandfillspace
46.7 42.1 51.6 39.7 45.6
Waterpollution
45.0 43.3 45.2 36.6 43.1
Poor airquality
54.1 57.7 58.1 49.2 58.2
Inadequaterecyclingprograms
54.0 47.6 44.9 45.0 43.9
Noisepollution
40.4 35.3 37.7 33.4 32.8

Pollution Prevention Terminology (%’s = Very & somewhat familiar)
‘98 ‘99 ‘00 ‘01 ‘02RideSharing 73.8 78.7 73.1 70.5 70.3
Orange AirQuality Day - 76.4 76.2 75.7 83.3
Smog 81.2 85.8 86.5 85.6 82.4Clean AirPasses 17.3 24.7 37.9 46.0 40.1
Red AirQuality Day 78.4 79.6 81.6 80.6 83.4

Familiarity with Daily Air Quality Information
1998 1999 2000 2001 2002VeryFamiliar
17.3% 25.5% 30.1% 24.0% 33.2%
SomewhatFamiliar
52.8% 45.3% 43.2% 45.9% 43.1%
Not VeryFamiliar
19.1% 17.2% 16.6% 20.2% 14.9%
Not At AllFamiliar
10.3% 11.9% 9.6% 9.9% 8.6%
TotalFamiliar
70.1% 70.8% 73.3% 69.9% 76.3%
Total NotFamiliar
29.4% 29.1% 26.2% 30.1% 23.5%

Familiarity with Daily Air Forecasts
2000 2001 2002
Very Familiar 34.9% 31.0% 38.3%
Somewhat Familiar 43.0% 46.9% 44.1%
Not Very Familiar 14.4% 13.9% 11.4%
Not At All Familiar 7.6% 8.3% 8.6%
Total Familiar 78.0% 77.8% 82.4%
Total Not Familiar 22.0% 22.2% 17.4%

Source of Daily Air Quality Information
1998 1999 2000 2001 2002
Television 66.6% 71.4% 78.8% 76.3% 78.3%
Radio 8.1% 7.7% 7.6% 6.1% 8.6%
Employer 0.7% 0.5% 0.2% - -
Dept. ofTransportation
6.1% 6.0% 4.3% 6.5% 7.3%
Newspaper 4.0% 3.3% 2.3% 3.0% 2.0%
Science CenterOverpass
2.7% 2.6% 1.7% 3.3% 0.8%
Other/DK 4.5% 4.5% 5.1% 2.0% 2.8%

Television Station - Heard Daily Air Information
1998 1999 2000 2001 2002
KSDKchannel 5
22.0% 27.3% 33.1% 29.0% 29.9%
KMOVchannel 4
29.1% 29.6% 36.1% 30.0% 28.2%
KTVIchannel 2
5.0% 8.0% 10.4% 10.9% 15.1%
KDNLchannel 30
1.0% 0.8% 1.2% 0.2% ---
KPLRchannel 11
- - 0.7% 1.0% 0.5%
Not asked 37.7% 27.1% - 22.5% 20.7%
Don’tKnow
4.5% 5.9% 18.5% 6.5% 5.8%

Station You Think of When You Hear “Air Quality”
1999 2000 2001 2002
KSDK channel 5 36.1% 33.1% 31.5% 36.5%
KMOV channel 4 35.6% 36.1% 34.4% 32.0%
KTVI channel 2 10.6% 10.4% 13.1% 18.4%
KDNL channel 30 0.8% 1.2% 1.0% ---
KPLR channel 11 1.0% 0.7% 1.5% 1.0%
Don’t Know 15.5% 18.5% 18.6% 13.1%

Aware of Red or Orange Air Quality Days
1998 1999 2000 2001 2002
Always 17.6% 15.7% 20.9% 17.4% 21.9%
Usually 34.1% 35.5% 35.9% 32.1% 35.7%
Sometimes 27.9% 27.6% 25.3% 30.8% 26.0%
Rarely 11.6% 12.3% 10.9% 11.1% 9.8%
Never 8.3% 8.3% 6.6% 8.1% 6.0%
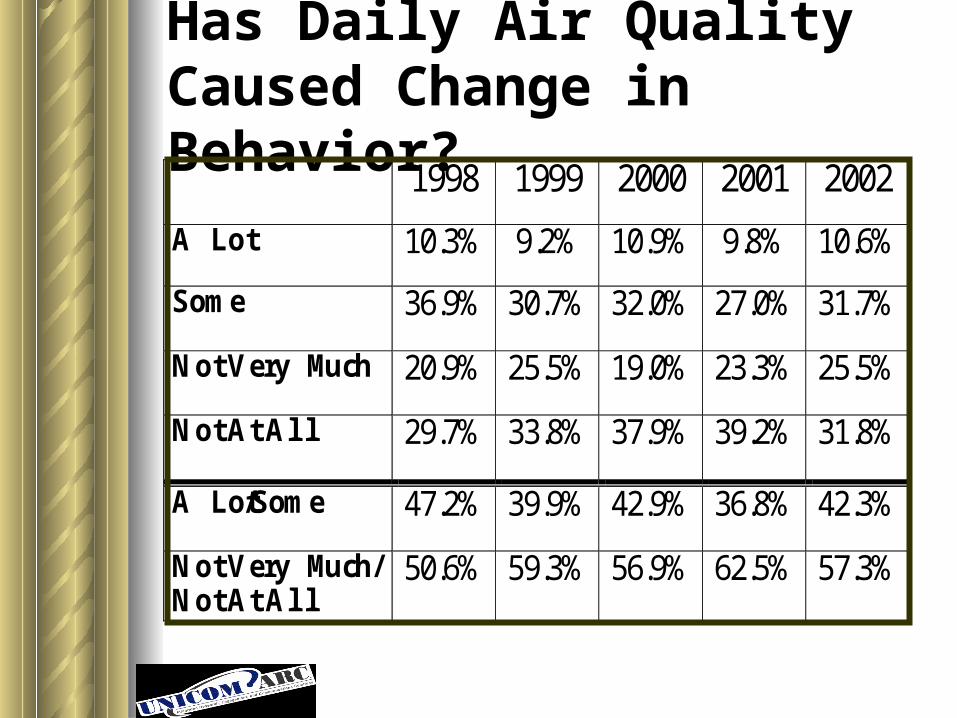
Has Daily Air Quality Caused Change in Behavior?
1998 1999 2000 2001 2002
A Lot 10.3% 9.2% 10.9% 9.8% 10.6%
Some 36.9% 30.7% 32.0% 27.0% 31.7%
Not Very Much 20.9% 25.5% 19.0% 23.3% 25.5%
Not At All 29.7% 33.8% 37.9% 39.2% 31.8%
A Lot/Some 47.2% 39.9% 42.9% 36.8% 42.3%
Not Very Much/Not At All
50.6% 59.3% 56.9% 62.5% 57.3%

Air Pollution in St. Louis1999 2000 2001 2002
Grown worse 38.9% 32.9% 32.8% 35.2%
Same 35.5% 41.2% 39.6% 39.5%
Gotten better 17.5% 18.4% 20.5% 17.4%
Other/DK 8.0% 7.5% 7.1% 8.0%

Methods to Improve Air QualityActions Improve
A LotTotal Improve
‘01 ‘02 ‘01 ‘02
Carpool towork
60.6% 60.5% 90.1% 90.0%
Ride the busor MetroLink
63.2% 52.7% 89.1% 83.9%
Not top offgas tank
27.0% 29.9% 62.9% 65.7%
Not fillinggas tankbefore 7:00pm
15.7% 15.9% 45.0% 48.4%

Methods to Improve Air QualityActions Improve
A LotTotal Improve
‘01 ‘02 ‘01 ‘02Not usingcharcoallighter fluidto barbecue
25.5% 21.7% 63.4% 54.2%
Use water-based paints
31.1% 29.9% 63.9% 63.7%
Postponemowing thelawn on redor orange airquality days
40.2% 34.8% 77.0% 67.3%

Change Daily Habits ifRed or Orange Day
1999 2000 2001 2002
A Lot 10.3% 12.9% 9.8% 12.3%
Some 36.9% 30.5% 29.3% 32.5%
Not VeryMuch
20.9% 22.2% 23.0% 20.6%
Not At All 29.7% 33.8% 37.9% 34.2%
A lot/some 47.2% 43.4% 39.1% 44.8%
Not very/notat all
50.6% 56.0% 60.9% 54.8%

Does Air Pollution Affect your Health?
2000 2001 2002
A Lot 27.0% 25.0% 24.4%
Some 13.2% 15.4% 19.4%
Not Very Much 2.6% 6.0% 3.8%
Not At All 1.5% 1.5% 1.2%
Other/DK 0.7% - 0.2%
Not asked 55.0% 52.2% 51.1%

How does Pollution Affect Health of People With Respiratory Problems?
2000 2001 2002
A Lot 38.6% 42.4% 43.0%
Some 2.2% 2.0% 3.2%
Not Very Much 0.0% 0.2% 0.2%
Not At All 0.2% 0.0% 0.0%
Other/DK 0.7% --- ---
Not asked 58.4% 55.5% 53.7%
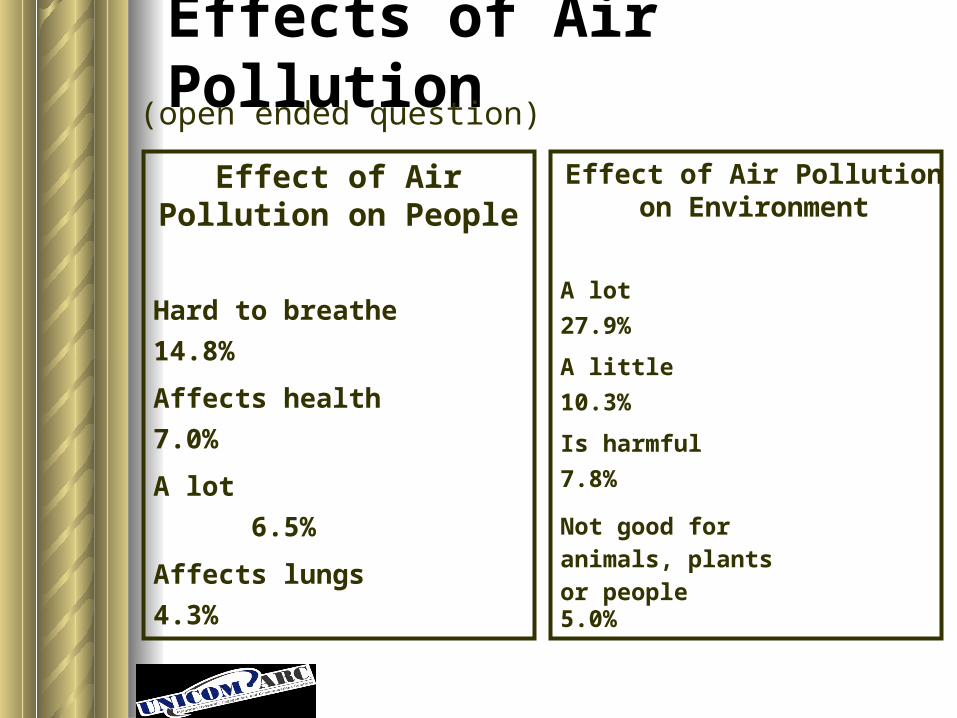
Effects of Air Pollution
Effect of Air Pollution on People
Hard to breathe 14.8%
Affects health 7.0%
A lot 6.5%
Affects lungs 4.3%
Effect of Air Pollution on Environment
A lot 27.9%
A little 10.3%
Is harmful 7.8%
Not good for animals, plantsor people 5.0%
(open ended question)
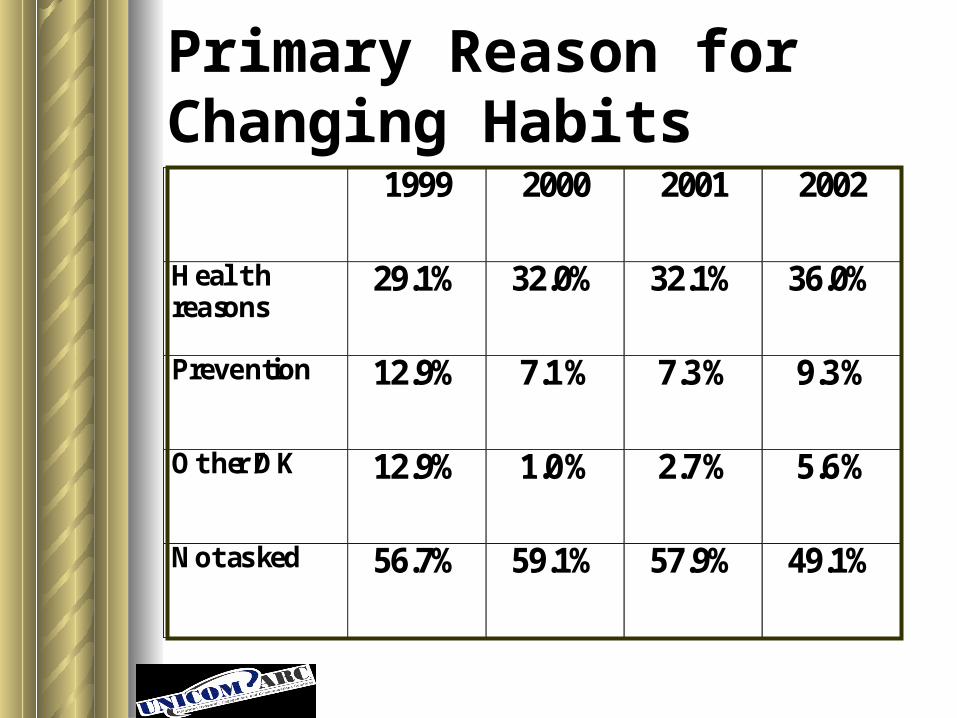
Primary Reason for Changing Habits
1999 2000 2001 2002
Healthreasons
29.1% 32.0% 32.1% 36.0%
Prevention 12.9% 7.1% 7.3% 9.3%
Other/DK 12.9% 1.0% 2.7% 5.6%
Not asked 56.7% 59.1% 57.9% 49.1%

Persuasive Statements about Air Pollution (%’s = Very and Somewhat Persuasive)
1998 2002If air pollution gets worse, it could leadto increased regulations on businesses.
77.2% 70.8%
Ground level ozone can causecoughing, wheezing, headaches...
91.3% 86.2%
Residents and businesses might leavethe region for areas with cleaner air,which would hurt the local economy.
73.1% 72.8%

Persuasive Statements about Air Pollution (%’s = Very and Somewhat Persuasive)
1998 2002Children are most affected by airpollution.
83.2% 81.3%
On days of high ozone, more people goto hospital for respiratory problems.
85.4% 80.1%
Air pollution is really harmful toelderly.
95.6% 94.2%
On high ozone days, people withrespiratory problems are forced to useadditional medication.
88.2% 88.1%

Reason to be Concerned about Air Quality (open-ended)
Response %
Health reasons 33.1%
Children 14.1%
For the future 8.9%
Hard to breathe 7.8%
Like to breatheclean air
4.6%

Familiarity with Clean Air Passes
2000 2001 2002Very 7.6% 7.1% 7.8%
Somewhat 20.5% 25.5% 23.9%
Not Very 19.5% 24.0% 22.6%
Not At All 51.7% 43.0% 45.3%
Totalfamiliar
28.1% 32.6% 32.7%
Total notfamiliar
71.2% 67.0% 67.9%

Interest in Clean Air Passes2000 2001 2002
Veryinterested
7.1% 8.1% 8.8%
Somewhatinterested
13.9% 16.4% 19.1%
Not veryinterested
15.7% 15.6% 15.1%
Not at allinterested
61.9% 59.6% 55.9%
Totalinterested
21.0% 24.5% 27.9%
Total notinterested
77.6% 75.2% 71.0%

Public Transportation’s Effect on Air Quality
2001 2002Very positive 23.3% 24.2%Somewhat positive 52.5% 43.0%No effect 6.8% 8.6%Somewhat negative 8.4% 11.9%Very negative 5.1% 5.8%Other/DK 3.8% 6.5%
Total Positive 75.8% 67.2%Total Negative 13.5% 17.7%