Survey provides the first ever ranking of Turkish...
14
Page 1 of 14 Survey provides the first ever ranking of Turkish multinationals investing abroad Istanbul and New York, December 03, 2009 Kadir Has University (KHU), the Foreign Economic Relations Board (DEIK), and the Vale Columbia Center on Sustainable International Investment (VCC), a joint initiative of the Columbia Law School and The Earth Institute at Columbia University in New York, are releasing today the results of the first ever survey of outward-investing Turkish multinational enterprises (MNEs). 1 The survey is part of a long-term study of the rapid global expansion of MNEs from emerging markets and updates existing information on the MNEs through fieldwork-based research. This report will be presented and discussed at the OECD’s “Eighth Global Forum on International Investment”, to be held in Paris, France, on 7 – 8 December 2009. The current global economic contraction has had a severe negative impact on Turkey’s outward foreign direct investment (OFDI). This can be seen by looking at aggregate OFDI data as of September 2009, which reflects a decline in absolute terms since 2008. Turkish outflows in the first nine months of 2009 fell by 62% from the first nine months of 2008, to USD 853 million from USD 2,255 million. Future surveys will establish the nature of the effects of the global downturn upon the Turkish MNEs’ more comprehensively. This survey ranks Turkish multinationals on the basis of their foreign assets (table 1 below). The 12 selected MNEs held just over USD 15.7 billion in foreign assets in 2007, with ENKA İnşaat ve Sanayi A.Ş. (ENKA), which ranked first, accounting for almost USD 3.9 billion and Turkcell İletişim Hizmetleri A.Ş. (Turkcell Communication Services PLC.) following with just over USD 2.3 billion. Together, these 12 companies had nearly USD 12 billion in foreign sales in 2007 and employed over 72,000 workers abroad. 1 The survey was carried out by a Kadir Has – DEIK team led by Dr. Sedat Aybar that included Mr. Hilmi Songur from Kadir Has University, and Dr. Nihan Yelutas and Mr. Samet Inanir from DEIK.
Transcript of Survey provides the first ever ranking of Turkish...

Page 1 of 14
Survey provides the first ever ranking of Turkish multinationals investing
abroad
Istanbul and New York, December 03, 2009
Kadir Has University (KHU), the Foreign Economic Relations Board (DEIK), and the Vale Columbia Center on Sustainable International Investment (VCC), a joint initiative of the Columbia Law School and The Earth Institute at Columbia University in New York, are releasing today the results of the first ever survey of outward-investing Turkish multinational enterprises (MNEs).1 The survey is part of a long-term study of the rapid global expansion of MNEs from emerging markets and updates existing information on the MNEs through fieldwork-based research. This report will be presented and discussed at the OECD’s “Eighth Global Forum on International Investment”, to be held in Paris, France, on 7 – 8 December 2009. The current global economic contraction has had a severe negative impact on Turkey’s outward foreign direct investment (OFDI). This can be seen by looking at aggregate OFDI data as of September 2009, which reflects a decline in absolute terms since 2008. Turkish outflows in the first nine months of 2009 fell by 62% from the first nine months of 2008, to USD 853 million from USD 2,255 million. Future surveys will establish the nature of the effects of the global downturn upon the Turkish MNEs’ more comprehensively. This survey ranks Turkish multinationals on the basis of their foreign assets (table 1 below). The 12 selected MNEs held just over USD 15.7 billion in foreign assets in 2007, with ENKA İnşaat ve Sanayi A.Ş. (ENKA), which ranked first, accounting for almost USD 3.9 billion and Turkcell İletişim Hizmetleri A.Ş. (Turkcell Communication Services PLC.) following with just over USD 2.3 billion. Together, these 12 companies had nearly USD 12 billion in foreign sales in 2007 and employed over 72,000 workers abroad.
1 The survey was carried out by a Kadir Has – DEIK team led by Dr. Sedat Aybar that included Mr. Hilmi Songur from Kadir Has University, and Dr. Nihan Yelutas and Mr. Samet Inanir from DEIK.

Page 2 of 14
Table 1: KHU-DEIK-VCC ranking of selected Turkish multinationals, 2007 (USD million)
Rank Name Industry Foreign Assets
1 Enka Construction Infrastructure 3,877 2 Turkcell Communication 2,331 3 Çalık Holding Conglomeratea 2,002 4 Koç Holding Conglomeratea 1,742 5 Anadolu Group Conglomeratea 1,629 6 Turkish Petroleum Corporation (TPAO) Oil & gas operations 1,121 7 Şişecam A.Ş. Glass manufacturing 977 8 Tekfen Holding Conglomeratea 751 9 Sabancı Holding Conglomeratea 640 10 Eczacıbaşı Holding Conglomeratea 266 11 Borusan Holding Conglomeratea 223 12 Zorlu Enerji Group Energy 152
Total 15,711
Source: Kadir Has University, DEİK-Vale Columbia Center survey of Turkish multinationals.
aConglomerates (also known as holdings) are large family-owned companies similar to chaebols in South Korea, keiretsus in Japan or grupos in Chile. The main operating sectors of the selected conglomerates are reported in table 3 below.
The principal findings of the survey include the following: The 12 listed2 MNEs – ranked by foreign assets held in 2007 – had USD 15.7 billion
3 in assets abroad (table 1), had just over USD 11.9 billion in foreign sales and employed 72,334 persons abroad (table 2). Foreign assets, sales and employment had increased by 32%, 17% and 37% respectively between 2006 and 2007 (table 2). The largest concentration of foreign affiliates was in Europe (188 affiliates), representing 72% of all foreign affiliates. ENKA contributed approximately 25% of the total foreign assets of the selected 12, while Turkcell contributed another 15%. Note that, as a percentage of the USD 12.2 billion in foreign stock held by Turkish enterprises in 2007 (annex figure 5), the foreign assets of these 12 companies were about 129%. It remains to be seen what broad impact the current crisis will have on Turkish multinationals. Turkish firms in a good financial position may take advantage of the low asset prices in world markets and make strategic acquisitions. Other firms may need to put their foreign expansion on hold or even sell off foreign assets to support their balance sheets.
2 Kadir Has University and DEİK together conducted several rounds of surveys with the largest Turkish MNEs. In addition, extensive research was done from publicly available data to determine the level of foreign assets. The companies in this list are those that responded to the surveys or for which reliable public data could be found. As a result, some MNEs which own substantial foreign assets do not appear on the list. 3 The following TL/USD exchange rates, based on the rates of the Central Bank of the Republic of Turkey
(http://www.tcmb.gov.tr ) for December 31, were used throughout: per USD 1, TL 1.1666 (2007); 1.4145 (2006); 1.3503 (2005).

Page 3 of 14
Profile of the 12
• Foreign assets increased by 32% between 2006 and 2007. • Turkish multinationals lagged behind their counterparts in many emerging markets.
Only ENKA, Turkcell and the Çalık Group had over USD 2 billion in foreign assets, and only ENKA employed a significant number of people (33,676) abroad (annex table 1).
• Between 2006 and 2007, Turkish multinationals increased their foreign sales by 37%, to nearly USD 12 billion, and foreign employment by 17%, to just over 72,000 people (table 2).
• Foreign assets and sales as a percentage of the total assets and sales of these
companies were about 10% and 13% respectively in 2007, while foreign employment represented 27% of total employment (table 2). These percentages held fairly steady over the period 2005−2007.
• Between 2006 and 2007, foreign assets grew at a slightly lower rate than total assets,
while foreign sales grew at a slightly higher rate. Foreign employment, however, grew at more than twice the rate of total employment in the same period. The USD 3.8 billion rise in foreign assets represented just over 9% of the USD 41.3 billion increase in total assets, and the USD 3.2 billion increase in foreign sales accounted for 14.6% of the USD 22 billion increase in total sales (table 2).
Table 2: Snapshot of the 12 selected MNEs, 2005-2007 (USD million and thousands of employees)
Variable 2005 2006 2007 % change 2006-2007
ASSETS
Foreign 10,578 11,927 15,711 32%
Total 99,347 120,146 161,517 34%
Share of foreign in total (%) 11% 10% 10%
EMPLOYMENT
Foreign 59,312 61,920 72,334 17%
Total 230,857 252,229 270,391 7%
Share of foreign in total (%) 26% 25% 27%
SALES
Foreign 7,488 8,733 11,937 37%
Total 47,220 69,350 91,349 32%
Share of foreign in total (%) 16% 13% 13%
Source: Kadir Has University, DEİK and Vale Columbia Center survey of Turkish multinationals.
• The 12 selected companies had 248 foreign affiliates in 61 countries. Koç Holding led with 55 foreign affiliates in 28 countries, followed by ENKA with 42 foreign affiliates in 9 countries, and Sabancı Holding, with 33 foreign affiliates in 7 countries (annex table 1).

Page 4 of 14
• These 248 foreign affiliates were concentrated in Europe (76%), and Asia & Australia
(17%), as indicated by the Regionality Index (annex table 2) and as seen in the distribution of foreign affiliates (annex figure 1).
• Most of the outward investment from Turkey by 2007 had been made by publicly
listed companies. The two companies on the list that were not publicly listed were the Çalık Group, a conglomerate with USD 2 billion in foreign assets, and the Turkish Petroleum Corporation, a state-controlled company with just over USD 1.1 billion in foreign assets in which the Turkish government holds a 100% equity stake. The remaining ten together accounted for USD 12.58 billion in foreign assets.
• The companies on the list were to be found in six different industries, if
conglomerates are counted as one. Judged by foreign assets, conglomerates dominate, with 46% of the aggregate assets. The infrastructure industry comes next, with 25% of the list’s assets, while communication is third, with 15% (annex figure 2). Conglomerates are the leading group on the list, with seven companies. The other sectors represented are infrastructure, communication, oil & gas operations, glass manufacturing, and energy.
Table 3: Main operating industries of the listed conglomerates
Conglomerate Main industries Anadolu Endüstri Holding A. Ş. Food & beverages, automotive, finance, stationary, and health Borusan Holding Steel, distribution, energy, logistics and telecommunications. Çalık Holding A.Ş. Textiles, energy, construction, finance, logistics, and media.
Eczacıbaşı Group Building products, healthcare, consumer products, finance, information technology, and welding technology.
Hacı Ömer Sabancı Holding A.Ş. Banking, tire, tire reinforcement materials and automotive, retail, cement, energy, and insurance
Koç Holding Energy, automotive, consumer durables, and finance
Tekfen Holding Inc. Contracting, agro-industry, real estate development, banking, investment, and insurance
Source: Kadir Has University, DEİK and Vale Columbia Center survey of Turkish multinationals.
• Ten of the 12 selected MNEs were, and continue to be, headquartered in Istanbul; one
in Bursa; and one in Ankara (annex figure 3).
• Ten of the 12 selected companies were listed on the Istanbul Stock Exchange. Turkcell İletişim Hizmetleri A.Ş. is also listed on the New York Stock Exchange, Anadolu Endüstri Holding A.Ş. on the London Stock Exchange and Eczacıbaşı Group on the Frankfurt and Dusseldorf Stock Exchanges. Two companies, Çalık Group and the Turkish Petroleum Corporation, were not listed anywhere.
• The official language of all companies on the list is Turkish. Two companies, Enka
and Eczacıbaşı, also use English as an official language.

Page 5 of 14
The big picture
The new surge in Turkey's OFDI has been caused by both economic and political factors. The domestic economic crisis of the early 2000s, rising unit labor costs and a dynamic private sector energetically chasing profits are the main economic factors that led to an increase in Turkish OFDI. The emergence of newly independent Turkic republics in Central Asia after the collapse of the USSR can be singled out as the most significant external political development that helped the rise of Turkish OFDI.
The source of the rise in OFDI can be traced back even further to 1980, when Turkey decided to reverse its economic misfortunes by embracing a more open economy and replace its developmental strategy of import substitution with an export orientation. Since then, Turkey’s foreign trade has grown in both volume and value, and the customs union with the European Union in 1996 has increased it even more. Although Turkey’s inward and outward FDI performance has been unsatisfactory when set beside that of comparable developing countries, the Turkish economy appears to have reached a stage where it can take full advantage of globalization through OFDI.
Although Turkish firms have been investing abroad for many years, it is only since the late 1990s that OFDI flows have risen rapidly, although from very low levels (annex figure 4). As a result of the growth of outflows, the stock of OFDI rose from about 1 billion USD in 1990 to about USD 3.7 billion in 2000, and then to USD 12.2 billion in 2007 (annex figure 5), taking Turkey to the 72nd place among all outward-investing countries in 2007. Turkey also began attracting IFDI after carrying out rigorous economic reforms which included an aggressive privatization of state-owned enterprises, a reduction in the chronically high rates of inflation to single digits, and an increase in the economic growth rate in the early 2000s. All of these gains, however, are neutralized if not reversed by the current global economic contraction.
As a result of economic crises in November 2000 and February 2001, Turkey was encouraged to improve its FDI environment as part of the conditionality for the IMF’s financial assistance, a condition absent in the earlier Stand-by Agreements. The Turkish FDI regime and environment have been improved by dealing with issues relating to employment, company registration and reporting, the location and operation of foreign companies, the tax, trade and customs regimes, ex-post monitoring and site inspections, and the strengthening of intellectual and industrial property rights.
Since November 2002, Turkey has recognized the importance of inward FDI as a contributor to the country's economic development. The major achievement of the government has been the enactment of the new FDI law, Law 4875, in June 2003, to replace the old FDI law, Law 6224, which dated back to 1954. The new law put in place an approval and screening mechanism with a notification and registration system, banned expropriation without fair compensation, introduced guarantees of equal treatment to foreign investors, removed performance requirements and restrictions on FDI in any sector, eliminated the old minimum capital requirements, granted foreign investors full convertibility in their transfers of capital and earnings, allowed them to own property without any restrictions, and recognized their right to international arbitration.
In the case of OFDI, Turkish companies evolved into MNEs after their home country advantages eroded with greater openness and increased international competition. Challenged

Page 6 of 14
on their home turf, they began to search for markets and technology to compete successfully in the global economy. It seems that the origins of OFDI by Turkey's largest conglomerates are a mixture of defensive and offensive factors. Turkish companies and the home economy can both benefit from OFDI, though there exist some concerns in Turkey that OFDI means unemployment, particularly during an economic downturn.
For further information please contact: Kadir Has University, Istanbul
Sedat Aybar
Economics Department, Kadir Has University [email protected] 90-212 533 65 32 ext. 1604
Hilmi Songur
Project Coordinator, Kadir Has University [email protected] 90-212 533 65 32 ext. 1626 Foreign Economic Relations Board of Turkey
Samet İnanır
Counsellor [email protected] 90-212 339 50 56
Vale Columbia Center on Sustainable
International Investment
Karl P. Sauvant, Executive Director 1-646-724-5600 [email protected] Vishwas P. Govitrikar, Global Coordinator, 1-347-350-6935 [email protected]
Emerging Markets Global Players Project The KHU, DEIK, and VCC ranking of Turkish multinational enterprises was conducted within the framework of the Emerging Market Global Players Project, an international, collaborative effort led by the Vale Columbia Center. The project brings together researchers on foreign direct investment from leading institutions in emerging markets to generate annual ranking lists of emerging market MNEs. It was launched in 2007 and the first rankings, for Brazil and Russia, were published in December of that year. The present report is the sixth to appear in 2009 (the previous five being on MNEs from India, Israel, Argentina, Brazil and Russia). Others expected in December include reports on China, Mexico and Slovenia. Visit http://www.vcc.columbia.edu/projects/#Emerging for further information.
Kadir Has University
Kadir Has University (KHU), located in Istanbul, Turkey, was founded in 1997. The University has about four thousand students studying in six faculties: Engineering, Economics and Administrative Sciences, Communications, Sciences and Literature, Fine Arts, and Law. The student body is international and includes many European nationals. The number of full- and part-time staff is about three hundred. The main campus of the university is located at the heart of historic Istanbul in a prize-winning set of buildings. KHU has close relationships with a number of foreign universities, including London, Purdue, and Fordham. The Rector of KHU is Dr. Yücel Yılmaz. For more information, see www.khas.edu.tr.

Page 7 of 14
Foreign Economic Relations Board of Turkey Formed in 1988, Foreign Economic Relations Board of Turkey (DEİK) aims to pave the way for the development of Turkey’s economic, commercial, industrial and financial relations with foreign countries as well as international business communities, by acting as an intermediary between the public and private sectors in both Turkey and abroad. As of November 2009, DEİK has more than 1500 representatives from more than 700 member companies. The Chairman of DEİK, M. Rifat Hisarcıklıoğlu, is also the Chairman of the Union of Chambers and Commodity Exchanges of Turkey (TOBB). For further information, see http://www.deik.org.tr.
Vale Columbia Center on Sustainable International Investment
The Vale Columbia Center on Sustainable International Investment (VCC), led by Karl P. Sauvant, is a joint center of Columbia Law School and The Earth Institute at Columbia University. It seeks to be a leader on issues related to FDI in the global economy. The VCC focuses on the analysis and teaching of the implications of FDI for public policy and international investment law. Its objectives are to analyze important topical policy-oriented issues related to FDI, develop and disseminate practical approaches and solutions, and provide students with a challenging learning environment. For more information, see www.vcc.columbia.edu.

Page 8 of 14
Annex table 1. KHU, DEİK and VCC ranking of the 12 selected Turkish multinationals, key variables, 2007 (millions of USDa and number of employees)
a
Ranking Assets Sales Employment
By foreign assets
By multi-nationality index
b Name Industry Foreign Total Foreign Total Foreign Total
Multi-nationality Index (%)
No. of foreign
affiliates
No.of host countries
1 1 Enka Construction Infrastructure 3,877 7,853 2,719 5,888 33,676 34,486 64% 42 9
2 7 Turkcell Communication 2,331 8,469 1,742 6,329 2,477 9,000 18% 10 4
3 2 Calık Holding Conglomerate 2,002 3,336 757 1,262 9,134 15,223 60% 15 6
4 12 Koç Holding Conglomerate 1,741 51,180 1,500 44,085 2,882 84,687 2% 55 28
5 4 Anadolu Group Conglomerate 1,629 6,343 1,114 3,772 6800 17,500 31% 30 15
6 3 Turkish Petroleum Corporation (TPAO) Oil & gas operations 1,121 2,690 1,248 2,164 46 4,965 34% 6 4
7 6 Sisecam AS Glass 977 4.455 459 2.767 4.646 17.028 22% 24 9
8 5 Tekfen Holding Conglomerate 751 2,075 840 1,625 6,915 16,838 27% 14 7
9 11 Sabancı Holding Conglomerate 640 68,001 939 16,579 3,932 57,263 4% 33 17
10 9 Eczacıbaşı Holding Conglomerate 266 4,120 290 3,519 1,265 9.274 9% 4 2
11 8 Borusan Holding Conglomerate 223 2,025 325 2,958 516 4,692 11% 12 8
12 10 Zorlu Enerji Group Energy 152 968 4 403 45 537 8% 3 3
TOTAL 15,711 161,517 11,937 91,349 72,334 270,391 32% 248
Source: Kadir Has University, DEİK and Vale Columbia Center survey of Turkish multinationals.
a TL/USD exchange rate used is USD 1 = TL 1.1666. b The multinationality index is calculated as the average of the following three ratios: foreign assets to total assets, foreign sales to total sales, and foreign employment to total employment.

Page 9 of 14
Annex table 2. The 12 selected Turkish MNEs: Regionality Index,a 2007
Companies Europe Africa North
America South America
Asia & Australia
No. of Foreign Affiliates
Enka Construction 93 0 0 0 7 42
Turkcell 90 0 0 0 10 10
Çalık Holding 27 7 13 0 53 15
Koç Holding 89 0 0 2 9 55
Anadolu Group 57 0 0 0 43 30
Turkish Petroleum Corporation 33,3 0 0 33,3 33,3 6
Sisecam AS 92 4 0 0 4 24
Tekfen Holding 79 0 7 0 14 14
Sabancı Holding 64 9 3 9 15 33
Eczacıbaşı Holding 100 0 0 0 0 4
Borusan Holding 67 8 0 0 25 12
Zorlu Enerji 67 0 0 33 0 3
TOTAL No. of Affiliates 188 6 5 6 43 248
Source: Kadir Has University, DEİK and Vale Columbia Center survey of Turkish multinationals.
a The Regionality Index is calculated by dividing the number of a firm’s foreign affiliates in a particular region of the world by its total number of foreign affiliates and multiplying the result by 100.

Page 10 of 14
Annex figure 1. Foreign affiliates of the 12 selected Turkish multinationals, by region, 2007 (number of affiliates)
Source: Kadir Has University, DEİK and Vale Columbia Center survey of Turkish multinationals.

Page 11 of 14
Annex figure 2. Breakdown of the foreign assets of the 12 selected Turkish multinationals, by industry, 2007
Conglomerate 46%
Infrastructure 25%
Communication 15%
Oil & gas operations
7%
Glass 6%
Energy 1%
Industry Foreign assets (USD mn) Companies
Conglomerates 7,253 (7) Çalık Holding A.Ş. , Koç Holding, Anadolu Endüstri Holding A. Ş. , Tekfen Holding Inc., Hacı Ömer Sabancı Holding A.Ş., Eczacıbaşı Group, Borusan Holding
Infrastructure 3,877 (1) Enka Construction & Industry Co. Inc. Communication 2,331 (1) Turkcell İletişim Hizmetleri A.Ş. Oil & gas operations 1,121 (1) Turkish Petroleum Corporation (TPAO) Glass manufacturing 977 (1) Sisecam AS Energy 152 (1) Zorlu Enerji Group
Source: Kadir Has University, DEİK and Vale Columbia Center survey of Turkish multinationals.

Page 12 of 14
Annex figure 3. Head office locations of the 12 Selected Turkish multinationals, 2007
Source: Kadir Has University, DEİK and Vale Columbia Center survey of Turkish multinationals.
Page 13 of 14
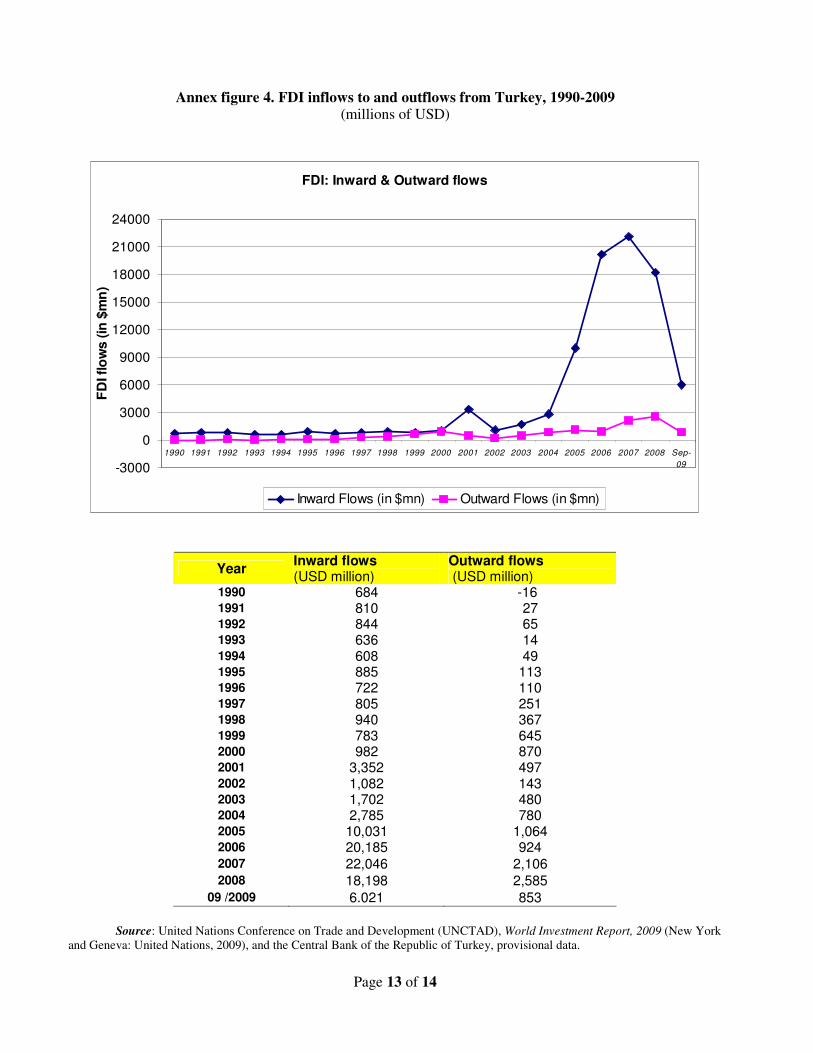
Annex figure 4. FDI inflows to and outflows from Turkey, 1990-2009 (millions of USD)
FDI: Inward & Outward flows
-3000
0
3000
6000
9000
12000
15000
18000
21000
24000
1990 1991 1992 1993 1994 1995 1996 1997 1998 1999 2000 2001 2002 2003 2004 2005 2006 2007 2008 Sep-
09
FD
I flo
ws (in
$m
n)
Inward Flows (in $mn) Outward Flows (in $mn)
Year Inward flows (USD million)
Outward flows (USD million)
1990 684 -16 1991 810 27 1992 844 65 1993 636 14 1994 608 49 1995 885 113 1996 722 110 1997 805 251 1998 940 367 1999 783 645 2000 982 870 2001 3,352 497 2002 1,082 143 2003 1,702 480 2004 2,785 780 2005 10,031 1,064 2006 20,185 924 2007 22,046 2,106 2008 18,198 2,585
09 /2009 6.021 853
Source: United Nations Conference on Trade and Development (UNCTAD), World Investment Report, 2009 (New York and Geneva: United Nations, 2009), and the Central Bank of the Republic of Turkey, provisional data.

Page 14 of 14
Annex figure 5: Stock of inward and outward FDI, 1990-2008 (millions of USD)
FDI Stock (in $mn)
$0
$15.000$30.000
$45.000
$60.000
$75.000$90.000
$105.000
$120.000
$135.000$150.000
$165.000
$180.000
1990 1995 2000 2006 2007 2008
FD
I S
toc
k in
$m
n
Inward Stock (in $mn) Outward Stock (in $mn)
Year Inward stock (USD million)
Outward stock (USD million)
1990 11,189 1,157
1995 14,972 1,425
2000 19,204 3,668
2006 95,078 8,866
2007 157,649 12,210
2008 69,817 13,865
Source: United Nations Conference on Trade and Development (UNCTAD), World Investment Report,
2009 (New York and Geneva: United Nations, 2009).


![Turkish Van Cat and Turkish Angora Cat: A Revie · Turkish Van Cat and Turkish Angora Cat: A Review 156 Fig. 6 Some morphological properties of Turkish Angora cat [15]. Table 2 Turkish](https://static.fdocuments.in/doc/165x107/5f0387937e708231d40981f4/turkish-van-cat-and-turkish-angora-cat-a-turkish-van-cat-and-turkish-angora-cat.jpg)