Survey produced for the AGR by 2003 Survey - Winter.pdf · The questionnaire contained twenty...
32
Transcript of Survey produced for the AGR by 2003 Survey - Winter.pdf · The questionnaire contained twenty...


All information contained in this report is believed to be correct and unbiased,butthe publisher
does not accept responsibility for any loss arising from decisions made upon this information.
© High Fliers Research Limited and the Association of Graduate Recruiters 2003.
All rights reserved. No part of this publication may be reproduced,stored in a retrieval system,or
transmitted in any form or by any means, electronic,mechanical,photocopying or otherwise,
withoutthe prior permission of the publisher.
Survey produced for the AGR by:
High Fliers Research Limited10a Belmont StreetCamden Town London NW1 8HH
T: 020 7428 9000 F: 020 7428 9111 E: [email protected]: www.highfliers.co.uk
Association of Graduate RecruitersThe Innovation CentreWarwick Technology ParkGallows HillWarwick CV34 6UW
T: 01926 623236 F: 01926 623237E: [email protected]: www.arg.org.uk

Page
Executive Summary 5
1 Introduction 7
A Fresh Approach to Employer Research
Survey Methodology
Participating Employers
2 Graduate Vacancies 9
Comparing Graduate Vacancies in 2002 & 2003
Profiling Graduate Vacancies in 2002
Changes in Graduate Vacancies in 2003
3. Graduate Starting Salaries 17
Comparing Graduate Salaries in 2002 & 2003
Profiling Graduate Salaries in 2002
Changes in Graduate Salaries in 2003
4. Graduate Recruitment Marketing 25
Spending on Brochures & Websites
Spending on Advertising & Online Promotions
Spending on Careers Fairs & On-Campus Presentations
Total Marketing Spending in 2003
Perceptions of the Current Graduate Market
Contents
Page 3

Make sure you get the insider’sview on graduate recruitment.
The AGR Graduate Recruitment SurveyPublished twice each year in January and July, exclusively for AGR members.

The AGRGraduate Recruitment Survey 2003 Winter Review
Executive Summary
Page 5
About the SurveyThe Winter Review from the new AGR Graduate Recruitment Survey 2003, is based on research
conducted for the AGR by High Fliers Research with 222 graduate employers during December 2002.
The survey has been developed from the AGR’s Graduate Salaries & Vacancies Survey to provide
employers with the very latest market information on:
• Graduate salary levels for the 2002/3 and 2001/2 recruiting seasons
• Vacancy levels for graduates to start work in 2003 and 2002
• Graduate recruitment marketing used by AGR employers during the 2002/3 and 2001/2
recruitment rounds
Graduate VacanciesFollowing a dip in graduate vacancies during the 2001-2002 recruitment season, AGR employers predict
an increase in vacancies for graduates starting work in 2003:
• Graduate vacancies are expected to increase by 7.9% in 2003, compared to the numbers actually
recruited in 2002.
• The highest volume of vacancies in 2003 are likely to be in accountancy or professional services
firms, engineering or industrial companies, investment banks, law firms or retailers.
• Almost half of all vacancies for 2003 are expected to be in London or the south east of England.
• Measured by business functions or career areas within organisations, the most vacancies in 2003
are for graduates working in chartered accountancy, general management, IT, engineering, or
investment banking. Together these areas account for nearly 60% of all graduate vacancies.
• The smallest numbers of vacancies in 2003 are for graduate positions in logistics.
Graduate SalariesDespite the uncertainty of the graduate market in 2002, AGR employers are expecting to pay increased
starting salaries for new graduates starting work in 2003:
• Graduate starting salaries are expected to increase by 2.5% in 2003, compared to the salary rates
actually paid in 2002. The predicted median graduate starting salary for 2003 is £20,000.
• The highest starting salaries in 2003 are being offered by investment banks, consulting or business
service firms, law firms, oil companies, and fast-moving consumer goods companies.
• Regionally, median salaries are expected to be highest in London, the south east,and south west
of England,with the lowest rates paid in Scotland, the Midlands and Yorkshire.
• Measured by business functions or career areas within organisations, the highest starting salaries
in 2003 are for graduate positions in investment banking, consulting, solicitors or barristers,
actuarial work,and IT. The lowest salaries are for positions in human resources.
• A third of employers continue to offer new graduates an initial bonus or cash payment.

Graduate Recruitment MarketingAGR employers’spending on graduate recruitment marketing activities have been profiled for the first
time:
• The median amount spent by AGR employers on their individual graduate recruitment brochure in
2003 was £16,000, with a further £12,000 for their graduate recruitment website.
• Spending on graduate recruitment advertising in careers publications and other paper-based titles
was a median of £20,000 in 2003. A median of £8,600 spent on online promotions.
• Employers who attended graduate careers fairs and on-campus presentations spent medians of
£8,000 and £5,000 respectively.
• The total amount spent on graduate recruitment marketing by AGR employers in 2003 was a
median of £53,500, up 3% on spending in 2002.
• The median ‘marketing spend per graduate vacancy’ was £1,500 in 2003 although the survey
reported spending of nearly double this for public sector recruiters and those from fast-moving
consumer goods companies.
Page 6
The AGRGraduate Recruitment Survey 2003 Winter Review
The AGRGraduate Recruitment Survey 2003 Winter Review
Chapter 1
Introduction
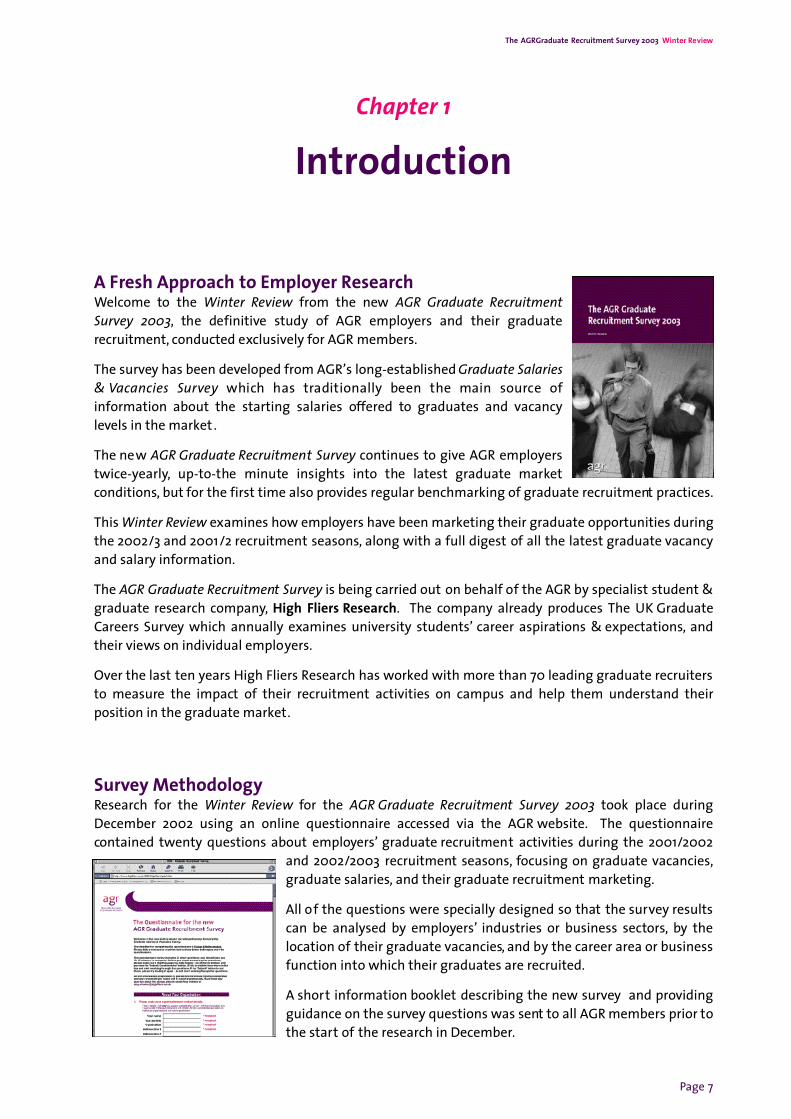
A Fresh Approach to Employer ResearchWelcome to the Winter Review from the new AGR Graduate Recruitment
S u rvey 2003, the definitive study of AGR employers and their gra d u at e
recruitment, conducted exclusively for AGR members.
The survey has been developed from AGR’s long-established Graduate Salaries
& Vacancies Survey which has t raditionally been the main source of
information about the starting salaries offered to graduates and vacancy
levels in the market .
The new AGR Graduate Recruitment Survey continues to give AGR employers
t w i ce - ye a r l y, u p - to-the minute insights into the lat e s t g ra d u ate marke t
conditions, but for the first time also provides regular benchmarking of graduate recruitment practices.
This Winter Review examines how employers have been marketing their graduate opportunities during
the 2002/3 and 2001/2 recruitment seasons, along with a full digest of all the latest graduate vacancy
and salary information.
The AGR Graduate Recruitment Survey is being carried out on behalf of the AGR by specialist student &
graduate research company, High Fliers Research. The company already produces The UK Graduate
Careers Survey which annually examines university students’ career aspirations & expectations, and
their views on individual employers.
Over the last ten years High Fliers Research has worked with more than 70 leading graduate recruiters
to measure the impact of their recruitment activities on campus and help them understand their
position in the graduate market.
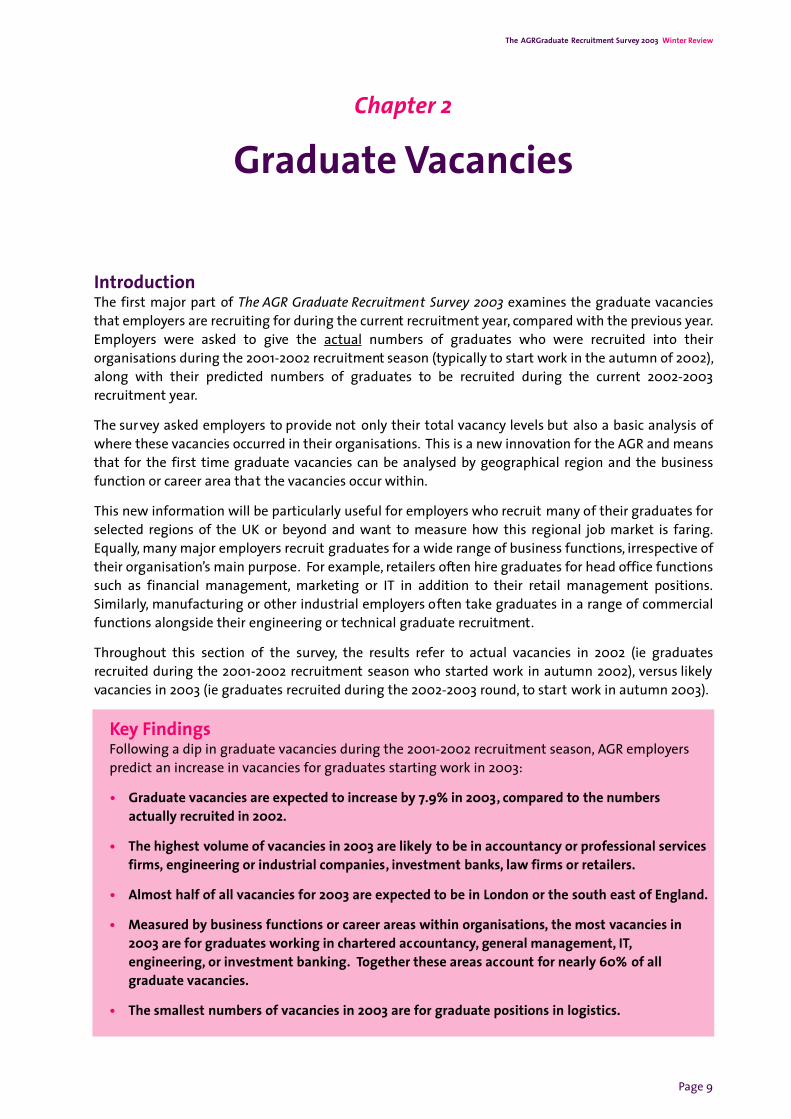
Survey MethodologyResearch for the Winter Review for the AGR Graduate Recruitment Survey 2003 took place during
December 2002 using an online questionnaire accessed via the AGR website. The questionnaire
contained twenty questions about employers’ graduate recruitment activities during the 2001/2002
and 2002/2003 recruitment seasons, focusing on graduate vacancies,
graduate salaries, and their graduate recruitment marketing.
All of the questions were specially designed so that the survey results
can be analysed by employers’ industries or business sectors, by the
location of their graduate vacancies, and by the career area or business
function into which their graduates are recruited.
A short information booklet describing the new survey and providing
guidance on the survey questions was sent to all AGR members prior to
the start of the research in December.
Page 7

Participating EmployersIn all,High Fliers Research contacted 320 AGR employers to participate in the AGR Graduate Recruitment
Survey 2003. The online questionnaire was live for a fortnight during December 2002 and the deadline
was extended for two further weeks to encourage the maximum number of employers to participate
in the research.
A total of 222 employers either completed the questionnaire or confirmed that they had not recruited
in graduates in 2002 and had no recruitment plans for 2003, giving the survey a response rate of 69%.
The AGR members who took part in the survey are:
3Com Europe Limited
3M UK PLC
ABB Limited
Abbey National
Abbey National Treasury Services
ABP
Accenture
Addleshaw Booth & Co
Airbus UK
AIT
Aker Kvaerner
Allen & Overy
Alstom
AMEC
ARUP
Asda
AstraZeneca
AvestaPolarit Ltd
BAE SYSTEMS
Bank of England
Barclays Bank plc
BDO Stoy Hayward
BG Group
Black & Decker
BMW (UK) Manufacturing
BNFL
BP plc
British Energy
British Sugar
BT
BUPA
Cadbury Schweppes
Cap Gemini Ernst & Young
Capital One
Carillion plc
Caterpillar
CB Hillier Parker
Centrica
CIBC World Markets
CIS Ltd
Civil Service FastStream, Cabinet
Office
Clifford Chance
Clyde & Co.
CMS Cameron McKenna
Commerzbank
Corus
Countryside Properties plc
CreditSuisse FirstBoston
Croda International plc
Data Connection
Debenhams plc
Deloitte & Touche
Derwent Information
Deutsche Bank
Dixon Wilson
DLA
DrKW
EC Harris
EDS
Enterprise Rent-a-Car
Ernst & Young
Eversheds
Exel
ExxonMobil
Fidelity Investments
Filtrona PLC
Ford Financial
Ford Motor Company Ltd
FSA
GCHQ
GKN Plc
Government Audit Commission
Government Economic Service
Grampian Country Food Group
Grant Thornton
Greggs Plc
GW Padley Poultry Ltd
Hammond Suddards Edge
Harrods Ltd
HAT Group of Accountants
HaymarketBusiness Publications
HBOS plc.
Herbert Smith
Highways Agency
HM Customs & Excise
HM Prison Service
HSBC Bank plc
Huntsman Tioxide
HW Fisher & Company
ICI
ING
Inland Revenue
Investec
Jaguar and Land Rover
John Lewis (Department Stores)
Johnson Matthey plc
JPMorgan
Kerry Foods
Kimberly-Clark Ltd
Kodak Limited
KPMG
Kvaener E+C
L'Oreal
Lazard
LE Group
Linklaters
Lloyds TSB plc
Local Government
Logica
Lovells
Marks and Spencer
Matalan
Mazars
McDonald's Restaurants Ltd
McKinsey and Company
Merrill Lynch
Microsoft Ltd
Ministry of Defence
Moore Stephens
Morgan Stanley
Mouchel
Mowlem plc
MW Kellogs Ltd
Nabarro Nathanson
National Australia Group
National Grid
Nationwide Building Society
Nestle UK Ltd
NextPLC
NFU Services Ltd.
NHS (England)
Northern Foods plc
Norwich Union
Oracle Corporation UK Ltd
Orange PCS
Pfizer Global Research &
Development
PGS Exploration (UK) Ltd
Pilkington Plc
Pinsent Curtis Biddle
Police Service HPDScheme
PricewaterhouseCoopers
Procter & Gamble
PSA PeugeotCitroën
QAS Ltd
QinetiQ
Railtrack
Research International
Richards Butler
Rolls-Royce plc
Royal Bank of Scotland
RSM Robson Rhodes
Safeway Stores plc
Saffery Champness
Sainsburys Supermarkets Ltd
Samworth Brothers Ltd
Sanofi-Synthelabo
SCA Packaging Ltd
Schlumberger
Scottish Police Service
ScottishPower
Shell
Shepherd Building Group Ltd
Siemens
SJ Berwin
Slaughter and May
Société Génerale
Somerfield
Standard Chartered Bank
Standard Life Assurance Company
Stephenson Harwood
Sun Microsystems UK Ltd
Syntegra
Tarmac
Tate & Lyle Europe
Taylor Nelson Sofres
Taylor Wessing
Tesco Stores Ltd
Thales
Thames Water
The Arcadia Group
The BOC Group
The Boots Company plc
The Football Association
The Hymatic Engineering Co Ltd
The Patent Office
Theodore Goddard
Towers Perrin
Transco
UCB Films plc
Unilever
Vauxhall Motors Ltd
Vodafone
Wates Group Limited
Watson Wyatt
WHSmith plc
Wincanton
Woolworths plc
WorldCom
Yell Ltd
Yorkshire Water
Zurich
Page 8
The AGRGraduate Recruitment Survey 2003 Winter Review
IntroductionThe first major part of The AGR Graduate Recruitment Survey 2003 examines the graduate vacancies
that employers are recruiting for during the current recruitment year, compared with the previous year.
Employers were asked to give the actual numbers of graduates who were recruited into their
organisations during the 2001-2002 recruitment season (typically to start work in the autumn of 2002),
along with their predicted numbers of graduates to be recruited during the current 2002-2003
recruitment year.
The survey asked employers to provide not only their total vacancy levels but also a basic analysis of
where these vacancies occurred in their organisations. This is a new innovation for the AGR and means
that for the first time graduate vacancies can be analysed by geographical region and the business
function or career area that the vacancies occur within.
This new information will be particularly useful for employers who recruit many of their graduates for
selected regions of the UK or beyond and want to measure how this regional job market is faring.
Equally, many major employers recruit graduates for a wide range of business functions, irrespective of
their organisation’s main purpose. For example, retailers often hire graduates for head office functions
such as financial management, marketing or IT in addition to their retail management positions.
Similarly, manufacturing or other industrial employers often take graduates in a range of commercial
functions alongside their engineering or technical graduate recruitment.
Throughout this section of the survey, the results refer to actual vacancies in 2002 (ie graduates
recruited during the 2001-2002 recruitment season who started work in autumn 2002), versus likely
vacancies in 2003 (ie graduates recruited during the 2002-2003 round, to start work in autumn 2003).
The AGRGraduate Recruitment Survey 2003 Winter Review
Chapter 2
Graduate Vacancies
Key FindingsFollowing a dip in graduate vacancies during the 2001-2002 recruitment season, AGR employers
predict an increase in vacancies for graduates starting work in 2003:
• Graduate vacancies are expected to increase by 7.9% in 2003, compared to the numbers
actually recruited in 2002.
• The highest volume of vacancies in 2003 are likely to be in accountancy or professional services
firms, engineering or industrial companies, investment banks, law firms or retailers.
• Almost half of all vacancies for 2003 are expected to be in London or the south east of England.
• Measured by business functions or career areas within organisations, the most vacancies in
2003 are for graduates working in chartered accountancy, general management, IT,
engineering, or investment banking. Together these areas account for nearly 60% of all
graduate vacancies.
• The smallest numbers of vacancies in 2003 are for graduate positions in logistics.
Page 9
The AGRGraduate Recruitment Survey 2003 Winter Review
Page 10
Comparing Graduate Vacancies in 2002 & 2003The main finding of this year’s survey is that employers are anticipating recruiting more new graduates
in 2003 than they did in 2002. The total number of expected vacancies for 2003 at the 222 AGR
employers who took part in the survey is 13,941,a rise of 7.9% on the 12,925 graduates who were actually
recruited in 2002.
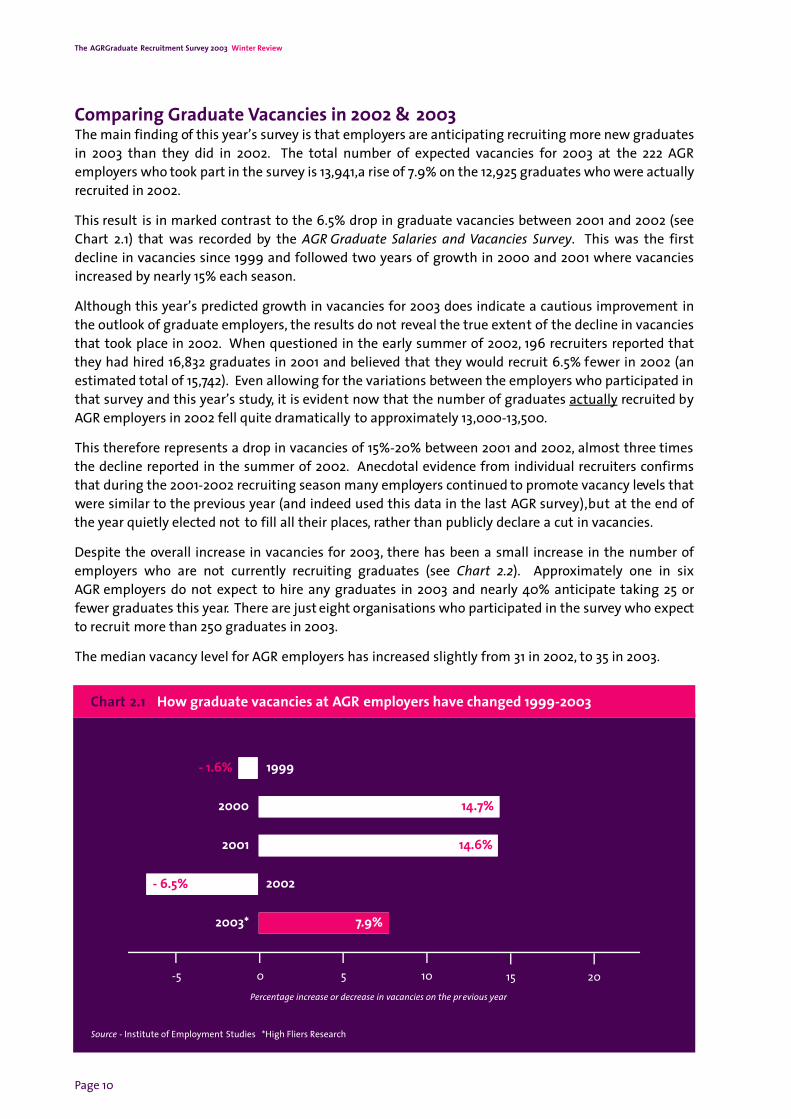
This result is in marked contrast to the 6.5% drop in graduate vacancies between 2001 and 2002 (see
Chart 2.1) that was recorded by the AGR Graduate Salaries and Vacancies Survey. This was the first
decline in vacancies since 1999 and followed two years of growth in 2000 and 2001 where vacancies
increased by nearly 15% each season.
Although this year’s predicted growth in vacancies for 2003 does indicate a cautious improvement in
the outlook of graduate employers, the results do not reveal the true extent of the decline in vacancies
that took place in 2002. When questioned in the early summer of 2002, 196 recruiters reported that
they had hired 16,832 graduates in 2001 and believed that they would recruit 6.5% fewer in 2002 (an
estimated total of 15,742). Even allowing for the variations between the employers who participated in
that survey and this year’s study, it is evident now that the number of graduates actually recruited by
AGR employers in 2002 fell quite dramatically to approximately 13,000-13,500.
This therefore represents a drop in vacancies of 15%-20% between 2001 and 2002, almost three times
the decline reported in the summer of 2002. Anecdotal evidence from individual recruiters confirms
that during the 2001-2002 recruiting season many employers continued to promote vacancy levels that
were similar to the previous year (and indeed used this data in the last AGR survey),but at the end of
the year quietly elected not to fill all their places, rather than publicly declare a cut in vacancies.
Despite the overall increase in vacancies for 2003, there has been a small increase in the number of
employers who are not currently recruiting graduates (see Chart 2.2). Approximately one in six
AGR employers do not expect to hire any graduates in 2003 and nearly 40% anticipate taking 25 or
fewer graduates this year. There are just eight organisations who participated in the survey who expect
to recruit more than 250 graduates in 2003.
The median vacancy level for AGR employers has increased slightly from 31 in 2002, to 35 in 2003.
Percentage increase or decrease in vacancies on the pr evious year
1050-5
2003* 7.9%
Source - Institute of Employment Studies *High Fliers Research
Chart 2.1 How graduate vacancies at AGR employers have changed 1999-2003
2000 14.7%
2001 14.6%
2002- 6.5%
2015
1999- 1.6%

Page 11
The AGRGraduate Recruitment Survey 2003 Winter Review
Percentage of AGR employers
50403020100
26-50 vacancies 16%
Source - High Fliers Research
Chart 2.3 Graduate vacancies at AGR employers in 2003
101-250 vacancies 14%
More than 500 vacancies 2%
76-100 vacancies 8%
51-75 vacancies 5%
1-25 vacancies 39%
No vacancies 14%
251-500 vacancies 2%
Percentage of AGR employers
50403020100
26-50 vacancies 16%
Source - High Fliers Research
Chart 2.2 Graduate vacancies at AGR employers in 2002
101-250 vacancies 14%
More than 500 vacancies 2%
76-100 vacancies 8%
51-75 vacancies 6%
1-25 vacancies 41%
No vacancies 12%
251-500 vacancies 2%
Median - 31 vacancies
Median - 35 vacancies

The AGRGraduate Recruitment Survey 2003 Winter Review
Page 12
Profiling Graduate Vacancies in 2002Graduate vacancies within AGR employers can be measured in three different ways – by the employer’s
industry or business sector, the geographical location of the vacancies, or the business function or
career area of the vacancies.
In 2002, nearly one in five vacancies amongst AGR employers were at accountancy or professional
services firms in 2002 (see Table 2.4).Other organisations who were major recruiters include investment
banks or fund managers, engineering or industrial companies, law firms and the public sector. The
smallest volume of vacancies for graduates was in media companies, insurance companies, and
chemical or pharmaceutical companies.
More graduate jobs were to be found in London or the south east than any other part of the UK or
beyond in 2002 (see Table 2.5). Almost half of all new graduate positions were in or near the capital,
with smaller numbers recruited for the Midlands, the north west, and the south west of England. The
combined graduate intake in Scotland, Wales and Northern Ireland amounted to less than 8% of the
total vacancies. Internationally, AGR members recruited nearly 10% of their graduates for positions in
Europe, the USA,Asia or elsewhere.
In terms of the business functions or careers areas that graduates were recruited into, chartered
accountancy was the largest, followed by IT, investment banking, general management, and solicitors
& barristers. Engineering was also a major recruiting area and the combined vacancies in mechanical
engineering, electrical/electronic and other engineering accounted for more than one in ten graduate
positions. Interestingly, two of the smaller areas in 2002 were marketing and human resources, both of
which remain firm favourites with students & graduates, despite the scarcity of jobs.
Table 2.4 Vacancies at AGR employers by type of organisation in 2002
Accountancy or professional services firm
Investment bank or fund manager
Engineering or industrial company
Law firm
Public sector
Retail
Commercial or retail bank
Transport or logistics company
Oil company
Consulting or business services firm
IT hardware or software company
Construction company
Energy, water or utility company
FMCG company or food manufacturer
Telecommunications
Motor manufacturer
Chemical or pharmaceutical company
Insurance company
Media company
Other
% of total vacancies
19.9
11.6
11.1
8.7
7.5
6.7
6.3
4.5
3.8
2.7
2.5
2.4
2.4
2.0
1.9
1.8
1.7
1.2
1.0
0.4
Table 2.5 Vacancies at AGR employers by location of vacancies in 2002
London
South East
The Midlands
North West
South West
Scotland
Yorkshire
EastAnglia
North East
Wales
Northern Ireland
Ireland
USA
Europe
Asia
Rest of the World
Unknown
% of total vacancies
37.0
10.4
7.0
6.3
5.5
5.2
3.8
2.5
2.3
1.6
0.7
0.4
3.2
3.0
1.1
2.5
7.5

Page 13
The AGRGraduate Recruitment Survey 2003 Winter Review
Percentage of total vacancies
3020100
Source - High Fliers Research
Chart 2.6 Graduate Vacancies at AGR employers by business function or career area in 2002
IT 10.7%
Accountancy 18.2%
Investment banking 10.6%
General management 9.5%
Retail management 4.3%
Solicitor or barrister 9.0%
Mechanical engineering 3.5%
Electrical/electronic engineering 3.5%
Consulting 2.1%
Science, research & development 2.9%
Marketing 2.1%
Financial management 2.1%
Sales 1.7%
Other engineering 2.1%
Human resources 1.5%
Civil engineering 1.5%
Purchasing 1.1%
Actuarial work 1.4%
Logistics 0.5%
40
Unknown functions 1.7%

The AGRGraduate Recruitment Survey 2003 Winter Review
Page 14
Changes in Graduate Vacancies in 2003The overall increase in vacancies between 2002 and 2003 in the graduate market masks some very
significant differences in the vacancies being offered by AGR employers in individual business areas or
industries (see Table 2.7) . The bigge s t g rowth in gra d u ate re c r u i t m e nt for 2003 is in t e l e -
co m m u n i c at i o n s, IT h a rd wa re & s oft wa re co m p a n i e s, consulting firms, and co m m e rcial or re t a i l
banking where vacancies are up by at least a third. For the first three of these areas, it is evident that
much of the increase is due to depressed recruiting levels in previous years, whilst the commercial or
retail banking sector continues to increase its graduate workforce. Other growth industries include
retailers, construction companies, transport or logistics companies, and fast-moving consumer goods
companies.
The large s t d rops in vacancies are in media co m p a n i e s, m o tor manufa ct u re r s, chemical or
pharmaceutical companies, and investment banks or fund managers. This last sector is particularly
concerning given the cuts already made by many of the leading institutions in 2001 and 2002.
Regionally, AGR members are reporting at least 10% more vacancies in the Midlands, East Anglia, the
south west and the north east of England for 2003 (see Table 2.8).. Graduate vacancies are also up in
Wales, Scotland and Northern Ireland. Recruitment in London and the north west of England remains
static,whilst overseas recruitment appears to have been cut back considerably.
By job function, there are up to 50% more graduate vacancies for 2003 in logistics, consulting, general
management, retail management and purchasing (see Chart 2.9). Several of these areas only
accounted for small numbers of graduates in 2002,so the increases do not necessarily equate to many
more vacancies this year, however the substantial growth in general management jobs means that it is
now the second biggest recruitment area for graduates in 2003.
Table 2.7 How vacancies have changedin 2003, by type of organisation
Te l e co m m u n i c at i o n s
IT co m p a ny
Consulting or business serv i ces firm
Co m m e rcial or retail bank
Re t a i l
Co n s t r u ction co m p a ny
Tra n s p o rt or logistics co m p a ny
I n s u ra n ce co m p a ny
FMCG co m p a ny or food manufa ct u re r
E n e rgy, water or utility co m p a ny
Engineering or industrial co m p a ny
L aw firm
Oil co m p a ny
A cco u ntancy firm
Public secto r
I nve s t m e nt b a n k , fund manage r
C h e m i c a l /p h a r m a ceutical co m p a ny
M o tor manufa ct u re r
Media company
% change in vacancies
UP 61.3%
UP 59.1%
UP 36.4%
UP 36.1%
UP 28.6%
UP 26.4%
UP 17.3%
UP 11.3%
UP 10.3%
UP 7.4%
UP 4.3%
UP 0.2%
DOWN 0.2%
DOWN 1.4%
DOWN 6.3%
DOWN 11.7%
DOWN 13.2%
DOWN 19.5%
DOWN 42.6%
Table 2.8 How vacancies have changedin 2003, by location of vacancies
The Midlands
EastAnglia
Wales
South West
North East
Yorkshire
South East
Scotland
Northern Ireland
London
North West
Ireland
Rest of the World
Europe
USA
Asia
% change in vacancies
UP 18.0%
UP 17.1%
UP 16.5%
UP 12.2%
UP 11.9%
UP 9.7%
UP 6.0%
UP 6.0%
UP 5.4%
UP 1.0%
DOWN 2.0%
DOWN 7.7%
DOWN 3.4%
DOWN 7.3%
DOWN 21.4%
DOWN 30.3%

Page 15
The AGRGraduate Recruitment Survey 2003 Winter Review
Percentage change in graduate vacancies between 2002 and 2003
3020100
Source - High Fliers Research
Chart 2.9 How graduate vacancies have changed in 2003, by business function or career area
ITDOWN 0.6%
Accountancy UP 5.9%
Investment bankingDOWN 13.3%
General management UP 43.3%
Retail management UP 32.3%
Solicitor or barrister NO CHANGE 0%
Mechanical engineeringDOWN 6.5%
Electrical/electronic engineering
UP 2.9%
Consulting UP 46.2%
Science, research & development
UP 6.4%
MarketingDOWN 7.9%
Financial management UP 13.1%
Sales NO CHANGE 0%
Other engineering NO CHANGE 0%
Human resources UP 16.1%
Civil engineering UP 14.6%
Purchasing UP 20.7%
Actuarial workDOWN 6.0%
Logistics UP 49.3%
40-10 50

The AGRGraduate Recruitment Survey 2003 Winter Review
Page 16
Average - £9,100

The AGRGraduate Recruitment Survey 2003 Winter Review
Chapter 3
Graduate Salaries
Key FindingsDespite the uncertainty of the graduate market in 2002, AGR employers are expecting to pay
increased starting salaries for new graduates starting work in 2003:
• Graduate starting salaries are expected to increase by 2.5% in 2003, compared to the salary
rates actually paid in 2002. The predicted median graduate starting salary for 2003 is £20,000.
• The highest starting salaries in 2003 are being offered by investment banks, consulting or
business service firms, law firms, oil companies, and fast-moving consumer goods companies.
• Regionally, median salaries are expected to be highest in London, the south east,and south
west of England,with the lowest rates paid in Scotland,the Midlands and Yorkshire.
• Measured by business functions or career areas within organisations, the highest starting
salaries in 2003 are for graduate positions in investment banking, consulting, solicitors or
barristers, actuarial work,and IT. The lowest salaries are for positions in human resources.
• A third of employers continue to offer new graduates an initial bonus or cash payment.
IntroductionThe second section of The AGR Graduate Recruitment Survey 2003 investigates the salaries that
employers are planning to pay new graduates starting work later this year, compared with the rates for
2002. Employers were asked to give their actual starting salaries paid to graduates recruited into their
organisations during the 2001-2002 recruitment season (typically to start work in the autumn of 2002),
along with their predicted starting salaries for graduates to be recruited during the current 2002-2003
recruitment year.
The survey asked employers to provide not only their national graduate starting salary, but also details
of any variation of this rate paid to graduates in different parts of their organisations. This is the first
time that this information has been sought from AGR members and means that salary data can now be
analysed by geographical region and the business function or career area that the graduates are
employed within, as well as employer’s industry or business sector.
As particularly high or low salaries can distort the average salary levels, the survey uses the ‘median’
value to compare salary levels. Throughout this section the median value is calculated by taking the
‘mid-point’ salary for all the actual vacancies under consideration, rather than the mid-point of the
organisations’ salaries. For example, to determine the median salary for five different employers who
are offering 25 vacancies between them, the median salary is calculated to be the 13th highest salary
(the mid-point) of the 25 individual vacancies, not the 3rd highest salary from the five employers.
All the results shown in this section refer to actual starting salaries paid in 2002 (ie graduates recruited
during the 2001-2002 recruitment season who started work in autumn 2002), versus likely salaries on
offer in 2003 (ie graduates recruited during the 2002-2003 round, to start work in autumn 2003).
Page 17

The AGRGraduate Recruitment Survey 2003 Winter Review
Comparing Graduate Salaries in 2002 & 2003The survey shows that graduate starting salaries are continuing to rise. Employers are anticipating
offering a median salary of £20,000 to new graduates in 2003, £500 higher than the £19,500 median
salary paid in 2002. This represents an increase of 2.5% year-on-year and is similar to the annual rises
recorded by the AGR Graduate Salaries and Vacancies Survey in 2001 & 2002 (see Chart 3.1).
These increases are a far cry from the double digit salary inflation that was seen in the graduate market
in the second half of the 1990’s, but show that starting salaries are still rising by at least the cost of
living. The results are also a timely reminder, given recent announcements about the introduction of
higher tuition fees for university students, that the salaries paid to graduates continue to outstrip
almost all other routes into employment. By the time graduates start work after completing their
degrees, the starting salary they are paid for their first job is generally already higher than the average
national income (currently £17,000 per annum).
The profile of the starting salaries paid by AGR employers in 2002 reveals that there was a very wide
variation in the salaries available from different organisations (see Chart 3.2). At the lower end, a
handful of employers offered new graduates £15,000 or less for their first position. Almost half of all
recruiters paid a starting salary between £17,500 and £20,000, but over 40% offered more than £20,000.
At the very top of the market, 4% of recruiters were able to pay their new intake initial salaries of
£30,000 or more. The highest recorded starting salary was £40,000 for graduates at one of the leading
international investment banks. Whilst it is important to remember that this salary was only offered
for 120 vacancies out of nearly 13,000 graduate positions available in 2002, these results are a useful
reminder of the dilemma that new graduates face as they leave university. With the highest salaries in
the market amounting to more than twice the lowest offerings, the choices that graduates make for
their first employment can have a profound effect on their potential future earnings.
In 2003, the profile of starting salaries paid by AGR members follows a similar pattern (see Chart 3.3).
Fewer employers are offering the lowest salaries, but there has been a noticeable increase in employers
offering between £20,000 and £25,000 to new graduates. With the median salary now at £20,000, this
level may well become an important benchmark for the graduate market - it is an easily quoted and
remembered figure for recruiters and graduates alike.
Percentage increase or decrease in median starting salary on the previous year’s level
420-5
Source - Institute of Employment Studies *High Fliers Research
Chart 3.1 How median graduate starting salaries at AGR employers have changed 1999-2003
2000 5.7%
86
1999 4.8%
2002 2.6%
2001 2.7%
2003* 2.5%
Page 18

The AGRGraduate Recruitment Survey 2003 Winter Review
Percentage of AGR employers
50403020100
£17,501-£20,000 43%
Source - High Fliers Research
Chart 3.2 Graduate starting salaries at AGR employers in 2002
£25,001-£30,000 14%
More than £35,000 1%
£22,501-£25,000 6%
£20,001-£22,500 20%
£15,001-£17,500 12%
£15,000 or less 2%
£30,001-£35,000 3%Median - £19,500
Percentage of AGR employers
50403020100
£17,501-£20,000 37%
Source - High Fliers Research
Chart 3.3 Graduate starting salaries at AGR employers in 2003
£25,001-£30,000 15%
More than £35,000 1%
£22,501-£25,000 11%
£20,001-£22,500 23%
£15,001-£17,500 10%
£15,000 or less 1%
£30,001-£35,000 2%Median - £20,000
Page 19

The AGRGraduate Recruitment Survey 2003 Winter Review
Page 20
Profiling Graduate Salaries in 2002The starting salaries paid to graduates by AGR employers can be measured in three different ways – by
the employer’s industry or business sector, the geographical location of the vacancies, or the business
function or career area of the vacancies.
In 2002, the highest-paying AGR employers were investment banks or fund managers, consulting or
business services firms, law firms, and oil companies (see Table 3.4). The median starting salaries for
these kinds of employers are between approximately £25,000 and £35,000. Other organisations paying
a b ove - ave ra ge starting salaries we re the fa s t- m oving consumer goods co m p a n i e s, chemical or
pharmaceutical companies, telecommunications companies, and motor manufacturers . The lowest
s t a rting salaries we re re co rded for new gra d u ates in t ra n s p o rt or logistics co m p a n i e s, m e d i a
companies, and construction companies.
Across the UK, there were considerable regional variations in salary levels paid in 2002 (see Table 3.5).
Graduates starting work in London were offered the highest rate, a median of £23,000, although it
should be noted that this does include any London weighting or allowances that employers provided.
Positions in the Midlands and Scotland began on the lowest median salaries of £17,000. The salary for
Northern Ireland appears to be very high, but it should be noted that this is based on a small number
of vacancies. Graduate salaries overseas ranged from £13,000 for Ireland to £35,000 for the USA, but
there were too few vacancies in Asia or elsewhere in the world to calculate meaningful median rates.
Within individual business functions and career areas (see Chart 3.6), the highest starting salaries in
2002 were for vacancies in investment banking, consulting, solicitors or barristers, and actuarial work
where the median rates were between 20% and 75% higher than the median national starting salary .
The lowest salaries reported were in human resources, purchasing, and civil engineering.
Table 3.4 Median starting salaries bytype of organisation in 2002
Investment bank or fund manager
Consulting or business services firm
Law firm
Oil company
FMCG company or food manufacturer
Chemical or pharmaceutical company
Telecommunications company
Motor manufacturer
Energy, water or utility company
Insurance company
IT company
Commercial or retail bank
A cco u ntancy or professional serv i ces firm
Public sector
Retailer
Engineering or industrial company
Construction company
Media company
Transport or logistics company
Median GraduateStarting Salaries
£35,000
£28,500
£28,000
£24,800
£22,100
£22,000
£21,000
£21,000
£20,300
£20,000
£19,500
£19,500
£19,300
£18,700
£18,400
£18,250
£18,000
£17,500
£16,000
Table 3.5 Median starting salaries byby location of vacancies in 2002
London
Northern Ireland
South East
South West
North West
Wales
North East
East Anglia
Yorkshire
Scotland
The Midlands
Ireland
Europe
USA
Asia
Elsewhere in the world
Median GraduateStarting Salaries
£23,000
£20,000
£19,500
£18,700
£18,000
£18,000
£17,800
£17,800
£17,500
£17,000
£17,000
£13,300
£24,500
£35,000
-
-

Page 21
The AGRGraduate Recruitment Survey 2003 Winter Review
Median starting salaries
£30,000£25,000£20,000£15,000
Source - High Fliers Research
Chart 3.6 Median graduate starting salaries by business function or career area in 2002
Consulting £28,500
Investment banking £35,000
Solicitor or barrister £28,000
Actuarial work £24,000
Accountancy £21,500
IT £21,500
Other engineering £20,500
Sales £20,500
Financial management £20,400
General management £20,400
Electrical/electronic engineering £20,000
Marketing £20,000
Mechanical engineering £19,500
Science, research & development £19,500
Retail management £19,000
Logistics £19,000
Purchasing £18,400
Civil engineering £18,500
Human resources £18,300
£35,000

The AGRGraduate Recruitment Survey 2003 Winter Review
Table 3.7 How salaries have changed in2003, by type of organisation
Tra n s p o rt or logistics co m p a ny
Co n s t r u ction co m p a ny
M o tor manufa ct u re r
FMCG co m p a ny or food manufa ct u re r
Engineering or industrial co m p a ny
Re t a i l
Media co m p a ny
Public secto r
Co m m e rcial or retail bank
IT co m p a ny
I n s u ra n ce co m p a ny
Te l e co m m u n i c at i o n s
Chemical or pharmaceutical co m p a ny
A cco u ntancy or professional serv i ces firm
E n e rgy, water or utility co m p a ny
Oil co m p a ny
L aw firm
Consulting or business serv i ces firm
I nve s t m e nt b a n k , fund manage r
Media company
% change in medianstarting salaries
UP 6.3%
UP 5.6%
UP 4.8%
UP 3.6%
UP 3.6%
UP 3.3%
UP 2.9%
UP 2.7%
UP 2.6%
UP 2.6%
UP 2.5%
UP 2.4%
UP 2.3%
NO CHANGE
NO CHANGE
NO CHANGE
NO CHANGE
NO CHANGE
NO CHANGE
NO CHANGE
Table 3.8 How salaries have changed in2003, by location of vacancies
The Midlands
East Anglia
South East
Wales
Ireland
North West
Northern Ireland
North East
Yorkshire
Scotland
South West
London
Europe
USA
Asia
Rest of the World
% change in medianstarting salaries
UP 8.2%
UP 6.7%
UP 6.7%
UP 6.1%
UP 5.3%
UP 5.0%
UP 5.0%
UP 3.9%
UP 2.9%
UP 2.4%
UP 2.1%
NO CHANGE
NO CHANGE
NO CHANGE
-
-
Changes in Graduate Salaries in 2003The modest increase in median graduate starting salaries between 2002 and 2003 is mirrored by
similarly small changes in salary levels in different industries and business sectors. Salaries in thirteen
industries and sectors are expecting to rise year-on-year with the biggest increases of around 6%
predicted in transport or logistics companies and construction companies (see Table 3.7). Both these
industries were amongst the lowestpayers in 2002,so these increase will help bring their salaries closer
to the £20,000 graduate median salary.
Seven business sectors or industries anticipate no change in their salary levels, including some of the
areas with the most vacancies such as accountancy or professional services firms, law firms, and
investment banks or fund managers. It is worth remembering that these sectors already paid well
above-average salary rates for new graduates in 2002, so their remuneration is likely to remain
competitive for 2003.
Measured by location, salaries for new graduates are set to rise in all parts of the UK in 2003 except
London (see Table 3.8). The strongest salary growth is likely to be in the Midlands, EastAnglia,the south
east of England,and Wales where levels are expected to rise by at least 6%. The 8% increase in salaries
in the Midlands is particularly welcome as this part of the UK had one of the lowest median starting
salaries in 2002.
For graduates starting work in 2003 in different job functions, there are some minor changes in salary
levels predicted (see Chart 3.9). Employers recruiting for vacancies in logistics, human resources and
purchasing are planning to pay up to 5% more than in 2002, but for most other areas the anticipated
growth is just 1 or 2%. There is no expected change in median starting salaries for eight of the functions
profiled,including the area with the largest number of graduate vacancies, chartered accountancy.
Page 22

Page 23
The AGRGraduate Recruitment Survey 2003 Winter Review
Percentage change in median graduate starting salaries between 2002 and 2003
6420
Source - High Fliers Research
Chart 3.9 How median salaries have changed in 2003, by business function or career area
Civil engineering UP 1.6%
Purchasing UP 3.3%
Financial management UP 2.9%
Sales NO CHANGE
Other engineering UP 1.5%
Human resources UP 3.8%
Marketing UP 2.5%
Science, research & development
UP 2.6%
Electrical/electronic engineering
NO CHANGE
Accountancy NO CHANGE
Retail management UP 2.6%
Mechanical engineering UP 2.6%
General management UP 2.9%
Logistics UP 5.3%
8-2 10
Actuarial work NO CHANGE
IT NO CHANGE
Solicitor or barrister NO CHANGE
Consulting NO CHANGE
Investment banking NO CHANGE
The AGRGraduate Recruitment Survey 2003 Winter Review
Page 24
Percentage of AGR employers
100806040200
£501-£1,000 9%
Source - High Fliers Research
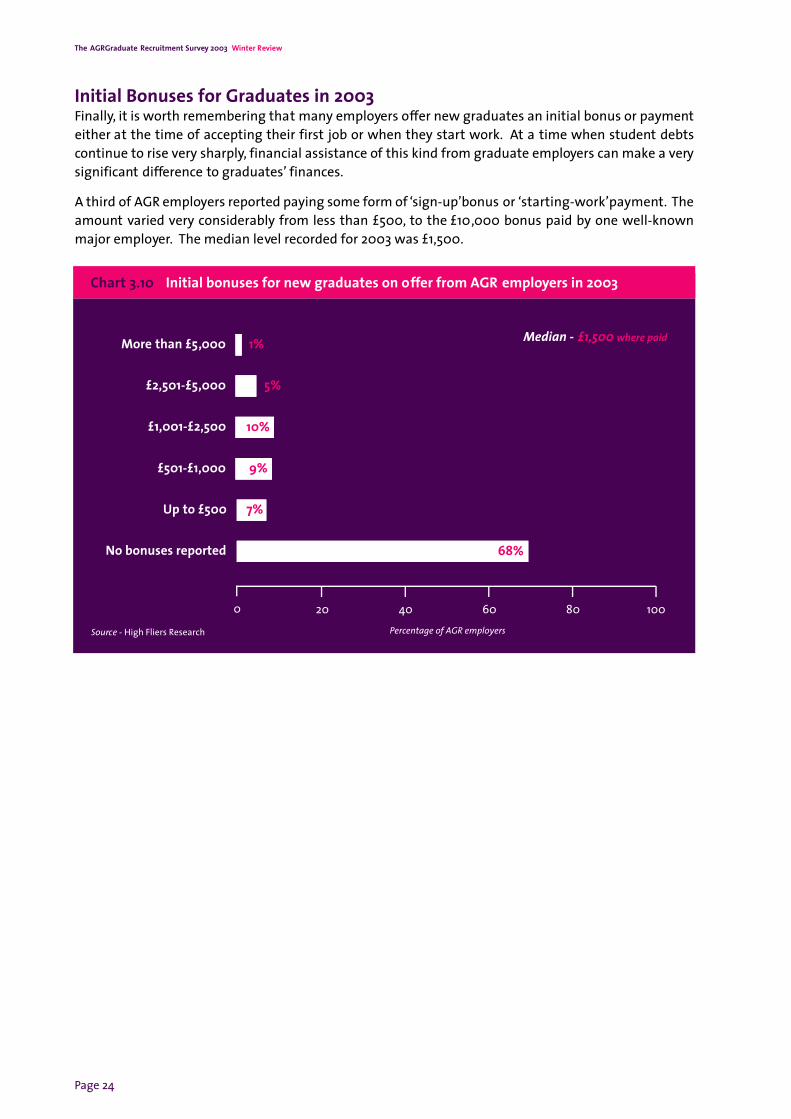
Chart 3.10 Initial bonuses for new graduates on offer from AGR employers in 2003
More than £5,000 1%
£2,501-£5,000 5%
£1,001-£2,500 10%
Up to £500 7%
No bonuses reported 68%
Median - £1,500 where paid
Initial Bonuses for Graduates in 2003Finally, it is worth remembering that many employers offer new graduates an initial bonus or payment
either at the time of accepting their first job or when they start work. At a time when student debts
continue to rise very sharply, financial assistance of this kind from graduate employers can make a very
significant difference to graduates’ finances.
A third of AGR employers reported paying some form of ‘sign-up’bonus or ‘starting-work’payment. The
amount varied very considerably from less than £500, to the £10,000 bonus paid by one well-known
major employer. The median level recorded for 2003 was £1,500.

Page 25
The AGRGraduate Recruitment Survey 2003 Winter Review
Chapter 4
Graduate Recruitment Marketing
Key FindingsAGR employers’spending on graduate recruitment marketing activities have been profiled for the
first time:
• The median amount spent by AGR employers on their individual graduate recruitment
brochure in 2003 was £16,000, with a further £12,000 for their graduate recruitment website.
• Spending on graduate recruitment advertising in careers publications and other paper-based
titles was a median of £20,000 in 2003. A median of £8,600 spent on online promotions.
• Employers who attended graduate careers fairs and on-campus presentations spent medians
of £8,000 and £5,000 respectively.
• The total amount spent on graduate recruitment marketing by AGR employers in 2003 was a
median of £53,500, up 3% on spending in 2002.
• The median ‘marketing spend per graduate vacancy’ was £1,500 in 2003 although the survey
reported spending of nearly double this for public sector recruiters and FMCG companies.
IntroductionThe final part of The AGR Graduate Recruitment Survey 2003 examines the way AGR employers spend
their marketing budgets in an effort to attract applications for their graduate vacancies. This is a new
innovation for the AGR and is the first time that the organisation has attempted to profile the graduate
recruitment activities of its full membership.
The survey asked employers about their spending on six key graduate recruitment promotions during
the current 2002-3 recruitment season (referred to as ‘2003’), compared with spending in the previous
year 2001-2 (described as ‘2002’throughout). The six areas were employers’ own graduate recruitment
brochures, their own graduate recruitment websites, graduate recruitment advertising, online graduate
recruitment promotions, attending graduate careers fairs, and on-campus presentations.
AGR employers’ responses to these questions were somewhat mixed and a number of recruiters were
either unable to provide data about their marketing activities or were not prepared to divulge
information about their organisations. This means that the survey cannot accurately determine how
many employers used each of the promotions under consideration. The results do, however, provide a
full account of the marketing spend that AGR employers declared for each activity, a notional ‘total
spend’ for recruiters in 2003 and 2002, and an estimate of the median ‘cost per graduate vacancy’ for
graduate recruitment marketing.
The survey uses the ‘median’ value to compare different spending levels and throughout this section
the median value is calculated by taking the ‘mid-point’ spending for the employers being considered.
For example, to determine the median spending for twenty-five different employers who used a
particular promotion,the median spending is calculated to be the 13th highest spend (the mid-point) of
the 25 individual budgets.

The AGRGraduate Recruitment Survey 2003 Winter Review
Page 26
Spending on Brochures & WebsitesThe results show that having a graduate recruitment brochure is still one of the most significant
expenses for employers (see Chart 4.1). Although spending varied enormously in 2003, the median cost
of producing an individual brochure was £16,000, a fifth lower than 2002. One third of recruiters
managed to produce their brochures on a budget of £10,000 or less. A further third of employers spent
at least £25,000 on their literature and the six highest-spending employers – two public sector
recruiters, two law firm, one of the larger professional services firms, and an industrial company –
devoted £100,000 or more of their budgets to their annual brochure.
Spending on individual recruitment websites also varied considerably between AGR employers in 2003
(see Chart 4.2). The median cost was £12,000 for the year and again this level was a fifth lower than like-
for-like spending in 2002. More than one in five employers spent £5,000 or less on their recruitment
website whilst a third of recruiters reported spending more than £25,000 this year on their websites.
Overall,more employers provided data for their graduate recruitment website spending than did so for
a graduate recruitment brochure,suggesting that fewer employers were using brochures in 2003.
Spending on Advertising & Online PromotionsThe survey recorded a very wide range of costs for graduate recruitment advertising from less than
£1,000 for several smaller recruiters, to more than £100,000 for nine AGR employers (see Chart 4.3). The
advertising was spread between careers directories (such as Prospects Directory, The Times Top 100
Graduate Employers, the Hobsons Directory 2003 etc),career sec tor guides (such as the GTI Target series),
careers periodicals (such as Real World magazine), trade journals, national newspapers and local
publications (such as student newspapers, careers service guides etc).
The median spending in 2003 was £20,000 which is unchanged from 2002, but it is evident that the
proportion of recruiters’ advertising budgets allocated to different kinds of publication did change. In
particular, advertising in careers directories and sector publications increased, whilst spending in
national newspapers declined.
AGR employers generally spent rather less on their on-line promotions than their advertising in
publications but it is clear that this remains a growing area of expenditure (see Chart 4.4). The median
spend on promotions on commercial websites (such as Monster, Prospects, DoctorJob etc), university
websites, and email services (such as Milkround Online, TargetedGrad etc) was £8,600 – approximately
a quarter higher than the amounts spent in 2002. At the top end of recruiter spending, over 10% of AGR
employers who used online promotions have spent at least £25,000 during 2002.
Spending on Careers Fairs & On-Campus PresentationsWhilst only around half of AGR employers who participated in the survey reported spending their
budgets on graduate careers fairs and fewer still provided data about on-campus presentations, those
who did participate in university recruitment events used a significant proportion of their marketing
budgets on making these activities a success (see Charts 4.5&4.6). The median spend for careers fairs
in 2003 was £8,000 (unchanged on 2002 levels) and presentations was £5,000 (up 11% on 2002 levels).
The cost of individual events and the associated spending varied very considerably for different
employers and different kinds of events. Spending at individual university careers fairs generally
accounted for a few hundred pounds per event, although regional or national fairs could account for
several thousand pounds worth of budget.
Similarly for on-campus presentations, some employers reported spending no more than £250 per
university event, whilst others declared spending up to £5,000 or more on single presentations.

Page 27
The AGRGraduate Recruitment Survey 2003 Winter Review
Percentage of AGR employers who produced a recruitment brochure in 2003
50403020100
£10,001-£25,000 28%
Source - High Fliers Research
Chart 4.1 AGR employers’ spending on their graduate recruitment brochures in 2003
£75,001-£100,000 4%
More than £150,000 2%
£50,001-£75,000 5%
£25,001-£50,000 24%
£5,001-£10,000 17%
Up to £5,000 18%
£100,001-£150,000 2%
Median Spend - £16,000
DOWN 20% from 2002
Percentage of AGR employers who produced a recruitment website in 2003
50403020100
£10,001-£25,000 23%
Source - High Fliers Research
Chart 4.2 AGR employers’spending on their graduate recruitment websites in 2003
£75,001-£100,000 4%
More than £150,000 2%
£50,001-£75,000 3%
£25,001-£50,000 17%
£5,001-£10,000 27%
Up to £5,000 21%
£100,001-£150,000 3%
Median Spend - £12,000
DOWN 20% from 2002

The AGRGraduate Recruitment Survey 2003 Winter Review
Page 28
Percentage of AGR employers who used graduate recruitment advertising in 2003
50403020100
£5,001-£10,000 14%
Source - High Fliers Research
Chart 4.3 AGR employers’spending on graduate recruitment advertising in 2003
£50,001-£100,000 10%
More than £100,000 4%
£25,001-£50,000 17%
£10,001-£25,000 47%
£2,501-£5,000 3%
Up to £2,500 4%
Median Spend - £20,000
NO CHANGE from 2002
Percentage of AGR employers who used graduate recruitment advertising in 2003
50403020100
£5,001-£10,000 22%
Source - High Fliers Research
Chart 4.4 AGR employers’spending on graduate recruitment promotions online in 2003
£50,001-£100,000 3%
More than £100,000 1%
£25,001-£50,000 9%
£10,001-£25,000 29%
£2,501-£5,000 19%
Up to £2,500 17%
Median Spend - £8,600
UP 26% from 2002

Page 29
The AGRGraduate Recruitment Survey 2003 Winter Review
Percentage of AGR employers who attended graduate careers fairs in 2003
50403020100
£5,001-£10,000 27%
Source - High Fliers Research
Chart 4.5 AGR employers’spending on attending graduate careers fairs in 2003
£50,001-£100,000 3%
More than £100,000 1%
£25,001-£50,000 5%
£10,001-£25,000 30%
£2,501-£5,000 21%
Up to £2,500 12%
Median Spend - £8,000
NO CHANGE from 2002
Percentage of AGR employers who held their own campus presentations in 2003
50403020100
£5,001-£10,000 11%
Source - High Fliers Research
Chart 4.6 AGR employers’spending on holding their own campus presentations in 2003
£50,001-£100,000 2%
More than £100,000 6%
£25,001-£50,000 7%
£10,001-£25,000 21%
£2,501-£5,000 14%
Up to £2,500 38%
Median Spend - £5,000
UP 11% from 2002

The AGRGraduate Recruitment Survey 2003 Winter Review
Page 30
Percentage of AGR employers who provided information abouttheir spending in 2003 &2002
50403020100
£25,001-£50,000 15%
Source - High Fliers Research
Chart 4.7 AGR employers’ total spending on graduate recruitment marketing in 2003
£250,001-£500,000 5%
More than £500,000 3%
£100,001-£150,000 14%
£50,001-£75,000 14%
Up to £25,000 28%
Total Median Spend - £53,500
UP 3% from 2002
Total Marketing Spending in 2003With such tremendous variation in the scale of graduate recruitment between AGR employers, it is
unrealistic to attempt to provide an absolute ‘benchmark’figure for total spending on marketing. It is,
however, possible to show the range of spending that AGR employers have been involved with for their
combined marketing activities during 2003, and the comparative data from 2002.
This total is calculated from the declared spending for their graduate recruitment brochure, website,
advertising, online promotions, careers fairs and presentations. It does not take account of any staff
costs or departmental overheads, nor does it include any other promotions that employers may have
run during their recruitment round outside of the six key areas listed.
Overall, the median total spending level for graduate recruitment marketing in 2003 was £53,500 up
just 3% on declared spending in 2002 (see Chart 4.7). This includes a quarter of employers who spent
£25,000 in 2003 on all their marketing activities and one in twelve organisations who have spent ten
times this amount – over a quarter of a million pounds – for the same recruiting season.
When these results are analysed to take into account the number of vacancies that employers are
recruiting for, it is possible to determine an indication of the ‘marketing spend per vacancy’ levels for
each employer (see Chart 4.8). This analysis shows a huge variation in the ‘spend per vacancy’between
AGR recruiters, from just a few hundred pounds per graduate to well over £7,500 spent marketing each
vacancy. The median level for ‘marketing spend per vacancy’in 2003 is £1,500, down 1% on 2002.
Comparing median spending levels for employers in individual industries or business sectors, it is
evident that there are tremendous differences in marketing budgets (see Chart 4.9). The highest costs
reported are for FMCG companies, public sector employers, investment banks, law firms, and energy,
water & utility co m p a n i e s . The lowe s t ‘ m a r keting spend per va c a n c y ’ was for acco u ntancy or
professional services firms where higher volumes of graduates often helped reduce the median spend.
£150,001-£200,000 4%
£200,001-£250,000 6%
£75,001-£100,000 9%

Page 31
The AGRGraduate Recruitment Survey 2003 Winter Review
Percentage of AGR employers who provided information abouttheir spending in 2003 &2002
50403020100
Source - High Fliers Research
Chart 4.8 AGR employers’spending per vacancy on graduate recruitment marketing in 2003
£5,001-£7,500 6%
More than £7,500 4%
£2,501-£5,000 20%
Median Spend per Vacancy - £1,500
DOWN 1% from 2002
£1,001-£2,500 37%
£501-£1,000 19%
Up to £500 13%
Median spending per graduate vacancy by AGRemployers in 2003
£3,000£2,000£1,0000
Chemical or pharmaceutical company £1,700
Source - High Fliers Research
Chart 4.9 Median spending per vacancy on gra d u ate re c r u i t m e nt m a r keting in 2003, by industry
Investment bank or fund manager £2,500
Fast-moving consumer goods company £3,400
Law firm £2,000
Energy, water or utility company £2,000
IT company £1,600
Construction company £600
Engineering or industrial company £1,100
Motor manufacturer £1,500
Commercial or retail bank £700
Retailer 1,200
Accountancy or professional services firm £600
Public sector £2,900

The AGRGraduate Recruitment Survey 2003 Winter Review
Page 32
Percentage of AGR employers
403020100
Considerably fewer applications than in 2002
4%
Source - High Fliers Research
Chart 4.11 AGR employers perceptions of application levels from graduates so far in 2003
A few lessapplications than in 2002
12%
About the same numberof applications as in 2002
26%
A few moreapplications than in 2002
24%
Considerably moreapplications than in 2002
34%
Percentage of AGR employers
403020100
Considerably less students than in 2002
4%
Source - High Fliers Research
Chart 4.10 AGR employers perceptions of attendances at their campus events so far in 2003
A few less students than in 2002
18%
About the same numberof students as 2002
35%
A few more students than in 2002
22%
Considerably morestudents than in 2002
21%
Perceptions of the Current Graduate MarketThe last question of the survey asked AGR employers about their experience so far during the 2002-3
graduate recruitment season, to try and determine the current outlook amongst university students
and graduate job seekers.
The results show that almost half of all employers questioned felt that they’d had a larger audience for
their campus promotional events (such as university presentations or careers fair stands) so far this
season, compared to a year ago (see Chart 4.10). A third believed they’d had similar audiences and just
a fifth thought few students had participated in events.
In terms of applications for graduate positions, nearly 60% of AGR employers reported receiving more
applications so far this year although a limited number of engineering, industrial, manufacturing and
IT recruiters believed they’d had a drop in applications (see Chart 4.11).