History of Kosovo – in the history textbooks of Kosovo, Albania ...

1
Survey on Inclusive Education in ten
Primary Schools of Kosovo
November 2015

2

3
Acknowledgement.........................................................................4Acronyms............................................................................................5Executive Summary.......................................................................61. Introduction..................................................................................7
1.1 Purpose of the Study.......................................................71.2 Social Inclusions and Inclusive Education.................8
2. Methodology................................................................................92.1 Participants and Sampling..............................................92.2 Measurements..................................................................102.3 Data Collection Process.................................................122.4 Conidentiality Issues......................................................132.5 Limitations of the Study..................................................13
3. Results...........................................................................................143.1 Children’s Perceptions on Social Inclusion and Bullying...........................................................143.2 Parents’ Perceptions of Social Inclusion....................243.3 Teachers’ Perceptions on Social Inclusion...............273.4 Directors’ Perceptions of Social Inclusion................303.5 Local Authorities’ Perceptions on Social Inclusion........................................................................30
4. Conclusion..................................................................................314.1 Recommendations..........................................................32
5. References....................................................................................33
Contents

4
Authors
Acknowled-
gement
Natyra Agani-DestaniLinda HoxhaKaltrina Kelmendi
This study has been supported by the joint European Union and Council of Europe Programme “Supporting Access to Education and Intercultural Understanding: EU/CoE support in the ield of education to forced returnees and to Roma, Ashkali and Egyptian communities in Koso-vo*” (ACCESS) that have provided constant feedbacks and necessary information during all the stages of the study.
Moreover, a special thanks goes to all school staf for their logistical assistance in gathering data. Finally, this study would have not been possible without students, parents, teachers, directors, and school authorities’ participation to whom the research team expresses a special gratitude.
Disclaimer: The views expressed in this report are those of the authors and do not necessarily represent those of the European Union and the Council of Europe.
*This designation is without prejudice to positions on status, and is in
line with UNSCR 1244 and the ICJ Opinion on the Kosovo Declaration
of Independence.

5
EU: European UnionCoE: Council of EuropeUP: University of Pristina “Hasan Prishtina”OBQ: Olweus Bullying Questionnaire
Acronyms

6
Executive
Summary
This report provides a comprehensive overview of the inclusive education situation in ive municipalities in Kosovo, as perceived by children, parents, teachers, school directors, and local authorities. It identiies the sit-uation regarding 1) inclusive practices for entry to school; 2) inclusion within the school; 3) inclusive teaching and practice approaches; and 4) community engagement. It sets out the methodology by which information was gathered, from desk review, ieldwork including inter-views and training of students for data gathering.
This study looks at speciic areas of inclusive ed-ucation, such as inclusive practices within school, inclu-sive teaching and community engagement, always con-sulting four sources of data; children, parents, teachers, and school directors. As a result, the study points out the importance of inclusive education, not only in the mu-nicipalities where the study was conducted, but all over Kosovo.
Results presented in this report indicate that the majority of schools have started to establish practices and approaches for overall inclusion index with its four main dimensions. In addition results indicated signiicant diferences on inclusive education perceptions between diferent stakeholders and in comparison to municipal-ities, thus providing argumentative basis for further in-terventions in this area. Creating, a best practices model can result fruitful in scaling up and replicating a success-ful model of intervention. Finally, it is of crucial relevance to work on raising the awareness on the importance of inclusive education among children as well as building synergies between various implicated parties. This ap-proach will be fundamental to ensure sustainable and long-lasting efects of intervention in inclusive education.

7
The Joint EU/CoE Programme “Supporting Access to Education and Intercultural Understanding: EU/CoE support in the ield of education to forced returnees and to Roma, Ashkali and Egyptian communities in Kosovo” (ACCESS) aims to directly involve Kosovo authorities in building local institutional capacity, so that schools, local authorities and civil society are able to expand support and education services to integrate returnee children and Roma, Ashkali and Egyptian children into schools. The project started in September 2013 and will be active until December 2015.The project is structured in ive components that aim to:
• Foster the enrolment and regular attendance in schools of school- age returnee children and of disadvantaged minority children in general, with special attention to Roma, Ashkali and Egyptians;• Increase the capacity of the education system to ensure higher chances for school achievement of returnee children and Roma, Ashkali and Egyptian children;• Improve the status of Romani language as a sub-ject in Kosovo schools;• Enhance the integration of returnee children among peers in school and in local community;• Review and improve policies concerning the edu-cation of repatriated children.
The objective of this study, conducted as an ex-ternal evaluation in the framework of the project, was to analyze the achievements, opportunities, constraints, and weaknesses of the project as well as capacity build-ing of relevant stakeholders (teachers, parents, and local authorities) in the piloting. In addition, this external eval-uation aimed to take a closer look on perception of teach-ers, parents, and local authorities’ perceptions on social inclusion within school context. For this purposes the EU and CoE Joint Programme “Increasing Access to Educa-tion and Intercultural Understanding” and Rectorate of
1.
Introduction
1.1
Purpose of the
Study

8
the University of Pristina “Hasan Prishtina” signed a legal agreement of cooperation and appointed Department of Psychology within Faculty of Philosophy to conduct the study. For this purpose, the department engaged three research assistants and ten Master students from School Psychology and Counselling program within the depart-ment for data collection. The results of the study will be useful for the CoE to assess the status of inclusion in the schools and to compare them with a broader assessment conducted in the region.
Social inclusion is in most cases in relation to social exclusion. It is usually deined as one society in which all people feel valued and their basic needs are met, despite their diferences, as such diference are respected and treated as a contributing factor to diversity (Robo, 2014). Social inclusion is associated with the sense of belonging, acceptance, and recognition of one’s diversity. The major values behind the social inclusion are based on principles which value diversity but at the same time promise the support for each other, such as: everyone needs support, everyone can contribute, everyone can communicate, and everyone is ready. On the other hand, social exclu-sion is deined as process, which inhibits person’s integra-tion to the community, through its exclusion in the social, political, economic, and cultural life (Cappo, 2002).
Taking into account that exclusion might occur ear-ly in life, inclusive education is one of the most important mechanisms which will ensure promotion and expansion of the concept of social inclusion. Moreover, inclusive edu-cation is considered as one of the crucial requirements for democratic society (Lipsky & Gartner, 2013) and strongly contributes in the context of mental health (WHO, 2012). Although, indings from literature emphasize various deinitions related to social inclusion (e.g., Mathieson, Po-pay, Enoch, Escorel, Hernandez, Johnston, & Rispel, 2008), the approach of the project is to take a broad deinition of inclusiveness in education, referring to an education
1.2
Social
Inclusions
and Inclusive
Education
9
system that manages to recognize and accommodate the needs of all groups, including those that are marginalized and at-risk-of-marginalization, in society.
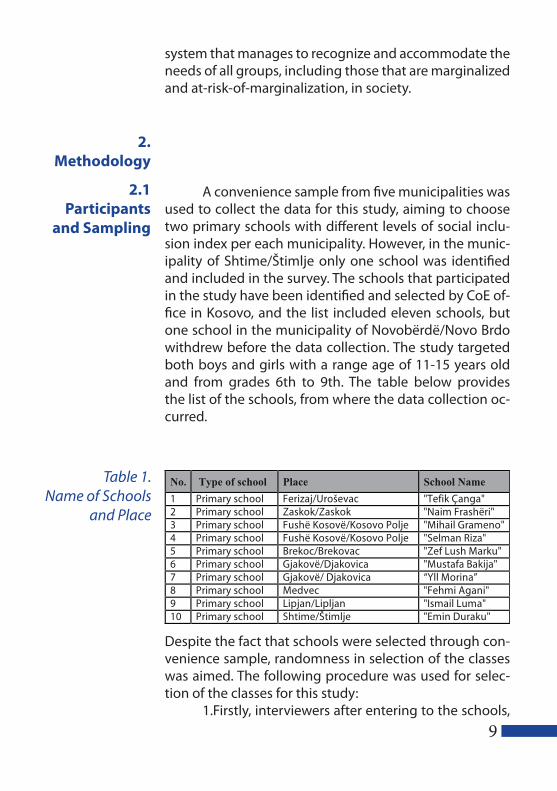
A convenience sample from ive municipalities was used to collect the data for this study, aiming to choose two primary schools with diferent levels of social inclu-sion index per each municipality. However, in the munic-ipality of Shtime/Štimlje only one school was identiied and included in the survey. The schools that participated in the study have been identiied and selected by CoE of-ice in Kosovo, and the list included eleven schools, but one school in the municipality of Novobërdë/Novo Brdo withdrew before the data collection. The study targeted both boys and girls with a range age of 11-15 years old and from grades 6th to 9th. The table below provides the list of the schools, from where the data collection oc-curred.
Despite the fact that schools were selected through con-venience sample, randomness in selection of the classes was aimed. The following procedure was used for selec-tion of the classes for this study:
1.Firstly, interviewers after entering to the schools,
2.
Methodology
2.1
Participants
and Sampling
Table 1.
Name of Schools
and Place

10
found the place where the classes are located; 2.Secondly, they chose one side either right or left, based on which side the classes are located;3.Thirdly, they arbitrarily choose one number (No.2), and based on that number selected the classes for example V/2; VI/2; VII/2; VIII/2 ;IX/2 and V/4; VI/4; VII/4; VIII/4; IX/4; and4. When they went to the new school, they followed the same rules, but this time, they choose one odd number for selection of classes, for example: V/1; VI/1; VII/1; VIII/1; IX/1 and V/3; VI/3; VII/3; VIII/3 ;IX/3.By conducting this procedure for selection of class-
es, randomness in the selection of sample was aimed. Further, during identiication and selection of the sample, schools psychologist or other school stafs ofered their assistance in order not to disrupt the educational process.
The measures for this study were based upon the Index for Inclusion developed by Booth and Ainscosw (2002), which has been shown to provide a good foun-dation for measuring school inclusion. The index has four main dimensions, each representing a dimension where inclusion/exclusion might occur. These dimensions in-clude:
A. Inclusive practices for entry to school;B. Inclusion within the school;C. Inclusive teaching and practice approaches; andD. Community engagement.Several stakeholders have been identiied to par-
take in this study, with speciically focusing on a) stu-dents; b) parents; c) teachers; d) school team which in-cludes the director of the school; and e) local authorities. Each stakeholder group was presented with questions on relevant dimensions as illustrated in the following table.
2.2
Measurements

11
The response alternatives to the dimensions have been ranged from 1 (Not at all) to 5 (A lot). Further, the Olweus Bullying Questionnaire (OBQ; Olweus & Limber, 2010) which is the most widely used bullying self-report survey in the world (Nansel et al., 2001), has been used as well. This questionnaire is composed of 40 questions, primarily concerned with the frequency and types of bullying that students have experienced and how they responded to it. The response alternatives to the key questions are: ‘I hav-en’t been bullied/bullied other students at school in the past couple of months,’ ‘only once or twice,’ ‘2 or 3 times a month,’ ‘about once a week,’ and ‘several times a week,’ usually ranked on a 5-point scale. However, for the pur-pose of this study only 17 items have been used, which looked into the ways of being bullied by other student(s). Lastly, demographic questions had socio-economic back-ground and included gender, birth year, school perfor-mance, parents’ employment, number of siblings, and whether they had a working desk. The total number of items for children questionnaire was 41, for parents 17, for directors 13, for teachers 39 items, and for local au-thorities there were 24 items.
Table 2.
Dimensions of
the Questionnaire

12
During the last week of September 2015, the pro-cess of translating questionnaires from English into Al-banian language took place and to ensure translation accuracy, the questionnaires have been back translated into English from the team members. During the transla-tion process there were no signiicant obstacles however, there was a diiculty with translating the term “bullying” in Albanian language, since there is no word that de-scribes this term. In order to translate this term, studies and reports in the ield of bullying that have been con-ducted in Kosovo and in neighbourhood countries (e.g., Albania and Macedonia) were consulted, and the closest meaning of the deinition of “bullying” used to describe this term in Albanian was “ngacmimi”.
In addition, in the beginning of October 2015,
the team informed Master students enrolled in the pro-gram of School Psychology and Counselling about an informational meeting regarding the project within the department of Psychology. Further, we asked interested students to send their CVs, with particular focus on the previous research experience. A careful selection of stu-dents has been made with particular focus on research abilities and social skills. From this process, ten students have been selected to conduct the data collection of the study. In the following week, the team organized train-ing about the implementation of the questionnaires with particular emphasis on the ethical issues, as well as logis-tical arrangement including the appointment for schools, respectively municipalities. Data collection occurred in the third week of October, from 12-16 October 2015, af-ter the approval from the directorate of education within the municipality had been granted. It is worth mention-ing that the process of data collection went according to the plan and during the whole process the logistical assis-tance from the school staf (director, school psychologist, and teachers) was present.
2.3
Data Collection
Process

13
An informational letter about the study was pre-pared by the research team which described in detail the purpose of the study, potential risks and beneits, coni-dentiality issues, the voluntary nature of the study, and contact details in case there are questions. Students have also been informed that those who have not returned their signed consent forms will not take part in the study, but would not be penalized by the school director, teach-ers, or school psychologist in any way. Children who had not taken part in the study had been instructed to stay in class and do their homework unless the school psychol-ogist invited them to do activities under her/his supervi-sion.
Detailed instructions had been given to students before the administration of the questionnaires and they were strongly encouraged to give sincere answers and not to tell anybody at school or at home about the way they responded. Anonymous self-reported question-naires were distributed during a class period to all partic-ipants, and teachers and other school staf were not pres-ent during the administration of the questionnaires. The administration of the questionnaires was overseen by the ield researcher who was available to answer questions that students had. Teachers and director of the school completed their questionnaires during the recess time in order not to disturb teaching and learning process, while parents were given the questionnaires through their chil-dren to be completed at home, and to be returned the following day with the consent for participation in the study. Local authorities have been sent the questionnaire via e-mail. The collected data have been stored electroni-cally and only the researcher team has access to the data.
It is worth mentioning that the study faced several limitations. First and foremost, lack of a baseline study lim-ited the knowledge on the efect and impact of the social inclusion index, as the research team did not have initial
2.4
Conidentiality
Issues
2.5
Limitations of
the Study

14
data to compare with the data from this study. Secondly, due to the withdrawal of the school from Serbian commu-nity, only Kosovo Albanian schools were surveyed. Third, one primary school in municipality of Gjakovë/Ðakovica is only for students from 1st to 5th grade, and these were not a target group of this study. As a result, only parents, teacher, and school director took part in the study from “Yll Morina” school. Finally since only two municipal oi-cers answered the questionnaire, their contribution was not deemed statistically relevant.
In this section are presented the overall results of the study, including the demographic analyses. Each sec-tion provides an overview of major indings of the study. The irst section presents indings from data collection on student, with a total sample of 1,039 students from ive municipalities, respectively ten schools. The table below illustrates the number of students segregated per each municipality.
3.Results
3.1 Children’s
Perceptions on
Social Inclusion
and Bullying
Table 3:
Number of pupils
disaggregated
by municipalities

15
Results showed that 48% (N=475) of the sample were boys, 52% (N=537) were girls, while 2.5 % of stu-dents (N=27) did not report their gender. In terms of classes, approximately similar number of students be-longed to each class level and there was almost equal dis-tribution of gender per class. Table below illustrates the distribution of students in classes segregated by gender.
In terms of school achievements, approximately 60% of students (N=1039) reported having rather excel-lent grades, 22% very good grades, 11% good grades, and only 0.7% reported performing poor at school. In terms of gender distribution, it could be noticed that there were
Graph 1.
Division of
students based
on municipalities
Table 4:
Number of
students per class,
disaggregated
by gender

16
statistically signiicant diferences between boys and girls in terms of grades, where girls reported higher grades in comparison to boys. Table below illustrates the diferenc-es between gender and school success.
Socio-economic situation was measured by asking students about their parent’s employment. The results in-dicated that 80% of fathers are employed while 15% of participants responded that their father is not employed. On the other hand, only 35% of mothers are employed, while 61% reported not to be employed. These ind-ing relects the overall situation of female participation in labour market. In addition, 98% of students report-ed that they have a brother and sister, and 83% report-ed that they have a working desk for doing homework, which also is an indicator of socio-economic situation.
The following questions illustrated by graphs, present the responses of children regarding nature and prevalence of inclusive educational practices from their perspective. When students where asked whether they feel welcomed in school, 85% respond-ed with “very”, while 9% responded with “somehow”.
Table 5:
Cross tabs for
school success and
gender

17
When asked whether other children are friendly, 63% responded with “very much”, 17% with “somehow”, 10% with “not very”, 5% with “neutral”, 3% with “I don’t know” and less than 1% responded with “not at all”. This is an indicator that majority of students perceive their peers to be friendly to them.
When asked whether teachers are friendly, majori-ty of participants responded with “very much” and only a small percentage responded with “not at all”.
Graph 2.
Students’ percep-
tions of inclusive
practices for entry
to school
Graph 3.
Students’
perceptions of
inclusion within
school

18
When participants were asked whether “they feel involved in formulating classroom rules”, more than 50% responded with “very much” while the rest of the respons-es fell between “somehow”, “not much”, “neutral”, “not at all”, and “I don’t know”. In addition it is important to high-light that there is signiicant diference between those who feel and those who do not involved in this process.
When participants were asked whether their class-mates ofer their help when facing with a problem or diicul-ty at school, majority of participants responded with “a lot”, while about 20% responded with “not much”. When asked whether teachers are ready to help when there is a problem, about 70% of the sample responded with “a lot” while less than 10% of the total sample responded with “not much”. These results are particularly relevant for inclusion within school, from school staf, respectively teachers.
Graph 4.
Students’
perceptions of
inclusion
within school
Graph 5.
Students’
perceptions of
inclusion
within school

19
When participants were asked whether they attend activities outside of school (or extra-curricular activities), 28% responded with “very much”, 33% with “not much”, 28% with “much”, 17% with “somewhat”, 7% with “neutral”, 13% “not at all” and 2% with “I don’t know”. These results relect the lack of activities outside of school for children, which in turn might impact the inclusion of marginalized or vulnerable groups within school context.
The next set of questions asked students about practices of inclusiveness practices within class. Majority
Graph 6.
Students’
perceptions of
inclusion
within school
Graph 7.
Students’
perceptions of
inclusion within
school

20
of students responded that “class rules are fair for all stu-dents”, 52% responded positively that “teachers treat all children equally”, and 48% responded positively “teach-ers are correct in their evaluation”. These indings suggest that practices of inclusiveness are present within class context, and moreover emphasize the good role model that comes from teachers.
The following set of questions looked into inclusion practices within school. From the total sample size, 30% responded positively to the statement that “inclusiveness is an important element of the school”, 25% reported that there are no “physical barriers to access school”, and 40% reported that there are no “physical diiculties in entering the school for disables students”. These indings indicate that practices of inclusiveness are present within school, students are familiar with practices inclusiveness and there is attention from student’s to vulnerable or margin-alized groups such as students with disabilities. More de-tailed information is provided by the graph below.
The second set of analyses included level of in-clusive practices for entry to school and inclusion with-in schools segregated by municipalities. For example, schools from municipality of Fushë Kosovë/Kosovo Polje have reported the highest “equal treatment of children by teachers”, while schools from municipality of Gjakovë/Ðakovica have reported the lowest “equal treatment of children by teachers” with more than 10% responding
Graph 8.
Students’
perceptions of
inclusion
within school

21
with “not very” (see graph 9). When asked about whether teachers are “fair in their evaluation”, schools from munic-ipality of Gjakovë/Ðakovica reported to have the highest percentage, while the lowest percentage was from school in the municipality of Shtime/Štimlje (see graph 10). Last-ly, results showed that “inclusion is an important element of school” signiicantly higher for schools from municipal-ity of Lipjan/Lipljan where 40% of students responded positively to this statement, when compared to schools from other municipalities.
Graph 9.
Practices for
entry to school
and inclusion
within schools
segregated by
municipalities
Graph 10.
Students’
perceptions of
inclusion within
school
segregated by
municipalities

22
Besides dimensions of inclusive practices for entry to school and inclusion within the school, participants have been administered also the OBQ. The most widely used deinition of bullying is that provided by Olweus (1978), which states that a person is being bullied when he or she is exposed repeatedly and over time, to neg-ative actions on the part of one or more other persons. Negative actions may be both verbal (e.g. threatening, degrading, teasing) and non-verbal (e. g. hitting, kicking, slapping, pushing, vandalizing property, rude gestures, and making faces) (Olweus, 1993). As the deinition high-lights, bullying acts include the aggressive component, power imbalance, and repetitive nature.
In line with indings from literature regarding the trends of bullying in the Balkan Peninsula, the study con-ducted by UNICEF (2005) in Kosovo, found that children between 11 and 18 years were afected by injustice in school and expressed diiculties in coping with bullying. In addition, study conducted by Agani (2010) found that out of 247 Albanian and Serbian participants between grades 6th and 9th, 12% experienced bullying “once or twice” and 6% experienced bullying “2 or 3 times a month or more”. Thus, bullying as a phenomenon although new within school context and low reported prevalence is present within school context.
When participants in this study were asked “how
Graph 11.
Students’
perceptions
of inclusion
within school
segregated by
municipalities

23
much do they like school”, 63% responded with “I like school very much”, 25% responded with “I like school”, 4% “neither liked or disliked school”, 3% responded with “I dis-like school”, and only 2% responded with “I dislike school very much”. These results present another perspective of inclusiveness within school, as it takes in consideration student’s attitudes toward school.
Graph 12.
Students’
perception on
how much
they like
the school
The following question asked participants about the “number of good friends they have in the class”, and 61% of participants responded that they have more than 6 friends in class, 16% responded to have 4 or 5 friends in class, 9% responded they have 2 or 3 friends in class, 5% responded to have 1 good friend in class, while 6% of participants reported not to have any good friend in class. In addition, participants were asked about the frequency of bullying within school during the last month and 69% of participants reported not to have experienced bully-ing during the last month, 17% reported that it happened “once or twice”, 4% reported that they have been bullied “two or three times during last month”. 3% reported to have experienced bullying once a week, and 4% of par-ticipants reported to have been bullied numerous times within the week. As the results indicate and in line with indings from literature, bullying is present within school context, primarily between students among grades 6th

24
and 9th, although the prevalence of bullying behaviours is not high.
The second set of analyses included frequency of bullying, disaggregated by municipality, where schools from municipality of Fushë Kosovë/Kosovo Polje report-ed to have the lowest frequency of bullying within school (80% of students have not experienced bullying in the last month), while municipalities of Lipjan/Lipljan, Gja-kovë/Ðakovica, and Ferizaj/Uroševac reported to have the highest frequency of bullying within school.
Graph 13.
Students’ percep-
tions on frequen-
cy of bullying
disaggregated by
municipalities
3.2
Parents’
Perceptions of
Social Inclsion
Second group of stakeholders in this study includ-ed parents of children that were composed of 1,141 par-ticipants in total. Below are the graphs that illustrate the diferences in parents responses segregated by munici-palities. When parents were asked whether “all children feel welcome in school from their teachers regardless of their ethnic background”, more than 60% of parents from municipality of Gjakovë/Ðakovica responded with “very much”, whereas more than 10% of parents from the mu-nicipality of Fushë Kosovë/Kosovo Polje responded with “not at all”

25
Graph 14.
Parents’ per-
ceptions on
inclusive prac-
tices for entry
to school
The following set of questions asked parents wheth-er “students with diferent cultural and social background face diiculties to register and attend schools”. The results showed that schools from municipality of Fushë Kosovë/Kosovo Polje had the highest percentage of response al-ternative “not at all”, while parents from municipality of Shtime/Štimlje responded with nearly 30% with response alternative of “I don’t know”. When parents were asked whether “students were protected from teachers and school staf, which enables them to feel comfortable to attend school”, parents from municipality of Lipjan/Lip-ljan reported with the highest percentage of more than 60% with response alternative of “very much”. The lowest percentage for this item had parents from the municipal-ity of Shtime/Štimlje with less than 50%.

26
Graph 15.
Parents’ per-
ceptions on
inclusive prac-
tices for entry
to school
The following question asked parents about “in-volvement of parents from Roma, Ashkali, and Egyp-tian communities involved in school activities”. Results showed that parents from municipality of Gjakovë/Ða-kovica reported 35% the alternative “very much”, while parents from municipality of Lipjan/Lipljan and Fushë Kosovë/Kosovo Polje reported 20% the alternative “not at all”. About 25% of parents from municipality of Shtime/Štimlje and Ferizaj/Uroševac responded with “I don’t know” to this question.
Graph 16.
Parents’
perceptions on
involvement in
school activi-
ties for Roma,
Ashkali, and
Egyptian
communities
The next question asked parents whether “school
27
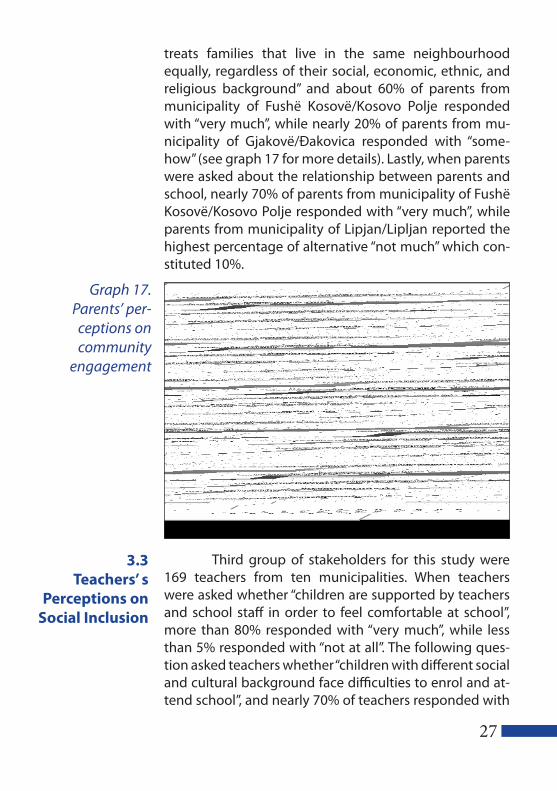
treats families that live in the same neighbourhood equally, regardless of their social, economic, ethnic, and religious background” and about 60% of parents from municipality of Fushë Kosovë/Kosovo Polje responded with “very much”, while nearly 20% of parents from mu-nicipality of Gjakovë/Ðakovica responded with “some-how” (see graph 17 for more details). Lastly, when parents were asked about the relationship between parents and school, nearly 70% of parents from municipality of Fushë Kosovë/Kosovo Polje responded with “very much”, while parents from municipality of Lipjan/Lipljan reported the highest percentage of alternative “not much” which con-stituted 10%.
Graph 17.
Parents’ per-
ceptions on
community
engagement
3.3
Teachers’ s
Perceptions on
Social Inclusion
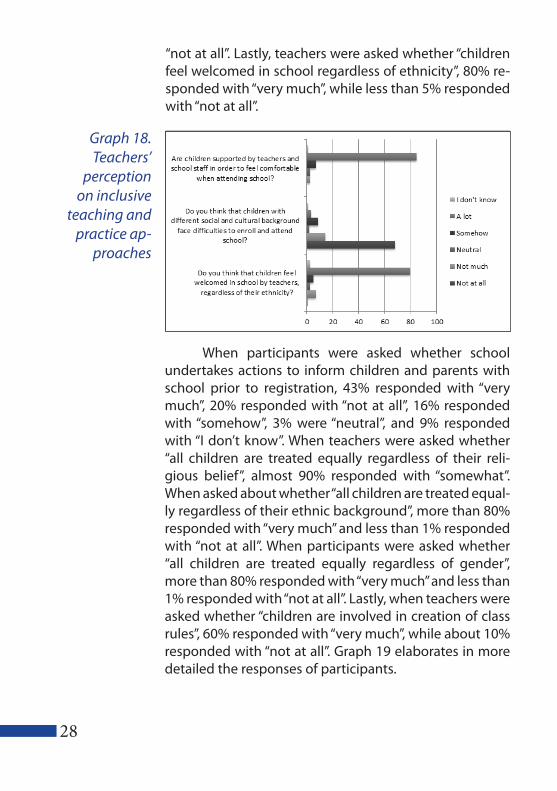
Third group of stakeholders for this study were 169 teachers from ten municipalities. When teachers were asked whether “children are supported by teachers and school staf in order to feel comfortable at school”, more than 80% responded with “very much”, while less than 5% responded with “not at all”. The following ques-tion asked teachers whether “children with diferent social and cultural background face diiculties to enrol and at-tend school”, and nearly 70% of teachers responded with
28
“not at all”. Lastly, teachers were asked whether “children feel welcomed in school regardless of ethnicity”, 80% re-sponded with “very much”, while less than 5% responded with “not at all”.
Graph 18.
Teachers’
perception
on inclusive
teaching and
practice ap-
proaches
When participants were asked whether school undertakes actions to inform children and parents with school prior to registration, 43% responded with “very much”, 20% responded with “not at all”, 16% responded with “somehow”, 3% were “neutral”, and 9% responded with “I don’t know”. When teachers were asked whether “all children are treated equally regardless of their reli-gious belief”, almost 90% responded with “somewhat”. When asked about whether “all children are treated equal-ly regardless of their ethnic background”, more than 80% responded with “very much” and less than 1% responded with “not at all”. When participants were asked whether “all children are treated equally regardless of gender”, more than 80% responded with “very much” and less than 1% responded with “not at all”. Lastly, when teachers were asked whether “children are involved in creation of class rules”, 60% responded with “very much”, while about 10% responded with “not at all”. Graph 19 elaborates in more detailed the responses of participants.

29
Graph 19.
Teachers’
perception
on inclusive
teaching and
practice
approaches
Participants were also asked whether they work with children from Roma, Ashkali, and Egyptian commu-nities, and the results showed that 90% responded with “yes”, 7% with “no”, and less than 2% responded with “I don’t know”.
Graph 20.
Teachers’
perception on
inclusive
teaching and
practice
approaches
Lastly, participants were asked about the rela-tionship between school and parents, and 75% respond-ed that their relationship is “very good”, 9% responded with “somehow”, 4% responded with “neutral”, and 5% of participants responded with “not much”.
30
Fourth group of stakeholders included 10 school directors in ten schools, respectively ive municipali-ties. The questionnaire for directors was composed of 29 items and included dimension of inclusive practices for entry to school, inclusive teaching and practice ap-proach, and community engagement. Due to the small number of participants from this stakeholder group, only interpretation of the results was conducted and compari-sons between the municipalities were not possible.
Results indicated that majority of school directors used inclusive practices for entry to school (e.g., wel-comed into the school by teachers regardless of chil-dren’s background), inclusive teaching and practice ap-proach (e.g., all students are treated equally irrespective of ethnicity); and community engagement (engagement with the local community as an important element of school mission). Nevertheless, there were diferences re-garding responses of participants primarily for commu-nity engagement dimension, speciically regarding the involvement of parents from Roma, Ashkali, and Egyptian communities in the school activities, where majority of participants responded with “somewhat”.
The last group of stakeholder included local author-ities, which was composed of ive participants from each municipality. However, only two participants responded positively to the completion of the questionnaire. The small number of this group of stakeholders did not allow for descriptive statistics or any comparisons between the municipalities.
3.4
Directors’
Perceptions
of Social
Inclusion
3.5
Local
Authorities’
Perceptions
on Social
Inclusion

31
The results of the study indicate that majority of schools have established practices and approaches for overall inclusion index with its four main dimensions. However, there are diferences between stakeholders, particularly based on municipalities. For example, stu-dents perceptions on inclusive practices for entry school and inclusion within school have been reported to be sig-niicantly higher when compared to those who reported “not much” or “I don’t know”. At the same time, students perceived that school inclusion practices are satisfactory, and scored signiicantly higher on the positive side of the items. However there were signiicant diferences when analyses were conducted for municipalities on the four dimension of inclusion index. Furthermore, majority of children responded that they have not experienced bul-lying within school context one month before data col-lection however there was reporting of small percentage of children that have experienced bullying within school context. Nevertheless, there were signiicant diferences of bullying behaviours when disaggregated by munic-ipalities. These results indicate that bullying is present within schools that participated in this study, which in turn might impact practices and approaches for inclusion.
Parents have also reported high percentage on inclusive practices when entering school and commu-nity engagement, however, a number of them were not familiar with diferent aspects, particularly when asked of involvement of Roma, Ashkali, and Egyptian communities in school activities. In addition, there were diferences re-garding diferent municipalities as well, but it should be kept in mind that some municipalities have diferent lev-els of ethnic structure when compared to other schools.
Majority of the third stakeholder group (teachers) reported that inclusive practices for entry school, inclu-sive teaching and practice approach, and community en-gagement are well established in their schools and that their everyday work is guided by those principles. More-over, more than 90% of teachers reported that they work
4.
Conclusion

32
with children from Roma, Ashkali, and Egyptian commu-nity.
Fourth stakeholder group of this study were school directors, who also emphasized that inclusive practices for entry to school, inclusive teaching and prac-tice approach, and community engagement are practices that school aims to achieve and establish. The last stake-holder group was local authorities but the small number of participants did not allow for descriptive statistics or any comparisons between the municipalities.
Findings suggest that social inclusion within schools needs continuous support in order to ensure sus-tainability. This is particularly relevant for teachers and directors of schools in order to integrate these practices within their academic year plan as well as to adapt these practices to their everyday activities. Secondly, capacity building within school is also essential, in order to ensure further advancement of dimensions of social inclusion within school context, especially by empowering rele-vant stakeholders (e.g., parents, teachers and/or local au-thorities) with trainings that maximize their knowledge, capacity, and abilities about social inclusion, as well as trainings that are planned in multidisciplinary approach. Third, stronger synergies must be built between key stakeholders, by organizing monthly meetings where is-sues about school inclusion are discussed. Fourth, aware-ness raising campaigns regarding social inclusion and bullying intervention programs should be planned and organized within school context, in order to introduce and empower a diferent school culture and climate, which is based on inclusive practices and prevention of bullying behaviours within school context. On the other hand, more eforts should be made towards a more qual-itative engagement of parents, teachers, directors, and local authorities to ensure a larger safety for beneiciaries of the project. Finally, to properly assess the functioning
4.1
Recommenda-
tions

33
and quality of social inclusion index, it is advisable that in the future experts be able to partake in some of the activities planned within the framework of the project, in order to provide professional insight.
Agani, N. (2010). Children’s exposure to school vi-olence and bullying and their perceptions of safety in school. Case study: Republic of Kosovo. In press.
Cappo, D Monsignor, 2002, “Social inclusion as a determinant of mental health & wellbeing” de Haan, A. (1998). “Social Exclusion in Policy and Research: Opera-tionalizing the Concept “pg.11-24.
Lipsky, D. K., & Gartner, A. (2013). 1. Inclusive edu-cation: a requirement of a democratic society. World Year-book of Education 1999: Inclusive Education, 12
Mathieson, J., Popay, J., Enoch, E., Escorel, S., Her-nandez, M., Johnston, H., & Rispel, L. (2008). Social Exclu-sion Meaning, measurement and experience and links to health inequalities. A review of literature. WHO Social Ex-clusion Knowledge Network Background Paper, 1.
Nansel, T. R., Oveipeck, M., Pilla, R. S., Ruan, W. J., Si-mons-Morton, & Scheidt, P. (2001).Bullying behav-iors among U.S. youth: Prevalence and association with psychosocial adjustment. Journal of the American Medi-cal Association, 285, 2094-2100.
Olweus, D. (1978). Aggression in the schools: Bul-lying and whipping boys. Washington, DC: Hemisphere.
Olweus, D., & Limber, S. (2010). Bullying in school: Evaluation and dissemination of the Olweus bullying pre-vention program. American Journal of Orthopsychiatry, 80, 124-134.
Olweus, D. (1993). Bullying at school: What we know and what we can do. Oxford, UK: Blackwell.
Robo, M. (2014). Social inclusion and inclusive edu-cation. Academicus International Scientiic Journal, (10), 181-191.
UNICEF (2005). Research into violence against chil-
5.
References

34
dren in schools in Kosovo. Retrieved from: http://www.unicef.org/kosovoprogramme/kosovo_me-dia_prot_011.08.pdf
World Bank (2013). Inclusion Matters: The Foundation for Shared Prosperity. Washington, DC: World Bank. ISBN 978-1-4648-0010-8.

35

36
www.coe.int/education