Survey on grassland ecosystem services -...
78
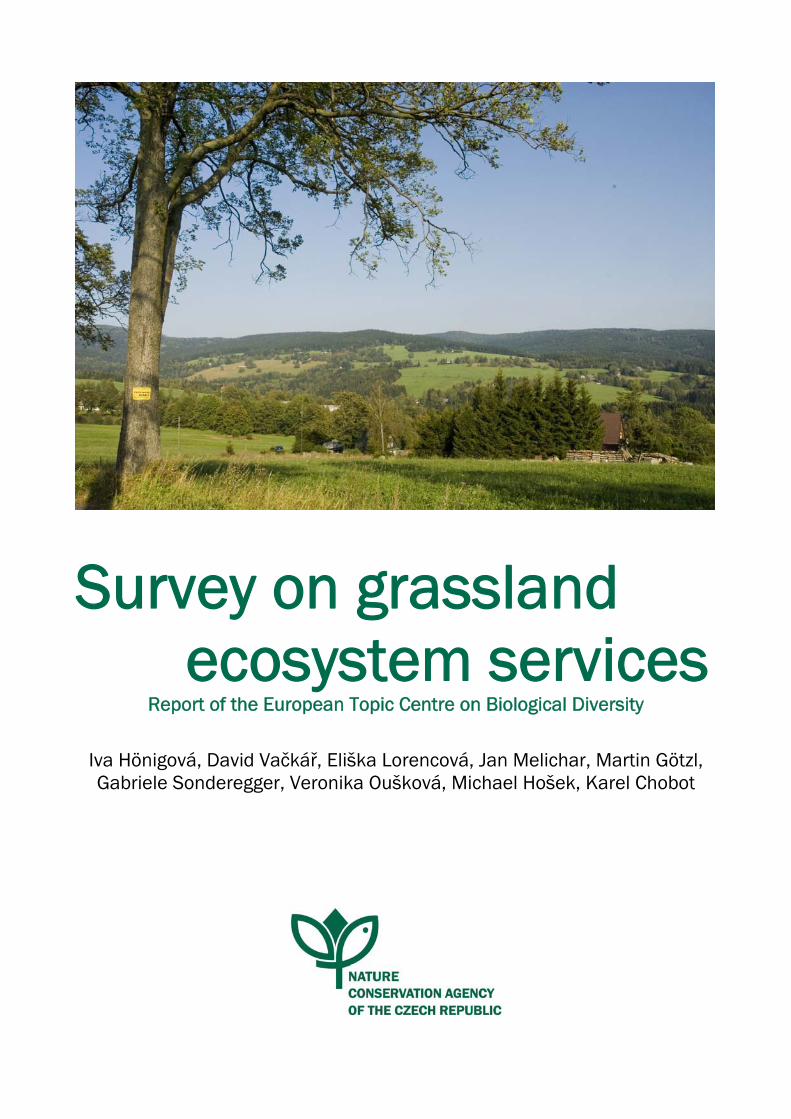
Survey on grassland ecosystem services Report of the European Topic Centre on Biological Diversity Iva Hönigová, David Vačkář, Eliška Lorencová, Jan Melichar, Martin Götzl, Gabriele Sonderegger, Veronika Oušková, Michael Hošek, Karel Chobot
Transcript of Survey on grassland ecosystem services -...
Survey on grassland ecosystem services
Report of the European Topic Centre on Biological Diversity
Iva Hönigová, David Vačkář, Eliška Lorencová, Jan Melichar, Martin Götzl, Gabriele Sonderegger, Veronika Oušková, Michael Hošek, Karel Chobot

2 Survey on grassland ecosystem services
Authors: Iva Hönigová1, David Vačkář2, Eliška Lorencová2, Jan Melichar2, Martin Götzl3, Gabriele Sonderegger3, Veronika Oušková1, Michael Hošek1, Karel Chobot1
1 Nature Conservation Agency of the Czech Republic 2 Charles University Environment Center, Czech Republic 3 Umweltbundesamt GmbH, Austria
Reviewed by: Jaroslav Boháč, University of South Bohemia in České Budějovice, Czech Republic This report was carried out in the framework of the European Topic Centre on Biological Diversity (ETC/BD). The European Topic Centre on Biological Diversity is a consortium of nine organisations operating under a Framework Partnership Agreement with the European Environment Agency. Among others, Nature Conservation Agency of the Czech Republic and Umweltbundesamt GmbH, Austria, belong to this consortium and therefore worked on this report as partners of the ETC/BD. For more information on ETC/BD see please http://bd.eionet.europa.eu. Acknowledgement: This report was kindly supported by the European Environment Agency through the European Topic Centre on Biological Diversity as well as by project The development of indicators for integrated economic and environmental accounting in agriculture (QH92295) awarded to the Charles University Environment Center by the Ministry of Agriculture of the Czech Republic. Authors thank to Dominique Richard and Marcus Zisenis from the ETC/BD who spent a large amount of time to help to frame this report. Suggested citation of this report: Hönigová, I. et al. Survey on grassland ecosystem services. Report to the EEA – European Topic Centre on Biological Diversity. Prague: Nature Conservation Agency of the Czech Republic, 2012. pp 78. Published by Nature Conservation Agency of the Czech Republic, Kaplanova 1, 148 00 Prague 11, Czech Republic. www.nature.cz. Cover photograph © Petr Holub Landscape in Orlické hory ISBN 978-80-87457-25-2 2012
Survey on grassland ecosystem services 3
1 ........................................................................................................................................................4 INTRODUCTION
2 .........................................................6 ECOSYSTEM SERVICES WHICH GRASSLANDS ARE EXPECTED TO PROVIDE
2.1 .....................................................................................................................................................6 FOOD PROVISION2.2 ...................................................................................................................................................6 WATER PROVISION2.3 ......................................................................................................................................................7 RAW MATERIALS2.4 .................................................................................................................................................7 GENETIC RESOURCE2.5 ...........................................................................................................................................7 MEDICINAL RESOURCES2.6 ........................................................................................................................................7 ORNAMENTAL RESOURCES2.7 ..........................................................................................................................................7 AIR QUALITY REGULATION2.8 ..................................................................................................................................7 CLIMATE CHANGE REGULATION2.9 ............................................................................................................................7 MODERATION OF EXTREME EVENTS2.10 ........................................................................................................................................8 WATER FLOW REGULATION2.11 ................................................................................................................................................8 WASTE REGULATION2.12 ..............................................................................................................................................8 EROSION REGULATION2.13 ...............................................................................................................................8 MAINTENANCE OF SOIL FERTILITY2.14 ..........................................................................................................................................................8 POLLINATION2.15 .......................................................................................................................................................8 PEST CONTROL2.16 ............................................................................................................................9 CULTURAL AND AMENITY SERVICES
3 ................................................ 10 QUANTIFICATION OF ECOSYSTEM SERVICES OF SEMI-NATURAL GRASSLANDS
3.1 .................................................................................................................. 10 GRASSLAND ECOSYSTEM ASSESSMENTS3.2 ..................................................................................................... 11 HABITAT APPROACH TO ECOSYSTEM ASSESSMENT3.3 .............................................................. 12 ASSESSMENT OF ECOSYSTEM SERVICES PROVIDED BY GRASSLANDS HABITATS
3.3.1 ..................................................................................................................................... 12 Livestock provision3.3.2 ................................................................................................................................. 12 Carbon sequestration3.3.3 ....................................................................................................................................... 13 Erosion regulation3.3.4 ................................................................................................................................. 13 Water flow regulation3.3.5 ..................................................................................................................................... 13 Invasion regulation3.3.6 ......................................................................................................................................... 14 Waste treatment3.3.7 ......................................................................................................................... 14 Recreation and aesthetics3.3.8 ................................................................................................................................... 15 Summary of findings
4 ................................................ 19 SIGNIFICANCE OF GRASSLANDS FOR BIODIVERSITY OF THE CZECH REPUBLIC
5 .................. 20 TRADE-OFFS AMONG ECOSYSTEM SERVICES PROVIDED BY GRASSLANDS UNDER VARIOUS USE
5.1 ...................................................... 20 OVERVIEW OF ECOSYSTEM SERVICE TRADE-OFFS AS A RESULT OF LAND USE CHANGE5.1.1 ..................................................................................................................... 21 Ecosystem service trade-offs5.1.2 .................................................................................................................................................. 22 Productivity5.1.3 ................................................................................................................................. 24 Carbon sequestration5.1.4 ..................................................................................................................... 27 Pollination service by insects5.1.5 ................................................................................................................................................... 29 Recreation5.1.6 ........................................ 31 Conclusions of ecosystem service trade-offs as a result of land use change
5.2 .................................................................. 32 ECOSYSTEM SERVICES IN THE CONTEXT OF ENVIRONMENTAL DEGRADATION5.2.1 ..................................................................................................................................... 33 Livestock provision5.2.2 ................................................................................................................................. 33 Carbon sequestration5.2.3 ................................................................................................................................. 33 Water flow regulation5.2.4 .................................................................................................................................................. 33 Soil erosion5.2.5 ..................................................................................................................................... 34 Invasion resistance5.2.6 ....................................................................................................................................... 34 Degradation scale
5.3 .............................................................. 35 COMPARISON OF COSTS AND BENEFITS OF GRASSLAND ECOSYSTEM SERVICES5.3.1 ....................................................................... 35 Expenditures from Landscape management programme5.3.2 ............................................................................... 36 Expenditures from Agri-environmental programmes5.3.3 ................................................................................ 36 Net present value of grassland ecosystem services
5.4 ....................................................................................................... 38 MAPPING OF GRASSLAND ECOSYSTEM SERVICES
6 ...................................................................................................................................... 40 OVERALL CONCLUSIONS
7 ........................................................................................................................................................ 41 REFERENCES
LIST OF TABLES AND FIGURES.............................................................................................................................................. 47
ANNEX I: ECOSYSTEM SERVICES TRADE-OFFS ............................................................................................................ 48
ANNEX II: MAPPING OF ECOSYSTEM SERVICES........................................................................................................... 75

4 Survey on grassland ecosystem services
1 Introduction The aim of this report was to complete and extend the pilot study on grassland ecosystem services which was elaborated in 2010. That pilot study explained the choice of grasslands as a model ecosystem due to the importance which grasslands play in the European Union from the perspective of economy and EU budget as well as due to the long in tradition in agricultural management. Also the relation to the fundamental initiatives in ecosystem services assessment – namely Millennium Ecosystem Assessment – was established in 2010 pilot study. The recent outcomes are based on the findings from the previous year which set up the delineation of grasslands in the Czech Republic, made introduction to the methods of ecosystem services quantification, explored main available datasets and executed the first attempt to analyse ecosystem services in terms of quantity of their flows. The 2010 study also employed so called habitat mapping layer which captures data on abundance and distribution of particular habitats on the finest possible resolution. The authors built on this rare feature of dataset on grasslands and established a 'habitat approach' to ecosystem services assessment which allows further differentiation within a broader ecosystem category of grassland according to the individual habitats (or groups of habitats). This report presents (in chapter 3) the outcomes of extended and completed assessment of several ecosystem services which contribute extensively to the benefits provided by grasslands and which were targeted by the 2010 pilot study. These services, namely livestock provision, carbon sequestration, soil erosion regulation, water flow regulation, invasion resistance and recreation were further supplemented by waste treatment (i.e. nitrogen removal). This survey made the assessment of all these services complete by calculating both biophysical quantity and economic value of each service. However, expectations on ecosystem services assessment has raised since the last year due to the increasing acceptance and popularity of the TEEB study as well as due to the newly adopted EU Biodiversity Strategy to 2020, besides others. If the ecosystem services should be taken into account in decision making at all levels, more information would be needed and more complex and precise analyses would have to be performed in order
to gain sound, fair and reliable input. Therefore, this year survey has been further extended by several items. An overview of all ecosystem services which grasslands are expected to provide is presented in chapter 2. Comments on potential of grasslands to contribute to these services should complete the image of grasslands and their significance for human well-being. Chapter 5 presents several attempts to advance the analysis of trade-offs among ecosystem services. Ecosystem service trade-offs occur when the provision of one ecosystem service is reduced as a consequence of the increased use of another one. A comprehensive literature review was carried out in order to understand the effects of change in management scheme – e.g. among high nature value grasslands, intensive meadows, abandonment of management, grazing, turn to arable land etc. – on ecosystem services provision (see chapter 5.1). The effects of biological diversity on ecosystem services provision level could be seen from the comparison of management schemes that improves biodiversity to the measures which in turn causes decrease of biodiversity like conversion to arable land, fertilization, high cutting frequency etc. A failure in grassland management frequently results in grassland degradation. Therefore, habitat degradation is briefly described in connection with drivers of change of grassland ecosystem quality and distinguished into three categories of descending quality. Quantitative estimates of impact of degradation on the level of ecosystem services were derived from literature (chapter 5.2). Trade-offs among ecosystem services usually occurs in time and space. To be able to fully appreciate the effect of change in use or management of grasslands in future, the flow of grassland benefits was calculated across a long time period and expressed as a present value of ecosystem services. While well-informed decisions should be based on both benefits and costs, the calculation of net present value made use of data from 2 conservation programmes and took the costs of grassland maintenance and conservation into account as well (see chapter 5.3). Since mapping of ecosystem services has gained an increasing popularity as a tool for consideration of spatial trade-offs in past several years, a small mapping exercise is attached to this report in chapter 5.4 (the actual maps are presented in Annex II).

Survey on grassland ecosystem services 5
Broadening of geographical scope of this survey to other Central European countries was foreseen for this survey. A small workshop of representatives of Germany, Switzerland, Austria, Slovakia and the Czech Republic was held in order to get input with regards to both the methods of assessment and data available. By coincidence, there has been an assessment of grassland ecosystem services conducted in all of these countries while the focus on grasslands is rather rare in other European regions. All experiences and inputs which could improve this report in terms of methods and data were included. Furthermore, the conclusions of this report could be generalized to other countries to the extent to which they enjoy similar regional conditions in terms of nature, climate and grassland management. The habitat approach to ecosystem services assessment which builds on the EUNIS habitat classification makes the outcomes of this study relevant to the countries where the respective habitats are present. The same applies to the overview of trade-offs imposed by change of use of grassland habitat types/ecosystems
where the type of land use establishes the differentiating category. This report has been elaborated in the consortium of three institutions. Agency for Nature Conservation and Landscape Protection of the Czech Republic and Charles University Environment Center (CUEC) represent the team of the 2010 pilot study. CUEC have done the main part of job on the chapters 2, 3, 5.2 and 5.3. Austrian Umweltbundesamt (UBA) joined the team in spring 2011 and offered contribution consisting of literature review of ecosystem services trade-offs (chapter 5.1). As the different parts of the report were elaborated paralelly but separately, the overall synthesis of contributions of all partners was not possible to complete due to time restraints. Therefore, each chapter has its own brief introduction as well as conclusions. As the UBA team provided really comprehensive and in-depth review, only a condensed summary was included in the main report. Most of the interesting details – often intriguing – are presented in Annex I to this report.
6 Survey on grassland ecosystem services
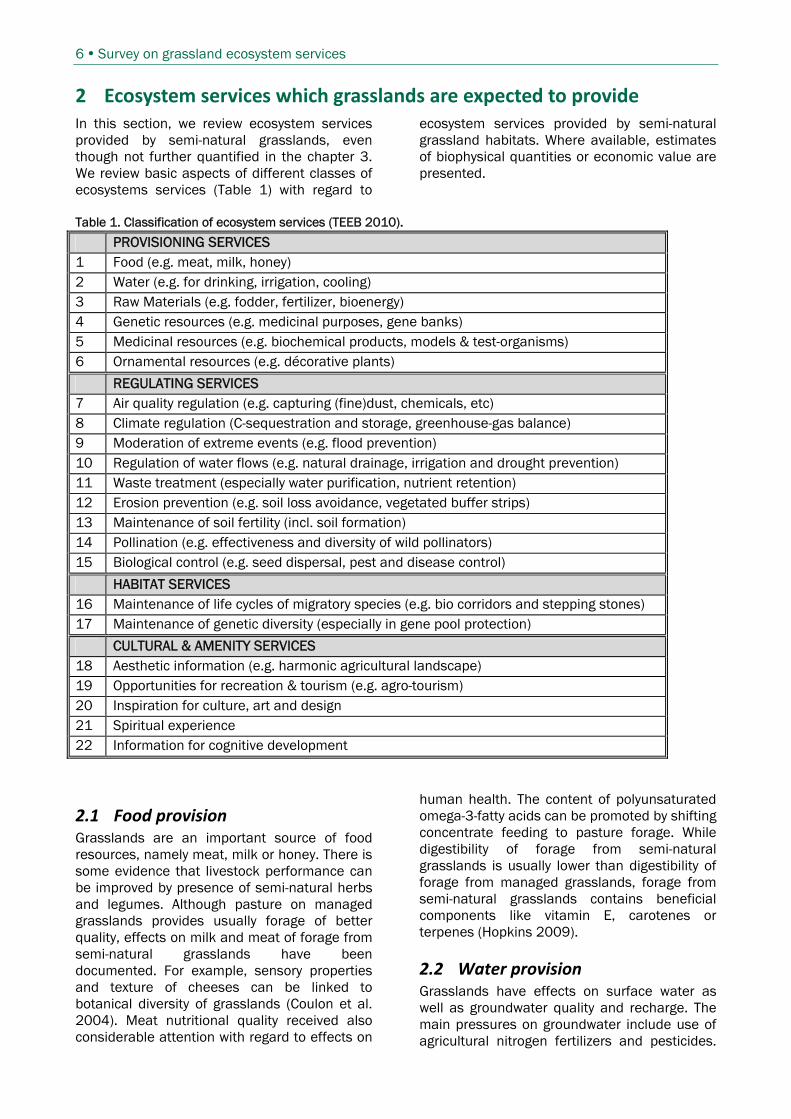
2 Ecosystem services which grasslands are expected to provide In this section, we review ecosystem services provided by semi-natural grasslands, even though not further quantified in the chapter 3. We review basic aspects of different classes of ecosystems services (Table 1) with regard to
ecosystem services provided by semi-natural grassland habitats. Where available, estimates of biophysical quantities or economic value are presented.
Table 1. Classification of ecosystem services (TEEB 2010).
PROVISIONING SERVICES 1 Food (e.g. meat, milk, honey) 2 Water (e.g. for drinking, irrigation, cooling) 3 Raw Materials (e.g. fodder, fertilizer, bioenergy) 4 Genetic resources (e.g. medicinal purposes, gene banks) 5 Medicinal resources (e.g. biochemical products, models & test-organisms) 6 Ornamental resources (e.g. décorative plants)
REGULATING SERVICES 7 Air quality regulation (e.g. capturing (fine)dust, chemicals, etc) 8 Climate regulation (C-sequestration and storage, greenhouse-gas balance) 9 Moderation of extreme events (e.g. flood prevention) 10 Regulation of water flows (e.g. natural drainage, irrigation and drought prevention) 11 Waste treatment (especially water purification, nutrient retention) 12 Erosion prevention (e.g. soil loss avoidance, vegetated buffer strips) 13 Maintenance of soil fertility (incl. soil formation) 14 Pollination (e.g. effectiveness and diversity of wild pollinators) 15 Biological control (e.g. seed dispersal, pest and disease control)
HABITAT SERVICES 16 Maintenance of life cycles of migratory species (e.g. bio corridors and stepping stones) 17 Maintenance of genetic diversity (especially in gene pool protection)
CULTURAL & AMENITY SERVICES 18 Aesthetic information (e.g. harmonic agricultural landscape) 19 Opportunities for recreation & tourism (e.g. agro-tourism) 20 Inspiration for culture, art and design 21 Spiritual experience 22 Information for cognitive development
2.1 Food provision Grasslands are an important source of food resources, namely meat, milk or honey. There is some evidence that livestock performance can be improved by presence of semi-natural herbs and legumes. Although pasture on managed grasslands provides usually forage of better quality, effects on milk and meat of forage from semi-natural grasslands have been documented. For example, sensory properties and texture of cheeses can be linked to botanical diversity of grasslands (Coulon et al. 2004). Meat nutritional quality received also considerable attention with regard to effects on
human health. The content of polyunsaturated omega-3-fatty acids can be promoted by shifting concentrate feeding to pasture forage. While digestibility of forage from semi-natural grasslands is usually lower than digestibility of forage from managed grasslands, forage from semi-natural grasslands contains beneficial components like vitamin E, carotenes or terpenes (Hopkins 2009).
2.2 Water provision Grasslands have effects on surface water as well as groundwater quality and recharge. The main pressures on groundwater include use of agricultural nitrogen fertilizers and pesticides.

Survey on grassland ecosystem services 7
The natural levels of nitrates in groundwater are low, typically less than 10 mg L-1 NO3 (EEA 1999). Conversion of arable land to grasslands usually results in reductions of groundwater nitrate concentrations in shallow aquifers as the nitrogen outflow from permanent grasslands, even fertilized, is 10 times lower than from arable land (Jankowska-Huflejt 2006).
2.3 Raw materials Semi-natural grasslands provide forage, fibres and increasingly is also recognized their potential to provide bioenergy. Concerning forage quantity, several studies have provided the evidence that species-rich grasslands achieve higher biomass and hence hay yields (Hooper et al. 2005, Bullock et al. 2007). Harrison et al. (2010) identified provision of fibres among one of the key contribution of semi-natural grasslands and agro-ecosystems in general. Bioenergy provision by combustion of biomass from semi-natural grasslands is an alternative use of grasslands (Tonn et al. 2010). Bioenergy from semi-natural grasslands is not usually associated with negative environmental impacts such as greenhouse gas emissions or land use change induced by bioenergy crops on arable land. The biomass harvested from grasslands is usually used for biogas generation by anaerobic fermentation. Probably the more suitable option for mature herbaceous biomass from semi-natural grasslands is the combustion as the combustion technology has been successfully adapted to the particular physical properties of herbaceous biofuels (Tonn et al. 2010). However, herbaceous biofuels contain more ash and nitrogen than wood fuels and therefore their combustion contributes to air pollution.
2.4 Genetic resource Semi-natural grasslands cover probably the most diverse habitats in Europe and therefore are extensive repositories of biodiversity and genetic materials. Semi-natural grasslands in Europe contain and exceptional diversity of plants, insects (e.g. butterflies), birds or fungi. Plant populations in European semi-natural grasslands exhibit a strong pattern of genetic differentiation and erosion (Picó and van Groenendael 2007). Genetic diversity is generally negatively related to fragmentation of grasslands and current human population density (Helm et al. 2009).
2.5 Medicinal resources Semi-natural grasslands have been traditionally sources of medicinal plants and other medicinal resources. Pharmaceutical use of medicinal and aromatic plants (MAPs) is connected with the content of active substances such as oil or tannins (Dušek et al. 2010). Semi-natural grasslands are significant source of many medicinal plants, such as Common St. John´s wort (Hypericum perforatum), Common agrimony (Agrimonia eupatoria), Meadow Clary (Salvinaria pratensis) or Ribwort plantain (Plantago lanceolata). Medicinal plants collected on semi-natural grasslands are valuable for traditional medicines or are commercially utilized for the production of teas, oils and other medicines.
2.6 Ornamental resources The information on the use of grassland species as ornamental resources is insufficient. However, meadow or alpine flowers have been always used for decoration and ornamental purposes.
2.7 Air quality regulation The role of grasslands in air quality regulation services rests in avoided emissions of gases rather than direct effects on air quality. Grasslands can be an important source of CH4 and N2O which are associated with livestock and grassland management.
2.8 Climate change regulation Climate change regulation service is usually approached by an amount of carbon sequestered in an ecosystem. Carbon stored in ecosystems is an important indicator of regulation services potential which is directly related to land use disturbances and land management practices. There is growing evidence that temperate grasslands can sequester relatively large amounts of carbon. Carbon sequestered in temperate grasslands is related to net primary production (NPP) as a rate of C supply into soil. On the other hand, carbon is emitted from grassland by heterotrophic respiration, fires, and also changes in soil C pools induced by soil erosion or water drainage.
2.9 Moderation of extreme events Semi-natural grasslands have the capacity to moderate extreme events like floods or landslides. Especially alluvial meadows can

8 Survey on grassland ecosystem services
.
serve as washlands for floods. Semi-natural meadows reduce runoff extremes by maintaining sufficient recharge of groundwater.
2.10 Water flow regulation Ecosystem service of water regulation can be defined as influence ecosystems have on the timing and magnitude of water runoff, flooding, and aquifer recharge, particularly in terms of the water storage potential of the ecosystem (WRI 2008). Water infiltration was suggested to depend on soil type, soil texture, soil structure, earthworm burrow numbers, earthworm species, stable organic matter and initial soil water content. Grasslands can reduce water runoff by 20 % in comparison with cropland and by 50 % in comparison with urban areas. Therefore, semi-natural grasslands complement wetlands and forests with regard to buffering water flows and ameliorating water stress by increasing landscape water holding capacity.
2.11 Waste regulation Semi-natural grasslands relatively effectively decompose waste such are nitrogen compounds due to high biological activity. Semi-natural grasslands and their biodiversity are threatened by increasing applications of nitrogen fertilizers but also by atmospheric deposition of nitrogen (Phoenix et al. 2003). Biomass produced by grassland vegetation removes a portion of nitrogen and other biogenic nutrients. Soil microbial activity transforms ammonium (NH4+) and nitrate (NO3−) into N2O and contributes to the removal of nitrogen from soils by denitrification
2.12 Erosion regulation Grassland cover prevents soil loss due to water and air erosion. Soil erosion is a main factor contributing to the degradation of agricultural land and soil erosion imposes additional costs downstream in water reservoirs and settlements. Tolerable erosion rate or soil loss tolerance (T) is a related concept that limits the amount of erosion, which is still acceptable and potentially does not threaten the ecological production. Soil erosion tolerance can be defined as a rate of soil erosion that is balanced by soil production and allows economical sustainability of crop production (Verheijen et al. 2009). Erosion costs can be differentiated according to the location of impacts. On-site costs of erosion include loss of productivity, water and nutrients (Pimentel et al. 1995). Dominating off-site damage is the
deposition of soil particles in water systems, which further reduces their ability to provide clean water, waste treatment, flood control or recreation bathing services.
2.13 Maintenance of soil fertility A fertile soil can be defined as providing essential nutrients for crop plant growth, supporting a diverse and active biotic community, exhibiting a typical soil structure, and allowing for an undisturbed decomposition (Maeder et al. 2002). One of the most important parameters determined also by soil biodiversity is soil organic matter (SOM) (van Eekeren et al. 2010) which enhances also the performance of several other ecosystem services like carbon sequestration and water flow regulation. Soil organic carbon under grasslands is usually greater than under other land uses, especially cropland. For example, an average difference in soil organic carbon (SOC) between grassland and cropland was 16.3 Mg C ha-1 (Franzluebbers 2009).
2.14 Pollination While pollination is in an agricultural European landscape maintained predominantly by bees (Apis mellifera), several crops and trees are dependent on pollination by wild pollinator species. Pollination service intensity (flower-visitor richness, visitation rate, and fruit set) decreases with distance from natural areas (Garibaldi et al. 2011). Visitation rate and diversity of pollinators generally exponentially decline with the distance from natural or semi-natural habitats (Ricketts et al. 2008). Grasslands provide an important habitat for several wild pollinator species, such as hoverflies, bumblebees or feral bees. Decline of natural pollination diversity and intensity can be reflected by decreasing yields of agricultural crops, as was documented for example for oilseed rape (Jauker et al. 2011).
2.15 Pest control Arthropod predators and parasitoids suppress populations of herbivorous crop pests, providing biocontrol services (Landis et al. 2008). Grasslands mediate the biological control of pests and grassland specialist birds are important for biological control. Grasslands with intermediate levels of forb cover and flower diversity supported two-orders of magnitude more natural enemy biomass, fourfold more natural enemy families, and threefold greater rates of egg predation than corn agricultural

Survey on grassland ecosystem services 9
field (Werling et al. 2011). Equivalently to pollination, pest control service, i.e. diversity of predators and parasitoids controls populations of pests and results in increased crop yields. As a subcategory of pest regulation service, regulation of invasive species is sometimes included under biocontrol service. DiTomaso (2000) estimated a total cost caused by invasive species on rangeland to reach 2 billion USD, that is 5 USD per hectare of pasture land. Xu et al. (2006) estimated indirect economic losses by invasive species to grassland ecosystem services (i.e. indirect economic losses) to be 317 mil. USD (2000 data). This translates approximately into 0.8–0.9 USD per hectare. Therefore, economic costs incurred by
invasive species range between 0.75–4.5 EUR per hectare of grassland.
2.16 Cultural and amenity services Grasslands play important roles in recreation and human aesthetics. Many outdoor activities, such as bird-watching, hunting, walking and general enjoyment of nature, are linked to open landscapes and extended views. Meadows and pastures as a component of agricultural landscape play a role in aesthetic enjoyment of landscape and social cohesion of rural areas. People usually prefer diversified agricultural landscape where semi-natural grasslands from a significant component what is reflected also by an economic value of semi-natural grasslands (Marzetti et al. 2011).
10 Survey on grassland ecosystem services
3 Quantification of ecosystem services of semi‐natural grasslands The aim of this section is to summarize and further develop indicators and values of grassland ecosystem services treated by the pilot study last year (Vačkář et al. 2010). Main focus is on the services of livestock provision, carbon sequestration, soil erosion regulation, water flow regulation, nitrogen, invasion resistance and recreation. These services have been found to contribute extensively to the benefits provided by grasslands and are relatively well documented and quantifiable. We reviewed additional data sources for biophysical assessment as well as monetary valuation of selected grassland ecosystem services. The goal is to complete assessment of all these services by calculating both biophysical quantity and economic value of each service. The ecosystem accounting of grassland ecosystem services in this study is based on a habitat ecosystem accounting approach and value/benefit transfers. While grassland ecosystem services are usually accounted as a single ecosystem category, habitat accounting enables differentiation within an ecosystem category and enables more detailed classification of ecosystem services flowing from habitats with different characteristics. For example, bundles of services derived from alpine grasslands will be different from services of alluvial and wet meadows. The limiting factor in habitat based ecosystem accounting is usually data availability. This pilot study differentiate between 8 broader categories of semi-natural grasslands and managed pasture and meadows as an additional category which dominates grassland area in majority of European countries but provides also important ecosystem services despite the more pronounced human influence. In this section, we start with a review of grassland ecosystem assessments, develop a general framework for habitat approach to ecosystem assessment and continue with characteristics of particular grassland ecosystem services which have been addressed in a pilot study. Final chapter (3.3.8) summarizes value of ecosystem services provided by grassland habitats in the Czech Republic.
3.1 Grassland ecosystem assessments
Several initiatives and studies following approaches to ecosystem services assessment and valuation (Costanza et al. 1997, MA 2005) has been attempting to express benefits provided by different regions or ecosystems to society. These include for example valuation of boreal forest natural capital and ecosystem services (Anielski and Wilson 2009) or valuation of wetland ecosystem services (Brander et al. 2008, Turner et al. 2008). Although we did not find any study, which would comprehensively quantify grassland ecosystem services, the value of grassland ecosystems has been already addresses and assessed by several studies. For instance, Heidenreich (2009) reviewed current research on total economic value of temperate grasslands. Wilson (2009) reviewed and assessed values of grassland ecosystem services in British Columbia. The role of ecosystem services indicators was recognized as one of the key components of grassland ecosystem services assessments (Maczko and Hidinger 2008). Recently, UK National Ecosystem Assessment covered also semi-natural grasslands as an important source of ecosystem services (Bullock et al. 2011). Current evidence from assessments outlined above suggests that ecosystem services from semi-natural grasslands has either declined or show a mixed trend because the number and size of semi-natural grasslands have dramatically declined in Europe (Harrison et al. 2010). This decline is related to abandonment of traditional small-scale farming during the last century, as well as to the agricultural improvement, resulting in the conversion of some semi-natural grassland to either cultivated arable land, permanent pastures or improved hayfields (Willems 2001; Wallis DeVries et al. 2002; Poschlod et al. 2005). Semi-natural grasslands are often associated with High Nature Value (HNV) farmland areas. HNV areas are also characterised by land use mosaic containing shrubland, hedgerows, orchards or woodland. However, several types of semi-natural grasslands (for example, alluvial or wet meadows) can be relatively intensively used.

Survey on grassland ecosystem services 11
3.2 Habitat approach to ecosystem assessment
In a pilot study (Vačkář et al. 2010), we applied a habitat approach to ecosystem accounting which is based on a classification of habitat types. Grassland habitat types are regarded as ecosystem assets which provide vital ecosystem services. We defined grassland ecosystems as habitats dominated by grasses, herbs and sedges. We identified broader grassland natural habitat type categories, spanning the continuum from wetlands to rock succulents. Habitat Mapping Programme coordinated by the
Agency for Nature Conservation and Landscape Protection of the Czech Republic consistently mapped the area and quality of natural grassland habitats. Natural grassland habitats cover nearly 3,000 km2 which is about 4 % of the total territory of the Czech Republic. Permanent pastures and meadows cover 11.7 % of total land area and 22.5 % of utilized agricultural area of the Czech Republic. We combined Classification of habitat types of the Czech Republic with EUNIS and Corine Land Cover classification to delineate 8 semi-natural grassland habitat categories (Table 2).
Table 2. Grassland habitat categories identified in the Czech Republic. Code Category Area (ha) Semi-natural grassland habitat categories DG Dry grasslands 7 604 AM Alluvial meadows 16 005 MG Mesic grasslands 38 661 WG Seasonally wet and wet grasslands 202 907 AG Alpine and subalpine grasslands 5 259 FF Forest fringe vegetation 406 SM Salt marshes 99 HT Heathlands 530 Total grassland in the Czech Republic SG Semi-natural grasslands 271 475 P Pastures and managed grasslands 702 162 Grasslands total 973 633 Different approaches to ecosystem accounting reflect the problem of the delineation of the basic accounting units (Luck et al. 2003, Kremen 2005). The prevailing approach to ecosystem services accounting conceptually converge to the notion that ecosystem services should be expressed as quantities weighted by their value to a society, i.e. price. The general habitat-based ecosystem accounting framework is devised from current concepts on ecosystem services assessment and valuation (Table 3). The ecosystem asset, or biophysical structure supporting the functioning of ecosystems, or service providing unit is in this case particular habitat type. Habitat type provides biophysical
quantities of services which are described by biophysical indicators, e.g. tons of carbon sequestered, cubic meters of water infiltrated or number of invasive species prevented to be established in a habitat. Biophysical service flows then provide valuable benefits to human society, which are usually expressed as an economic value of particular habitat type. Habitat approach to ecosystem service assessment allows differentiation within a broader ecosystem category, i.e. grassland. However, due to data limitations it is sometimes difficult to assign different intensities to different habitats. Therefore, reasonable level of aggregation is required.
Table 3. General accounting structure of ecosystem services flows and values originating from ecosystem assets, in this case grassland habitat types.
Ecosystem asset Biophysical service quantity Economic value
Grassland habitat area (ha) Biophysical indicator (Mg/ha, m3/ha, No. of species)
Monetary value/price (EUR/ha)
12 Survey on grassland ecosystem services
3.3 Assessment of ecosystem services provided by grasslands habitats
Quantification and valuation of ecosystem services is considered to be a prerequisite for mainstreaming ecosystem services into conservation planning and decision-making. In this section we analyze ecosystem services provided by grassland habitats in the Czech Republic. The basic approach is based on a review of ecosystem functions and services quantified in grassland habitats and benefit transfer of economic values specific for grassland ecosystems. We attempted to quantify both biophysical indicators and economic values associated with particular grassland habitats.
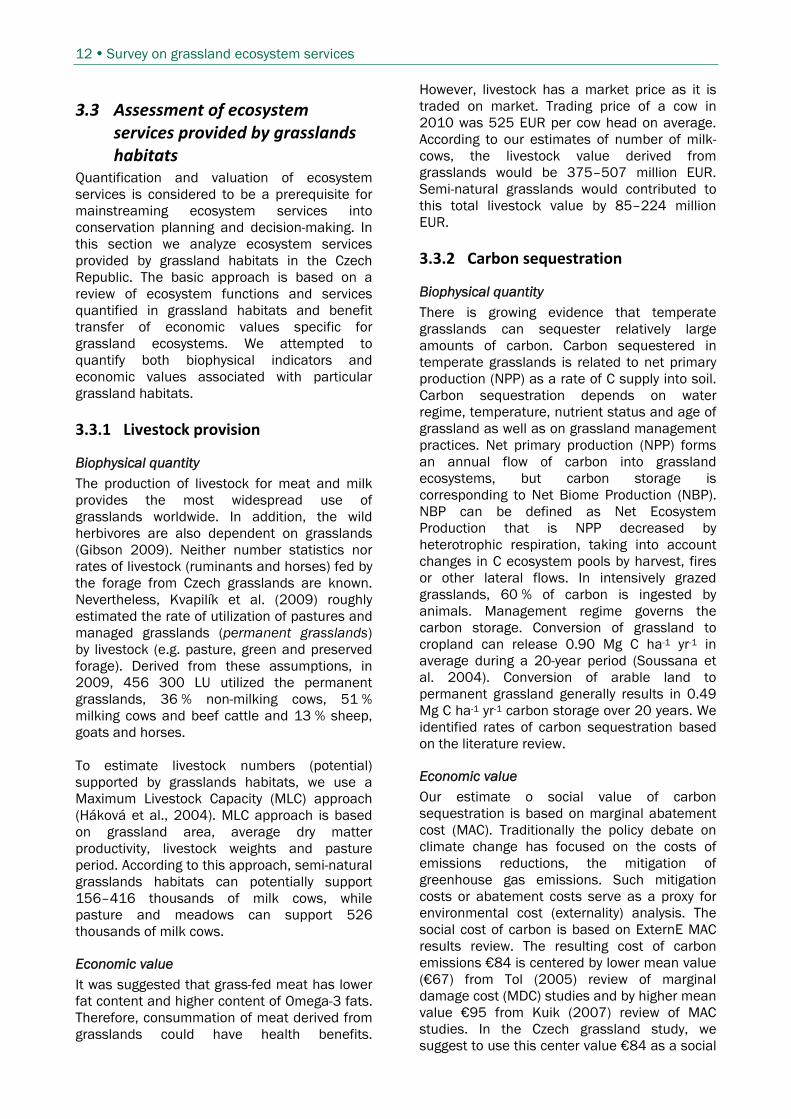
3.3.1 Livestock provision
Biophysical quantity The production of livestock for meat and milk provides the most widespread use of grasslands worldwide. In addition, the wild herbivores are also dependent on grasslands (Gibson 2009). Neither number statistics nor rates of livestock (ruminants and horses) fed by the forage from Czech grasslands are known. Nevertheless, Kvapilík et al. (2009) roughly estimated the rate of utilization of pastures and managed grasslands (permanent grasslands) by livestock (e.g. pasture, green and preserved forage). Derived from these assumptions, in 2009, 456 300 LU utilized the permanent grasslands, 36 % non-milking cows, 51 % milking cows and beef cattle and 13 % sheep, goats and horses. To estimate livestock numbers (potential) supported by grasslands habitats, we use a Maximum Livestock Capacity (MLC) approach (Háková et al., 2004). MLC approach is based on grassland area, average dry matter productivity, livestock weights and pasture period. According to this approach, semi-natural grasslands habitats can potentially support 156–416 thousands of milk cows, while pasture and meadows can support 526 thousands of milk cows.
Economic value It was suggested that grass-fed meat has lower fat content and higher content of Omega-3 fats. Therefore, consummation of meat derived from grasslands could have health benefits.
However, livestock has a market price as it is traded on market. Trading price of a cow in 2010 was 525 EUR per cow head on average. According to our estimates of number of milk-cows, the livestock value derived from grasslands would be 375–507 million EUR. Semi-natural grasslands would contributed to this total livestock value by 85–224 million EUR.
3.3.2 Carbon sequestration
Biophysical quantity There is growing evidence that temperate grasslands can sequester relatively large amounts of carbon. Carbon sequestered in temperate grasslands is related to net primary production (NPP) as a rate of C supply into soil. Carbon sequestration depends on water regime, temperature, nutrient status and age of grassland as well as on grassland management practices. Net primary production (NPP) forms an annual flow of carbon into grassland ecosystems, but carbon storage is corresponding to Net Biome Production (NBP). NBP can be defined as Net Ecosystem Production that is NPP decreased by heterotrophic respiration, taking into account changes in C ecosystem pools by harvest, fires or other lateral flows. In intensively grazed grasslands, 60 % of carbon is ingested by animals. Management regime governs the carbon storage. Conversion of grassland to cropland can release 0.90 Mg C ha-1 yr-1 in average during a 20-year period (Soussana et al. 2004). Conversion of arable land to permanent grassland generally results in 0.49 Mg C ha-1 yr-1 carbon storage over 20 years. We identified rates of carbon sequestration based on the literature review.
Economic value Our estimate o social value of carbon sequestration is based on marginal abatement cost (MAC). Traditionally the policy debate on climate change has focused on the costs of emissions reductions, the mitigation of greenhouse gas emissions. Such mitigation costs or abatement costs serve as a proxy for environmental cost (externality) analysis. The social cost of carbon is based on ExternE MAC results review. The resulting cost of carbon emissions €84 is centered by lower mean value (€67) from Tol (2005) review of marginal damage cost (MDC) studies and by higher mean value €95 from Kuik (2007) review of MAC studies. In the Czech grassland study, we suggest to use this center value €84 as a social

Survey on grassland ecosystem services 13
value for 1 ton carbon sequestrated by grassland. The other values of carbon reported in this review could serve as inputs for sensitivity analysis of the results.
3.3.3 Erosion regulation
Biophysical quantity Grassland cover contributes to soil conservation and prevents soil loss due to water and air erosion. Therefore, estimation of value of grassland habitats in soil loss prevention is based on a comparison to the alternative cropland use of land. In Europe, 0.3–1.4 Mg ha-
1 yr-1 of soil loss is recommended as sustainability limit of tolerable erosion rate, which reflect the rate of soil formation depending on natural conditions. Soil erosion tolerance can be defined as a rate of soil erosion that is balanced by soil production and allows economical sustainability of crop production (Verheijen et al. 2009). Actual rates of soil erosion in Europe on arable land have been detected in the range 3–40 Mg ha-1 yr-1 (Verheijen et al. 2009). According to Cerdan et al. (2010), the mean erosion rate in Europe is 1.2 Mg ha-1 yr-1 and in the Czech Republic 2.6 Mg ha-1 yr-1. Bazzoffi (2009) considers soil erosion tolerance for natural grasslands of 0.5 Mg ha-1 yr-1 and 0.8 Mg ha-1 yr-1 for permanent grasslands. Therefore, even if considering the most conservative limit of average actual erosion rate 3 Mg ha-1 yr-1, grassland save 2.2–2.5 Mg ha-1 yr-1 of soil.
Economic value Erosion costs can be differentiated according to the location of impacts. On-site costs of erosion include loss of productivity, water and nutrients (Pimentel et al. 1995). Dominating off-site damage is the deposition of soil particles in water systems, which further reduces their ability to provide clean water, waste treatment, flood control or recreation bathing services. Křůmalová et al. (2000) evaluated costs of erosion on agricultural land in the Czech Republic based on costs to dredge sediments from waterways. They estimate annual benefits of grass cover in reducing erosion at 4,512 CZK per hectare of land (265 EUR ha-1 in 2010).
3.3.4 Water flow regulation
Biophysical quantity Runoff coefficients describe the ratio between runoff and rainfall and enable to express capacity of soil retain water and reduce runoff
(Bazzoffi 2009). Runoff coefficient is a percentage of rainfall transformed to runoff. Leitinger et al. (2010) found a mean surface runoff coefficient of 0.01 on abandoned areas and 0.18 on pastures in mountain grassland ecosystems. Croplands usually reach runoff coefficients of 0.4-0.6 while pastures 0.02–0.3. Natural ecosystems and forests usually reach runoff coefficient values of 0.1 and lower. However, the runoff from grasslands is seasonal. As illustrated in runoff coefficients for different land uses, grasslands reduce runoff by 20 % in comparison with cropland and by 50 % in comparison with urban areas. Equivalent approach is based on a surface runoff using the SCS curve number equation (Chanasyk et al. 2003). We estimated runoff curve numbers (i.e. CN curves) for a habitats based on their soil and water infiltration characteristics.
Economic value Based on a replacement cost method, the average cost of artificial water retention of 1m3 of water has been estimated at 16.5 EUR (Pithart et al. 2008).
3.3.5 Invasion regulation
Biophysical quantity Resistance to invasive species can be regarded as a component of disease and pest control regulation service of ecosystems (EASAC 2009). Generally, human dominated lowland habitats with high levels of land transformation are most invaded while nutrient limited montane habitats are less invaded (Chytrý et al. 2008). Alpine and subalpine grasslands have therefore low level of invasion and invasibility. Mown and grazed grasslands have intermediate levels of invasion but still relatively low invasibility. Evidence suggests that some grasslands habitats are effective barrier to invasions (i.e. are more resistant to invasion). For instance, semi-natural perennial grasslands (dry, wet and saline) or forest fringes have low levels of invasion despite relatively high invasion pressure (Chytrý et al. 2008). Low invasibility of semi-natural grasslands can be at least partially explained also by relatively high levels of biodiversity which buffers introduction of invasive species by rapid recovery after disturbance. For example, species richness in Czech nature reserves is highest in dry and humid grasslands (Pyšek et al. 2002). We used data reported by Chytrý and Pyšek (2008) and Chytrý et al. (2008) to estimate level of invasion and invasibility of grassland

14 Survey on grassland ecosystem services
habitats. These data are based on more than 20,000 vegetation samples from 32 habitats in the Czech Republic (Chytrý et al. 2008). Level of invasion can be used as a physical indicator for calculating the potential cost of alien species suppression while invasibility can refer to a benefit of invasion barrier and resistance and hence the prevention of invasion by alien species.
Economic value The economic assessment of invasion regulation services of grassland habitats has proceeded from a pricing technique rather than from valuation technique because of lack the empirical evidence in this field. We rely on data from actual costs of maintaining / preventing environmental degradation of grasslands as a proxy for economic value. This approach is more about “cost-effectiveness” approach where a
predetermined objective regarding the environmental quality of natural grasslands is set and then the most cost effective means of achieving this goal are selected (OECD, 2004). In this study, we demonstrate this approach on the invasion regulation of the Giant Hogweed (Heracleum mantegazzianum). The data comes from the database of Landscape management programme operated by the Czech Agency for Nature Conservation and Landscape Protection. The maintenance expenditures on the invasion regulation of GH are observed from the time period 2008-2010. Table 4 presents the average expenditures per hectare and grassland habitat type for invasive regulation measurements realized in the examined period. Number of measurements (N) for each grassland habitat type and year are also reported.
Table 4. Average expenditures in EUR per hectare and grassland type for invasion regulation (values are in 2010 prices)
Code 2008 2009 2010 EUR/ha N EUR/ha N EUR/ha N AM 9,34 1 9,73 1 9,80 1 MG 44,28 26 68,71 27 52,00 26
WG 25,51 73 26,73 75 20,41 72 AG 43,12 1 36,63 1 157,45 2 Source: Landscape management programme, AOPK
3.3.6 Waste treatment
Biophysical quantity Semi-natural grasslands contribute to the removal of nitrogen from soils and therefore prevent nitrogen leaching into groundwater. Wet and alluvial grasslands can remove 0.5–2.4 kg N ha-1 day-1 by a denitrification process. Moreover, nitrogen is removed with biomass, where nitrogen content can reach 0.16–0.30 t ha-1. Denitrification and nitrogen sink in biomass reduces the pollution load for drinking water.
Economic value Rybanič et al. (1999) used the substitute market approach for an estimation of nitrogen abatement value. The value of nitrogen removal is expressed in monetary terms as the operational clean-up cost for the same amount of nitrogen in conventional wastewater treatment plant with the biological elimination of nitrogen. The value of nitrogen sink is estimated at 161.9 EUR per hectare in 2010
prices. For example in the Morava river floodplain, the nitrogen abatement makes significant part of Total Economic Value (Rybanič et al. 1999).
3.3.7 Recreation and aesthetics
Biophysical quantity Grasslands play important roles in recreation and human aesthetics. Many outdoor activities, such as bird-watching, hunting, walking and general enjoyment of nature, are linked to open landscapes and extended views. Moreover, grasslands could utilize the provision of human aesthetics, i.e. making residential areas more semi-natural. Parks in settlements and grasslands around community houses, directly determine the general impressions of humans. The biophysical quantity indicator of recreation could be used for example a number of visitors attracted by grassland habitats annually. However, no such information is available at the national level.
Survey on grassland ecosystem services 15
Economic value Estimates of recreational and aesthetic values are based on a contingent valuation (CVM) study by Křůmalová et al. (2000). Agricultural mosaic with a significant coverage of grassland (meadow) habitats had been identified as a harmonic agricultural landscape. The study determined the willingness-to-pay for further maintenance of the Czech landscape, including biodiversity-rich meadows. The environmental change, for which people expressed their willingness-to-pay (WTP), was defined as potential improvement of landscape (higher proportion of valuable habitats, minimum abandoned land). The derived average WTP was 492 CZK per year and 620 CZK for the whole sample and for the respondents that were ready to pay the positive amount, respectively. The final amount for the whole Czech population (7.9 mil inhabitants that are potentially able to contribute) was derived on 3.9 bil. CZK and 4.9 bil. CZK respectively. If we assume that there is 4.28 mil. ha of agricultural land in CR, we get 1,144 CZK per ha based on real WTP estimates (i.e. 620 CZK). Recalculated to EUR of 2010, we obtain €55.45 per ha and year.
Based on the results of reviewed study, we use the value €54.10/ha/year as a central estimate for the Czech case that could serve as proxy value for recreational and aesthetical benefits provided by grasslands. For further investigation of this type of benefits, we recommend to realize a primary valuation study based on stated preferences (e.g. choice experiment) that could refine our calculations.
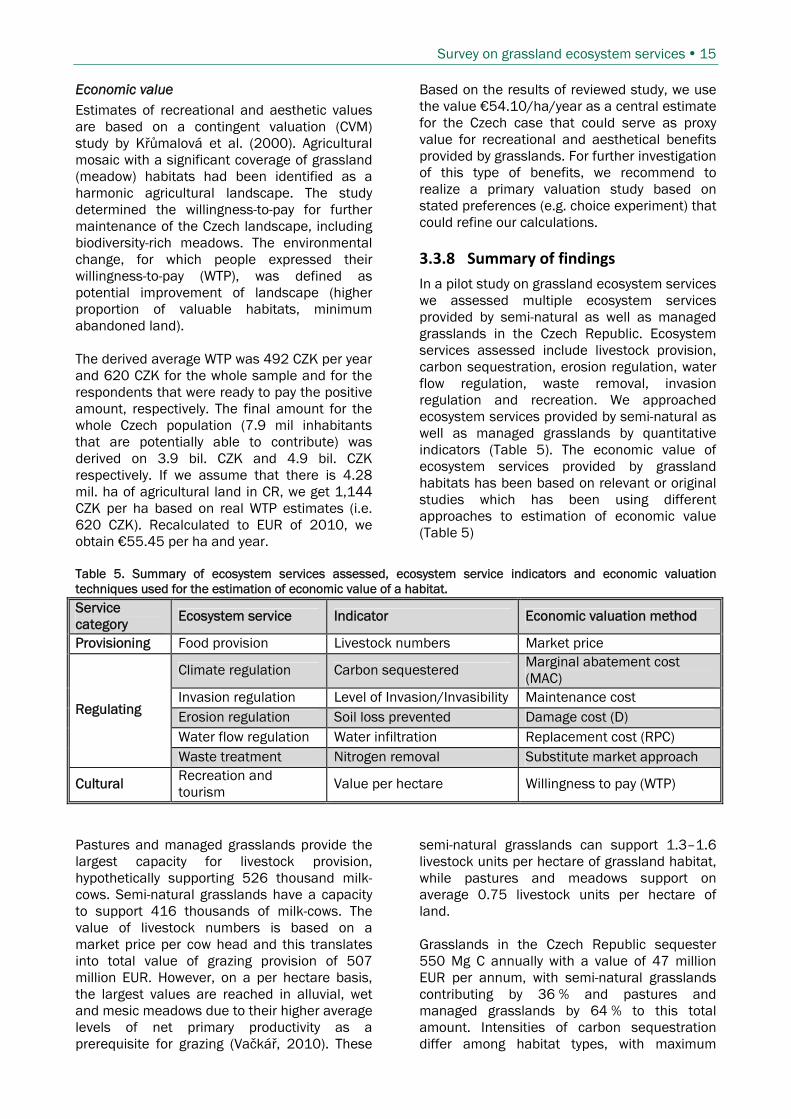
3.3.8 Summary of findings
In a pilot study on grassland ecosystem services we assessed multiple ecosystem services provided by semi-natural as well as managed grasslands in the Czech Republic. Ecosystem services assessed include livestock provision, carbon sequestration, erosion regulation, water flow regulation, waste removal, invasion regulation and recreation. We approached ecosystem services provided by semi-natural as well as managed grasslands by quantitative indicators (Table 5). The economic value of ecosystem services provided by grassland habitats has been based on relevant or original studies which has been using different approaches to estimation of economic value (Table 5)
Table 5. Summary of ecosystem services assessed, ecosystem service indicators and economic valuation techniques used for the estimation of economic value of a habitat. Service category Ecosystem service Indicator Economic valuation method
Provisioning Food provision Livestock numbers Market price
Climate regulation Carbon sequestered Marginal abatement cost (MAC)
Invasion regulation Level of Invasion/Invasibility Maintenance cost Erosion regulation Soil loss prevented Damage cost (D) Water flow regulation Water infiltration Replacement cost (RPC)
Regulating
Waste treatment Nitrogen removal Substitute market approach
Cultural Recreation and tourism Value per hectare Willingness to pay (WTP)
Pastures and managed grasslands provide the largest capacity for livestock provision, hypothetically supporting 526 thousand milk-cows. Semi-natural grasslands have a capacity to support 416 thousands of milk-cows. The value of livestock numbers is based on a market price per cow head and this translates into total value of grazing provision of 507 million EUR. However, on a per hectare basis, the largest values are reached in alluvial, wet and mesic meadows due to their higher average levels of net primary productivity as a prerequisite for grazing (Vačkář, 2010). These
semi-natural grasslands can support 1.3–1.6 livestock units per hectare of grassland habitat, while pastures and meadows support on average 0.75 livestock units per hectare of land. Grasslands in the Czech Republic sequester 550 Mg C annually with a value of 47 million EUR per annum, with semi-natural grasslands contributing by 36 % and pastures and managed grasslands by 64 % to this total amount. Intensities of carbon sequestration differ among habitat types, with maximum

16 Survey on grassland ecosystem services
values reached again in alluvial and wet meadows. High biophysical quantities translate also into high economic values of carbon sequestration. Equivalently to several other services, carbon sequestration is dependent on the disturbance regime, biodiversity and net primary productivity. The main role of grasslands in soil quality regulation is a prevention of soil erosion which is dramatically increasing with agricultural intensification. Soil erosion not only decreases a capacity of arable land to provide yields in the future but also brings costs downstream. Grasslands reduce soil erosion rates by 2.2–2.5 Mg ha-1 yr-1 in comparison with agricultural land. In total, grasslands save 2.1 million Mg of soil if compared with cropland erosion rates. The value of services of soil erosion regulation is estimated at 258 million EUR annually. Water runoff from grasslands with average annual rainfall typical for the Czech Republic (674 mm) based on runoff coefficients and CN curves typical for grasslands can reach 557 million cubic meters. Considerable fraction of water is infiltrated on grasslands and contributes to regulation of floods or droughts. In total, grassland water regulation service amounts to nearly 98 million cubic meters of water absorbed by grasslands. The value of this service based on an estimate of artificial water retention is 1.6 billion of EUR. Water regulation is thus the ecosystem services with largest value, probably due to relatively large costs of artificial water retention.
Grasslands regulate also water quality due to dense root systems and nutrient filtration. We included the service of nitrogen removal as the excessive amounts of nitrogen are considered to e a problem of global extent. Alluvial, wet and mesic grasslands remove 61.7 Mg N annually, with a value of 35.5 million EUR. Semi-natural grasslands with conserved numbers of original species can serve as a barrier to invasion. Invasion regulation function is a combination of low proportion of invasive species in a habitat and low invasibility of a habitat. Semi-natural grasslands (dry, wet and saline) or forest fringes have low levels of invasion despite relatively high invasion pressure. The total value of invasion regulation based on available data reach 7.1 million EUR. Highest value of ecosystem services is reached in seasonally wet and wet grasslands, followed by alluvial meadows. Both habitat types provide service values more than 4,000 EUR per hectare (Fig. 1). These habitats are followed by mesic grasslands which still provide multiple ecosystem values. Forest fringe vegetation, alpine and subalpine grasslands and dry grasslands provide comparable benefits in the range 2,585–3,119 EUR per hectare of habitat. Pastures and managed meadows provide relatively low economic values compared with semi-natural grasslands. Only heathlands were found to provide lower economic values per habitat area. The dominant component of ecosystem services is water flow regulation, followed by livestock provision and erosion regulation.
Figure 1. Economic value of ecosystem services per area of grassland habitat. Units are EUR in 2010 prices per ha per year.
0
500
1 000
1 500
2 000
2 500
3 000
3 500
4 000
4 500
EU
R/h
a p
er
ye
ar
Seasonallyw et and
w etgrasslands
Alluvialmeadow s
Mesicgrasslands
Forestfringe
vegetation
Alpine andsubalpine
grasslands
Drygrasslands
Saltmarshes
Pasturesand
managedgrasslands
Heathlands
Invasion regulation
Recreation
Waste treatment
Carbon sequestration
Erosion regulation
Max livestock numbers
Water regulation

Survey on grassland ecosystem services 17
Table 6. Summary of biophysical indicator assessment of grassland ecosystem assessment. Code Category Max livestock
number [LU/ha] Carbon sequestration [Mg C ha-1 yr-1]
Erosion regulation [Mg/ha]
Water regulation [m3/ha]
Level of invasion
Nitrogen removal [Mg/ha]
DG Dry grasslands 0,69 0,20 2,20 111,00 intermediate NA AM Alluvial meadows 1,61 0,80 2,20 180,00 intermediate 0,3 MG Mesic grasslands 1,29 0,50 2,20 120,00 intermediate 0,16 WG Seasonally wet and wet grasslands 1,64 0,80 2,20 180,00 intermediate 0,25 AG Alpine and subalpine grasslands 0,47 0,45 2,20 125,00 low NA FF Forest fringe vegetation NA 0,50 2,20 163,00 intermediate NA SM Salt marshes NA 0,40 2,20 111,00 intermediate NA HT Heathlands NA 0,30 2,20 97,00 low NA P Pastures and managed grasslands 0,75 0,50 2,20 75,00 intermediate NA

18 Survey on grassland ecosystem services
Table 7. Summary of calculated monetary values of selected grassland ecosystem services. Code Category Max livestock
number [EUR/ha]
Carbon sequestrati- on [EUR/ha]
Erosion regulation [EUR/ha]
Water regulation [EUR/ha]
Invasion regulation [EUR/ha]
Nitrogen removal [EUR/ha]
Recreation [EUR/ha]
Sum of values [EUR/ha]
DG Dry grasslands 370,72 17,22 265,48 1 875,90 55,45 2 584,76 AM Alluvial meadows 864,09 68,88 265,48 3 042,00 9,80 161,95 55,45 4 467,64 MG Mesic grasslands 695,39 43,05 265,48 2 028,00 52,00 161,95 55,45 3 301,27
WG Seasonally wet and wet grasslands
883,55 68,88 265,48 3 042,00 20,41 161,95 55,45 4 497,71
AG Alpine and subalpine grasslands
252,83 38,75 265,48 2 113,00 157,45 55,45 2 882,45
FF Forest fringe vegetation 0,00 43,05 265,48 2 755,00 55,45 3 118,67
SM Salt marshes 0,00 34,44 265,48 1 875,90 55,45 2 231,27 HT Heathlands 0,00 25,83 265,48 1 639,00 55,45 1 986,05
P Pastures and managed grasslands
403,71 43,05 265,48 1 298,00 55,45 2 035,19
Average 385,59 42,57 265,48 1 706,88 26,63 53,98 55,45 2 647,96

Survey on grassland ecosystem services 19
4 Significance of grasslands for biodiversity of the Czech Republic Czech Republic is situated in the zone of deciduous forest, which would cover a large portion of our territory, without a human impact to nature (Kubíková, 2005). The species composition of these forests would be limited, probably with a strong predominance of competitively strong beech. The cause of the present vegetation diversity is a man, and also due to man and his activities a large part of our grasslands has been created (Chytrý, 2007). The anthropogenic origin of grasslands is what makes them different from other natural habitats. Most plant species of pastures and meadows are native in the area of Czech Republic, however, before the arrival of man, these species had been found only rarely in light woods or open areas maintained by large-herbivores grazing (Vera, 2000). The look of today’s grasslands has undergone a dynamic development. First artificial pastures were created in the Neolithic, usually in the place of abandoned fields. However, even long after that, people preferred to graze cattle in the woods (Chytrý, 2007). Beginnings of first meadows are in the Bronze and the Iron Age, when the low-lying areas were deforested, and a development of metallurgy enabled the production of sickles (Mládek et al., 2006). Although the origins of grasslands are already in Neolithic, during their history in many grassland localities occurred a return of forest and then again its suppression, the conversion of grassland into arable land and back, to the formation and extinction of scrub, etc. (Jongepierová, 2008), which contributed to the further species enrichment of habitats. The vegetation also reflected to the agricultural management by emergence of new ecotypes, and spreading of species adapted to grazing or mowing (Chytrý, 2007). An important milestone was the beginning of manuring around the middle of the 19th century, which enabled spreading of meadows outside the floodplain of water flows. Probably at that time started a discrete development of pastures and meadows. The turning point came in the second half of the 20th century, when
farming intensification (drainage of wet meadows, stronger manuring, sowing strong competitive species) led to a reduction of the original species diversity. Negative effect on vegetation also has abandonment of not easily accessible meadows that are, without the help of a man, defeated by dominant species and overgrown by trees, and as a result they lose their diversity. Present species-rich meadows are a relict of extensive or slightly intensive farming of the years around 1850-1950 (Chytrý, 2007). Their importance for biodiversity and conservation of historic cultural landscape is irreplaceable. Such meadows are now still relatively abundant, but vulnerable, and it is necessary to maintain them by traditional management. The richest Czech traditionally-managed meadows can consist of up to 75 plant species per square meter (Jongepierová, 2008), which is more than any non-grassland habitat. Grassland ecosystems are also species-rich zoologically, because they provide shelter for many animal species, especially insects. High biodiversity of grasslands is maintained by disturbances (mowing, grazing etc.) that can, if they come at the appropriate intensity and frequency, increase both alpha and beta diversity of landscape (Chytrý, 2007). Very important for biodiversity is also diversity of environment, because it depends not only on the species richness of individual habitats, but also on the number of various habitats. For the grassland vegetation the most significant ecological gradients are soil moisture, pH and nutrient availability (Chytrý, 2007). Not all types of grasslands are extremely species-rich, yet all together they compose a diverse vegetational mosaic. However, some parts of the Czech Republic (e.g. White Carpathians) are unique for their high species diversity, despite the fact their abiotic conditions and vegetation are relatively uniform (Jongepierová, 2008). Anyhow, it is necessary to seek to maintain the biodiversity of grasslands, at least because that the type of landscape, resulting from the gradual blending of human and nature, is most often perceived as graceful or harmonious.

20 Survey on grassland ecosystem services
5 Trade‐offs among ecosystem services provided by grasslands under various use
5.1 Overview of ecosystem service trade‐offs as a result of land use change
In the following chapter (5.1.1) a comprehensive overview is provided of knowledge and findings relevant to the topic of trade-offs among ecosystem services. The other chapters (5.1.2 to 5.1.6) are concerned with the questions ‘to what extent ecosystem services are provided by different grassland types and other habitats used in agriculture and how they respond to different management schemes?“. All chapters are based on an in-depth literature review, starting with a literature search in three different databases provided by the following publishing houses: Springer, Wiley and Elsevier. Additionally, relevant literature was found using the Google search engine. As a third step the literature search was completed by checking the references cited in the relevant papers found in above databases and Google. The search focused mainly on European data published in peer-reviewed journals after 2000. In total, approximately 200 research papers were included in a further selection process. About half of them were chosen to be studied thoroughly and to be considered in the final report including Annex I. A review of the selected papers has been shown that there are no studies with comprehensive and comparative data that deal with all – or a high number of – ecosystem services provided by the following grassland or other agriculturally used habitats: HNV grassland, extensive meadows, intensive meadows, pastures, abandoned pastures, arable land, abandoned arable land, and fields for biofuel production. Additionally, there is no peer-reviewed paper where an understanding of all possible ecosystem service trade-offs which may result from land use changes or different management schemes, is provided. The majority of the available papers are concerned only with a single ecosystem service within a specific or a few habitat types. The three grassland ecosystem services productivity, carbon sequestration and pollination are the topics which prevail in most
of the available literature. Considerably fewer research papers are available on ecosystem services provided by soil (e.g. soil fertility) and fresh or ground water (e.g. water provision or retention) and most of them do not explicitly refer to grassland habitats. Also, only a few studies were found on cultural ecosystem services (e.g. aesthetic value or recreation). On other ecosystem services like genetic resources, biochemicals, natural hazard regulation, disease regulation and pest control in grassland habitats almost no studies were found, making a sound evaluation of ecosystem service provision by different grassland habitat types or management schemes almost impossible. Some literature was found on invasion control and erosion regulation, but the results provided referred only to a few habitat types. Given the data availability mentioned above, it was decided to adopt the following approach to summarize existing knowledge on the various ecosystem services of grassland habitats and their changes as a result of land use change: in order to avoid subjective judgments all conclusions should be explained based on the basis of reliable sound literature findings wherever possible. Therefore, the following ecosystem services were chosen to make trade-offs evident: plant productivity, carbon sequestration and animal pollination. The aim is to build a sound knowledge basis rather than work with fragmentary data or assumptions which yet need to be confirmed and therefore have less value for land management decision- making process at present or in near future. Although less information has been published on cultural services in grassland habitats, the recreation service has been chosen as the fourth ecosystem service to be treated in the following chapters, since ongoing research, especially in Switzerland, might provide additional findings in the future. In order to allow understandable conclusions in the chapters on productivity, carbon sequestration and pollination, the following questions are raised and answered, using findings from literature: „Which preconditions are essential for providing a certain ecosystem service and which factors are impeding this ecosystem service?“, and as a consequence of this „which habitat types and types of land uses are providing these preconditions and thus

Survey on grassland ecosystem services 21
supporting a certain ecosystem service and what kinds of land use are reducing this ecosystem service?”. The detailed results of all studies contributing to the answer of these questions are presented in Annex I of the report. Whereas, chapters 5.1.2 to 5.1.5 are providing summarized study results and conclusions on possible trade-offs resulting from altered land uses or management schemes in grassland schemes. To highlight these trade-offs ecosystem service performance by different habitat types is categorized either based on a quantitative evaluation or a qualitative. Although these classifications are based on simplifications or generalizing assumptions – which are not appropriate to make trade-off analysis referring to habitats on local scale – this approach allows to conclude general principles on the consequences of land use changes or altered management schemes for the provision of ecosystem services in grasslands.
5.1.1 Ecosystem service trade‐offs
What are ecosystem service trade-offs? Ecosystem service trade-offs occur when the provision of one ecosystem service is reduced as a consequence of the increased use of another one, thus creating a win-lose situation. Such trade-offs arise from management choices made by humans, which can change the type, magnitude, and relative mix of services provided by ecosystems (Rodriguez et al., 2006). In some cases, ecosystem service trade-offs may result from explicit choices, while in others, trade-offs arise without having been intended. Rodriguez and co-authors (2006) are mentioning that such unintentional trade-offs happen: when the people who decide are ignorant of the interactions between ecosystem services; when the knowledge of how they work is incorrect or incomplete and when the ecosystem services in question have no explicit market (and are therefore underestimated, if they are estimated at all).
Characteristics of ecosystem service trade-offs Many ecosystem service trade-offs are expressed in areas remote from the site of degradation (i.e. they take place across space). The effects of such management decisions have to be borne by others than those who are benefiting from the enhancement of a targeted ecosystem service. For example, a reduced habitat suitability to support pollination as a result of grassland intensification might also
affect the adjacent landscapes, not only the habitat which underwent a land-use change. If management decisions focus on the immediate provision of an ecosystem service, at the expense of the same ecosystem service or of other services in the future, they take place across time. Which is the case for many natural processes that occur at such slow rates that several generations may pass before significant effects are perceived by humans. These may be processes that create soil, alter soil fertility, and groundwater levels. Therefore, the perceived impact is crucially dependent on the time period chosen for analysis (DeFries et al., 2004). Ecosystem service trade-offs do not only occur across space and time but usually result in more than one ecosystem service trade-off for the ecosystem service being enhanced (Rodriguez et al., 2006). This may happen if intensification of hay production in grassland habitats may not only adversely affect the performance of pollinators but also the recreation service of the surrounding landscape. Additionally, there will be an impact on the plant communities of adjacent grasslands due to a reduction of local animal pollinators and an alteration in the species abundance. One of the results of ecosystems being complex and dynamic systems with interactions between nutrients, plants, animals, soils, climate and other components is that a linear response of ecosystems and their services is unlikely. The more common ecosystem response to changes in land use is non-linear, so that small changes in land use would have large ecosystem consequences, or vice versa, depending on the degree of land-use change.
Necessity of integrating trade-off analyses into trade-off decisions Ecosystem service trade-offs are rarely fully considered in decision-making. According to De Fries et al. (2004) this is partly due to the sectoral nature of planning and decision-making, because some of the effects being displaced in time and space cannot be identified or quantified with current scientific understanding, and because some ecosystem service trade-offs might as yet not have been recognized. This report on grassland ecosystem services is a contribution to reduce some of the existing

22 Survey on grassland ecosystem services
knowledge gaps which are the reason that decision making is based on insufficient data. On principle, decisions on land-use change based on trade-off analysis are to be related to the area concerned. Knowledge of local environmental factors as well as concrete management schemes is essential for trade-off analyses, as these factors influence ecosystem service performance. However, how much this information can be taken into account depends on the availability of appropriate data for quantifying relevant ecosystem services on the local scale, which seems to be the main obstacle to comprehensive trade-off analysis. Additionally, it is necessary to establish a participatory governance structure for common decision-making of survey, analysis, and evaluation of ecosystem assessments and the ecosystem services derived from them. Decision makers can only take the full range of consequences into account if the consequences of land-use change are identified and quantified to the extent possible (De Fries et al., 2004). Figure 2. Relationship between land-use change, ecological knowledge to assess ecosystem consequences, and societal values to assess trade-offs associated with land-use decisions (taken from De Fries et al., 2004).
According to de Groot et al. (2010) an analysis of ecosystem service trade-offs, when being done carefully and systematically, should: focus on the impacts of land-use changes on individual ecosystem service as well as the effects on the total „bundle“ of ecosystem
services and their values and on biodiversity overall (including the intrinsic value), consider effects on the local/regional up to the global scale (spatial scale), include effects which may potentially take place in the future (temporal scale), compare all the costs, benefits and non-use values, take into account: multiple goals and the wishes of multiple stakeholders. This should be implemented by following a participatory approach in decision-making (Ash et al., 2010)
5.1.2 Productivity
Herbage productivity of different grassland types in Europe is reported by a high number of studies. Most of them are comparing productivity on the basis of aboveground biomass per year (t dry matter ha-1 yr-1). Only a few studies are also concerned with the quality of the herbage produced and the metabolizable energy value of hay, but the data currently available are insufficient for a comparison of different grassland habitat types. A detailed description of all study results which are relevant for the following essay is provided in Annex I of the report. In the following text some general principles which refer to the effects of land use changes or altered management schemes on grassland habitats are deduced from literature findings. Concerning these principles there are some restrictions of validity due to the study results which should be taken into consideration: There is lack of studies comparing all or most of the habitat types listed in Tab. 8 in regard to their productivity under the same conditions (e.g. edaphic and climatic conditions, soil nutrient content, identically use of fertilization and equal management schemes). Although the varying management schemes applied are described in detail in most of the studies, differences in soil nutrient content, soil moisture and climatic conditions affecting productivity are also arising. But these effects on productivity are almost impossible to quantify and therefore not reported. For some grassland habitats (e.g. pastures) data on productivity are scarcely reported in the literature or the results are contradictory. Therefore, some assumptions had to be made which are indicated in Tab. 8 (e.g. pastures, abandoned arable land, fields for biofuel production).

Survey on grassland ecosystem services 23
Although European grassland vary greatly in their herbage productivity (Smit et al., 2008), the data published on plant productivity show that intensively managed meadows are able to produce the highest yields (up to 10 t ha-1 yr-1 and exceeding) of all grassland habitat types used in agricultural practice (e.g. Weigelt et al., 2009; Statistik Austria, 2010). Climate conditions and soil moisture are as important for plant growth as a certain amount of nutrients in the soil. In conventionally managed grassland this is usually obtained by an increased application of fertilizer. Raising species richness and including legumes in plant mixtures has been shown to be an alternative approach to raising the nitrogen content of soils: In field experiments grass-legume mixtures turned out to be as productive as intensively managed meadows (e.g. Nyfeler et al., 2009 & 2011). Even modest increases in agronomic species diversity can enhance agricultural production in intensive grassland systems (Kirwan et al., 2007). But the positive effect of legumes on productivity is significantly reduced at high mowing frequencies and fertilization levels: For some mixtures it has been shown that a low number of cuttings combined with moderate fertilizer application provided the highest yields (Weigelt et al., 2009). Additionally, the number and combination of functional groups (e.g. grasses, small herbs, tall herbs and legumes) had an influence on increased aboveground productivity. In order to make use of the benefits derived from well-balanced grass-legume mixtures and enhance agricultural productivity, some important issues – which are relevant for a long tern effect – need to be considered: firstly, the fact that, patterns of species interaction which are responsible for raising productivity may be associated with certain environmental conditions, and secondly, the fact that the persistence of the species in mixtures, especially in highly fertilized grasslands, is only temporal. Therefore, in order to overcome difficulties in maintaining well-balanced mixtures and to counteract tendencies of losing key species (Guckert and Hay, 2001), research in agronomy is needed to maximize productivity through diversity effects and to enable a competitive long-term use by farmers (Lüscher et al., 2008). The plant productivity of pastures was assessed to be low and high according to unpublished data compiled by the Austrian Agricultural
Research Center in Raumberg Gumpenstein which showed that pasture productivity (e.g. 2.0–8.5 t ha-1 yr-1) results in yields comparable to those from meadows. Contrary to unfertilized meadows grazing allows that nutrients are returned to the sward through livestock excreta. Furthermore, grazing supports the growth of legumes by providing additional nitrogen inputs through N2 fixation (Kayser and Isselstein, 2005). This might support the assumption that in some cases pastures have a higher productivity than extensively used meadows. But there is evidence that in some cases grazing increases above and below-ground primary production but in other cases the opposite has been reported (Collins et al., 1998; Gough and Grace, 1998; Knapp et al., 1999; Frank et al., 2002). Published examples suggest that it is not possible to predict the potential effect of grazers on grassland processes where these interactions have not yet been studied (Thiel-Egenter et al., 2007). For some plant communities (e.g. grass-legume mixtures) a less frequent cutting regime which takes into account the herbage mass before harvesting (yield-based cutting regime) results in a higher dry matter productivity than higher cutting frequencies (Elgersma and Schlepper, 1997; Unkovich et al., 1998, Vinther, 2006). Corresponding to this finding, heavy grazing pressure also seems to reduce the amount of yield being provided by grasslands. Compared to mowing, grazing animals have profound effects on legume-based pastures in several ways, including a physical impact on soil and plants through treading, the redistribution of nutrients through excreta and more frequent defoliation (Menneer et al., 2004). Some results support the assumption that intermediate cutting frequencies result in the highest levels of grassland productivity (Cop et al., 2009; Weigelt et al., 2009). This is due to the fact that most grasses cease to produce new leaves after flowering whereas they quickly regrow after being cut. Frequent mowing leads to an early defoliation during the period of the fastest plant growth in spring which cannot be compensated by subsequent regeneration and regrowth, especially not in legumes and tall herbs. Compared to a time-based regime, the yield-based cutting regime allows longer growing periods (or longer periods of regrowth) and hence results in higher yields on the less fertilized plots. It has been shown that in mixed swards with a low nitrogen application rate,

24 Survey on grassland ecosystem services
white clover performs better if rather longer intervals between harvests are allowed (Nevens and Rehuel, 2003). Grassland extensification (due to termination of fertilizer application) was shown to have a decreasing effect on biomass production, but to a lesser extent under a moderate cutting regime (Hejcman et al., 2010). A Cutting regime without fertilizer application induces a decrease in available nutrients, and in biomass production, more quickly than grazing, because 60–90 % of the nutrients from ingested herbage are returned to the pasture through excreta. Furthermore, grazing on productive grasslands supports the growth of legumes by providing considerable amounts of additional nitrogen input through N2 fixation.
Arable land is used for the production of crops but not for hay production. If abandoned arable land is colonized by herbage productivity will increase to a certain extent, but also other competing plants like bushes will grow – depending on how long the land is left abandoned – preventing a strong increase of herbage productivity. In most cases fallow fields are situated in nutrient-poor or agriculturally unfavourable areas, which is why it is likely that productivity will remain low. Fields for biofuel production are generally used for cultivation of fast growing trees to be harvested at an early stage. Here herbage productivity is insignificant.
Table 8. Herbage productivity of different habitat types
HNV grassland
Extensive meadows
Intensive meadows
Grass-Legume mixtures
Abandoned meadows Pastures
Arable land & abandoned
Fields for biofuel production
Habitat Productivity (based on literature data)
moderate moderate high high moderate
to insignificant1
Habitat productivity (assumed)2
moderate
to high
insignificant to
moderate insignificant
Range of yield (t ha-1 yr-1)3
< 4 3–6 6–12 5–184 < 3
Fertilisation (kg ha-1 yr-1) 0 0
Nitrogen: up to 200 (or above)
Nitrogen 0–100 0 excreta
Management (cuts)
1 but late in season 1–2 (2)3–6 2–7 0
1 Depending on how long land is left abandoned 2 No relevant data found in the literature 3 Taken from literature discussed in the text above and Annex I, serving as examples for dry matter yields provided by habitats 4 Data based on field experiments (see Annex I, Table 3)
5.1.3 Carbon sequestration
Carbon sequestration is the process of removing CO2 from the atmosphere through photosynthesis and storing it in carbon pools of varying lifetimes (Abberton et al., 2010), in biomass (tree trunks, branches, foliage and roots) and soils. There is a difference between gross primary productivity, which refers to the whole carbon absorption by the terrestrial ecosystem, and net primary productivity, which is reduced by carbon loss through plant respiration.
There are three main types of carbon sequestration: Carbon sequestration in terrestrial ecosystems Carbon sequestration in the Oceans The subsurface sequestration of carbon dioxide in underground geological repositories. Carbon storage in terrestrial ecosystems is currently the focus of the most attention and is the easiest and most immediate type of sequestration at the present time. The other options may become more important in the future, as science and corresponding legal systems develops (Environ Holdings, 2011).

Survey on grassland ecosystem services 25
Grasslands covered approximately 3.5 billion ha in 2000, representing 26 percent of the world land area and 70 percent of the world agricultural area, and contain about 20 percent of the world’s soil carbon stocks (FAOSTAT, 2009; Ramankutty et al., 2008; Schlesinger, 1977). Grasslands are able to store more carbon as arable lands. The reasons behind this are, among others, reduced soil cultivation, ground cover, higher content of humus and intensive root penetration, all ensuring rich supplies of organic material in the soil of grasslands. Of the large number of studies on carbon sequestration which have been conducted in recent years and reviewed for this report, a few representative papers have been discussed more detailed as follows. In nearly all of these reviewed papers carbon sequestration was found to be strongly related to land use and management practices. The authors of these papers tried to assess carbon sequestration rates by observing direct effects of vegetation types, land use change and change of management practices on carbon sequestration of certain plots. For further, more detailed, information, figures and related tables of the reviewed papers please see Annex I. Conant and Co authors (2001) compared in their study carbon sequestration rates due to different land management practices and concluded that on average management improvements and conversion from cultivated land into pasture result in increases of soil carbon content and net soil carbon storage. Long time experiments by Fornara and Tilman (2008), where biomass and carbon sequestration rates had been measured in different soil depths, led to the results that particularly a combination of C4 grasses and legumes cause carbon sequestration rate to increase (compared to monoculture plots with C3 grasses or C4 grasses) and is therefore suggested if higher levels of soil carbon accumulation and biomass production are to be achieved (Fornara et al., 2008). Additionally to the investigations from Fornara and Tilman (2008) about the importance of legumes for carbon sequestration De Deyn and co-authors (2011) confirm this importance by the example of Trifolium pratense by demonstrating that the observed benefits of T. pratense for soil carbon and nitrogen storage
are compatible with restoration of grassland biodiversity. In trying to quantify sink and source relations of carbon and nitrogen and to clarify the driving mechanism for carbon and nitrogen losses during grassland degradation, investigation of carbon changes have led to the result that the total carbon stored in the grassland ecosystem was reduced by up to 14 % depending on the severity of the degradation. (Zhang et al., 2011) Dawson and co-authors (2007) noted in their study about “Carbon losses from soil and its consequences for land-use management” uncertainties in their carbon process figures due to the heterogeneous nature of soils, land-uses and management practices. This is why assumptions and generalizations had to be made and further research will be necessary to answer outstanding questions concerning carbon sequestration. The effect on carbon sequestration of land, which has been converted for biofuel production, depends very much on the kind of land, where conversion occurs, and how biofuels are produced there (Tilman et al., 2006; Fargione et al., 2008). Besides the monocultural production on fertile soils, Tilman and co-authors (2006) perform in their study the possibility to derive biofuels from low-input high diversity grassland (mixtures of native grassland perennials), which can increase the carbon sequestration rate, if produced on degraded lands. Fargione and co-authors (2008) confirm the positive aspect of biofuel production, if perennials are planted on degraded land; but for the sake of completeness it should be noticed, that a possible increase of carbon sequestration under the circumstances described above is not applicable for biofuel production only. Continuous excessive grazing and management practices which diminish soil carbon stocks have a negative effect on plant communities and soil carbon stocks (Conant et al., 2001). Grassland degradation not only results in soil degradation, but can also advance the emission of soil carbon and nitrogen compounds as greenhouse gases into the atmosphere (Zhang et al., 2011). With land management changes carbon sequestration could be significantly increased. An improved land management can increase carbon storage in trees and soils, preserve existing tree and soil carbon, and reduce

26 Survey on grassland ecosystem services
emissions of CO2, methane (CH4) and nitrous oxide (N2O). Climate, land-use changes and management practices play a significant key role for carbon gains and losses. New technologies for grassland management practices allow an increase of carbon sequestration in soils. The following table lists the carbon sequestration rates of different habitat types according to different land use changes and specified management activities. Species richness was shown to positively affect carbon sequestration (HNV grassland). Intensification of grassland use due to a high cutting rate in intensively managed meadows reduces plant species diversity and as a result, the carbon sequestration rate. The introduction of grass-legume mixtures positively influences the carbon sequestration rate. Assuming an increased duration of leys in the management of meadows the carbon sequestration rate will be enhanced, as might happen in abandoned meadows. Due to higher plant species richness compared to intensively used meadows and due to a lower number of cuttings per year carbon sequestration rates for extensively used
meadows can be found in the range between those of intensively managed meadows and HNV grassland. The carbon sequestration rates of pastures which have been published in the literature depend on the type of land use and management practices: land use changes from arable land to pastures resulted in sequestration rates which deviated from those reported for land use and management changes from native or cultivated land (not defined in detail by the authors) to pastures. In spite of the deviations, all kinds of land use change increased the carbon sequestration rate. By way of contrast, conversion from grassland to arable land led to a negative carbon sequestration rate. Biofuel production can cause diverse carbon sequestration rates depending where and how plants and crops are produced. All carbon sequestration rates listed below depend on the initial situation of the land, where land use changes and specified management activities started as described in the here cited literature. It also has to be considered that duration of increase of carbon sequestration is limited and differs depending on land use and management activities.
Table 9. Carbon sequestration rate of different habitat types according to land use changes and specified management activities
HNV grassland
Extensive meadows
Intensive meadows
Grass-legume mixtures
Abando-ned meadows
Pastures Arable land
Fields for biofuel production5
Carbon sequestration rate in soil (based on literature data)
moderate to
high
negative to
moderate moderate moderate moderate negative
negative to
moderate
Carbon sequestration rate (assumed)
moderate
to high
Range of rate (103 kg C ha-1 yr-1)
1.2–6.46 -0.9–1.17 0.3–0.758 0.2–0.59 0.2710– 1.0111
-0.95–1.712
Fertilization no no Management (cuts) 0–1 1–2 > 2
5 Conversion from grassland to fields for biofuel production: depending on land (abandoned, degraded,..), type of soil, species richness (Tilman et al., 2006), (Fargione et al.,2008) 6 Depending on the number of cuts, plant species richness and type of soil 7 Intensification of grassland: highest value for intensification of nutrient poor grassland (Dawson et al., 2007) 8 Introduction of grass-legume mixtures (Dawson et al., 2007) 9 Increased duration of leys (Dawson et al., 2007) 10 Land use change from arable land to permanent pasture (Dawson et al., 2007) 11 Land use change from cultivated land to pasture (Conant et al., 2001) 12 Conversion from grassland to arable land (Dawson et al., 2007)

Survey on grassland ecosystem services 27
5.1.4 Pollination service by insects
Grassland habitats are supporting pollination service by insects. Vegetation, structure and agricultural management of grassland habitats are affecting abundance and number of flowering plants species as well as number of pollinating insects. This chapter elucidates essential preconditions and the suitability of grassland habitats to provide pollination service at the plot scale. The effects of surrounding landscapes on the pollination situation in adjacent grassland habitats (i.e. provision of pollination service at landscape scale) are not discussed in this chapter. A detailed description of all study results relevant for the following essay is provided in Annex I of the report. In order to judge the validity of the general principles described below – which are derived from published data on the performance of pollinating insects as a result of different grassland habitats or agricultural management schemes – the following restrictions have to be taken into consideration: Most of the studies published during the last years compare effects of one habitat type, or a few habitat types, or agricultural management schemes on the pollination service. There are no studies which compare all the different habitat types presented in Table 10 on the same conditions. Important aspects of these conditions may include for example weather conditions, soil fertility, plant species richness, plant species evenness, species richness of other pollinators and the habitat adjacent matrix. These factors are influencing the pollination performance and are varying between different habitats of the same type. In most of the studies these conditions are not reported and cannot be quantified as far as their impact on the pollination service is concerned. In different categories of relevant habitat types (e.g. extensive meadows, arable land) different variations of management schemes are applied in individual habitat types (e.g. different number of hay cuts, timing of hay cutting and amount of applied fertilizer). As these variations may affect pollination they should be considered in an assessment of this ecosystem service. But not all of the published papers provide the necessary details allowing a sound comparison of the habitat conditions. In these cases, any statements about pollination services in a certain habitat type are only possible to a limited extent. In other cases, detailed information on different management
schemes or different habitats conditions is sufficiently available to suggest that a comparison of the pollinators´ performance would be invalid due to the differences described. There are different reactions of wild bees, bumblebees, hoverflies and butterflies to land-use changes. Therefore, it is not possible to make a general statement for all pollinator groups about the effects of land-use changes on pollination services. Most of the studies deal with wild bees and bumblebees which require different habitat conditions and therefore show different reactions to changing habitats. Other pollinating animal groups dealt with in the literature are hoverflies and butterflies, but only to a minor extent. Based on the literature review and in view of the above mentioned reasons for the restrictions to be applied to generalizing conclusions, the following conclusions can be drawn about habitat suitability and its support of pollination services (c.f. table 10, showing the stimulating or impeding influence of habitat types or agricultural management schemes on the pollination performance of wild bees, representing animal pollinators): Grassland habitats with a high plant diversity like HNV grassland and extensive meadows have been found to best support pollination services, especially when they are provided by bees but also by other insect species. A high number of flowering plant species and an increased density of blossom cover are a requirement for a high frequency of pollinator visits (e.g. Ebeling et al., 2008; Fenster et al., 2004; Steffan-Dewenter and Tscharntke, 2001). Increasing floral resource heterogeneity leads to an increasing attractiveness for many pollinator species seeking single and multiple resources (nectar and pollen). For example, semi-natural habitats such as calcareous grasslands offer a rich supply of floral resources from early spring to late autumn and further provide diverse microhabitats for nesting and larval development and therefore may contribute to the preservation of pollinator diversity in agro-ecosystems (Duelli and Obrist, 2003). Each kind of land-use that maintain species-rich grassland habitats, e.g. extensive grazing, contributes to an enduring pollination service: Cattle grazing of an unimproved chalk grassland once a year was shown to maintain flowering-rich extensive grassland with an open structure providing high bumblebee density (Carvell, 2002). Also, the species richness of hover flies was found to have had been

28 Survey on grassland ecosystem services
supported by a low intensity of grazing providing tall vegetation (Sjödin et al., 2008). Extensification schemes being applied to hay meadows with intermediate land use intensity led to a significant positive effect on bee species-richness and abundance as a result of a postponed first cut in June at the earliest (and no use of fertilizer and pesticides) (Kohler et al., 2007). Depending on the grazing intensity, pastures can be valuable habitats for pollinators (especially bumblebees) as well as abandoned pastures. In contrast to cattle grazing, sheep grazing or mechanical mowing are of less value for bees and bumblebees, because grazing by cattle creates a more structurally and floristically diverse sward that also benefits other invertebrates (Carvell, 2002). It was shown, that grassland which had not been cattle grazed for nearly two years led to a decreased number of bumblebees and their forage plants (Carvell, 2002). Therefore, a regular form of controlled rotational grazing is of great importance for bumblebees, but the areas should be large enough to support a succession of suitable forage plants. But other than for bumblebees abandoned grassland with tall vegetation supports species richness of hover flies. Bumblebees and bees differ with respect to their habitat needs: The use of seed mixes (including especially Brassica-species), fallow habitats and grass crop harvested to produce silage are land management types which have been found to support the number of bumblebees (Redpath et al., 2010). This is because for bumblebees a number of key forage plant species appear to be more important than a greater diversity in the plant community.
Intensifying the grazing activity on grasslands has a negative impact on bees (Le Féon et al., 2010; Sjödin et al., 2008) and bumblebees (Carvell, 2002), mainly mediated through changes in flower diversity. Although small increases in grazing intensity may not result in declining plant species richness, they can cause changes in plant composition and a lower species evenness of pollinators, which might lead – in the long-term – to a reduction of the species diversity (Loeser et al., 2007). Agricultural intensification has been correlated with a decline in wild pollinator (especially bee) abundance, diversity and the service provided to crops (Kremen et al., 2007). Intensified land use being characterized by machine-driven farming and increased input of fertilisers and pesticides directly kills pollinators or reduces nest and flower resources. Increasing nitrogen input to arable crops has also been shown to reduce the abundance and diversity of wild bees (Le Féon et al., 2010). Flowering crops (monocultures) on arable land also offer floral resources for some pollinator species. Bumblebees are less affected by agricultural intensification than bees: according to their less specialized floral requirements, better flying abilities and longer foraging distances (than solitary bees), the proportion of bumblebees increased with increasing use of insecticides, fungicides, retardants and nitrogen inputs to permanent grassland (Greenleaf et al., 2007). Flowering plants gradually colonizing abandoned arable land are of value for the pollinators. Whereas, fields for biofuel production which are used for the cultivation of fast growing trees rarely provide pollinators with resources.

Survey on grassland ecosystem services 29
Table 10. Habitat suitability for pollination service (wild bees)
HNV grass-land
Extensive meadows
Intensive meadows
Abando-ned mea-dows
Pastures Abandoned pastures
Arable land
Abandon-ed arable land
Fields for biofuel production
Habitat suitability (based on literature data)
high moderate
to high13
insignificant
to moderate14
insignificant to
moderate15
insignificant to
moderate16
Habitat suitability (assumed)
insignifi-cant moderate moderate insignifi-
cant
Habitat manage-ment (cutting or grazing)
1 cut late in
the season
1–2 cuts, first cut in
earliest June at the
l3–6 cuts
ow to high intensity of
grazing
no more grazing
Fertilisation no no annual application excreta no
13 Depending on the cutting regime (number of cuts and date of the first cut in the season) 14 Depending on grazing intensity and type of grazing animal (cattle or sheep) 15 Depending on how long the land is left abandoned 16 Depending on cultivated crop
5.1.5 Recreation
Cultural ecosystem services are defined as the nonmaterial benefits obtained from ecosystems. The recreational ecosystem service is one of the cultural ecosystem services and is defined by the recreational pleasure that people derive from natural or managed ecosystems (Maes, 2011). The recreational services provided by grasslands include many possibilities for outdoor activities like hiking, fishing, climbing and other sporty activities, which also have a cultural and a spiritual importance. Indicators assessing recreational services provided by grasslands tend to be more subjective than quantitative, because enjoyment and the recreational satisfaction gained from grasslands is perceived differently. Natural ecosystems have an important status as they provide places where people can come for rest, relaxation, refreshment and recreation. With increasing numbers of people, as well as growing affluence and leisure-time, the demand for recreation in natural areas („eco-tourism“) is most likely to continue to increase in the future (De Groot et al., 2002). Generally, the capacity of ecosystems for providing recreational services depends on their uniqueness, the culture that generated them and the possibility for outdoor activities. The relation between this capacity and the
associated flow of benefits is a positive one which is influenced by human accessibility to ecosystems and the infrastructure in place to host or guide visitors. If ecosystems are beautiful, but not accessible, their associated flow of benefits will be low (Maes et al., 2011). The relation referred to above is expressed as: flow of benefits ~ capacity * accessibility Although there are some studies which address recreational benefits in general in the form of various travel cost models, studies about the recreational services provided by grasslands are still rare. One of these studies, which were conducted in Switzerland (Lindemann-Matthies et al., 2010) investigated people’s perception and appreciation of species diversity in a series of experiments and field studies, with the result that plant diversity in itself was found to be attractive to humans. The current decline of the diversity of grasslands due to intensive management may thus reduce the attractiveness of regions where grasslands are a dominant feature of the landscape. This could have negative consequences for tourism and may contribute an economic argument in discussions about the conservation of biodiversity in grasslands. Similarly, the attractiveness of species-rich vegetation may also provide an economic argument in favour of the conservation of grassland biodiversity.

30 Survey on grassland ecosystem services
Another report (Matzdorf et al., 2010) is focused on the assessment of important ecosystem services provided by High Nature Value Grassland (HNV-grassland) and presents a list with possibilities for quantification and monetarization. For the provision of recreational services they recommend hedonic pricing and spatial discrete choice modelling. Further on, the authors try to anticipate the development of the recreational services provided by HNV-grassland if the current land use and management practices are changed to the following: shrub encroachment, intensification, mulch-grassland; nearly all changes have a slightly negative influence on the recreational ecosystem service. Costanza and co-authors (1997) define, in a table of different biomes, an average global value for annual ecosystem services. For the recreational ecosystem service provided by the biome grassland, they set the value 2 $ ha-1 yr-1. Compared to this, the value attributed to the recreation service of wetlands is estimated at 574 $ ha-1 yr-1, for coral reefs at 3008 $ ha-1 yr-
1, and forests at 66 $ ha-1 yr-1. How differently managed agricultural landscapes influence recreation and the psychological well-being was examined by Martens and co-authors (2011). While the participants were walking on a treadmill either an intensively managed agricultural area, an extensively managed agricultural area or a control film was presented. The results show that landscape qualities are perceived differently in intensively and extensively managed agricultural areas. However, no differences in the psychological well-being were observed. Both, the extensively and the intensively managed agricultural area increased the personal well-being more significantly than under the control conditions, where the participants were exposed to a physical activity only. The findings can be used to improve the management of natural areas with regard to their influence on human recreation and well-being.
Data on recreational services are difficult to obtain, but their availability is essential to follow conceptual models for valuing this ecosystem service. Accurate assessments of the quality of the recreational services provided especially by grasslands and investigations of the continued capacity of grasslands to provide these ecosystem services require comprehensive systems for data collection, monitoring and reporting. According to the limited number of published data available on the recreational value of different grassland habitats or other agriculturally used habitats, evaluation of recreational suitability was based on people´s perception and aesthetic appreciation of vegetation. This had been shown to be correlated with plant species richness which in itself is attractive to humans. Therefore, habitats providing high species richness such as HNV grasslands are classified as highly suitable for recreation, whereas reduced plant species richness in intensively used habitats like intensively managed meadows, arable land and fields for biofuel production are of insignificant value for attracting people in search of recreation. Extensively used meadows, abandoned meadows and pastures can be assumed to be more attractive for leisure activities due to their more diverse species richness and the surrounding landscape structures in which they may be embedded. Other factors influencing the attractiveness or suitability of habitats for recreation are their uniqueness, the culture that generated them, the possibility for outdoor activities and human accessibility to ecosystems, as well as the infrastructure in place to host or guide visitors. But these factors depend on circumstances which are specific to local habitats and cannot be generalized in the form of a categorisation of habitat types. Therefore, these factors are not considered in Table 11.
Table 11. Suitability of different habitat types for recreation, based on an aesthetic appreciation of grassland vegetation
HNV grass-land
Extensive meadows
Intensive meadows
Abandoned meadows Pastures Arable land
Fields for biofuel production
Recreation suitability (based on literature data)
high moderate
to high
Insignificant
Recreation suitability (assumed) moderate
to high moderate
to high insignificant insignificant

Survey on grassland ecosystem services 31
5.1.6 Conclusions of ecosystem service trade‐offs as a result of land use change
The intensity of agricultural use of grassland habitats implies clear effects on the provision of various ecosystem services. Altered management schemes and land-use changes may support some ecosystem services and impede others, at the same time or a later time. In order to estimate possible future ecosystem service trade-offs prior to planned land-use changes at a local scale knowledge on future management schemes will be as important as considering local conditions like edaphic and climatic conditions, precipitation and the habitats slope (e.g. DeFries et al., 2004; De Groot et al., 2010; Matzdorf et al., 2010). On the other hand knowledge on general principles how ecosystem services are affected by land-use changes may provide important hints on possible ecosystem service trade-offs, although the degree of effects at the local scale cannot be deduced from general principles. Such principles are presented for effects on the ecosystem services productivity (chapter 5.1.2), carbon sequestration (chapter 5.1.3), pollination (chapter 5.1.4) and recreation (chapter 5.1.5). Possible trade-offs between these four ecosystem services in case of changed agricultural use are described below. The proposed categorizations of ecosystem service performance are based on the conclusions of the chapters mentioned above and summarized in Table 12. Any interpretation of these categorizations should take into consideration the restrictions which need to be applied to the results of the above mentioned chapters. Literature data give evidence for, that as a result of strong intensification of agriculturally used grasslands (intensively used meadows), high productivity is achieved at the expense of carbon sequestration, as well as the pollination and recreation performance. By way of contrast, extensively used grassland habitats (HNV grasslands, extensively used meadows and extensively used pastures) are endowed with lower productivity, but provide a larger contribution to climate regulation due to a higher level of biodiversity, and support pollination by insects considerably more, and they are of greater value for recreation. The pollination service is almost not supported by intensively used pastures.
Agricultural use of certain plant species mixtures capable of particular species interactions (grass-legume mixtures) can lead to high herbage productivity, and an increase of the carbon sequestration rate, comparable to that provided by intensively used grasslands. On the assumption that grassland species diversity enhances the attractiveness to humans (published by Lindemann-Matthies et al., 2010), habitats providing only grass-legume mixtures are likely to be of less value for recreation. Other factors influencing the attractiveness or suitability of habitats for recreation are their uniqueness, the culture that generated them, the possibility for outdoor activities and human accessibility to ecosystems, as well as the infrastructure in place to host or guide visitors. But these factors depend on circumstances which are specific to local habitats and cannot be generalized in the form of a categorization of habitat types. Provision of herbage productivity, pollination and recreation by abandoned meadows strongly depends on how long the land is left abandoned: strong shrub encroachment is reducing herbage production and pollination service, and might prevent possibilities for recreating out-door activities at this habitat type. Conversion to arable land has negative effects on carbon sequestration (carbon losses might have to be expected), is of no importance for hay production and supports pollination only if flowering crops are cultivated (e.g. rape, sunflowers). Furthermore, arable land might be less suitable for human recreation compared to grassland habitats. In case of arable land being abandoned, herbage productivity and habitat suitability for pollination service may be enhanced (depending on the length of time for which the land is left abandoned as well as on the use which follows). Fields for biofuel production are of particular importance neither for herbage productivity nor for pollination. The effects on carbon sequestration of land, which has been converted for biofuel production, can range from slightly positive effects by deriving biofuels from low-input high-diversity grassland on degraded lands to negative effects by deriving them from monocultural crops on fertile lands. Suitability for recreation seems to be of minor importance compared to grassland habitats, although some nicely flowering species might be the exception.

32 Survey on grassland ecosystem services
Although a categorization of the suitability of the different habitat types for providing ecosystem services has been carried out on an exemplary basis for a limited number of services, the influence of different land uses can clearly be demonstrated. Ecosystem services depending on biodiversity like carbon sequestration, pollination and recreation are affected by land use changes in a comparable manner: biodiversity increasing agricultural measures positively influence their provision
but biodiversity decreasing activities also reduce ecosystem service performance. For the same reason, grassland improving measures like fertilization and high cutting rates to enhance herbage productivity diminish the other three services considerably. The results of this classification indicate that for semi-natural grasslands the fundamental trade-off arises between hay production on the one hand and carbon sequestration, pollination and recreation service on the other.
Table 12. Suitability of different habitat types for providing the following ecosystem services: productivity, carbon sequestration, pollination and recreation
HNV grassland
Extensive meadows
Intensive meadows
Grass-Legume mixtures
Abandoned meadows Pastures
Arable land & abandoned
Fields for biofuel production
Herbage productivity
moderate moderate high high moderate
to insignificant
moderate to
high
insignificant to
moderate insignificant
Carbon sequestration rate in soil
moderate to
high
moderate to
high
moderate to
high moderate moderate moderate negative
negative to
moderate Habitat suitability for pollination
high moderate
to high
insignificant moderate moderate
to high
insignificant to
moderate
insignificant to
moderate insignificant
Habitat suitability for recreation
high moderate
to high
insignificant insignificant moderate
to high
moderate to
high insignificant insignificant
The table above is based on a comparative evaluation of the extent of the respective ecosystem service being provided by different habitat types. This approach is suitable for comparing the performance of different habitat types with respect to a particular ecosystem service. It is, however, not suitable for a comparison of different ecosystem services.
5.2 Ecosystem services in the context of environmental degradation
Grassland habitat degradation can have several interacting drivers. The most important factors influencing grassland degradation is the withdrawal of management, disturbance such as grazing, water drainage, eutrofization, acidification and nitrogen deposition, invasive alien species or urban and infrastructure sprawl. Habitat degradation is closely linked to a biodiversity status of grasslands but also to physical characteristics of grassland habitats (soil compaction, water drainage). There is some evidence that habitat degradation reduces the provision and performance of grassland ecosystem services. Grassland degradation has probably more moderate effects on ecosystem services than conversion
to other land uses. However, evidence suggests that effects of habitat degradation on ecosystem services and biodiversity can be still substantial. The potential to sequester carbon by improving grassland conservation, management and restoration of degraded grasslands is substantial, approximately of the same order as that of agricultural and forestry sequestration. On the other hand, carbon is emitted from grassland by heterotrophic respiration, fires, and also changes in soil C pools induced by soil erosion or water drainage. Ecosystems degraded by sealing or compaction have reduced capacity of soils regulate water inflow. Grasslands and associated habitats, especially alluvial meadows and reed and sedge beds, can act as washlands and barriers to floods. Degraded grasslands reach higher runoff and soil loss coefficients than conserved grasslands and therefore increase water and soil loss from an ecosystem. One of the syndromes of degradation is the spread of invasive or synantropic species which increases the level of invasion in a grassland habitat. Degraded ecosystems are also less attractive from an aesthetic and recreational point of view.

Survey on grassland ecosystem services 33
The aim of this chapter is to summarize effects of habitat degradation on the level of ecosystem services. Interaction between drivers of degradation is closely associated to the assessment of ecosystem services trade-offs.
5.2.1 Livestock provision
Grazing can be considered as one of the driving factors of grassland degradation. Livestock can assist to maintain soil fertility, increase nutrient retention as well as water-holding capacity, and create suitable climate for micro-flora and fauna (Delgado et al. 1999). However, if overgrazing occurs, soil compaction and erosion may follow with a decrease in soil fertility, organic matter, and water-holding capacity (White et al. 2000). As a consequence, 49 % of worldwide grasslands were estimated to be lightly to moderately degraded, with at least 5 % strongly to extremely degraded (White et al. 2000). Areas of high intensity livestock production, under industrial and intensive mixed farming systems, the high concentrations of animals can cause serious environmental problems and have been called “the most severe environmental challenge in the livestock sector” (Delgado et al. 1999). Grassland degradation by grazing is especially a major threat in mountain regions (the Alps, the Carpathians) of Europe where grazing leads to “cattle (sheep) steps”, i.e. contour pathways speeding up the erosion rates.
5.2.2 Carbon sequestration
Changes of carbon content of grassland ecosystems are caused by land-use changes and management changes. Generally, management practices which reduce disturbance to grasslands, and conversion from crop to grasslands, increase carbon (C) sequestration (Jones and Donnelly 2004). Conversion of cropland to grassland can lead to increases in soil C up to 30 %. The opposite process, conversion of pastures to cropland, always reduces the C stocks by 50 % (Guo and Gifford, 2002). Grassland degradation reduces the potential to sequester carbon and contributes to the release of greenhouse gases. According to a study by Zhang et al. (2011), total carbon stored in the grassland ecosystem was reduced by up to 14 %. Grassland management can in some cases improve the carbon sequestration services provision and therefore semi-natural grasslands may not be the most effective habitats concerning the carbon storage. However, the greatest potential
for carbon sequestration have restored grasslands on soils depleted by poor management (Jones and Donnelly 2004).
5.2.3 Water flow regulation
Ecosystem service of water regulation can be defined as influence ecosystems have on the timing and magnitude of water runoff, flooding, and aquifer recharge, particularly in terms of the water storage potential of the ecosystem (WRI 2008). Water infiltration was suggested to depend on soil type, soil texture, soil structure, earthworm burrow numbers, earthworm species, stable organic matter and initial soil water content. There is some evidence that degraded grasslands reach higher runoff coefficients than non-degraded. Butler et al. (2008) observed the greatest runoff volume from heavy-use plots on poorly drained soils (35 % of rainfall as runoff) and the least from light-use plots on well-drained soils (12 %). Management of grasslands has also effect on water infiltration. Fertilization increases aboveground production but the infiltration and ground water recharge can be decreased by about 50 % (Rose et al. 2011). Runoff from grasslands is dependent on vegetative cover and soil properties. Runoff coefficients or runoff curve numbers (RCN) express the runoff potential. The higher the runoff coefficient, the higher the runoff potential, i.e. greater percentage of rainfall is transformed to runoff and is not infiltrated. Water runoff is determined also by degradation by grazing. Poor grassland condition is < 50 % ground cover or heavily grazed with no mulch, fair is 50 % to 75 % ground cover and not heavily grazed, and good is >75 % ground cover and lightly or only occasionally grazed. With increasing degradation the runoff is also increasing.
5.2.4 Soil erosion
Semi-natural as well as managed grasslands contribute to soil conservation and prevent soil loss due to water and air erosion. As soil erosion is beside the vegetative cover density dependent also on slope, alpine grasslands are especially susceptible to erosion. Grazing is the main cause of degradation in alpine grasslands in many regions, leading to excessive erosion. According to Cerdan et al. (2010), weighted average erosion rate for grasslands is 0.3 (std. dev. 1.08) t ha-1 yr-1. Soil erosion rates for arable land are reaching 4.4 t ha-1 yr-1. Therefore, change of the grassland to arable
34 Survey on grassland ecosystem services
land use increases erosion rates approximately by 4 t ha-1 yr-1. Disturbance of permanent vegetation leads to a measurable increase of erosion rates, but rates are still lower than those measured on arable land or in vineyards (Cerdan et al. 2010).
5.2.5 Invasion resistance
Presence of non-native invasive species or domestic expansive species is one of the indicators of habitat degradation. Disturbed habitats with high human pressures are the most sensitive to invasive species. To assess the susceptibility of a habitat to invasion, habitat invasibility and level of invasion have to be discerned (Richardson and Pyšek 2006). Level of invasion is defined as an actual proportion of habitat invaded by alien species (Chytrý et al. 2008). However, level of invasion is dependent not only on habitat properties, but also on propagule pressure, climate and other characteristics. Habitat invasibility can be regarded as an indicator invasion regulation service as confounding variables (e.g. invasion pressures) are held constant. Semi-natural perennial grasslands (dry, wet and saline) or forest fringes have low levels of invasion despite relatively high invasion pressure (Chytrý et al. 2008). Low invasibility of semi-natural grasslands can be at least partially explained also by relatively high levels of biodiversity which buffers introduction of invasive species
by rapid recovery after disturbance. Generally, human dominated lowland habitats with high levels of land transformation are most invaded while nutrient limited montane habitats are less invaded (Chytrý et al. 2008). Alpine and subalpine grasslands have therefore low level of invasion and invasibility. Mown and grazed grasslands have intermediate levels of invasion but still relatively low invasibility.
5.2.6 Degradation scale
Grassland habitats with no degradation can be considered as a potential for provision of ecosystem services from grasslands. Grassland degradation can have multiple causes and usually is associated with the loss of original grassland species diversity. Therefore, undegraded semi-natural grasslands have high biodiversity levels of original species, often higher than natural habitats which are replaced by managed grasslands. Grassland degradation scale has been derived from a review of studies capturing the degradation of ecosystem services. Results of a review presented in this chapter are summarized in Table below. Description of grassland degradation has been adapted according the assessment of natural habitats in the Czech Republic.

Survey on grassland ecosystem services 35
Table 13. Degradation scale – differences in ecosystem services provision
Degradation level Description Ecosystem services level
1 No degradation
Habitat is without noticeable degradation characteristics or the degradation is negligible. There could be some negative influences in the past (water drainage, periodic grassland improvement, withdrawal of management), but these changes are not reflected by vegetation composition or the grassland is restored to a semi-natural state.
Net carbon sink (high carbon storage) High or sufficient water retention Very low or tolerable erosion rate Very low level of invasion and invasibility High aesthetic, recreational and conservation value
2 Medium degradation
The influence of driving factors is recognizable but not significant. Habitat is influenced by water drainage, natural succession or withdrawal of management. Management withdrawal or natural succession create spatially distributed degradation patterns. Synantropic species form 10-30 % of the vegetation cover.
Carbon sink or source depending on stocking levels Soil loss corresponding to tolerable rates Water runoff equals retention (around 50 % runoff coefficient) Intermediate level of invasion and invasibility Reduced aesthetic, recreational and conservation qualities
3 High degradation
Significant eutrofization and synantropization, withdrawal of management or strong natural succession. Degradation could be started by intensification and grassland improvement in the past (ploughing or seeding by forage crops). Synantropic species cover more than 50 % of a habitat area.
Net carbon source (positive balance of carbon emissions) Water runoff 70-80 % Soil loss more than 1 Mg ha-1 yr-1 High level of invasion level and invasibility Low aesthetic, recreational and conservation value
5.3 Comparison of costs and benefits of grassland ecosystem services
Grasslands are significant component of cultural landscape and serve as a source of multiple ecosystem services, including production, regulation as well as cultural services. Ecosystem services conceptual framework creates an interface between the production function of grasslands and conservation of biodiversity in a cultural landscape. Matching production intensity and biodiversity trade-offs requires assessment of payments schemes for ecosystem services (PES). Quantification of benefits and costs should generally precede designation of PES. Non-market benefits provide by grasslands could exceed conventional production and this could support nature conservation as well as orientation of agricultural subsidies towards ecologically friendly farming practices, especially in High Nature Value (HNV) and specially protected areas such as Natura 2000
network. Moreover, as still higher portion of grasslands is lost by land degradation and urbanization, the value of ecosystem services of grasslands provides information about the loss of natural capital, associated ecosystem assets and the loss of life-supporting functions critical for maintenance of socioeconomic well-being. In the Czech Republic, two main programmes providing payments for the maintenance or restoration of ecosystem services and biodiversity on grasslands are Agri-environmental programmes (AEP) and Landscape management programme (LMP).
5.3.1 Expenditures from Landscape management programme
Further, we have calculated the average expenditures on grassland management in order compare them with estimated economic value of grassland services. As in the case of invasion regulation, data were obtained from

36 Survey on grassland ecosystem services
the database of Landscape management programme. The expenditures for the year 2010 were distinguished according to protection regime: (i) grassland measurements
in the protected areas, and (ii) measurements in unprotected area. The expenditures for each grassland habitat type and number of measurements are reported in Table 14.
Table 14. Average expenditures in € per hectare and grassland type for grassland management measurement (values are in 2010 prices).
Code Protected areas Unprotected areas EUR/ha N EUR/ha N
DG Dry grasslands 380 526 843 95 AM Alluvial meadows 586 66 564 29 MG Mesic meadows 594 631 891 199 WG Seasonally wet and wet grasslands 458 858 780 179 AG Alpine and subalpine grasslands 719 158 944 35 FF Forest fringe vegetation 543 14 985 5 SM Salt marshes 395 1 810 2 HT Heathlands 525 4 729 6 Source: Landscape management programme, Agency for Nature Conservation and Landscape Protection of the Czech Republic.
5.3.2 Expenditures from Agri‐environmental programmes
Agri-environmental programmes are considered as a payment scheme for encouraging farmers to incorporate ecosystem services aspects into management. Payments for the maintenance and ecologically friendly management of grasslands are a dominant component of Czech
agri-environmental programmes. While majority of payments is devoted to ecologically sensitive management of semi-natural grasslands, some programmes are focused also on species of European importance for which grasslands are the main habitat (e.g. corncrake or waders). Total expenditures on grassland reached 24.37 million EUR in 2008 (Table 15).
Table 15. Expenditures from agri-environmental programmes, year 2010. Agri-environmental programme Sum of payments 2010 mil. EUR Grasslands total 24,37 Meadows 5,18 Mesic meadows 1,90 Alpine and dry grasslands 0,62 Wet meadows 0,24 Important Bird Areas on grasslands - waders 0,13 Important Bird Areas on grasslands - corncrake 0,53 Pastures 8,98 Species rich pastures 6,59 Dry grasslands and heathlands 0,24 Source: Institute of Agricultural Economics and Information.
5.3.3 Net present value of grassland ecosystem services
For purpose of decision-making in the nature conservation, it may be useful to view grassland services as assets that yield flows of services over time. The flows of grassland benefits (or losses / costs in terms of decline in grassland
services) are usually presented aggregated across time as a present value of ecosystem services. One way how to consider a temporal dimension of value in economic analysis is to apply discounting rates. Discounting is a method used to convert future grassland benefits or losses to net present value using an economic discount rate. The basic principle of
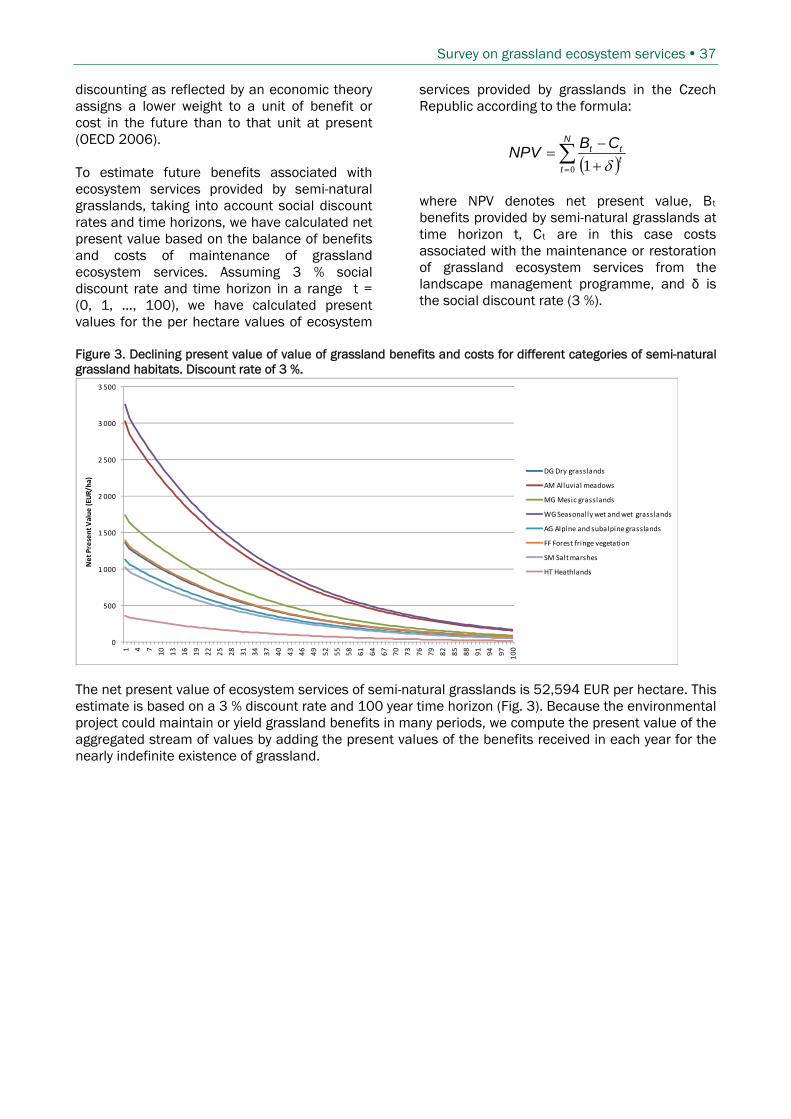
Survey on grassland ecosystem services 37
discounting as reflected by an economic theory assigns a lower weight to a unit of benefit or cost in the future than to that unit at present (OECD 2006). To estimate future benefits associated with ecosystem services provided by semi-natural grasslands, taking into account social discount rates and time horizons, we have calculated net present value based on the balance of benefits and costs of maintenance of grassland ecosystem services. Assuming 3 % social discount rate and time horizon in a range t = (0, 1, …, 100), we have calculated present values for the per hectare values of ecosystem
services provided by grasslands in the Czech Republic according to the formula:
N
tttt CB
NPV0 1
where NPV denotes net present value, Bt benefits provided by semi-natural grasslands at time horizon t, Ct are in this case costs associated with the maintenance or restoration of grassland ecosystem services from the landscape management programme, and δ is the social discount rate (3 %).
Figure 3. Declining present value of value of grassland benefits and costs for different categories of semi-natural grassland habitats. Discount rate of 3 %.
0
500
1 000
1 500
2 000
2 500
3 000
3 500
1 4 7
10
13
16
19
22
25
28
31
34
37
40
43
46
49
52
55
58
61
64
67
70
73
76
79
82
85
88
91
94
97
100
Net Present Value (EU
R/ha)
DG Dry grasslands
AM Alluvial meadows
MG Mesic grasslands
WG Seasonally wet and wet grasslands
AG Alpine and subalpine grasslands
FF Forest fringe vegetation
SM Salt marshes
HT Heathlands
The net present value of ecosystem services of semi-natural grasslands is 52,594 EUR per hectare. This estimate is based on a 3 % discount rate and 100 year time horizon (Fig. 3). Because the environmental project could maintain or yield grassland benefits in many periods, we compute the present value of the aggregated stream of values by adding the present values of the benefits received in each year for the nearly indefinite existence of grassland.

38 Survey on grassland ecosystem services
Figure 4. Net present value of semi-natural grassland habitats based on a calculation of net stream of benefits over 100 years and using 3 % discount rate.
0
20000
40000
60000
80000
100000
120000
Dry grasslands
Alluvial meadows
Mesic grasslands
Seasonally wet and wet
grasslands
Alpine and subalpine grasslands
Forest fringe
vegetation
Salt marshes
Heathlands
Net Present Value
(EUR/ha)
Net present value of semi-natural grasslands varies by nearly an order of magnitude among particular habitats, from 11 thousand EUR/ha to 103 thousand EUR/ha (Fig. 4). Current calculation doesn´t include all benefits and costs associated with semi-natural grasslands. However, it should provide a sufficiently comprehensive picture for future decisions on management of semi-natural habitats. Cost-benefit analysis is usually based on alternative options for management of ecosystem services (Birch et al., 2011). Costs usually include opportunity or restoration costs which reflect the full social cost of ecosystem services loss. Maintenance costs thus probably present only a fraction of total costs and our calculation serves rather as an illustrative example of the overall approach of accounting for full costs and benefits.
5.4 Mapping of grassland ecosystem services
Mapping of ecosystem services has gained an increasing popularity in past several years since visual information provided by maps could enhance understanding of spatial aspects of ecosystem services provision. Ecosystem services mapping is perceived as a useful tool to assess trade-offs among (various bundles of) ecosystem services when certain services could be provided far from the place of consumption
(De Groot et al., 2010). Presentation of maps also helps to make explicit the phenomenon of off-site effect which strikes the fact that local decision causes consequences on distant places (Seppelt, 2011). Mapping could assist to highlight the multifunctionality of landscape units, i.e. synergies in provision of several functions or conflicting landscape functions on the other hand. Most mapping approaches are based on land cover and so are the maps elaborated for this survey. In this mapping exercise we have made profit from the habitat approach employed to the ecosystem services quantification. The habitat approach combines assessment based on biophysical indicators and valuation with particular habitat categories. Therefore, a frequent obstacle consisting in indirect relation among land cover and biophysical and social properties of ecosystems is overcome. The mapping is based on the ‘habitat mapping layer’ what is a product of field survey conducted all over the area of the Czech Republic. The first dataset was acquired in the period of 2001–2004 for the purposes of Natura 2000 network establishment. Recently, an update of habitat mapping is being carried out starting in 2007. Every year approximately 10 % of the Czech Republic area is surveyed and thus updated. The field survey focuses on natural and semi-natural habitats preferentially;

Survey on grassland ecosystem services 39
however, artificially altered habitats are recorded as well even if in broader categories. Single habitats classified by the Habitat Catalogue of the Czech Republic17 (Chytrý, 2010) represent the basic mapping unit. Average area of natural habitats is 1,76 ha. Average area of all habitats including artificially altered habitats is 6,26 ha. Quantified amounts and values of ecosystem services of particular habitats (categories of habitats respectively – see Table 2) were transferred into habitat mapping layer and displayed on map using ArcView 3.3 software. The habitat mapping layer provides resolution on a very fine scale what enhances accuracy at a local level, however, hinders understanding of the message on a larger scale like the total area of the Czech Republic (see Annex II – monetary value of water regulation). Therefore, we aggregated habitats into larger space units. The most appropriate unit of aggregation seems to be an administrative unit used in the Czech Republic called ORP18, which is in between of NUTS 4 (LAU 1) and NUTS 5 (LAU 2) according to the area and number of inhabitants. There are 206 ORPs in the CR with the average area 373 km2 and 51 000 inhabitants in average. Area of grasslands in each OPR was computed and consequently the biophysical quantities or values of ecosystem services provided by grassland ecosystems in each OPR were recalculated on the amount/value per OPR (compare amounts or values calculated per hectare – Table 6 and Table 7). Thus, each mapping unit (ORP) shows the amount of service provided by grasslands situated in this respective OPR. In order to make the information clearer, we added a raster showing the area of grasslands in each ORP.
17 Habitat Catalogue of the CR classifies the habitats on finer scale than EUNIS and relies basically on phytosociological classification while the correspondence to EUNIS and habitats defined in Annex I of the Habitat Directive is maintained. There are 140 basic units defined in the Catalogue. 18 „obce s rozšířenou působností“
As most of the services calculated are correlated and thus most of the maps would be alike, we produced only 4 maps as an example (see Table 16). The actual maps are presented in separate JPG files as an Annex II to this report. Table 16. Maps of ecosystem services attached in Annex II ecosystem
service displayed on map
mapping unit
1 carbon sequestration
biophysical quantity
ORP
2 livestock provision
biophysical quantity
ORP
3 water regulation economic value
habitat
4 sum of (monetary values of) all valuated services
economic value
ORP
This mapping exercise showed us that there is a powerful tool available for capturing the value and amount of services flow in the spatial scale. The habitat approach to ecosystem services assessment together with the habitat mapping layer provide very precise input for analysis of spatial trade-offs and off-site effects. However, additional methods of analysis and visualisation are needed in order to explore the multifunctionality of ecosystems and to derive meaningful outcomes for decision-making regarding e.g. the sustainable use of ecosystem services. Most of such techniques still remain to be developed (De Groot, 2010). Moreover, decision making based on spatial analysis would make sense only if all (main) ecosystems were included as a lot of ecosystem services are provided by more than one ecosystem, e.g. grassland.

40 Survey on grassland ecosystem services
6 Overall conclusions19 Grasslands provide substantial flow of benefits which reaches 2647 EUR per hectare on average while many other services couldn’t be valuated what means that the total value of grassland ecosystem services is most probably even higher than that. The quantification of ecosystem services based on habitat approach allowed us to appreciate differences in the level of ecosystem services provision among various categories of habitats. We could see that the flow of benefits might be two times higher or even more if we compare natural and semi-natural habitats (e.g. alluvial meadows or wet grasslands) to managed grasslands and pastures in terms of per hectare amounts. This applies even to the provision services. The assumption of significance of natural habitats for provision of ecosystem services was further supported by the findings of the literature review which compared the conditions which either support or impede the provision of ecosystem services. There are only 4 ecosystem services sufficiently treated in the literature, however, this selection demonstrates that the influence of biodiversity increasing agricultural measures positively influence the ecosystem services provision while biodiversity decreasing activities reduce ecosystem service performance. The reduction of biodiversity could by either caused by deliberate change in land use or by failures in management like water drainage, eutrofization, acidification and nitrogen deposition, invasive alien species etc. Grassland degradation has probably more moderate effects on ecosystem services than conversion to other land uses. However, evidence suggests that effects of habitat degradation on ecosystem services and biodiversity can be still substantial. This survey has made a substantial progress and increased our ability to make informed decision on the sustainability of grasslands ecosystem services. However, even if such substantial achievement was reached, we
19 Please not that due to the process of elaboration of this report when the chapters were elaborated separately by different partners there are conclusions of each chapter presented at the end of the respective chapter. Therefore, please for more details on the outcomes of quantification of ecosystem services, review on ecosystem service trade-offs as a result of land use change etc. please refer to the summary or conclusion of the particular chapter.
ended up in front of a mosaic of findings which is still too sparse to allow us to make sound conclusions. To be able to fully appreciate all effects of different grassland use and management including conservation and to include that knowledge into decision making, we need to further elaborate quantification of ecosystem services provision by grassland under alternative use (turn to cropland or fields for biofuel production, change in intensity of management, abandonment, conservation etc.) including grassland degradation. Considerations on sustainable use of ecosystem services require also to fully implement not only all benefits provided by ecosystems but also all costs connected with ecosystem management and conservation. Not only a complete bundle of ecosystem services have to be taken into account, but services of all or at least the main ecosystems must be included since the same or similar service is often provided by various ecosystems. Therefore, considerations on balanced utilization of ecosystem services as well as optimized trade-offs among alternative management schemes should be based on the complete overview of ecosystem services provision options. It is necessary to interpret conclusions of this study with caution, especially these which are based on data derived from literature (and not original studies or field data collection). Moreover, literature shows that local conditions like edaphic conditions, climate or slope (e.g. DeFries et al., 2004; De Groot et al., 2010; Matzdorf et al., 2010) could significantly influence the level of ecosystem services provision. Lessons learned from some assessments (e.g. UK National Ecosystem Assessment, 2011) tells us that also other features in ecosystem services assessment besides data gathering and analysis play a role in streamlining ecosystem services into decision making. Especially the process of assessment has a crucial influence on the acceptance of assessment outcomes. Stakeholders perceive higher ownership of the results and are more prone to accommodate their activities if they are involved in the process of assessment.
Survey on grassland ecosystem services 41
7 References Abberton, M., Conant, R. T. and Batello, C., 2010, ‘Grassland carbon sequestration: management, policy
and economics Proceedings of the Workshop on the role of grassland carbon sequestration in the mitigation of climate change‘, Integrated Crop Management, (11).
Ash, N., Blanco, H., Brown, C., Garcia, K., Henrichs, T., Lucas, N., Raudsepp-Hearne, C., Bazzoffi, P. 2009. Soil erosion tolerance and water runoff control: minimum environmental standards.
Regional Environmental Change 9: 169–179. Birch, J.C., Newton, A.C., Aquino, C.A., Cantarello, E., Echeverría, C., Kitzberger, T., Schiappacasse, I.,
Garavito, N.T., 2010. Cost-effectiveness of dryland forest restoration evaluated by spatial analysis of ecosystem services. Proceedings of the National Academy of Sciences, in press.
Brander, L., Ghermandi, A., Kuik, O., Markandya, A., Nunes, P.A.L.D., Schaafsma, M., Wagtendong, A. 2008. Scaling up ecosystem services values: methodology, applicability and a case study.
Bullock, J.M., Pywell, R.F., Walker, K.J. 2007. Long-term enhancement of agricultural production by restoration of biodiversity. Journal of Applied Ecology 44: 6–12.
Butler, D.M., Ranells, N.N., Franklin, D.H., Poore, M.H., Green Jr, J.T., 2008. Runoff water quality from manured riparian grasslands with contrasting drainage and simulated grazing pressure. Agriculture, Ecosystems & Environment 126, 250–260.
Carvell, C., 2002, ‘Habitat use and conservation of bumblebees (Bombus spp.) under different grassland management regimes’, Biological Conservation, (103) 33–49.
Carvell, C., Roy, D. B., Smart, S. M., Pywell, R. F., Preston, C. D. and Goulson, D., 2006, ‘Declines in forage availability for bumblebees at a national scale’, Biological Conservation, (132) 481–489.
Cerdan, O., Govers, G., Le Bissonnais, Y., Van Oost, K., Poesen, J., Saby, N., Gobin, A., Vacca, A., Quinton, J., Auerswald, K., Klik, A., Kwaad, F.J.P.M., Raclot, D., Ionita, I., Rejman, J., Rousseva, S., Muxart, T., Roxo, M.J., Dostal, T., 2010. Rates and spatial variations of soil erosion in Europe: A study based on erosion plot data. Geomorphology 122, 167–177.
Collins, S. L., Knapp, A. K., Briggs, J. M., Blair, J. M. and Steinauer, E. M., 1998, ‘Modulation of diversity by grazing and mowing in native tallgrass prairie‘, Science, (280) 745–747.
Conant, R. T., Paustian, K. and Elliott, E. T., 2001, ‘Grassland management and conversion into grassland: effects on soil carbon‘, Ecological Applications, (11) 343–355.
Cop, J., Vidrih, M. and Hacin, J., 2009, ‘Influence of cutting regime and fertilizer application on the botanical composition, yield and nutritive value of herbage of wet grasslands in Central Europe’, Grass and Forage Science, (64) 454–465.
Costanza, R., d’Arge, R. ,de Groot, R., Farber, S., Grasso, M., Hannon, B., Limburg, K., Naeem, S., O’Neill, R., Paruelo, J., Raskin, R. G., Sutton, P. and Van den Belt, M., 1997, ‘The value of the world´s ecosystem services and natural capital’, Nature, (387) 253–260.
Costanza, R., R. D'Arge, et al. 1997. The value of the world's ecosystem services and natural capital. Nature 387: 253–260.
Coulon, J.-B., Delacroix-Buchet, A., Martin, B., Pirisi, A., 2004. Relationships between ruminant management and sensory characteristics of cheeses: a review. Lait 84: 221–241.
Dawson, J. J. C. and Smith, P., 2007, ‘Carbon losses from soil and its consequences for land-use management‘, Science of the Total Environment, (382) 165–190.
De Deyn, G. B., Shiel, R. S., Ostle, N. J., McNamara, N. P., Oakley, S., Young, I., Freeman, C., Fenner, N., Quirk, H. and Bardgett, R. D., 2011, ‘Additional carbon sequestration benefits of grassland diversity restoration‘, Journal of Applied Ecology, (48) 600–608.
De Fries, R. S., Foley, J. A. and Asner, G. P., 2004, ‘Land-use choices: balancing humans needs and ecosystem function’, Frontiers in Ecology and Environment, (2) 249–257.
De Groot, R. S., Alkemade, R., Braat, L., Hein, L. and Willemen, L., 2010, ‘Challenges in integrating the concept of ecosystem services and values in landscape planning, management and decision making’, Ecological Complexity, (7) 260–272.
De Groot, R. S., Wilson, M. A., Boumans, R. M. J., 2002, ‘A typology for the classification, description and valuation of ecosystem functions, goods and services’, Ecological Economics, (41) 393–408.
Delgado, C., M. Rosegrant, et al. 1999. Livestock to 2020: The Next Food Revolution. Food, Agriculture, and the Environment Discussion Paper 28. International Food Policy Research Institute, 72 pp.
Duelli, P. and Obrist, M. K., 2003, ‘Regional biodiversity in an agricultural landscape: the contribution of seminatural habitat islands’, Basic and applied Ecology, (4) 129–138.
Dušek, K., Dušková, E., Smékalová, K., 2010. Genetic Diversity of Selected Medicinal Plants in Protected Landscape Areas in the Czech Republic. Czech J. Genet. Plant Breed. 46, S34–S36.

42 Survey on grassland ecosystem services
EASAC (2009). Ecosystem Services and Biodiversity in Europe, pp. 79. EASAC Policy Report 09. The Royal Society, London.
Ebeling, A., Klein, A.-M., Schumacher, J., Weisser, W. W. and Tscharntke, T., 2008, ‘How does plant richness affect pollinator richness and temporal stability of flower visits’, Oikos, (117) 1808–1815.
EEA, 1999. Groundwater quality and quantity in Europe. European Environment Agency, Copenhagen. Elgersma, A. and Schlepers, H., 1997, ‘Performance of white clover/perennial ryegrass mixtures under
cutting’, Grass and Forage Science, (52) 134–146. Environ Holdings, 2011, ‘Carbon sequestration‘, http://www.carbonventures.com. EVIGEZ, http://genbank.vurv.cz/genetic/resources/ FAOSTAT, 2009. Statistical Database 2007. Rome. Fargione, J., Hill, J., Tillman, D., Polasky, S. and Hawthorne, P., 2008, ‘Land Clearing and the Biofuel
Carbon Debt’, Science, (319) 1235-1238. Fenster, C. B., Armbruster, W. S., Wilson, P., Dudash, M. R. and Thomson, J. D., 2004, ‘Pollination
syndromes and floral specialization’, Annual Review of Ecology Evolution and Systematics, (35) 375–403.
Fornara, D. A., and Tilman, D., 2008, ‘Plant functional composition influences rates of soil carbon and nitrogen accumulation‘, Journal of Ecology, (96) 314–322.
Frank, D. A., Kuns, M. M. and Guido, R., 2002, ‘Consumer control of grassland plant production’, Ecology, (83) 602–606.
Franzluebbers, A.J., 2009. Soil organic carbon in managed pastures of the southeastern United States of America. In: Grassland carbon sequestration: management, policy and economics. Food and Agricultural Organization, Roma, pp. 163–175.
Garibaldi, L.A., Steffan-Dewenter, I., Kremen, C., Morales, J.M., Bommarco, R., Cunningham, S.A., Carvalheiro, L.G., Chacoff, N.P., Dudenhöffer, J.H., Greenleaf, S.S., Holzschuh, A., Isaacs, R., Krewenka, K., Mandelik, Y., Mayfield, M.M., Morandin, L.A., Potts, S.G., Ricketts, T.H., Szentgyörgyi, H., Viana, B.F., Westphal, C., Winfree, R., Klein, A.M., 2011. Stability of pollination services decreases with isolation from natural areas despite honey bee visits. Ecology Letters, DOI: 10.1111/j.1461-0248.2011.01669.x.
Gibson, D. J., 2009. Grasses and grassland ecology. Oxford University Press, 305 pp. Gough, L. and Grace, J. B., 1998, ‘Herbivore effects on plant species density at varying productivity
levels’, Ecology, (79) 1586–1594. Greenleaf, S. S., Williams, N. M., Winfree, R. and Kremen, C., 2007, ‘Bee foraging ranges and their
relationship to body size’, Oecologia, (153) 589–596. Guo, L.B., Gifford, R.M., 2002. Soil carbon stocks and land use change: a meta analysis. Global Change
Biology 8, 345–360. Hakova, A., Klaudisova, A., Sadlo, J. (eds.)., et al. 2004. Management principles of the nonforest
biotopes within the framework of Natura 2000. Planeta XII, 3/2004, Ministry of Environment, 144 pp.
Harrison, P., Vandewalle, M., Sykes, M., Berry, P., Bugter, R., de Bello, F., Feld, C., Grandin, U., Harrington, R., Haslett, J., Jongman, R., Luck, G., da Silva, P., Moora, M., Settele, J., Sousa, J., Zobel, M., 2010. Identifying and prioritising services in European terrestrial and freshwater ecosystems. Biodiversity and Conservation 19, 2791–2821.
Heidenreich, B. 2009. What are global temperate grasslands worth? A case study for their protection. Temperate Grasslands Conservation Initiative, Vancouver, 51 pp.
Hejcman, M., Schellberg, J. and Pavlu, V., 2010, ‘Long-term effects of cutting frequency and liming on soil chemical properties, biomass production and plant species composition of Lolio-Cynosuretum grassland after the cessation of fertilizer application’, Applied Vegetation Science, (13) 257–269.
Helm, A., Oja, T., Saar, L., Takkis, K., Talve, T., Pärtel, M., 2009. Human influence lowers plant genetic diversity in communities with extinction debt. Journal of Ecology 97, 1329–1336.
Hooper, D.U., Chapin, F.S., Ewel, J.J., Hector, A., Inchausti,P., Lavorel, S., Lawton, J.H., Lodge, D.M., Loreau, M., Naeem, S., Schmid, B., Setala, H., Symstad, A.J., Vandermeer,J. Wardle, D.A., 2005. Effects of biodiversity on ecosystem functioning: a consensus of current knowledge. Ecological Monographs 75, 3–35.
Hopkins, A., 2009. Relevance and functionality of semi-natural grasslands in Europe – status quo and future prospective. International workshop of the SAVERE-Project, pp. 9–14.

Survey on grassland ecosystem services 43
http://www.salvereproject.eu/downloads/workshop_may_2009/SALVERE_May_2009_hopkins.pdf.
Chanasyk, D.S., Mapfumo, E., Willms, W., 2003. Quantification and simulation of surface runoff from fescue grassland watersheds. Agricultural Water Management 59, 137–153.
Chytrý M. (ed.). 2007. Vegetace České republiky 1 – Travinná a keříčková vegetace. (Vegetation of the Czech Republic 1 – Grassland and Heathland Vegetation. Praha: Academia. ISBN: 978-80-200-1462-7. (in Czech).
Chytrý M., Jarošík V., Pyšek P., Hájek O., Knollová I., Tichý L. & Danihelka J. 2008. Separating habitat invasibility by alien plants from the actual level of invasion. Ecology 89: 1541–1553.
Chytrý, M. at al. 2010. Katalog biotopů České republiky (Habitat Catalogue of the Czech Republic). Praha: Agentura ochrany přírody a krajiny ČR. Second edition. (in Czech).
Jankowska-Huflejt, H., 2006. The function of permanent grasslands in water resources protection. Journal of Water and Land Development 10, 55–654. DOI: 10.2478/v10025-007-0005-7
Jauker, F., Bondarenko, B., Becker, H.C., Steffan-Dewenter, I., 2011. Pollination efficiency of wild bees and hoverflies provided to oilseed rape. Agricultural and Forest Entomology, DOI: 10.1111/j.1461-9563.2011.00541.x.
Jones, M.B., Donnelly, A. 2004. Carbon sequestration in temperate grassland ecosystems and the influence of management, climate and elevated CO2. New Phytologist 164: 423–439.
Jongepierová, I. 2008. Louky Bílých Karpat. (White Carpathian Meadows). Veselí nad Moravou: ZO ČSOP Bílé Karpaty. ISBN: 978-80-903-444-6-4. (in Czech),
Kayser, M. and Isselstein, J., 2005, ‘Potassium cycling and losses in grassland systems: a review‘, Grass and Forage Science, (60) 213–224.
Kirwan, L., Lüscher, A., Sebastia, M. T., Finn, J. A., Collins, R. P., Porqueddu, C., Helgadottir, S., Baadshaug, O. H., Brophy, C., Coran, C., Dalmannsdottir, S., Delgado, I., Elgersma, A., Fothegill, P., Frankow-Lindberg, B. E., Golinski, P., Grieu, P., Gustavsson, A. M., Höglind, M., Hueguenin-Elie, O., Iliadis, C., Jorgensen, M., Kadziuliene, Z., Karyotis, T., Lunnan, Malengier, M., Maltoni, S., Meyer, V., Nyfeler, D., Nykanen-Kurki, P., Parente, J., Smit, H. J., Thumm, U. and Connolly, J., 2007, ‘Evenness drives consistent diversity effects in intensive grassland systems across 28 European sites’, Journal of Ecology, (95) 530–539.
Knapp, A. K., Blair, J. M., Briggs, J. M., Collins, S. L., Hartnett, D. C., Johnson, L. C. and Towne, E. G., 1999, ‘The keystone role of bisons in North American tallgrass prairie’, Bioscience, (49) 39–50.
Kohler, F., Verhulst, J., Knop, E., Herzog, F. and Kleijn, D., 2007, ‘Indirect effects of grassland extensification schemes on pollinators in two contrasting European countries’, Biological Conservation, (135) 302–307.
Kremen, C., Neal, M., Williams, N. M., Aizen, M. A., Gemmill-Herren, B., LeBuhn, G., Minckley, R., Packer, L., Potts, S. G., Roulston, T., Steffan-Dewenter, I., Va´ zquez, D. P., Winfree, R., Adams, L., Crone, E. E., Greenleaf, S. S., Keitt, T. H., Klein, A.-M., Regetz, J. and Ricketts, T. H., 2007, ‘Pollination and other ecosystem services produced by mobile organisms: a conceptual framework for the effects of land-use change’, Ecological Letters, (10) 299–314.
Křůmalová, V., Pražan, J., Drlík, J., 2000. Ohodnocení vybraných veřejných statků pocházejících ze zemědělství (Valuation of selected public goods from agriculture). Výzkumný ústav zemědělské ekonomiky, Praha.
Kubíková J. 2005. Ekologie vegetace střední Evropy – Díl I. (Vegetation Ecology of Central Europe – 1st Part). Praha: Karolinum. ISBN 80-7184-870-0. (in Czech).
Kuik, O. (2007): The Avoidance Costs of Greenhouse Gas Damage: A Meta-Analysis, CASES project, WP3, European Commission.
Kuik, O., Brander, L., Nikitina, N., Navrud, S., Magnussen, K., Fall, E.H., 2007. WP3 Report on the monetary valuation of energy related impacts on land use changes, acidification, eutrophication, visual intrusion and climate change. CASES project. European Commission.
Kvapilík et al. 2009. Ruminants breeding and permanent grasslands: Calculation method of permanent grassland utilization.
Landis, D.A., Gardiner, M.M., Van Der Werf, W., Swinton, S.M. 2008. Increasing corn for biofuel production reduces biocontrol services in agricultural landscapes. Proceedings of the National Academy of Sciences of the United States of America 105 (51): 20552–20557
Le Feon, V., Schermann-Legionnet, A., Delettre, Y., Aviron, S., Billeter, R., Bugter, R., Hendrickx, F., and Burel, F., 2010, ‘Intensification of agriculture, landscape composition and wild bee communities: A large scale study in four European countries’, Agriculture Ecosystems and Environment, (137) 143–150.
44 Survey on grassland ecosystem services
Leitinger G., Tasser, E., Newesely, C., Obojes, N., Tappeiner, U. 2010. Seasonal dynamics of surface runoff in mountain grassland ecosystems differing in land use. Journal of Hydrology 385: 95–104.
Lindemann-Matthies, P., Junge, X. and Matthies, D., 2010, ‘The influence of plant diversity on people´s perception and aesthetic appreciation of grassland vegetation‘, Biological conservation, (143) 195–202.
Loeser, M. R. R., Sisk, T. D. and Crews, T. E., 2007, ‘Impact of grazing intensity in an Arizona grassland’, Conservation Biology, (21) 87–97.
Lüscher, A., Finn, J. A., Connolly, J., Sebastià, M. T., Collins, R., Fothergill, M., Porqueddu, C., Brophy, C., Huguenin-Elire, O., Kirwan, L., Nyfeler, D. and Helgadóttir, A., 2008, ‘Benefits of sward diversity for agricultural grassland’, Biodiversity, (9) 29–32.
Maczko, K., Hidinger, L. (Editors). 2008. Sustainable rangelands ecosystem goods and services. Sustainable Rangelands Roundtable, SRR Monograph No. 3, 120 pp.
Maeder, P., Fliessbach, A., Dubois, D., Gunst, L., Fried, P., Niggli, U., 2002. Soil Fertility and Biodiversity in Organic Farming. Science 296, 1694–1697.
Maes, J., Paracchini, M. L. and Zulian, G., 2011, A European assessment of the provision of ecosystem services, JRC Scientific and Technical Reports, European Commission Joint Research Centre Luxembourg.
Martens, D. und Bauer, N., 2011, ‘Erholung in unterschiedlich genutzten Landwirtschaftsgebieten‘, Natur und Landschaft, (86) 307–311.
Marzetti, S., Disegna, M., Villani, G., Speranza, M., 2011. Conservation and recreational values from semi-natural grasslands for visitors to two Italian parks. Journal of Environmental Planning and Management 54, 169–191.
Matzdorf, B., Reutter, M. und Hübner, C., 2010, Bewertung der Ökosystemdienstleistungen von HNV-Grünland, Bundesamt für Naturschutz, Leibniz-Zentrum für Agrarlandschaftsforschung (ZALF) e. V., Müncheberg, Institut für Siozioökonomie.
Menneer, J. C., Ledgard, S., McLay, C. and Silvester, W. W., 2004, ‘The impact of grazing animals on N2 fixation in legume-based pastures and management options for improvement’, Advances in Agronomy, (83) 181–241.
Millennium Assessment. 2005. Ecosystems and human well-being: synthesis. World Resources Institute, Island Press, Washington.
Mládek J., Pavlů V., Hejcman M. et Gaisler J. (eds.). 2006. Pastva jako prostředek údržby trvalých travních porostů v chráněných územích. (Grazing as a Tool of Permanent Grasslands Maintenance in Protected Areas). Praha: Výzkumný ústav rostlinné výroby. ISBN: 80-86555-76-3. (in Czech).
Nevens, F. and Rehuel, D., 2003, ‘Effects of cutting or grazing grass swards on herbage yield, nitrogen uptake and residual soil nitrate at different levels of N fertilization', Grass and Forage Science, (58) 432–449.
Nyfeler, D., Huguenin-Elie, O., Suter, M., Frossard, E. and Lüsch, A., 2011, ‘Grass–legume mixtures can yield more nitrogen than legume pure stands due to mutual stimulation of nitrogen uptake from symbiotic and non-symbiotic so’, Agriculture, Ecosystems and Environment, (140) 155–163.
Nyfeler, D., Huguenin-Elie, O., Suter, M., Frossard, E., Connolly, J. and Lüsch, A., 2009, ‘Strong mixture effects among four species in fertilized agricultural grassland led to persistent and consistent transgressive overyielding’, Journal of Applied Ecology, (46) 683–691.
OECD, 2004. Handbook of market creation for biodiversity: Issues in implementation. Paris. ISBN 92-64-01861-1.
OECD. 2006. Cost-Benefit Analysis and the Environment. Recent Developments. Secretary-General of the OECD. Paris, France. ISBN 92-64-01004-1.
Olde Venterink, H., Vermaat, J.E., Pronk, M., Wiegman, F., van der Lee, G.E.M., van den Hoorn, M.W., Higler, L.W.G., Verhoeven, J.T.A., 2006. Importance of sediment deposition and denitrification for nutrient retention in floodplain wetlands. Applied Vegetation Science 9, 163–174.
Olff, H. and Bakker, J. P., 1991, ‘Long-term dynamics of standing crop and species composition after the cessation of fertilizer application to mown grassland’, Journal of Applied Ecology, (28) 1040–1052.
Phoenix, G.K., Booth, R.E., Leake, J.R., Read, D.J., Grime, J.P., Lee, J.A., 2003. Effects of enhanced nitrogen deposition and phosphorus limitation on nitrogen budgets of semi-natural grasslands. Global Change Biology 9, 1309–1321.

Survey on grassland ecosystem services 45
Picó, F.X., Van Groenendael, J., 2007. Large-scale plant conservation in European semi-natural grasslands: a population genetic perspective. Diversity and Distributions 13, 920–926.
Pimentel. D., Harvey C., Resosudarmo P., Sinclair K., Kurz D., McNair M., Crist S., Shpritz L., Fitton L., Saffouri R., Blair R., 1995. Environmental and economic costs of soil erosion and conservation benefits. Science 267: 1117–1123.
Poschlod, P., Bakker, J.P., Kahmen, S. 2005. Changing land use and its impact on biodiversity. Basic Appl Ecol 6: 93–98.
Pyšek, P., Kučera, T., Jarošík, V., 2002. Plant species richness of nature reserves: the interplay of area, climate and habitat in a central European landscape. Global Ecology and Biogeography 11: 279–289.
Ramankutty, N., Evan, A. T., Monfreda, C. and Foley, J. A. 2008. ‘Farming the planet: 1 Geographic distribution of global agricultural lands in the year 2000‘, Global Biogeochemistry, Cycles, (22), GB1003.
Redpath, N., Osgathorpe, L. M., Park, K. and Goulson, D., (2010), Crofting and bumblebee conservation: ‘The impact of land management practices on bumblebee populations in northwest Scotland’, Biological Conservation, (143) 482–500.
Ricketts, T.H., Regetz, J., Steffan-Dewenter, I., Cunningham, S.A., Kremen, C., Bogdanski, A., Gemmill-Herren, B., Greenleaf, S.S., Klein, A.M., Mayfield, M.M., Morandin, L.A., Ochieng’, A., Viana, B.F., 2008. Landscape effects on crop pollination services: are there general patterns? Ecology Letters 11, 499–515.
Richardson, D.M., Pyšek, P., 2006. Plant invasions: merging the concepts of species invasiveness and community invasibility. Progress in Physical Geography 30, 409–431.
Rodriguez, J. P., Beard Jr., T. D., Bennett, E. M., Cumming, G. S., Cork, S. J., Agard, J., Dobson, A. and Peterson, G. D., 2006, ‘Trade-offs across space, time, and ecosystem services’, Ecology and Society, (11): 28.
Rose, L., Coners, H., Leuschner, C., 2011. Effects of fertilization and cutting frequency on the water balance of a temperate grassland. Ecohydrology, in press.
Rybanič, R., Šeffer, J., Čierna, M., 1999. Economic valuation of benefits from conservation and restoration of floodplain meadows. In Šeffer, J., Stanová, V. (eds.), Morava River Floodplain Meadows – Importance, Restoration and Management. DAPHNE – Centre for Applied Ecology, Bratislava, pp. 147–160.
Sala, O.E., et al., 1996. Biodiversity and ecosystem functioning in grasslands. In: Mooney, H.A., Cushman, J.H., Medina, E., Sala, O.E., Schulze, E.D. (Eds.), Functional roles of biodiversity: a global perspective. SCOPE 55, John Wiley & Sons.
Schlesinger, W. H., 1977, ‘Carbon balance in terrestrial detritus’, Annual Review of Ecology Systematics, (8) 51–81.
Seppelt, R., et al, 2011. A quantitative review of ecosystem services studies: approaches, shortcomings and the road ahead. Journal of Applied Ecology, (48) 630–636. Available online: <DOI: 10.1111/j.1365-2664.2010.01952.x>.
Simpson, R. D., Scholes, R., Tomich, T. B., Vira, B. and Zurek, M. (eds), 2010, Ecosystems and Human Well-being – A Manual for assessment practitioners, Island Press, Washington.
Sjödin, N. J., 2007, ‘Pollinator behavioural responses to grazing intensity’, Biodiversity and Conservation, (16) 2103–2121.
Sjödin, N. J., Bengtsson, L. and Ekbom, B., 2008, ‘The influence of grazing intensity and landscape composition on the diversity of flower-visiting insects’, Journal of Applied Ecology, (45) 763–772.
Smit, H. J., Metzger, M. J. and Ewert, F., 2008, ‘Spatial distribution of grassland productivity and land use in Europe’, Agricultural systems, (98) 208–219.
Soussana, J.-F., Louiseau, P., Vuichard, N., Ceschia, E., Balesdent, J., Chevallier, T., Arrouays, D. 2004. Carbon cycling and sequestration opportunities in temperate grasslands. Soil Use and Management 20: 219–230.
Statistik Austria, 2010, Statistik der Landwirtschaft 2009, Wien. Steffan-Dewenter, I. and Tscharntke, T., 2001, ‘Succession of bee communities on fallows’, Ecography,
(24) 83–93. Thiel-Egenter, C., Risch, A. C., Jurgensen, M. F., Page-Dumroese, D. S., Krüsi, B. O. and Schütz, M.,
2007, ‘Response of a subalpine grassland to simulated grazing: aboveground productivity along soil phosphorus gradients’, Community Ecology, (8) 111–117.
46 Survey on grassland ecosystem services
Tilman, D., Hill, J. and Lehman, C., 2006, ‘Carbon –Negative Biofuels from Low-Input High-Diversity Grassland Biomass’, Science, (314) 1598-1600.
Tol, R. S. J. 2005. The Marginal Damage Costs of Carbon Dioxide Emissions, Energy Policy, 33: 2064-2084.Tonn, B., Thumm, U., Claupein, W., 2010. Semi-natural grassland biomass for combustion: influence of botanical composition, harvest date and site conditions on fuel composition. Grass and Forage Science 65, 383–397.
Turner, R. K., Daily, G.C. 2008. The Ecosystem Service Framework and Natural Capital Conservation. Environmental and Resource Economics 39: 25–35.
UK National Ecosystem Assessment, 2011. The UK National Ecosystem Assessment: Synthesis of the Key Findings. Cambridge: UNEP-WCMC. pp. 85.
Unkovich, M., Sanford, P., Pate, J. and Hyder, M., 1998, ‘Effects of grazing on plant and soil nitrogen relations of pasture-crop rotations’, Australien Journal of Agricultural Research, (49) 475–485.
Vačkář, D., Melichar, J., Lorencová, E., 2010. Ecosystem services of grasslands in the Czech Republic. Final report of a pilot study for Agency for Nature Conservation and Landscape Protection of the Czech Republic, Charles University Environment Center, Prague, 75 pp.
van Eekeren, N., de Boer, H., Hanegraaf, M., Bokhorst, J., Nierop, D., Bloem, J., Schouten, T., de Goede, R., Brussaard, L., 2010. Ecosystem services in grassland associated with biotic and abiotic soil parameters. Soil Biology and Biogeochemistry 42: 1491–1504.
Vera F. W. M. 2000. Grazing ecology and forest history. Waltingford: CABI Publishing. Verheijen F.G.A., Jones R.J.A., Rickson R.J., Smith C.J. 2009. Tolerable versus actual soil erosion rates in
Europe. Earth-Science Reviews 94: 23–38. Vinther, F. D., 2006, ‘Effects of cutting frequency on plant production, N-uptake and N2 fixation in
above- and below-ground plant biomass of perennial ryegrass-white clover swards’, Grass and Forage Science, (61) 154–163.
Wallis DeVries, M.F., Poschlod, P., Willems, J.H. 2002. Challenges for the conservation of calcareous grasslands in northwestern Europe: Integrating the requirements of flora and fauna. Biological Conservation 104 (3), 265–273.
Weigelt, A., Weisser, W. W., Buchmann, N. and Scherer-Lorenzen M., 2009, ‘Biodiversity for multifunctional grasslands: equal productivity in high-diversity low-input and low-diversity high-input systems’, Biogeosciences, (6) 1695–1706.
Werling, B.P., Meehan, T.D., Robertson, B.A., Gratton, C., Landis, D.A., 2011. Biocontrol potential varies with changes in biofuel–crop plant communities and landscape perenniality. GCB Bioenergy 3, 347–359.
White, D. H., G. Lubulwa, et al. 2000. Global agro-climatic analyses of livestock numbers and commodities as the basis for research priority setting. Asian-Australasian Journal of Animal Sciences 13(SUPPL. 1): 328–331.
Willems, J.H. 2001. Problems, approaches, and results in restoration of Dutch calcareous grassland during the last 30 years. Restoration Ecology 9 (2): 147–154.
Wilson, S.J., 2009. The value of BC´s grasslands: exploring ecosystem values and incentives for conservation. Grassland Conservation Council of British Columbia, Kamloops, 45 pp.
Zhang, G., Kang, Y., Han, G., Mei, H. and Sakurai, K., 2011, ‘Grassland degradation reduces the carbon sequestration capacity of the vegetation and enhances the soil carbon and nitrogen loss’, Acta Agriculturae Scandinavica Section B _ Soil and Plant Science, (61) 356–364.

Survey on grassland ecosystem services 47
List of tables and figures Table 1. Classification of ecosystem services (TEEB 2010)............................................................................6 Table 2. Grassland habitat categories identified in the Czech Republic. .................................................... 11 Table 3. General accounting structure of ecosystem services flows and values originating from
ecosystem assets, in this case grassland habitat types.................................................................. 11 Table 4. Average expenditures in EUR per hectare and grassland type for invasion regulation (values are
in 2010 prices) ................................................................................................................................... 14 Table 5. Summary of ecosystem services assessed, ecosystem service indicators and economic
valuation techniques used for the estimation of economic value of a habitat. ............................. 15 Table 6. Summary of biophysical indicator assessment of grassland ecosystem assessment................. 17 Table 7. Summary of calculated monetary values of selected grassland ecosystem services.................. 18 Table 8. Herbage productivity of different habitat types .............................................................................. 24 Table 9. Carbon sequestration rate of different habitat types according to land use changes and
specified management activities....................................................................................................... 26 Table 10. Habitat suitability for pollination service (wild bees).................................................................... 29 Table 11. Suitability of different habitat types for recreation, based on an aesthetic appreciation of
grassland vegetation.......................................................................................................................... 30 Table 12. Suitability of different habitat types for providing the following ecosystem services:
productivity, carbon sequestration, pollination and recreation....................................................... 32 Table 13. Degradation scale – differences in ecosystem services provision.............................................. 35 Table 14. Average expenditures in € per hectare and grassland type for grassland management
measurement. . .................................................................................................................................. 36 Table 15. Expenditures from agri-environmental programmes, year 2010. Source: Institute of
Agricultural Economics and Information........................................................................................... 36 Table 16. Maps of ecosystem services attached in Annex II........................................................................ 39 Figure 1. Economic value of ecosystem services per area of grassland habitat. Units are EUR in 2010
prices per ha per year. ....................................................................................................................... 16 Figure 2. Relationship between land-use change, ecological knowledge to assess ecosystem
consequences, and societal values to assess trade-offs associated with land-use decisions. ... 22 Figure 3. Declining present value of value of grassland benefits and costs for different categories of
semi-natural grassland habitats. Discount rate of 3 %.................................................................... 37 Figure 4. Net present value of semi-natural grassland habitats based on a calculation of net stream of
benefits over 100 years and using 3 % discount rate. .................................................................... 38

48 Survey on grassland ecosystem services, Annex I
1 Annex I: Ecosystem services trade‐offs The following chapters provide detailed descriptions of all relevant study results considered in the text of the following main report chapters:
5.1.2 Productivity, 5.1.3 Carbon sequestration, and 5.1.4 Pollination by insects
Content of Annex I 1.1 ...................................................................................................................................................... 48 PRODUCTIVITY
1.1.1 ............................................................................... 48 Importance of this ecosystem service for ruminants1.1.2 ................................................. 48 Which preconditions are essential for providing herbage productivity?1.1.3
............................................................................................................................................................. 50 Which habitat types and kinds of land use provide these preconditions and thus support plant
productivity?1.1.4 ............................................................. 51 Positive effects of grass-legume mixtures on plant productivity1.1.5 54 Which factors impede plant productivity and what kind of land use reduces this ecosystem service?1.1.6 ............................................ 56 Grassland yields and productivity under different management schemes
1.2 ...................................................................................................................................... 57 CARBON SEQUESTRATION1.3 .......................................................................................................................... 59 POLLINATION SERVICE BY INSECTS
1.3.1 ........................................................................................................................... 60 Importance of pollination1.3.2 ................................................................ 60 Which preconditions are essential for pollination by insects?1.3.3
................................................................................................................................................................ 61 Which habitat types and kinds of land use provide these preconditions and thus support pollination
by insects?1.3.4 ............................................................................................................ 64 Which factors impede pollination?1.3.5 .............................................................................................. 64 What kind of land use reduces pollination?1.3.6 ........... 67 What are the consequences of reducing the provision of pollination services for biodiversity?
1.4 ...................................................................................................................................... 69 REFERENCES TO ANNEX I
1.1 Productivity In this chapter, the plant productivity of different habitat types is compared on the basis of aboveground biomass per year (t dry matter ha-1 yr-1), a method which is used in most of the literature. Only a few studies are also concerned with the quality of the herbage produced and the metabolizable energy value of hay. Although these are important parameters for livestock production, they are not considered in this chapter because the data currently available are insufficient for a comparison of different grassland habitat types. Detailed study results presented below are summarized in chapter 5.1.2 of the report.
1.1.1 Importance of this ecosystem service for ruminants
European grasslands vary greatly in terms of their management, agricultural productivity, sustainability, wider socio-economic values and their nature conservation status. Herbage from various grassland habitat types is essential for hay production and is the main feed supply for domestic livestock in Europe, although there are spatial differences of productivity: Smit et al. (2008) are reporting the spatial distribution of permanent grassland productivity in Europe. The highest productivity of about 10 t ha-1 yr-1 is
achieved in the western and north-western part of Europe adjacent to the Atlantic. The regions with the lowest productivity are located in the Mediterranean, with annual yields limited to 1.5 t ha-1. The Central European areas reach fairly high yields, depending on the altitude of grassland habitats and the intensity of agricultural management schemes (in the range of 2–6 t ha-1 yr-1). Although an increasing amount of concentrate feed and other forage crops are used for the provision of feed for ruminants, grassland will continue to be of major importance for livestock production throughout Europe (Wilkins et al., 2003).
1.1.2 Which preconditions are essential for providing herbage productivity?
Grassland productivity is affected by climatic factors such as rainfall, temperature, the length of the growing season and soil quality. For European grasslands it has been found that annual precipitation is the most important factor (Smit et al., 2008). Additionally, specific habitat management practices have a considerable influence: yields and the nutritive value of grasslands are strongly affected by management factors like the cutting regime and the use of nitrogen fertilizer, which have a well-known positive effect on above-ground productivity of forage plants (Nevens and

Survey on grassland ecosystem services, Annex I 49
Rehuel, 2003). Biomass production very often comes from intensive grassland being associated with a high input of nutrients and widespread use of monocultures. Agricultural experience shows that low-diversity grasslands can be highly productive due to agricultural intensification using fertilisation, irrigation and high-yielding cultivars. On the other hand, high-diversity low-input grasslands grow on extensively managed sites are often nutrient poor and usually have low yields (Weigelt et al., 2009). In general, species richness in semi-natural grassland is negatively correlated with a high content of available soil nutrients and consequently, with high biomass production rate (Honsová et al., 2007). On semi-natural grassland, less yield variability may occur over time where raised water levels are maintained through the growing season, thus restricting the severity and duration of soil moisture deficits. As studies on agriculturally improved grasslands have shown, the application of nitrogen fertilizer allows a more effective use of water for growth, which is why it is possible that, under conditions of low soil nitrogen availability in unfertilized semi-natural grasslands, a soil moisture deficit could have a relatively large impact on yield (Tallowin and Jefferson, 1999). Grassland productivity has been increased successfully by sowing seeds of specifically designed mixtures, combining N2-fixing legume species with fast-growing grass species (Barnes et al., 2007). In agriculture, grass-clover mixtures are commonly used in the most productive grassland systems. Facilitative interactions among N2-fixing legumes and non-fixers usually decrease with soil fertility, as N2 fixation can be reduced under high fertilisation levels and because co-occurring non-fixing species are less dependent on the additional nitrogen input by legumes (Nyfelder et al., 2009). In diversity experiments the positive interactions between N2-fixing legumes and non N2-fixing plant species often contributed to a significantly larger extent to mixing effects in biomass yield than the interactions between other functional groups (Nyfeler et al., 2011). Substitution of nitrogen being applied by fertilisers by an improved exploitation of symbiotic N2 fixation in agricultural grasslands could increase sustainability and resource-efficient agricultural systems (Gruber and Galloway, 2008).
Studies on relatively species-rich and nutrient-poor grassland (Tilman et al. 1997, Hector et al., 1999, Cardinale et al., 2007) found that higher biodiversity leads to increased productivity. Under nutrient-poor conditions, more diverse plant communities are expected to acquire more of the limited growth resources and to transform them more efficiently to biomass than less diverse plant communities (Hooper et al., 2005). Reasons for this are niche differentiation of species, positive inter-specific interactions, and more highly productive species (Cardinale et al., 2007). Further reasons for the biodiversity-productivity relationship might be increased soil resource partitioning and facilitation (Reich et al., 2004) or increased light partitioning by enhanced growth form differences among species (Gross et al., 2007). In other words, more diverse communities are better utilizing available resources due to their greater occupation of niche space, and because of the fact that they have a greater probability of containing positive inter-specific interactions (Kirwan et al., 2007). Research dealing with the influence of biodiversity on productivity is focusing on species richness, the composition of species or functional groups, interspecies interactions in the community and also on the relative abundance of species, being expected to be an important determinant of the diversity-function relationship (Hooper et al., 2005). It has been suggested that biomass variability in species-richer grassland communities may be lower than in those which are poorer in species (Dodd et al., 1994). These findings are supported by an extensification experiment in the Netherlands, where yield variation was recorded for 14 years after the cessation of fertilizer application (Olff and Bakker, 1991): the yield variation between the years decreased in the later years, during which time the species richness increased. This might be due to the fact that species richness may provide a greater buffer against climatic variation than can be expressed in species-poor grasslands. Dodd and co-authors also suggest that there could be an interaction between species-richness, biomass production and soil moisture deficit, with the soil moisture deficit being a key factor influencing variability in yields between the years. This corresponds to the finding of Smith (1960) according to which a close relationship exists between hay yields and transpiration, which is in turn closely related to soil moisture deficits during the period of growth.

50 Survey on grassland ecosystem services, Annex I
1.1.3 Which habitat types and kinds of land use provide these preconditions and thus support plant productivity?
Based on the above mentioned findings relating to the conditions necessary to support herbage productivity, the following paragraphs describe the most relevant studies in greater detail, showing which grassland habitats and agricultural management schemes are suitable for advancing productivity and what yields can be achieved. A compilation of the most important results and general principles can be found in chapter 5.1.2 of the report. A study by Tallowin and Jefferson (1999) reviewed data on the productivity of different communities of lowland semi-natural grasslands in the UK. The dry matter yield being investigated by these authors is defined as the yield of cut herbage harvested above a cutting height of approx. 5 cm above ground level. The yields of dry matter from different unfertilized agriculturally unimproved semi-natural grasslands in lowland Britain when first cut in late June or July ranged from 1.5 t ha-1 to about 6.0 t ha-1 (not taking into account any losses during the hay making process). The total annual yield of dry matter for unfertilized grasslands ranged from less than 2.0 t ha-1 to approx. 8.0 t ha-1. Fertilizer application to certain communities of semi-natural grasslands led to an increased dry matter yield by 50 % to more than 100 %. On the other hand, fertilizer application resulted in changes of botanical composition. The seasonal productivity of 13 perennial grass species co-occurring in temperate semi-natural grassland communities in Europe was estimated in a field experiment conducted in France by Pontes et al. (2007). Most of these grass species are not used in agricultural systems as cultivated grass crops. Above-ground yield of dry matter (cutting height: 6 cm above ground level) was measured in two successive years being produced under two levels of nitrogen supply and two levels of cutting frequency. For all species which were grown in monoculture, dry matter yields were reduced with an increase in cutting frequency in spring, in the other seasons the yields of dry matter of most of the species were slightly stimulated by an increase in the cutting frequency. The mean dry matter yield in the spring across all species (4 t ha-1) was about twice that obtained in summer (2.2 t ha-1) and autumn (2.3 t ha-1). The mean dry matter yield
per year for the 3-cut regime was 9.2 t ha-1 yr-1 and for the 6-cut regime 7.8 t ha-1 yr-1 showing that increasing the period of regrowth from one to two months increased the amount of harvested herbage, averaged over all species. This difference was, however, greater for grasses which were highly productive at a low cutting frequency. But different responses may be observed when comparing the performance of grasses in monocultures and in plant communities. On average, an increase in nitrogen supply increased the dry matter yield per year, which was significantly higher in the plots receiving 360 kg N ha-1 yr-1 (3.2 t ha-1 yr-1) than in those with120 kg N ha-1 yr-1 (2.5 t ha-1 yr-1). The authors argue that the performance of these species under natural field conditions might be significantly reduced due to the extensive conditions and poor fertility, but the results show that some of these grassland species have a nutritive value which is comparable to that of forages selected for high yields. Cop and co-authors (2009) assessed the influence of cutting regimes and fertilizer application on several traits of two wet grassland habitats in Central Europe (Slovenia). The annual dry matter yields were averaged over the seven years and tested for the effects of cutting and fertilizer treatment. The results showed that the cutting frequency had a small to moderate negative effect on the dry matter yield. In the first experiment, the four-cut treatment led to a significantly lower yield of dry matter than the delayed two-cut and three-cut treatment (averaged over fertilizer treatment): the cutting frequency reduced annual dry matter yields from 8.35 t ha-1 under the delayed two-cut treatment to 7.64 t ha-1 with the four-cuts treatment. In the second experiment, the dry matter yield under the delayed two-cut treatment was significantly higher than the yields achieved with the two-cut and three-cut treatment under each fertilizer treatment: a higher cutting frequency reduced the annual dry matter yield from 8.26 t ha-1 under the delayed two-cuts treatment to 6.86 t ha-1 under the three cut treatment. In contrast to the cutting frequency, the application of fertilizer had a strong positive effect on the dry matter yield. The yield increased significantly in the first experiment from 5.63 t ha-1 without fertilizer to 9.25 t ha-1 yr-1 with fertilizer application PK + N, including potassium (K: 158 kg ha-1 yr-1), phosphorus (P: 31 kg ha-1 yr-1) and nitrogen (N: 100–400 kg ha-

Survey on grassland ecosystem services, Annex I 51
1 yr-1), and in the second experiment from 3.95 t ha-1 without fertilizer to 9.42 t ha-1 with the same fertilizer application as in the first experiment. In both experiments the dry matter yield was averaged over all cutting regimes. The effects of cutting or grazing on the herbage yield at different levels of N fertilization on a Flemish sandy loam soil are reported by Nevens and Rehuel (2003). Four levels of nitrogen fertilizer treatment were applied on existing grassland: 0, 100, 200 and 400 kg N ha-1 yr-1. The plots were cut (at a height of 5 cm above soil) on a production-based schedule, aiming at yields of 3.0–4.0 t dry matter ha-1 cut-1. The dry matter yield of the 400 kg N treatment (averaged over the years from 1999 to 2005) was 16.6 t ha-1 yr-1, which amounts to a very high production level compared to productivity figures published in the literature (Hopkins, 2000). High average yields were also obtained on the 100 kg N and 200 kg N plots: 13.8 and 14.7 t ha-1 yr-1 respectively. The dry matter yields are reflecting the growing and management conditions in experiments which are much better than on farmland. Moreover, harvesting, conservation and feeding losses occur under practical conditions, resulting in lower net yields. The variability of dry matter yield between the years was quite high, which may have been due to the white clover content changing between the years. As a result of an increasing amount of white clover on the unfertilized control plot, a remarkably high yield was obtained on these plots from 1997 onwards. Another factor allowing relatively high yields under zero or low N fertilization was a yield-based cutting regime: compared to a time-based regime, the cutting system which was used for this experiment allowed longer growing periods and hence, resulted in higher yields on the less fertilized plots. It has been found that in mixed swards with a low nitrogen application rate, white clover performs better if longer intervals between harvests are allowed. Species-poor grasslands which are agriculturally optimized for the single function of hay production (e.g. clover-grass mixtures) with fertiliser input (200 kg N ha-1 yr-1) and up to 6 cuts per year have been shown to achieve forage yields between 1.0 and 1.4 t ha-1 yr-1 (Tallowin & Jefferson, 1999). For Thuringia (Germany), mean forage yields have been reported to amount to 7.9 t ha-1 yr-1 for conventionally managed permanent grassland with fertilisation and 3–4 cuts yr-1 (Weigelt et a., 2009).
The effects of fertilizer application on herbage production were investigated in herb-rich wetland hay meadows in UK (Sommerset Moors) by Kirkham and Wilkins (1994). The swards were cut after 1st July each year, followed by one or two aftermath cuts. The total annual dry matter production increased from 4.7 t ha-1 without fertilizer to 10.5 t ha-1 with fertilizer application (200 kg N, 75 kg P and 200 kg K ha-1 yr-1). The results suggest that the potential output of these meadows is similar to that of a wide range of less diverse permanent pastures.
1.1.4 Positive effects of grass‐legume mixtures on plant productivity
In addition to the studies described above important field studies have been published showing the effect of grass-legume mixtures on herbage productivity: The Europe-wide COST experiment (at 840 plots in 17 countries) showed that even a moderate increase of plant species richness from one to four species (two legumes and two grasses) had strong positive effects on the above-ground biomass in intensively managed grassland: the above-ground biomass was consistently greater than expected from monoculture performance, even at high productivity levels (Kirwan et al., 2007). The plots were managed by two to five cuts per year and the annual application of nitrogen fertiliser ranged from 0 to 200 kg ha-1. However, high N application rates were not incompatible with producing diversity effects. Comparing the yield of grassland with species-mixture with the highest yielding monoculture led to estimates of average transgressive overyielding of 12 % to 16 % (i.e. biomass yield of the mixture exceeded that of the highest yielding monoculture). This diversity effect was consistent across a wide geographical scale. The productivity increasing effect was due to pairwise interactions between the species of the mixture being related to species evenness. The positive interaction between two grass species or two legume species was as strong as that between a grass and a legume. The authors are concluding that the transgressive overyielding being observed in their study strongly suggests that modest increases in agronomic species diversity can contribute to agricultural production in intensive grassland systems. But the strength of inter-specific interaction may differ in other plant communities. Additionally, patterns of species interaction may be associated with

52 Survey on grassland ecosystem services, Annex I
environmental conditions and the temporal persistence of the species in mixtures realizing the diversity effect. This is an important issue which is the basis for a long-term effect. Part of the COST experiment was an ecological experiment including fertilisation on intensively managed grasslands published by Lüscher et al. (2008), showing a positive effect of species mixtures even under very high levels of nitrogen addition: even though overyielding decreased with increasing N fertilization, transgressive overyielding was still observed at the highest fertilization rate (450 kg N ha-1 yr-1). The effects of increasing management intensities on the biodiversity-productivity relationship have been assessed for the first time in a large-scale field experiment in Germany by Weigelt et al. (2009). Using a combination of different mowing frequencies (one, two or four cuts per season) and fertilisation levels (0, 100 and 200 kg N ha-1 yr-
1) the productivity of 78 experimental grassland communities of increasing plant species richness (one to 16 species) and functional group richness (one to four functional groups including grasses, small herbs, tall herbs and legumes) were studied in two successive years. Species were selected using the approach of constrained random selection from the 60-species pool. The management intensity gradient applied to the hay meadows was ranging from low input (single mowing, no fertilisation) to high input (four times mowing, 200 kg N ha-1 yr-1) for two successive years. Annual aboveground biomass was used as a proxy for net primary productivity. In plots with higher species richness, aboveground productivity increased in both years, independent of management intensity. For example, on plots being mown twice without fertiliser application, an increase of aboveground productivity was observed from approx. 3 t ha-1 yr-1 (in low diversity grassland plots) to approx. 7.0–7.6 t ha-1 yr-1 (in high-diversity grassland plots with 16 species) and even to approx. 10.0–13.0 t ha-1 yr-1 (in high diversity grassland plots with 60 species). This effect was enlarged by the application of 100
kg N ha-1 yr-1 (and two cuts) to more than 8.0 t ha-1 yr-1. A further increase of mowing (4 cuts) and fertilisation (200 kg N ha-1 yr-1) did not lead to a further increase of productivity. Plots with a higher number of functional groups (grasses, small herbs, tall herbs and legumes) also showed significantly higher levels of aboveground productivity, but communities with three functional groups often showed higher levels of productivity than those containing all four functional groups. The presence of legumes significantly increased aboveground productivity, but the positive effect of the legumes on productivity was significantly reduced under high mowing frequencies and fertilisation. The results showed that there is a positive effect of species richness and productivity. An increasing number of species raises the productivity of each of the differently managed grasslands. Both the mowing frequency and fertiliser application had significant positive effects on productivity (see Fig. 1): increasing the mowing frequency from one to two had a positive effect on productivity; however, increasing the mowing frequency from two to four on fertilised plots had a minor negative effect on productivity on plots without legumes, and a significant negative effect on plots with legumes. In both years, higher levels of diversity were more effective in increasing productivity than higher management intensity. As agriculturally improved grasslands do not result in higher hay/forage yields compared to the highly diverse and multifunctional mixtures which produced up to approx. 1 kg ha-1 a-1 in this study, Weigelt and co-authors conclude that the biological mechanisms leading to enhanced productivity in mixtures (of species) can be as effective for yield production as a combination of several agricultural measures, including selection of highly productive cultivars and a high input of energy and fertilisers. They emphasise the fact that high diversity plots cannot be sustained in fertilised meadows (Plantureux et al., 2005) due to competitive displacement of subordinated species under nutrient input (Gough et al., 2000). Therefore, long-term experiments with highly diverse but fertilised plots are not possible.

Survey on grassland ecosystem services, Annex I 53
Annex 1, Figure 1. Above-ground biomass of plots without legumes (white bars) and with legumes (grey bars) in 2006 (open bars) and 2007 (hatched bars). Means over all plots are given for the management intensity gradient. The dashed line separates the non-fertilised (left) from the fertilised (right) plots (taken from Weigelt et al., 2009).
Nyfeler et al. (2011) quantified nitrogen acquisition of grasses and legumes from symbiotic and non-symbiotic sources and transformation of acquired N into biomass. The aim was to measure processes that drive beneficial effects of mixtures on biomass yield. In order to study interactions among the two functional groups grasses and legumes, monocultures and 21 grass-legume mixtures with the four most important agronomic species for intensive grassland were included in a field experiment which served as a model system. The design of these mixtures resulted in legume percentages of 0 %, 7 %, 20 %, 50 %, 80 % and 100 %. Three levels of nitrogen fertiliser were applied (50, 150 and 450 kg N ha-1 yr-1). Plots were cut five times a year at 5 cm above the ground surface. The results showed that the total nitrogen yield of the entire sward was clearly higher than expected from the proportional contributions of the pure grass and legume stands. Important stimulatory interactions between the two functional groups – grasses and legumes – resulted in acquisition of symbiotic nitrogen being maximised not in pure legume stands but in mixtures with 40 to 60 % legumes. This demonstrates that positive effects of mixing grasses and legumes rely not only on the direct effects of the symbiotic N2 fixation. Two processes are postulated as being responsible for this: First, increasing the percentage of grasses in mixtures stimulated the percentage of symbiotically fixed N2 in the
legume plants (activity of N2 fixation by legumes depends on the nitrogen demand of the whole sward), and second, the increased grass percentage in the sward increased the apparent nitrogen transfer of symbiotically fixed nitrogen from the legumes to the grasses. Therefore, both grasses and legumes are able to expand their acquisition of nitrogen from symbiotic sources when grown in mixtures. Only when grasses were below 40 % of sward biomass or when high amounts of N fertiliser were added to the system (450 kg N ha-1 yr-1) did the legumes reduce their N2 fixation activity. The authors conclude that the positive effects (of mixing grasses and legumes) on biomass production do not rely solely on the direct effect of symbiotic N2 fixation but that they are the result of mutual stimulatory effects on the nitrogen acquisition of the grass component and the legume component, as well as the efficiency with which nitrogen is acquired into biomass. The largest benefit of mixing grasses and legumes in terms of biomass yield was achieved at low to moderate levels if nitrogen fertiliser (50 and 150 kg N ha-1 yr-1) with about 40 % to 60 % legumes in the sward. A previous study by the same authors (Nyfeler et al., 2009) quantified the diversity-productivity effects of the same experiment. Strong overyielding was observed in each year and over all three years at 50 kg N ha-1 yr-1. The

54 Survey on grassland ecosystem services, Annex I
estimated overyielding due to combining grasses and legumes was 43 %, 106 % and 55 % for each of the three years. However, nitrogen fertilization (450 kg N ha-1 yr-1) decreased the effect of mixing grasses with legumes from 106 % to 34 % in the second year, and from 55 % to 13 % in the third year. Nevertheless, overyielding due to interaction between grasses and legumes was significant at fertilisation rates of 450 kg N ha-1 yr-1 in the first and second years and over the three years overall. A key finding of the study was that the yield of the most productive mixture exceeded that of the most productive monoculture (= transgressive overyielding), at all nitrogen levels and in each of the three years, although not always significantly. Transgressive overyielding declined with increased nitrogen fertilization: for individual years it was up to 57 %, 53 % and 19 % at rates of 50, 159 and 450 kg N ha-1 yr-1, respectively. Over the three years, legume-grass mixtures produced 1.6, 1.55 and 1.5 times the biomass yield of the average of the four species monocultures being fertilized with 50, 150 and 450 kg N ha-1 yr-1, respectively. The yields of the mixtures and the level of transgressive overyielding significantly depended on the legume proportion in the sward A second key finding was that the diversity effects were so strong that the mixtures producing the highest yield at rates of 50 kg N ha-1 yr-1 were at least as productive as the highest yielding monoculture at rates of 450 kg N, per ha and per year, in the first, second and over the three years overall. At rates of 50 kg N ha-1 yr-1 the highest yield was predicted for mixtures with legume proportions of 70 % (yield: 16.8 tons Dry Matter ha-1 yr-1) for the first year, 56 % (yield: 18.5 tons Dry Matter ha-1 yr-1) for the second year and 63 % (yield: 13.1 tons Dry Matter ha-1 yr-1) for the third year. Increased N fertilization reduced the legume proportion needed to achieve the highest yield, especially in the third year. In the first year, the average legume proportion for all four-species mixtures at a N rate of 450 ha-1 yr-1 reached 32 %, which was not much below the legume proportion of plots being fertilized at a rate of 50 kg N ha-1 yr-
1. But the legume proportion decreased to 24 % in the second year and to 5 % in the third year.
1.1.5 Which factors impede plant productivity and what kind of land use reduces this ecosystem service?
The following paragraphs describe relevant studies in detail, showing which agricultural
management schemes have been found to reduce productivity and what the yields achieved are. A compilation of the most important results and the general principles can be found in chapter 5.1.2 of the report. The long-term effects of grassland extensification and nutrient depletion on biomass production and plant species composition were observed by Hejcman and co-authors (2010) over a period of 12 years. The experiment was established in 1993 on a fertilized and mown pasture in south-west Germany. From 1993 to 2006 different cutting regimes were applied to the study site each year: two cuts, four cuts and continued intensive mowing for control purposes. Additional treatments of some plots included liming. Before the start of the experiment, the study site was under common farm management (i.e. a pasture with one to two silage cuts per year and aftermath grazing until mid-October in two to three rotations). In addition, P and K fertilizer was regularly applied to maintain a soil content of 8-10 mg P per 100 g soil and 8–12 mg K per 100 g soil, and nitrogen was added once per year at average rates of 60–80 kg N ha-1. In the course of the experiment, biomass yields continuously decreased from approx. 7 to 5 t ha-1. This slow long-term decrease in biomass production was similar under both cutting regimes and the decrease was only slightly affected by cutting frequency: although the two-cut regime led to a higher biomass yield in 9 out of 12 years compared to the four-cut regime; the difference was significant only in two years. In the first and the last year the plots being cut twice provided higher biomass yields, but the difference was only significant in the first year. The effect of a cessation of fertilizer application on biomass yield was calculated as an annual decrease of 179 (four cuts without liming), 202 (two cuts including liming), 292 (four cuts without liming) and 240 (four cuts including liming) kg ha-1, for the different cutting regimes. In total, biomass production decreased from 7 to 5 t dry matter ha-1 during the 12 years. The authors assume that the high inter-annual variability in biomass production was probably affected by the different amount and distribution of precipitation in each vegetation season as well as by different temperatures affecting the mineralization of soil organic matter and nutrient supply. Such inter-annual variability in biomass production is typical and has been recorded in other long-term studies

Survey on grassland ecosystem services, Annex I 55
performed in Central Europe (Pavlu et al., 2006; Honsová et al., 2007; Smits et al., 2008; Hrevusovà et al., 2009; Masková et al., 2009). A remarkable decrease in biomass production after termination of fertilizer application can be achieved by long-term cutting management with biomass and nutrient removal (Niinemets and Kull, 2005). This is in line with findings published in a study by Kayser and Isselstein (2005) showing that cutting management without fertilizer application induces a decrease in available nitrogen, phosphorus and potassium and in biomass production more quickly than grazing. This is due to the fact that under grazing about 60–90 % of the nutrients from ingested forage are returned to the pasture through livestock excreta. Furthermore, grazing on productive grasslands supports the growth of legumes by providing considerable amounts of additional nitrogen input through N2 fixation. A species-rich permanent meadow with two cuts every year on a relatively nutrient-poor soil and adjacent abandoned meadow, dominated by grasses, were investigated in a comparative study by Bohner et al. (2006). The abandoned meadow was afforested with only a few spruce trees, whereas the adjacent permanent meadow was moderately fertilized with slurry. Within seven years, the abandonment caused a reduction in vascular plant species richness, a decline in flowering plants, a change in the plant species composition with increases in rhizomatous species, shade-tolerant species and species with a low tolerance to frequent defoliation. Additionally, an increase in below-ground biomass and a slight increase in above-ground biomass at the time of the first cut of the meadow were observed. The harvestable above-ground biomass of the first growth of the meadow was 2.1 t ha-1 compared to 2.4 t ha-1 produced by the abandoned meadow. The fact that the dry matter yield was only assessed for the first growth and that the abandonment led to a shift in the species in favour of those with a low tolerance to frequent defoliation suggests that the total seasonal yield of dry matter on the abandoned meadow would be lower compared to the permanent meadow. The response of subalpine grassland to simulated grazing in the Central European Alps was investigated by Thiel-Egenter et al. (2007). They found that, compared to simulated moderate grazing (by clipping vegetation immediately after snowmelt to the height of 2
cm above the soil surface), heavy grazing simulation (by clipping re-growth to a height of 2 cm at monthly intervals) did not affect aboveground net primary production in a vegetation type which had been adapted to grazing by red deer for approximately 80 years. But net primary production decreased in the non-grazing adapted vegetation type. Dry plant biomass in short grass, averaged over both grazing treatments, amounted to 0.93 t ha-1 yr-1. Dry plant biomass levels in tall-grass vegetation were significantly higher under simulated moderate (compared to heavy) grazing. The authors found lower aboveground net primary production in the grazing adapted short-grass compared to the non-grazing adapted tall-grass vegetation. These findings are similar to findings from American tall-grass prairies, where grazing adapted plots produced less biomass than ungrazed plots (Knapp et al., 1999). But there are contrasting results from the Serengeti (McNaughton, 1985) and Yellowstone National Park (Frank and McNaughton, 1993), where higher biomass yields were observed on grazed (compared to ungrazed) grassland. A possible explanation is that in nutrient-limited grasslands dung and urine inputs from large grazing mammals are likely to accelerate nutrient cycling, leading to a higher biomass yield. But the subalpine grassland was not nutrient limited so that the aboveground net primary production on this type of grassland was independent of dung inputs by red deer. Another explanation could be that a stimulation of plant productivity might be the result of a very long coevolution of plants and large herbivores, as in the Savanna grassland of the Serengeti and the prairies of western North America. The effects of cutting frequency on the plant production of perennial ryegrass-white clover swards were estimated in a two-year field experiment in Denmark by Vinther (2006). In order to compare effects of mowing and grazing, two different cutting regimes were applied: infrequent cutting at monthly intervals (three cuttings in the first and four cuttings in the second year) simulating mowing and frequent cutting at weekly intervals (seven cuttings in the first and twelve cuttings in the second year) simulating grazing. Total dry matter production was in the range of 3–7 t ha-1 yr-1 with lower dry matter production levels being associated with the frequent cutting treatment. In the first year (2002) dry matter production gave a significantly different total cumulated yield of 7 t ha-1 (infrequent cutting)

56 Survey on grassland ecosystem services, Annex I
and 5.7 t ha-1 (frequent cutting). Due to unfavourable weather conditions (cold spring and dry summer in 2003), dry matter production was significantly affected in 2003 and resulted in total cumulated yields of 3.2 t ha-1 (infrequent cutting) and 3.0 t ha-1 (frequent cutting). There was no significant difference in yields between the two cutting treatments in the second year. The reduction of harvested dry matter biomass as a result of frequent cutting to simulate grazing is in line with earlier findings by Swift et al. (1992), who found a 50 % reduction in dry matter yields of white clover
varieties when comparing simulated grazing with five to six cuts per year. Similar results have been published by Unkovich et al. (1998) who found a 27 % reduction of dry matter yields after intensive grazing (compared to a lightly grazed sward). A 10 % lower dry matter production in a grass-clover sward was observed by Elgersma and Schlepper (1997) as a result of more frequent cuttings (at a herbage mass of 1.2 t dry matter ha-1) compared to a less frequent cutting regime (at a herbage mass of 2.0 t dry matter ha-1).
1.1.6 Grassland yields and productivity under different management schemes
Annex I, Table 1.Yield and productivity of grasslands under intensive agricultural use. Grassland type (as referred to in the literature indicated in the “Reference” column)
Dry matter yield (t ha-1 yr-1)
Nitrogen fertilization (kg ha-1 yr-1)
Cutting/Grazing Country Reference
Managed permanent grassland 7.9
Fertilizer applied (no detailed information)
3–4 cuts Germany Weigelt et al., 2009
Intensively used meadows 7.8 200 At least 2 cuts Austria Statistik Austria,
2010
Permanent Grassland 7.9 No specifications No specifications Germany
Statistisches Bundesamt
Deutschland, 2010
Wetland hay meadow 10.5 200 2–3 cuts United Kingdom
Kirkham et al., 1994

Survey on grassland ecosystem services, Annex I 57
Annex I, Table 2. Yields and productivity of grasslands under extensive agricultural use. Grassland type (as referred to in the literature indicated in the “Reference” column)
Dry matter yield (t ha-1 yr-1)
Nitrogen fertilization (kg ha-1 yr-1)
Cutting/Grazing State Reference
Extensively used meadows 3.4 0 1 cut Austria
Statistik Austria, 2010
Wet grasslands species-rich, nutrient-poor
3.9 0 1 cut Austria Statistik Austria, 2010
Subalpine grassland 0.9 0 Moderate to heavy grazing Switzerland
Thiel-Egenter et al., 2007
Permanent meadow 2.1 Slurry 2 cuts Austria Bohner et al., 2006
Abandoned meadow
2.4 (assessed for
the first growth)
0 No cutting during
the last seven years
Austria Bohner et al., 2006
Unimproved species-rich semi-natural grassland
2.0–2.8 0 1–3 cuts United Kingdom
Tallowin & Jefferson,
1999 Annex I, Table 3. Yields and productivity of plots forming part of field experiments.
Grassland type (as referred to in the literature indicated in the “Reference” column)
Dry matter yield (t ha-1 yr-1)
Nitrogen fertilization (kg ha-1 yr-1)
Cutting/Grazing State Reference
Grasses/legume mixtures (55-70 % legumes) 13–18 50 5 cuts Switzerland
Nyfeler et al., 2011 &
2009
Pasture 7 80 2 silage cuts plus aftermath grazing Germany Hejcman et
al., 2010 Hay meadow field (16 species mixture) 7.0–7.6 0 2 cuts Germany Weigelt et
al., 2009 Hay meadow field (60 species mixture) 10–13 0 2 cuts Germany Weigelt et
al., 2009 Hay meadow field (16 species mixture) 8 100 2 cuts Germany Weigelt et
al., 2009 Perennial ryegrass/white clover swards 7 0 3 cuts Denmark Vinther,
2006 Perennial ryegrass/white clover swards 5 0 7 cuts Denmark Vinther,
2006
1.2 Carbon sequestration Detailed study results presented below are summarized in chapter 5.1.3 of the report. Conant and co-authors (2001) analyzed over hundred studies worldwide which examined the influence of improved grassland management
practices and conversion into grasslands on soil carbon in order to assess potentials for carbon sequestration, considering the initial situation of land and duration of monitoring for assessing carbon sequestration rates (Conant et al., 2001). Improved grassland management practices mainly included fertilization, improved grazing management, conversion to pasture (from native and cultivated land) and the

58 Survey on grassland ecosystem services, Annex I
introduction of legumes. The results of this analysis show that, on average, management improvements and conversions into pasture lead to increases in the soil carbon content and net soil carbon storage. To illustrate the potential for carbon sequestration a comparison of carbon sequestration rates has been performed for various land uses and management practices (see table 4), showing that extensive grassland coverage, under improved grassland management potentially provides a substantial global sink for atmospheric carbon (Conant et al., 2001) (see table 4). Annex I, Table 4. Carbon sequestration rates by type of management change (figures taken from Conant et al., 2001).
Management C sequestration (Mg C ha-1 yr-1)20
Irrigation 0.11 Fertilization 0.3 Improved grazing 0.35 Conversion: native to pasture 0.35
Conversion: cultivation to pasture 1.01
Introduction of legumes 0.75
Earthworm introduction 2.35
Improved grass species 3.04
20 Mg C ha-1 yr-1 is the equivalent of metric tons (or a thousand kilos) of carbon produced by hectare per year; Mg is a Megagram = 1 x 10⁶ grams or a metric ton. It has been used to avoid confusion with different standards for ton in different countries. In order to have an idea of the potential of grasslands as a sink for atmospheric carbon, it is important to look at the soil carbon and nitrogen. Fornara and Tilman (2008) measured, in their long term experiment, the net carbon and nitrogen accumulation in grasslands to a soil depth of 100 cm and found that high diversity grasslands store 5 to 6 times more carbon and nitrogen than monoculture plots of the same species (Fornara and Tilman, 2008). Neither C4 grasses (perennial grasses can be classified as either C3 or C4 plants; these terms refer to the different pathways that plants use to capture carbon dioxide during photosynthesis) nor legumes had an effect on biomass between soil depths of 60 and 100 cm, but they had a very significant positive impact on the amount of biomass in the upper
30 cm of soil. The study demonstrates that the presence of C4 grasses and legumes increases the total belowground biomass up to nearly 1000 g m-2 between soil depths of 0–30 cm and that the total belowground biomass reaches nearly 200 g m-2 between soil depths of 30–60 cm. At soil depths between 60 and 100 cm the influence of C4 grasses and legumes results in a total belowground biomass of only approx. 100 g m-2, which is considered not significant. Hence, an illustration of the net soil carbon accumulation shows a dependence of soil carbon and nitrogen sequestration down to soil depths of 60 cm on the functional composition (Fornara and Tilman, 2008). Here it can clearly be seen that the functional “high diversity” composition (a combination of 16 species with at least three or four C4 grasses and legumes each), resulted in an increase of the carbon sequestration rate up to over 60 g m-2 yr-1 – in stark contrast to monoculture plots where only C3 grasses are present, which implicates a negative carbon sequestration rate, whereas a functional composition with monoculture plots of C4 grasses or legumes only result in a sequestration rate of nearly 20 g m-2 yr-1. In view of the aims of European agricultural policy, the management of grassland for biodiversity conservation and restoration, a study (De Deyn et al., 2011) was conducted recently to investigate carbon and nitrogen accumulation rates in soil and carbon and nitrogen pools in vegetation in a long-term field experiment in which fertilization, plant seeding and the abundance of the legume Trifolium pratense were manipulated. Following the investigations by Fornara and Tilman (2008) De Deyn and co-authors (2011) examined the positive influence of Trifolium pratense on soil carbon and nitrogen storage and the biodiversity of grasslands, which is a major goal of the European agri-environmental policy, although science does not as yet have a full understanding of the mechanisms involved in the enhancement of soil carbon and nitrogen sequestration (De Deyn et al., 2011). Another study (Zhang et al., 2011) attempted to quantify the sink and source relations of carbon and nitrogen and to clarify the driving mechanism for carbon and nitrogen losses during grassland degradation. Investigations of changes in the carbon content showed that the total carbon stored in the grassland ecosystem was reduced by up to 14 % depending on the

Survey on grassland ecosystem services, Annex I 59
severity of the degradation. It was concluded, that substantial proportions of soil carbon and nitrogen were lost due to grassland degradation, resulting in unbalanced carbon and nitrogen budgets and that the capacity of carbon sequestration decreased significantly (Zhang et al., 2011).
With regard to possible management options for reducing soil carbon loss a further study was conducted in the UK by Dawson and Smith (2007), reviewing the amount of carbon within the terrestrial pool, the processes involved and factors influencing carbon transport to and from soils. Land-use scenarios that affect carbon losses are also discussed in this study.
Annex I, Table 5. Carbon sequestration rates by type of land-use change; positive values indicate carbon gains, negative ones carbon losses (figures taken from Dawson and Smith, 2007). Land-use change C sequestration (x103 kg C ha-1 yr-1) Arable to grassland 0.3 to 1.9 Arable to permanent pasture 0.27 Grassland to arable -0.95 to -1.7 Moorland to grassland -0.9 to -1.1 Climate and land-use change play a significant key role for carbon gains and losses. New technologies for grassland management practices allow for an increase of carbon sequestration in soils.
The following table gives a more detailed overview on carbon sequestration rates according to different management changes of grasslands considering the initial situation of land and duration of monitoring for assessing carbon sequestration rates (Dawson and Smith, 2007):
Annex I, Table 6. Estimates of the ability of grassland soils to sequester carbon under management changes (figures taken from Dawson and Smith, 2007). Types of grasslands C sequestration (x103 kg C ha-1 yr-1) Conversion to grass-legume mixtures 0.3 to 0.75 Intensification of permanent grassland 0,2 Intensification of nutrient-poor grassland -0.9 to 1.1 Permanent grassland to medium duration leys -0.2 Short duration leys to grassland 0.3 to 0.4 Increased duration of leys 0.2 to 0.5 Improved grazing management 0.35 Improved grass species 3.04 Introduction of earthworms 2.35 Species-rich–limestone, cutting 1.2 (+/- 0.5) Species-rich–peaty gley, no cutting 6.4 (+/- 0.6) In their conclusion the authors of the study (Dawson and Smith, 2007) noted uncertainties regarding their carbon process figures due to the heterogeneous nature of soils, land-uses and management practices. This is why assumptions and generalizations had to be made and further research will be necessary to answer outstanding questions concerning carbon sequestration.
1.3 Pollination service by insects This chapter deals with the pollination service provided by insects in different grassland
habitat types (i.e. pollination service at plot scale) as a result of their vegetation, structure and the agricultural management applied. The effects of surrounding landscapes on pollination situation in adjacent grassland habitats (i.e. pollination service at landscape scale) are not discussed in this chapter. Detailed study results presented below are summarized in chapter 5.1.4 of the report.

60 Survey on grassland ecosystem services, Annex I
1.3.1 Importance of pollination
In principle, pollination by animals is an important ecosystem service for maintaining ecosystem functioning (Williams et al., 1991; MEA, 2005). A compilation of global data from sources of 200 countries shows that fruit, vegetable or seed production from 87 (76 %) of the leading global fruit crops depends on animal pollination (Klein et al., 2007). The total economic value of pollination worldwide amounted to EUR 153 billion (153 000 million), which represented 9.5 % of the value of the world’s agricultural production used for human food in 2005 (Gallai et al., 2009). In the absence of animal pollination, direct reduction was calculated in global agricultural production, ranging from 3 to 8 % (Aizen et al., 2009). Williams (1994) assessed pollinator needs for 264 crop species in Europe and concluded that production from 84 % of these species depends at least to some extent upon this key ecosystem service. The total economic value of pollinators for crops and commodity crops in 27 European countries slightly exceeded EUR 14 billion (14 000 million) in a calculation performed by Gallai et al. (2010). In addition to its agricultural importance, pollination is of key importance for a very high proportion (87.5 %, approx. 308 000 species) of the global wild flowering plants (angiosperms) that are pollinated by animals (Ollerton et al., 2011). As there is agreement on the importance of a stable pollination service for crop production as well as the maintenance of biodiversity, there is rising concernabout the fact that there is evidence of a decline in wild pollinator populations at the global scale (Potts et al., 2010a) and also at the European scale (Goulson, et al., 2005; Biesmeijer et al., 2006; Potts et al., 2010b; Breeze et al., 2011).
1.3.2 Which preconditions are essential for pollination by insects?
Although there are many different pollinating insect species in Europe, like honeybees, bumblebees, solitary bees, hoverflies, butterflies and some species of beetles (Williams, 2002), the majority of the research papers deal with wild bees and honey bees. It has been shown that bee abundance and species richness are positively associated with the abundance and richness of flowering plant species (Steffan-Dewenter and Tscharntke, 2001) and that bee species richness is affected by the diversity of nectar sources, the ratio of pollen to nectar energy content, and floral morphology (Potts et al., 2003). These findings are confirmed by another study conducted in Germany (Ebeling et al., 2008) revealing that the frequency of pollinator visits is linearly increasing with both the blossom cover and the number of flowering plant species, which was closely related to the total number of plant species, whereas the number of pollinator species followed a saturation curve. The pollinator species observed in this study were grouped into honey bees, solitary bees, bumble bees, hover flies and remaining pollinators (butterflies, beetles and flies except hover flies). Almost all of these positive relationships were found across different pollinator guilds (exceptions: visitation rate of solitary bees and hoverflies was only influenced by increasing blossom cover), an indication of the strength of the overall patterns. The authors concluded that both species-rich and strongly-flowering plant communities appear to be critical for grasslands in that they ensure high diversity and stability of pollinator visit frequency, which are in turn critical for the reproductive success and sustained stability of the plant communities themselves.

Survey on grassland ecosystem services, Annex I 61
Annex I, Table 7.Effects of the number of flowering plant species and blossom cover (%) on the number of pollinator species (a and b) and the frequency of pollinator visits within 36 minutes of observation in 2005 and 2006 (c and d). The solid lines show the predictions based on the saturated (a and b) and linear (c and d) zero-inflated negative binominal model respectively (taken from Ebeling et al., 2008).
Findings by Fenster et al. (2004) which revealed that greater floral diversity creates a wider array of foraging niches for functional groups of visitors are in line with the study results mentioned above. All these prerequisites are responsible for a diverse and abundant pollinator community which is the basis of pollination stability (Klein et al., 2007). Because of these connections, environmental changes of floral resources that alter the spatial and temporal distribution of floral resources also influence pollinator community composition (Kremen et al., 2007). Availability of nesting sites is another important determinant of pollinator community composition. Bee nesting habits include tunnelling in bare ground, using pre-existing cavities, excavating dead wood and constructing nests inside larger cavities. The quantity and quality of nesting resources greatly influence bee community composition (Potts et al., 2005). Recently, Knight et al. (2009) showed that bumblebee nest density was linked to the quantity of floral resources within 1000 m of their sample site. Therefore, a landscape should provide efficient nesting opportunities, floral resources and habitat connectivity, and
farming should be practiced with a reduced pesticide use (Klein et al., 2007).
1.3.3 Which habitat types and kinds of land use provide these preconditions and thus support pollination by insects?
Based on the above mentioned findings in the literature on the conditions necessary to support animal-mediated pollination, the following paragraphs describe the most relevant studies in detail, showing which grassland habitats and agricultural management schemes are advancing pollination. A compilation of the most important results and general principles can be found in chapter 5.1.4 of the report. Semi-natural habitats such as calcareous grasslands are considered to belong to the most species-rich habitats in central Europe (WallisDeVries et al., 2002). They offer a rich supply of floral resources from early spring to late fall and further provide diverse microhabitats for nesting and larval development. Therefore, agro-ecosystems which include more semi-natural habitats are often richer in pollinator species (Steffan-
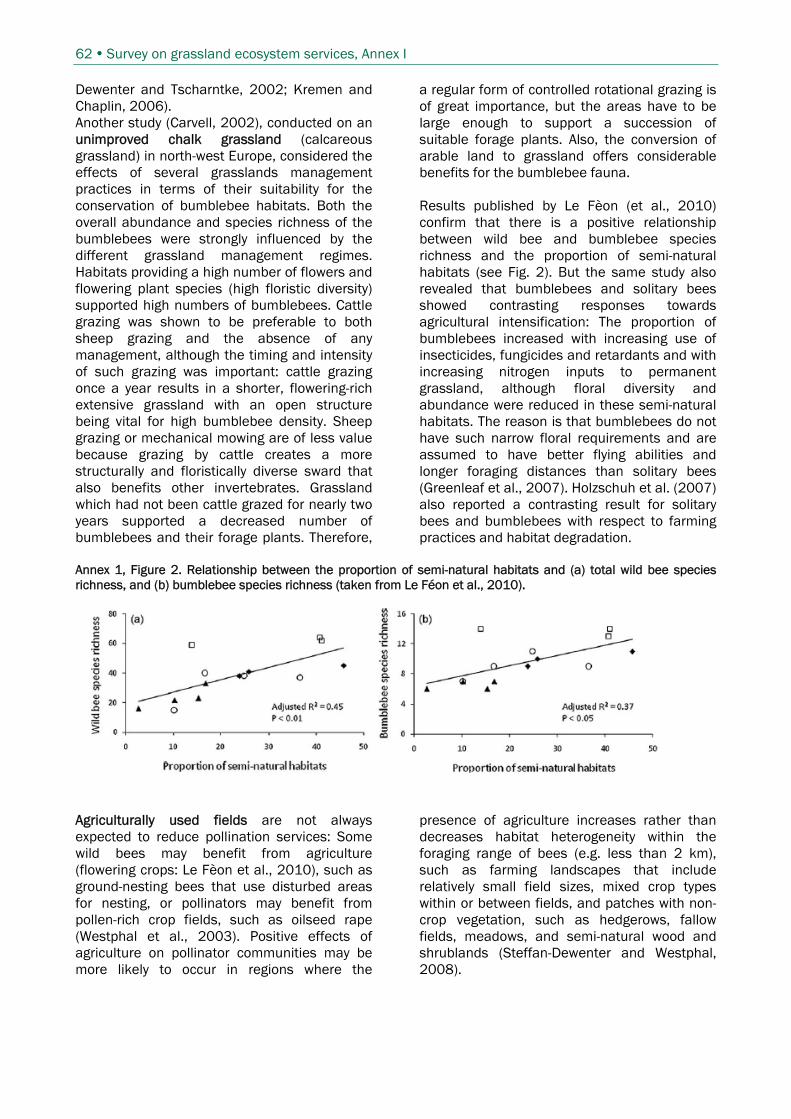
62 Survey on grassland ecosystem services, Annex I
Dewenter and Tscharntke, 2002; Kremen and Chaplin, 2006). Another study (Carvell, 2002), conducted on an unimproved chalk grassland (calcareous grassland) in north-west Europe, considered the effects of several grasslands management practices in terms of their suitability for the conservation of bumblebee habitats. Both the overall abundance and species richness of the bumblebees were strongly influenced by the different grassland management regimes. Habitats providing a high number of flowers and flowering plant species (high floristic diversity) supported high numbers of bumblebees. Cattle grazing was shown to be preferable to both sheep grazing and the absence of any management, although the timing and intensity of such grazing was important: cattle grazing once a year results in a shorter, flowering-rich extensive grassland with an open structure being vital for high bumblebee density. Sheep grazing or mechanical mowing are of less value because grazing by cattle creates a more structurally and floristically diverse sward that also benefits other invertebrates. Grassland which had not been cattle grazed for nearly two years supported a decreased number of bumblebees and their forage plants. Therefore,
a regular form of controlled rotational grazing is of great importance, but the areas have to be large enough to support a succession of suitable forage plants. Also, the conversion of arable land to grassland offers considerable benefits for the bumblebee fauna. Results published by Le Fèon (et al., 2010) confirm that there is a positive relationship between wild bee and bumblebee species richness and the proportion of semi-natural habitats (see Fig. 2). But the same study also revealed that bumblebees and solitary bees showed contrasting responses towards agricultural intensification: The proportion of bumblebees increased with increasing use of insecticides, fungicides and retardants and with increasing nitrogen inputs to permanent grassland, although floral diversity and abundance were reduced in these semi-natural habitats. The reason is that bumblebees do not have such narrow floral requirements and are assumed to have better flying abilities and longer foraging distances than solitary bees (Greenleaf et al., 2007). Holzschuh et al. (2007) also reported a contrasting result for solitary bees and bumblebees with respect to farming practices and habitat degradation.
Annex 1, Figure 2. Relationship between the proportion of semi-natural habitats and (a) total wild bee species richness, and (b) bumblebee species richness (taken from Le Féon et al., 2010).
Agriculturally used fields are not always expected to reduce pollination services: Some wild bees may benefit from agriculture (flowering crops: Le Fèon et al., 2010), such as ground-nesting bees that use disturbed areas for nesting, or pollinators may benefit from pollen-rich crop fields, such as oilseed rape (Westphal et al., 2003). Positive effects of agriculture on pollinator communities may be more likely to occur in regions where the
presence of agriculture increases rather than decreases habitat heterogeneity within the foraging range of bees (e.g. less than 2 km), such as farming landscapes that include relatively small field sizes, mixed crop types within or between fields, and patches with non-crop vegetation, such as hedgerows, fallow fields, meadows, and semi-natural wood and shrublands (Steffan-Dewenter and Westphal, 2008).
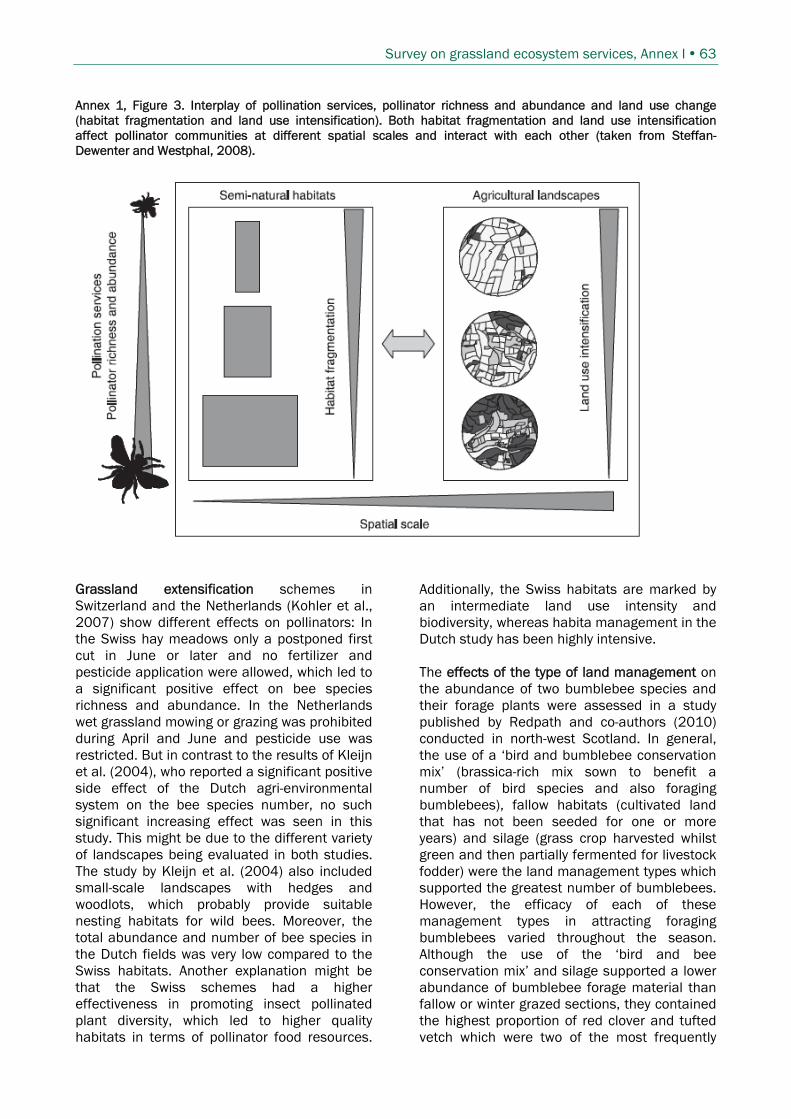
Survey on grassland ecosystem services, Annex I 63
Annex 1, Figure 3. Interplay of pollination services, pollinator richness and abundance and land use change (habitat fragmentation and land use intensification). Both habitat fragmentation and land use intensification affect pollinator communities at different spatial scales and interact with each other (taken from Steffan-Dewenter and Westphal, 2008).
Grassland extensification schemes in Switzerland and the Netherlands (Kohler et al., 2007) show different effects on pollinators: In the Swiss hay meadows only a postponed first cut in June or later and no fertilizer and pesticide application were allowed, which led to a significant positive effect on bee species richness and abundance. In the Netherlands wet grassland mowing or grazing was prohibited during April and June and pesticide use was restricted. But in contrast to the results of Kleijn et al. (2004), who reported a significant positive side effect of the Dutch agri-environmental system on the bee species number, no such significant increasing effect was seen in this study. This might be due to the different variety of landscapes being evaluated in both studies. The study by Kleijn et al. (2004) also included small-scale landscapes with hedges and woodlots, which probably provide suitable nesting habitats for wild bees. Moreover, the total abundance and number of bee species in the Dutch fields was very low compared to the Swiss habitats. Another explanation might be that the Swiss schemes had a higher effectiveness in promoting insect pollinated plant diversity, which led to higher quality habitats in terms of pollinator food resources.
Additionally, the Swiss habitats are marked by an intermediate land use intensity and biodiversity, whereas habita management in the Dutch study has been highly intensive. The effects of the type of land management on the abundance of two bumblebee species and their forage plants were assessed in a study published by Redpath and co-authors (2010) conducted in north-west Scotland. In general, the use of a ‘bird and bumblebee conservation mix’ (brassica-rich mix sown to benefit a number of bird species and also foraging bumblebees), fallow habitats (cultivated land that has not been seeded for one or more years) and silage (grass crop harvested whilst green and then partially fermented for livestock fodder) were the land management types which supported the greatest number of bumblebees. However, the efficacy of each of these management types in attracting foraging bumblebees varied throughout the season. Although the use of the ‘bird and bee conservation mix’ and silage supported a lower abundance of bumblebee forage material than fallow or winter grazed sections, they contained the highest proportion of red clover and tufted vetch which were two of the most frequently

64 Survey on grassland ecosystem services, Annex I
visited species by foraging bumblebees during August. This suggests that it is the availability and abundance of certain key plants and not the overall diversity of forage material which is important for maintaining bumblebee populations throughout the season. It is possible that a greater diversity in the plant community may support a greater diversity of invertebrates, but for bumblebees a number of key forage plant species appears to be more important. Significantly more foraging bumblebees were observed in areas of crofts which were not sheep grazed. Even at low density, sheep grazed pasture supported negligible numbers of bumblebees and therefore the management of sheep is a key factor in determining the value of crofts for bumblebees.
1.3.4 Which factors impede pollination?
There are many potential drivers that affect biodiversity in general and pollinator abundance in particular and in most cases different environmental drivers rarely act in isolation (e.g. Didham et al., 2007). The majority of the relevant studies analyse the impacts of specific drivers in isolation, but the awareness of the importance of interacting drivers is also increasing (Tylianakis et al., 2008). The response of bee individuals, populations and communities to land-use change is largely driven by the spatial and temporal distribution of floral, nesting and over-wintering resources in relation to foraging and the dispersal capabilities of bees. Among the most important drivers are land-use change with the consequent loss and fragmentation of habitats (Hendrickx et al., 2007; Goulson et al., 2005; Winfree et al., 2009a). Other drivers are the application of agrochemicals, environmental pollution, pathogens, alien species, climate change and the interactions between these adverse influences. There is a lot of evidence that habitat loss is the most important factor driving wild bee decline (Brown and Paxton, 2009; Winfree et al., 2009b), resulting in a significantly decreased bee abundance and bee species richness which is dependent on the degree of habitat loss. Loss or dissociation of important resources for food and nesting are the main drivers for these effects (Hines and Hendrix, 2005; Potts et al., 2005).
Habitat fragmentation and degradation of near- and semi-natural habitats can be detrimental to bee communities (Kremen et al., 2002, 2004; Steffan-Dewenter et al., 2002, 2006; Larsen, 2005; Cane et al., 2006). Some, but not all, studies report declining species richness and abundance with decreased fragment sizes for bees and butterflies (Tscharntke et al., 2002). Solitary bees or those collecting special pollen are more strongly affected than monophagous butterflies (Tscharntke et al., 2002). The variance in the response to fragmentation between the studies may be due to the quality of the matrix surrounding the habitat fragments and the dispersal abilities of pollinators (Potts et al., 2010). An outstanding question is whether there is a critical threshold of habitat area required to maintain a viable bee population. Habitat degradation might affect bee species primarily through loss of floral and nesting resources, and lethal or sub-lethal effects after application of insecticides. But the significance of these disturbances could not be proved in a recent meta-analysis (Winfree et al., 2009b).
1.3.5 What kind of land use reduces pollination?
The following paragraphs describe relevant studies in detail, showing which agricultural management schemes reduce pollination. A compilation of the most important results and general principles can be found in chapter 5.1.4 of the report. Numerous studies show the negative effects of agricultural intensification on pollination at the local or landscape scale, with bees being particularly sensitive to agricultural intensification (Klein et al., 2007; Hendrickx et al., 2007). At local scales, intensification is characterized by machine-driven farming and increased inputs of fertilisers and pesticides that directly kill pollinators or reduce nest and flower resources. At the landscapes scale, the typical consequences of agricultural intensification are large field sizes, a reduced amount of hedge habitats and a low number of different land use types (Tscharntke et al., 2005) as well as a low proportion of permanent grassland (Herzog et al., 2006) and simplified crop rotation. Agricultural intensification from the local to the landscape scale is generally correlated with a

Survey on grassland ecosystem services, Annex I 65
decline in wild pollinator, diversity and services to crops (Kremen et al., 2007). Le Féon (et al. 2010) conducted a study in four Western European countries (Belgium, France, the Netherlands, Switzerland) to investigate how different types of farming systems influence bee abundance and species richness. They combined several factors which are well known to negatively affect bees (nitrogen input, livestock density, number of application of herbicides, insecticides, fungicides and retardants and the number of crops) in a global intensity index. Their analysis showed that species richness, as well as the abundance and diversity of wild bees were higher at sites where livestock density and nitrogen inputs to arable crops were low and the use of herbicides and the number of crops rather high, revealing that bees were be preferentially associated with cropping systems or mixed farms rather than with intensive animal husbandry. These results are due to the detrimental impact of intensive animal husbandry and the positive effect of a high number of crops. They are in line with findings of Sjödin (2007) and co-authors (2008) showing that high livestock densities indicate high grazing pressures on the whole bee community, which had also been proved for bumblebess (Carvell, 2002). The effects of grazing are mainly mediated through changes in flower diversity. The fact that no correlation was found between the proportion of semi-natural grasslands and livestock density reflects the de-coupling of livestock and production from grassland area. Often ruminants are fed with food harvested in arable crops. If cattle are still bred outside, it is on rotational fertilized grassland rather than on long-lasting meadows with higher plant diversity. Intensive animal husbandry could therefore lead to areas becoming unfavourable to bees because of a lack of floral resources. Batàry et al., (2010) evaluated the effects of different stocking rates (0.5 cow ha-1 versus more than 1 cow ha-1) on bees and insect-pollinated plants in semi-natural pastures in Hungary. Although no management effects were observed on species richness and abundance with respect to cover of bees and insect-pollinated plants (species richness and abundance of bees were similar on intensively and extensively grazed grasslands), the grazing intensity resulted in differences in the species composition of insect-pollinated plants. This absence of a management effect may have been due to the fact that land-use intensity was
low on both Hungarian field types. As compared to the findings of the study conducted in Switzerland and the Netherlands by Kohler et al. (2007, see above), it turned out that the richness of insect-pollinated plants is a good predictor of bee species richness. Thus, even if a small increase in grazing intensity does not result in declining species richness, it can cause changes in plant composition (Loeser et al., 2007). The authors further argue that increasing the intensity of land-use results in lower species evenness, which might lead in the long-term to a reduction of species diversity rather than a shift towards a community consisting of better adapted species. Moreover, their results suggest that bees and insect-pollinated plants tend to decline in parallel, similar to Biesmeijer et al. (2006) and Ebeling et al. (2008). Therefore, agricultural practices supporting high species richness and cover of insect pollinated plants are favourable to bees (Potts et al., 2009). Plant-affecting management will affect the resources being available for pollinators and management affecting the pollinator community may have an effect on the plant community. According to the results, it can be suggested that management prescriptions limiting grazing intensities to 0.5–1.2 (animal ha-1) and excluding the use of fertilizers and pesticides would contribute to the conservation of a still highly diverse (bee) fauna. In another study on the effects of livestock grazing on pollination (on a steppe in eastern Mongolia (!); Yoshihara et al., 2008), the authors found a general decline in the species richness of both insect-pollinated plants and pollinators in response to increased grazing intensity on an unfertilized and unsprayed grassland habitat. However, in that study the most intensive grazing regime involved almost three times as much cattle as the least intensive regime. The influence of the grazing intensity on the diversity and abundance of flower-visiting insects was also investigated in eight areas in central Sweden including semi-natural grasslands (Sjödin, et al. 2008). Three management regimes were studied: intensively grazed (by cattle), grazed at low intensity (mostly grazed by cattle, some areas by horses), and abandoned grassland that had not been grazed for at least ten years. Flower-visiting bees, butterflies, hoverflies and beetles were included in the study. Vegetation height was used as a variable indicating grazing intensity,

66 Survey on grassland ecosystem services, Annex I
but also flower abundance and the number of flowering plants are indicators that are measured. The species richness of hover flies and beetles was highest in tall vegetation (e.g. low intensity of grazing and abandoned grasslands), whereas the species richness of butterflies and bees was not influenced by the height of vegetation. Only bees showed a significant increase in abundance in response to flower abundance and the bee species composition varied mainly in relation to flower abundance (see Fig. 4.). Beetle species richness was negatively correlated with plant species richness. There were some unexpected results: plant and insect species richness as well as insect abundance were not lower in abandoned grassland compared to the other grassland management regimes. Intensively grazed grasslands did not have significantly fewer flowers, lower plant species richness or a
lower diversity of bees and butterflies than low-intensity grassland. But the species richness of beetles and hoverflies in intensively managed habitats was significantly lower than in low-intensity regimes. The management intensity plays an important role with regard to the identity of species found in the insect groups of butterflies, hoverflies and beetles as mentioned above. No insect group was more species-rich or abundant in intensively managed pastures. Bee species richness and abundance was significantly related to flower abundance, although this is factor that would have been expected to be important for all flower visitors. As no detailed description of the intensity of grazing has been provided in the study (as far as the categories ‘intensive grazing’ and ‘grazing at low intensity’ is concerned), it is hardly possible to compare these contrasting results with those of other studies.
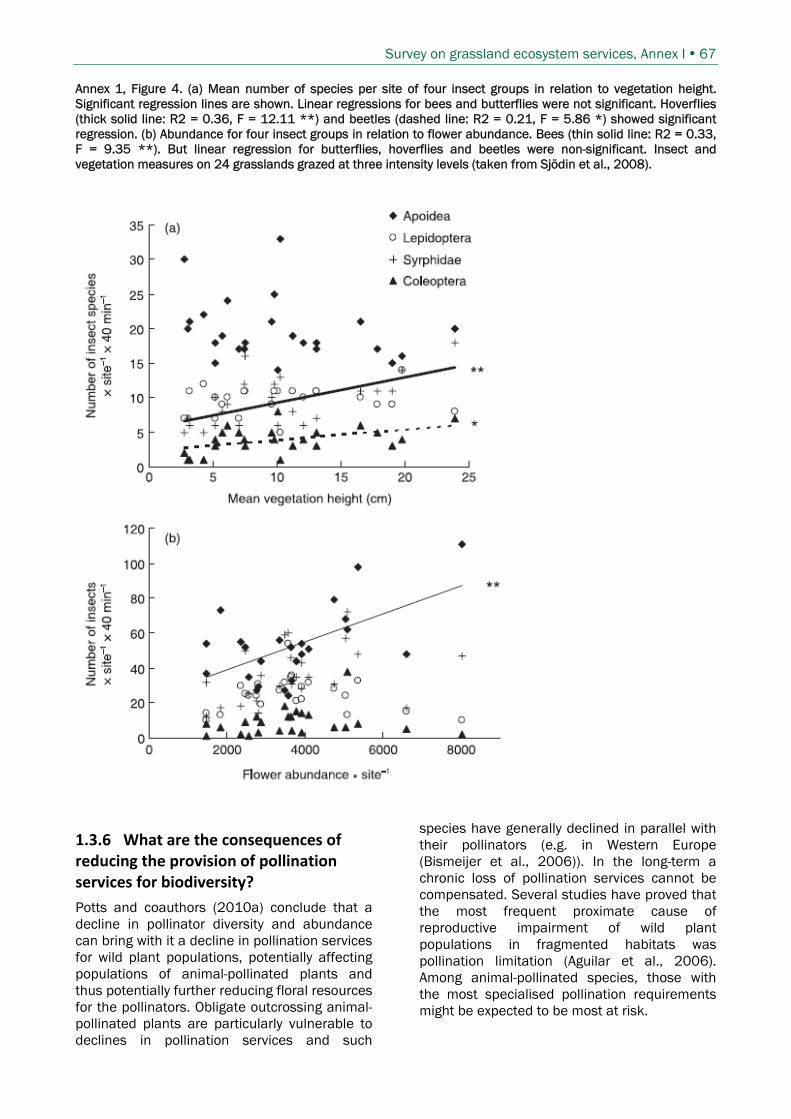
Survey on grassland ecosystem services, Annex I 67
Annex 1, Figure 4. (a) Mean number of species per site of four insect groups in relation to vegetation height. Significant regression lines are shown. Linear regressions for bees and butterflies were not significant. Hoverflies (thick solid line: R2 = 0.36, F = 12.11 **) and beetles (dashed line: R2 = 0.21, F = 5.86 *) showed significant regression. (b) Abundance for four insect groups in relation to flower abundance. Bees (thin solid line: R2 = 0.33, F = 9.35 **). But linear regression for butterflies, hoverflies and beetles were non-significant. Insect and vegetation measures on 24 grasslands grazed at three intensity levels (taken from Sjödin et al., 2008).
1.3.6 What are the consequences of reducing the provision of pollination services for biodiversity?
Potts and coauthors (2010a) conclude that a decline in pollinator diversity and abundance can bring with it a decline in pollination services for wild plant populations, potentially affecting populations of animal-pollinated plants and thus potentially further reducing floral resources for the pollinators. Obligate outcrossing animal-pollinated plants are particularly vulnerable to declines in pollination services and such
species have generally declined in parallel with their pollinators (e.g. in Western Europe (Bismeijer et al., 2006)). In the long-term a chronic loss of pollination services cannot be compensated. Several studies have proved that the most frequent proximate cause of reproductive impairment of wild plant populations in fragmented habitats was pollination limitation (Aguilar et al., 2006). Among animal-pollinated species, those with the most specialised pollination requirements might be expected to be most at risk.

68 Survey on grassland ecosystem services, Annex I
Although many of the highest volume crops are wind-pollinated, a large proportion of fruit crops are potentially vulnerable to declines in apiculture and wild pollinator stocks (Potts et al., 2010a). Despite the importance of pollination for crop production, there is lack of knowledge about how species diversity and the abundance and community composition of pollinating insects contribute to seed and fruit yield and quality in most crops (Hoehn et al., 2008; Winfree and Kremen, 2009). In recent decades plant biodiversity has undergone a rapid change in many regions of
the world. These declines seem to have affected obligate outcrossing among animal-pollinated plant populations, in particular as they rely entirely on insect pollen vectors, suggesting a general decline in floral resources for pollinators (Bismeijer et al., 2006). For example, in the UK there is evidence that 76 % of forage plants used by bumblebees declined in frequency between 1978 and 1998 (Carvell et al., 2006). It is a recent research issue linking these floral shifts to pollinator dynamics (Carvell et al., 2006; Fontaine et al., 2006; Kleijn and Raemekers, 2008).

Survey on grassland ecosystem services, Annex I 69
1.4 References to Annex I Aguilar, R., Ashworth, L., Galetto, L. and Aizen, M. A., 2006, ‘Plant reproductive susceptibility to habitat
fragmentation: review and synthesis through a meta-analysis’, Ecology Letters, (9) 968–980. Aizen, A. M., Garibaldi, L. A., Cunningham, S. A. and Klein, A. M., 2009, ’How much does agriculture
depend on pollinators? Lessons from long-term trends in crop production‘, Annals of Botany, (103) 1579–1588.
Barnes, R. F., Nelson, C. F., Moore, K. J. and Collins, M., 2007, Forages. To the science of grassland agriculture, Blackwell Publishing, Ames, Oxford, Victoria.
Batáry, P., Báldi, A., Sárospataki, M., Kohler, F., Verhulst, J., Knop, E., Herzog, F. and Kleijn, D., 2010, ‘Effect of conservation management on bees and insect-pollinated grassland plant
communities in three European countries‘, Agriculture, Ecosystems and Environment, (136) 35–39. Biesmeijer, J. C., Roberts, S. P. M., Reemer, M., Ohlemüller, R., Edwards, M., Peeters, T., Schaffers, A. P.,
Potts, S. G., Kleukers, R., Thomas, C. D., Settele, J. and Kunin, W. E., 2006, ‘Parallel declines in pollinators and insect-pollinated plants in Britain and the Netherlands’, Science, (313) 351–354.
Bohner, A., Öhlinger, R. and Tomanova, O., 2006, ‘Effects of grassland management and abandonment on vegetation, soil, microbial biomass and forage quality’, Die Bodenkultur Austrian Journal of Agricultural Research, (57) 33–45.
Breeze, T. D., Bailey, A. P., Balcombe, K. G. and Potts, S. G., 2011, ‘Pollination services in the UK: How important are honeybees?’, Agriculture, Ecosystems and Environment Article in press.
Brown, M. J. F. and Paxton, R. J., 2009, ‘The conservation of bees: a global perspective’, Apidology, (40) 410–416.
Cane, J. H., Minckley, R. L., Kervin, L. J., Roulston, T. H. and Williams, N. M., 2006, ‘Complex responses within a desert bee guilt (Hymenoptera: Apiformes) to urban habitat fragmentation’, Ecological Applications, (16) 632–644.
Cardinale, B. J., Wright, J. P., Cadotte, M. W., Carrol, I. T., Hector, A., Srivastava, D. S., Loreau, M. and Weis, J. J., 2007, ‘Impacts of plant diversity on biomass production increase through time because of species complementarity’, Proceedings of the National Academy of Science of the USA, (104) 18123–18128.
Carvell, C., 2002, ‘Habitat use and conservation of bumblebees (Bombus spp.) under different grassland management regimes’, Biological Conservation, (103) 33–49.
Carvell, C., Roy, D. B., Smart, S. M., Pywell, R. F., Preston, C. D. and Goulson, D., 2006, ‘Declines in forage availability for bumblebees at a national scale’, Biological Conservation, (132) 481–489.
Conant, R. T., Paustian, K. and Elliott, E. T., 2001, ‘Grassland management and conversion into grassland: effects on soil carbon‘, Ecological Applications, (11) 343–355.
Cop, J., Vidrih, M. and Hacin, J., 2009, ‘Influence of cutting regime and fertilizer application on the botanical composition, yield and nutritive value of herbage of wet grasslands in Central Europe’, Grass and Forage Science, (64) 454–465.
Dawson, J. J. C. and Smith, P., 2007, ‘Carbon losses from soil and its consequences for land-use management‘, Science of the Total Environment, (382) 165–190.
De Deyn, G. B., Shiel, R. S., Ostle, N. J., McNamara, N. P., Oakley, S., Young, I., Freeman, C., Fenner, N., Quirk, H. and Bardgett, R. D., 2011, ‘Additional carbon sequestration benefits of grassland diversity restoration‘, Journal of Applied Ecology, (48) 600–608.
Didham, R. K., Tylianakis, J. M., Gemmell, N. J., Rand, T. A. and Ewers, R. M., 2007, ‘Interactive effects of habitat modification and species invasion on native species decline’, Trends in Ecology and Evolution, (22) 489–496.
Dodd, M. E., Silvertown, J., McConway, K., Potts, J. and Crawley, M., 1994, ‘Stability in the plant communities of the Park Grass Experiment: the relationship between species-richness, soil pH and biomass variability’, Philosophical Transactions of the Royal Society London, (346) 185–193.
Ebeling, A., Klein, A.-M., Schumacher, J., Weisser, W. W. and Tscharntke, T., 2008, ‘How does plant richness affect pollinator richness and temporal stability of flower visits’, Oikos, (117) 1808–1815.
Elgersma, A. and Schlepers, H., 1997, ‘Performance of white clover/perennial ryegrass mixtures under cutting’, Grass and Forage Science, (52) 134–146.

70 Survey on grassland ecosystem services, Annex I
Fenster, C. B., Armbruster, W. S., Wilson, P., Dudash, M. R. and Thomson, J. D., 2004, ‘Pollination syndromes and floral specialization’, Annual Review of Ecology Evolution and Systematics, (35) 375–403.
Fontaine, C., Dajoz, I., Meriguet, J. and Loreau, M., 2006, Functional diversity of plant-pollinator interaction webs enhances the persistence of plant communities, PLoS Biol 4(1) e1 DOI: 10.1371/journal.pbio.0040001
Fornara, D. A., and Tilman, D., 2008, ‘Plant functional composition influences rates of soil carbon and nitrogen accumulation‘, Journal of Ecology, (96) 314–322.
Frank, D. A. and McNaughton, S. J., 1993, ‘Evidence for the promotion of above ground grassland production by native large herbivores in Yellowstone National Park’, Oecologia, (96) 157–161.
Gallai, N., Salles, J. M., Settele, J., Vaissière, B. E., 2009, ‘Economic valuation of the vulnerability of world agriculture confronted with pollinator decline’, Ecological Economics, (68) 810–821.
Gallai, N., Salles, J.-M., Carré, G., Morison, N. and Vaissière, B. E., 2010, ‘Monetary valuation of the pollination service provided to European agriculture by insects’, in: Settele, J., Penev, L., Georgiev, T., Grabaum, R., Grobelnik, V., Mannen, V., Klotz, S., Kotarac, M. and Kühn, I. (eds), ATLAS of Biodiversity Risk, Pensoft Publihers, Sofia-Moscow.
Gough, L., Osenberg, G. W., Gross, K. L. and Collins, S. L., 2000, ‘Fertilization effects on species density and primary productivity in herbaceous plant communities’, Oikos, (89) 428–439.
Goulson, D., Hanley, M. E., Darvill, B., Ellis, J. S. and Knight, M. E., 2005, ‘Causes of rarity in bumblebees’, Biological Conservation, (122) 1–8.
Greenleaf, S. S., Williams, N. M., Winfree, R. and Kremen, C., 2007, ‘Bee foraging ranges and their relationship to body size’, Oecologia, (153) 589–596.
Gross, N., Suding, K. N., Lavorel, S. and Roumet, C., 2007, ‘Complementarity as a mechanism of coexistence between functional groups of grasses’, Journal of Ecology, (95) 1296–1305.
Gruber, N. and Galloway, J. N., 2008, ‘An earth-system perspective of the global nitrogen cycle’, Nature, (451) 293–296.
Hejcman, M., Schellberg, J. and Pavlu, V., 2010, ‘Long-term effects of cutting frequency and liming on soil chemical properties, biomass production and plant species composition of Lolio-Cynosuretum grassland after the cessation of fertilizer application’, Applied Vegetation Science, (13) 257–269.
Hector, A., Schmid, B., Beierkuhnlein, C., Caldeira, M. C., Diemer, M., Dimitrakopoulos, P. G. Finn, J. A. Freitas, H., Giller, P. S., Good, J., Harris, R., Högberg, P., Huss-Danell, K., Joshi, J., Jumpponen, A., Körner, C., Leadley, P. W., Loreau, M., Minns, A., Mulder, C. P. H., Donovan, G. O., Otway, S. J., Pereira, J. S., Prinz, A., Read, D. J., Scherer-Lorenzen, M., Schulze, E.-D. Siamantziouras, A. S. D., Spehn, E. M., Terry, A. C., Troumbis, A. Y., Woodward, F. I., Yachi, S. and Lawton, J. H., 1999, ‘Plant Diversity and Productivity Experiments in European Grasslands’, Science, (286) 1123–1127.
Hendrickx, F., Maelfait, J.-P., van Wingerden, W., Schweiger, O., Speelmans, M., Aviron, S., Augenstein, I., Billeter, R., Bailey, D., Bukacek, R., Burel, F., Diekötter, T., Dirksen, J., Herzog, F., Liira, J., Roubalova, M., Vandomme, V. and Bugter, R., 2007, ‘How landscape structure, land-use intensity and habitat diversity affect components of total arthropod diversity in agricultural landscapes’, Journal of Applied Ecology, (44) 340–351.
Herzog, F., Steiner, B., Bailey, D., Baudry, J., Biletter, R., Bukacek, R., de Blust, G., de Cock, R., Dirksen, J., Dormann, C. F., de Filippi, R., Frossard, E., Liira, J., Schmidt, T., Stöckli, R., Thenail, C., van Wingerden, W. and Bugter, R., 2006, ‘Assessing the intensity of temperate European agriculture at the landscape scale’, European Journal of Agronomy, (24) 165–181.
Hines, H. M. and Hendrix, S. D., 2005, ‘Bumble bee (Hymenoptera: Apidae) diversity and abundance in tallgrass prairie patches: effects of local and landscape floral resources’, Environmental Entomology, (34) 1477–1484.
Hoehn, P., Tscharntke, T., Tylianakis, J. M. and Steffan-Dewenter, I., 2008, ‘Functional group diversity of bee pollinators increases crop yield’, Proceedings of the Royal Society B: Biological Sciences, (275) 2283-2291.
Holzschuh, A., Steffan-Dewenter, I., Kleijn, D. and Tscharntke, T., 2007, ‘Diversity of flower-visiting bees in cereal fields: effects of farming systems, landscape composition and regional context’, Journal of Applied Ecology, (44) 41–49.
Honsová, D., Hejcman, M., Klaudisová, M., Pavlu, V., Kocourková, D. and Hakl, J., 2007, ‘Species composition of an alluvial meadow after 40 years of applying nitrogen, phosphorus and potassium fertilizer’, Preslia, (79) 245–258.

Survey on grassland ecosystem services, Annex I 71
Hooper, D. U., Chapin, F. S., Ewel, J. J., Hector, A., Inchausti, P., Lavorel, S., Lawton, J. H., D. M. Lodge, D. M., Loreau, M., Naeem, S., Schmid, B., Setälä, H., Symstad, A. J., Vandermeer, J. and Wardle, D. A., 2005, ‘Effects of biodiversity on ecosystem functioning: a consensus of current knowledge’, Ecological Monographs, (75) 3–35.
Hopkins, A., 2000, ‘Herbage production’, in: Hopkins, A. (ed.), Grass, it´s production and utilization, Blackwell Science, Oxford, UK.
Hrevusová, Z., Hejcman, M., Pavlu, V., Hakl, J., Klaudisová, M. and Mrkvička, J., 2009, ‘Long-term dynamics of biomass production, soil chemical properties and plant species composition of alluvial grasslands after the cessation of fertilizer application in the Czech Republic’, Agriculture, Ecosystems and Environment, (130) 123–130.
Kayser, M. and Isselstein, J., 2005, ‘Potassium cycling and losses in grassland systems: a review‘, Grass and Forage Science, (60) 213–224.
Kirkham, F. W. and Wilkins, R. J., 1994, ‘The productivity and response to inorganic fertilizers of species-rich wetland hay meadows on the Sommerset Moors: the effects of nitrogen, phosphorus and potassium on herbage production’, Grass and Forage Science, (49) 163–175.
Kirwan, L., Lüscher, A., Sebastia, M. T., Finn, J. A., Collins, R. P., Porqueddu, C., Helgadottir, S., Baadshaug, O. H., Brophy, C., Coran, C., Dalmannsdottir, S., Delgado, I., Elgersma, A., Fothegill, P., Frankow-Lindberg, B. E., Golinski, P., Grieu, P., Gustavsson, A. M., Höglind, M., Hueguenin-Elie, O., Iliadis, C., Jorgensen, M., Kadziuliene, Z., Karyotis, T., Lunnan, Malengier, M., Maltoni, S., Meyer, V., Nyfeler, D., Nykanen-Kurki, P., Parente, J., Smit, H. J., Thumm, U. and Connolly, J., 2007, ‘Evenness drives consistent diversity effects in intensive grassland systems across 28 European sites’, Journal of Ecology, (95) 530–539.
Klein, A.-M., Vaissière, B. E., Cane, J. H., Steffan-Dewenter, I., Cunningham, S. a., Kremen, C. and Tscharntke, T., 2007, ‘Importance of pollinators in changing landscapes for wild crops’, Proceedings of the Royal Society B., (274) 303–313.
Kleijn, D., Berendese, F., Smit, R., Gilissen, M., Smit, J., Brak, B. and Groeneveld, R., 2004, ‘Ecological effectiveness agri-environment schemes in different agricultural landscapes in The Netherlands’, Conservation Biology, (18) 775–786.
Kleijn, D. and Raemakers, I., 2008, ‘A retrospective analysis of pollen host plant use by stable and declining bumblebee species’, Ecology, (89) 1811–1823.
Knapp, A. K., Blair, J. M., Briggs, J. M., Collins, S. L., Hartnett, D. C., Johnson, L. C. and Towne, E. G., 1999, ‘The keystone role of bisons in North American tallgrass prairie’, Bioscience, (49) 39–50.
Knight, M. E., Osborne, J. L., Sanderson, R. A., Hale, R. J., Martin, A. P. and Goulson, D., 2009, ‘Bumblebee nest density and the scale of available forage in arable landscapes‘, Insect Conservation and Diversity, (2) 116–124.
Kohler, F., Verhulst, J., Knop, E., Herzog, F. and Kleijn, D., 2007, ‘Indirect effects of grassland extensification schemes on pollinators in two contrasting European countries’, Biological Conservation, (135) 302–307.
Kremen, C., Williams, N. M. and Thorp, R. W., 2002, ‘Crop pollination from native bees at risk from agricultural intensification‘, Proceedings of the National Academy of Sciences of the United States of America, (99) 16812–16816.
Kremen, C., Williams, N. M., Bugg, R. L., Fay, J. P. and Thorp, R. W., 2004, ‘The ares requirements on an ecosystem service: crop pollination by native bee communities in California’, Ecological Letters, (7) 1109–1119.
Kremen, C. and Chaplin, R., 2006, ‘Insect as providers of ecosystem services: crop pollination and pest control’, in: Steward, A. J. A., New, T. R. and Lewis, O. T. (eds), Insect Conservation Biology: Proceedings of the Royal Entomological Society´s 23rd Symposium, CABI Publishing, Wallingford.
Kremen, C., Neal, M., Williams, N. M., Aizen, M. A., Gemmill-Herren, B., LeBuhn, G., Minckley, R., Packer, L., Potts, S. G., Roulston, T., Steffan-Dewenter, I., Va´ zquez, D. P., Winfree, R., Adams, L., Crone, E. E., Greenleaf, S. S., Keitt, T. H., Klein, A.-M., Regetz, J. and Ricketts, T. H., 2007, ‘Pollination and other ecosystem services produced by mobile organisms: a conceptual framework for the effects of land-use change’, Ecological Letters, (10) 299–314.
Larsen, T. H., Williams, N. and Kremen, C., 2005, ’Extinction order and altered community structure rapidly disrupt ecosystem functioning‘, Ecological Letters, (8) 538–547.
Le Feon, V., Schermann-Legionnet, A., Delettre, Y., Aviron, S., Billeter, R., Bugter, R., Hendrickx, F., and Burel, F., 2010, ‘Intensification of agriculture, landscape composition and wild bee

72 Survey on grassland ecosystem services, Annex I
communities: A large scale study in four European countries’, Agriculture Ecosystems and Environment, (137) 143–150.
Loeser, M. R. R., Sisk, T. D. and Crews, T. E., 2007, ‘Impact of grazing intensity in an Arizona grassland’, Conservation Biology, (21) 87–97.
Lüscher, A., Finn, J. A., Connolly, J., Sebastià, M. T., Collins, R., Fothergill, M., Porqueddu, C., Brophy, C., Huguenin-Elire, O., Kirwan, L., Nyfeler, D. and Helgadóttir, A., 2008, ‘Benefits of sward diversity for agricultural grassland’, Biodiversity, (9) 29–32.
Masková, Z., Dolezal, J., Kvet, J. and Zemek, F., 2009, ‘Long-term functioning of a species-rich mountain meadow under different management regimes’, Agriculture, Ecosystems and Environment, (132) 192–202.
McNaughton, S. J., 1985, ‘Ecology of grazing ecosystem: the Serengeti’, Ecological Monographs, (55) 259–294.
MEA (Millenium Ecosystem Assessment) (2005): Ecosystems and Human Well-being: A Framework for Assessment, Island Press, Washington.
Nevens, F. and Rehuel, D., 2003, ‘Effects of cutting or grazing grass swards on herbage yield, nitrogen uptake and residual soil nitrate at different levels of N fertilization', Grass and Forage Science, (58) 432–449.
Niinemets, U. and Kull, K., 2005, ‘Co-limitation of plant primary productivity by nitrogen and phosphorus in a species-rich wooded meadow on calcareous soils’, Acta Oecologica, (28) 345–356.
Nyfeler, D., Huguenin-Elie, O., Suter, M., Frossard, E., Connolly, J. and Lüsch, A., 2009, ‘Strong mixture effects among four species in fertilized agricultural grassland led to persistent and consistent transgressive overyielding’, Journal of Applied Ecology, (46) 683–691.
Nyfeler, D., Huguenin-Elie, O., Suter, M., Frossard, E. and Lüsch, A., 2011, ‘Grass–legume mixtures can yield more nitrogen than legume pure stands due to mutual stimulation of nitrogen uptake from symbiotic and non-symbiotic so’, Agriculture, Ecosystems and Environment, (140) 155–163.
Olff, H. and Bakker, J. P., 1991, ‘Long-term dynamics of standing crop and species composition after the cessation of fertilizer application to mown grassland’, Journal of Applied Ecology, (28) 1040–1052.
Ollerton, J, Winfree, R. and Tarrant, S., 2011, ‘How many flowering plants are pollinated by animals?’ Oikos, (120) 321–326.
Pavlu, V., Hejcman, M., Pavlu, L. and Gaisler, J., 2006, ‘Effect of strip seeding of Trifolium repens on a sward under continuous cattle grazing’, Die Bodenkultur, (57) 17–23.
Plantureux, S., Peeters, A. and McCracken, D., 2005, ‘Biodiversity in intensive grasslands: Effect of management, improvement and challenges’, Agronomy Research, (3) 153–164.
Pontes, L. S., Carrére, P., Andueza, D., Louault, F. and Soussana, J. F., 2007, ‘Seasonal productivity and nutritive value of temperate grasses found in semi-natural pastures in Europe: responses to cutting frequency and N supply’, Grass and Forage Science, (62) 485–496.
Potts, S. G., Vulliamy, B., Dafni, A., Ne´Eman, G. and Willmer, PG., (2003), ‘Linking bees and flowers: how do floral communities structure pollinator communities?’ Ecology, (84) 2628–2642.
Potts, S. G., Vulliamy, B., Roberts, S., O´Toole, C., Dafni, A., Ne’Eman, G. and Willmer, P., 2005, Role of nesting resources in organising diverse bee communities in a Mediterranean landscape. Ecological Entomology, (30) 78–85.
Potts, S. G., Woodcock, B. A., Roberts, S. P. M., Tscheulin, T., Pilgram, E. S., Brown, V. K. and Tallowin, J. R., 2009, ‘Enhancing pollinator biodiversity in intensive grasslands’, Journal of Applied Ecology, (46) 369–379.
Potts, S. G., Biesmeijer, J. C., Kremen, C., Neumann, P., Schweiger, O. and Kunin, W. E., 2010a, ‘Global pollinator declines: trends, impacts and drivers’, Trends in Ecology and Evolution, (25) 345–353.
Potts, S. G., Roberts, S. P. M., Dean, R., Marris, G., Brown, M. A., Jones, R., Neumann, P. and Settele, J., 2010b, ‘Declines of managed honeybees and beekeepers in Europe’, Journal of Apicultural Research, (49) 15–22.
Redpath, N., Osgathorpe, L. M., Park, K. and Goulson, D., (2010), Crofting and bumblebee conservation: ‘The impact of land management practices on bumblebee populations in northwest Scotland’, Biological Conservation, (143) 482–500.
Reich, P. B, Tilman, D., Naeem, S., Ellsworth, D. S., Knops, J., Craine, J., Wedin, D. and Trost, J., 2004, ‘Species and functional group diversity independently influence biomass accumulation and its response to CO2 and N’, Proceedings of the National Academy of Science of the USA, (101) 10101–10106.

Survey on grassland ecosystem services, Annex I 73
Sjödin, N. J., 2007, ‘Pollinator behavioural responses to grazing intensity’, Biodiversity and Conservation, (16) 2103–2121.
Sjödin, N. J., Bengtsson, L. and Ekbom, B., 2008, ‘The influence of grazing intensity and landscape composition on the diversity of flower-visiting insects’, Journal of Applied Ecology, (45) 763–772.
Smit, H. J., Metzger, M. J. and Ewert, F., 2008, ‘Spatial distribution of grassland productivity and land use in Europe’, Agricultural systems, (98) 208–219.
Smith, L. P., 1960, ‘The relation between weather and meadow-hay yields in England. 1939-56’, Journal of the British Grassland Society, (28) 203–208.
Smits, N. A. C., Willems, J., H. and Bobbink, R., 2008, ‘Long-term after-effects of fertilization on the restoration of calcareous grasslands’, Applied Vegetation Science, (11) 279–286.
Statistik Austria, 2010, Statistik der Landwirtschaft 2009, Wien. Statistisches Bundesamt Deutschland, 2010 Steffan-Dewenter, I. and Tscharntke, T., 2001, ‘Succession of bee communities on fallows’, Ecography,
(24) 83–93. Steffan-Dewenter, I. and Tscharntke, T., 2002, ‘Insect communities and biotic interactions on
fragmented calcareous grasslands—a mini review’ Biological Conservation, (104) 275–284. Steffan-Dewenter, I., Klein, A. M., Alfert, T., Gaebele, V. and Tscharntke, T., 2006, ‘Bee diversity and
plant-pollinatorinteractions in fragmented landscapes’, in: Waser, N. M. and Ollerton, J. (eds), Specialization and generalization in plant-pollinator interactions, Chicago Press, Chicago.
Steffan-Dewenter, I. and Westphal, C., 2008, ‘The interplay of pollinatoir diversity, pollination services and landscape change’, Journal of Applied Ecology, (45) 737–741.
Swift, G., Morrison, M. W., Cleland, A. T., Smith-Taylor, C. A. B. and Dickson, M. W., 1992, ‘Comparison of white clover varieties and grazing’, Grass and Forage Science, (47) 8–13.
Tallowin, J. R. B. and Jefferson, R. G., 1999, ‘Hay production from lowland semi-natural grasslands: a review of implications for ruminant livestock systems’, Grass Forage Science, (54), 99–115.
Thiel-Egenter, C., Risch, A. C., Jurgensen, M. F., Page-Dumroese, D. S., Krüsi, B. O. and Schütz, M., 2007, ‘Response of a subalpine grassland to simulated grazing: aboveground productivity along soil phosphorus gradients’, Community Ecology, (8) 111–117.
Tilman, D., Knops, J., Wedin, D., Reich, P., Ritchie, M. and Siemann, E., 1997, ‘The influence of functional diversity and composition on ecosystem processes’, Science, (277) 1300–1302.
Tscharntke, T., Steffan-Dewenter, I., Kruess, A. and Thies, C., 2002, ‚Contribution of small habitat fragments to conservation of insect communities of grassland–cropland landscapes‘, Ecological Applications, (12) 354–363.
Tscharntke T., Klein, A. M., Kruess, A., Steffan-Dewenter, I. and Thies, C., 2005, ‘Landscape perspectives on agricultural intensifications and biodiversity – ecosystem service management’, Ecology Letters, (8) 857–874.
Tylianakis, J.M., Didham, R.K., Bascompte, J. and Wardle, D.A., 2008, ‘Global change and species interactions in terrestrial ecosystems’, Ecology Letters, (11) 1351–1363.
Unkovich, M., Sanford, P., Pate, J. and Hyder, M., 1998, ‘Effects of grazing on plant and soil nitrogen relations of pasture-crop rotations’, Australien Journal of Agricultural Research, (49) 475–485.
Vinther, F. D., 2006, ‘Effects of cutting frequency on plant production, N-uptake and N2 fixation in above- and below-ground plant biomass of perennial ryegrass-white clover swards’, Grass and Forage Science, (61) 154–163.
WallisDeVries, M. F., Poschlod, P. and Willems, J. H., 2002, ‘Challenges for the conservation of calcareous grasslands in northwestern Europe: integrating the requirements of flora and fauna’, Biological Conservation, (104) 265–273.
Weigelt, A., Weisser, W. W., Buchmann, N. and Scherer-Lorenzen M., 2009, ‘Biodiversity for multifunctional grasslands: equal productivity in high-diversity low-input and low-diversity high-input systems’, Biogeosciences, (6) 1695–1706.
Westphal, C., Steffan-Dewenter, I. and Tscharntke, T., 2003, ‘Mass-flowering crops enhance pollinator densities at a landscape scale’, Ecology Letters, (6) 961–965.
Williams, I. H., Corbet, S. A. and Osborne, J. L., 1991, ‘Beekeeping, wild bees and pollination in the European Community’, Bee World, (72) 170–180.
Wiliams, I. H., 1994, ‘The dependences of crop production within the European Union on pollination by honey bees’, Agricultural Zoology Reviews, (6) 229–257.

74 Survey on grassland ecosystem services, Annex I
Williams, I. H., 2002, ‘Insect pollination and crop production: A European perspective’, in: Kevan, P, and Fonseca VL, I., (ed.). Pollinating Bees – The conservation link between agriculture and nature, Ministry of Environment, Brasilia, 59–65.
Wilkins, R. J., Hopkins, A. and Hatch, D. J., 2003, ‘Grassland in Europe’, Grassland Science, (49) 258–266.
Winfree, R. and Kremen, C., 2009a, ‘Are ecosystem services stabilized by differences among species? A test using crop pollination’, Proceedings of the Royal Society of London, (276) 229–237.
Winfree, R., Aguilar, R., Vázquez, D. P., LeBuhn, G. and Aizen, M. A., 2009b, ‘A meta-analysis of bees' responses to anthropogenic disturbance’, Ecology (90) 2068–2076.
Yoshihara, Y., Chimeddorj, B., Buuveibaatar, B., Lhagvasuren, B. and Takatsuki, S., 2008, ‘Effects of livestock grazing on pollination on a steppe in east Mongolia’, Biological Conservation, (141) 2387–2386.
Zhang, G., Kang, Y., Han, G., Mei, H. and Sakurai, K., 2011, ‘Grassland degradation reduces the carbon sequestration capacity of the vegetation and enhances the soil carbon and nitrogen loss’, Acta Agriculturae Scandinavica Section B _ Soil and Plant Science, (61) 356–364.

Survey on grassland ecosystem services, Annex II 75

Survey on grassland ecosystem services, Annex II 76

Survey on grassland ecosystem services, Annex II 77

Survey on grassland ecosystem services, Annex II 78