Survey of Smaller firms’ pensions
28
St Clement's House, 27-28 Clement's Lane, London EC4N 7AE Tel: +44(0)20 3207 9380 Fax: +44 (0)20 3207 9134 EMail: [email protected] Web: www.aca.org.uk Survey of Smaller firms’ pensions Final Report of the ACA’s Smaller Firms Pensions Survey Conducted by the Association of Consulting Actuaries PUBLISHED – 4 JANUARY 2011
Transcript of Survey of Smaller firms’ pensions
St Clement's House, 27-28 Clement's Lane, London EC4N 7AE
Tel: +44(0)20 3207 9380 Fax: +44 (0)20 3207 9134 EMail: [email protected]
Web: www.aca.org.uk
Survey of
Smaller firms’ pensions
Final Report of the ACA’s Smaller Firms Pensions Survey
Conducted by the Association of Consulting Actuaries
PUBLISHED – 4 JANUARY 2011
2 | P a g e
Chairman’s Introduction: ACA Smaller Firms Pensions Survey
Pensions in smaller firms in many respects represent the ‘Achilles heel’ of UK provision. Despite initiatives
by successive governments, still only around a third of smaller firms – those with 250 or fewer employees –
provide any kind of scheme. And, as our biennial surveys of the sector have found since 1996, contribution
levels into the dominant types of scheme have stuck at stubbornly low levels despite the increasing cost of
building a sufficient pension as life-spans have stretched and economic conditions changed.
The latest government backed pension reforms – auto-enrolment and the launch of NEST – may well
extend pension coverage ‘into parts where it has not gone before’, but immense challenges remain in
achieving the end objective. That end objective needs to be maturing private pensions, when allied to
State provision, that produce sufficient income so the vast majority of pensioners in the future have the
prospect of a comfortable retirement. Pensions for many at near subsistence levels, still supported by
extensive and costly means testing, should not be where we remain.
For those fortunate enough to be nearing retiring with defined benefit pensions in this smaller firms sector
there still remains much greater certainty about the pension that will be delivered than for the greater
number of employees in defined contribution schemes. Our survey found smaller defined benefit schemes
are by and large better funded to meet their liabilities than two years ago with fewer than half in deficit.
However, due to their cost and the forward risks involved, now close to nine out of ten are closed to new
entrants and four out of ten to future accrual. Set against this, our survey has found savings by both
employers and employees into defined contribution schemes generally have failed to increase in line with
the cost of building a decent pension. Pension contributions into smaller firms’ defined contribution
schemes probably need to double on average to at least 15% of earnings if reasonable retirement incomes
are to be achieved. Whilst understandable, it is concerning that the minimum levels of pension
contributions under the auto-enrolment policy are very modest. If these levels become the norm,
emerging pensions are likely to disappoint, feeding further disillusionment with pensions.
Whilst the county’s dire economic position does not presently allow, it seems clear to me that if we are to
encourage a much wider proportion of our people to save adequately for their retirement, we will need to
make greater room for savings from individuals’ disposable incomes. Employers too will need new rewards
for boosting their pension contributions and greater freedom in pension design. Greater transparency and
low-cost products will play a part in this, as will better consumer financial education and auto-enrolment –
all of which is ‘work in progress’, with some areas more advanced than others, but more will be needed. A
plan to provide new incentives to save, building up over a number of years as the economy recovers, is
badly needed.
The smaller firms covered by this survey – so important to the UK economy in terms of employment and
innovation but – where pension provision is endemically weak – seem particularly needful of financial
incentives to kick start sufficient levels of pension saving.
Finally, I would like to thank all those firms that responded to the questionnaire for their help in providing
the information for this latest survey report.
Stuart M Southall
Chairman
Association of Consulting Actuaries
3 | P a g e
Summary results: ACA Smaller Firms Pensions Survey
Survey background
The survey was conducted by the Association of Consulting Actuaries (ACA) in the summer of 2010 for
online completion and was circulated to 12,000 of the UK’s smaller firms with 250 or fewer employees,
selected on a random basis. Responses were received from 404 firms. This survey focuses on general
pension trends, including contribution levels by employers and members, and also views on auto-
enrolment and NEST.
Executive Summary
Smaller firms and pensions
• 78% of firms responding to the survey employ 50 or fewer staff.
• The dominant types of scheme provided by respondents are Group Personal Pensions, Stakeholder
and trust based defined contribution schemes. Where final salary schemes are provided, 86% are
closed to new entrants and 41% also to future accrual.
• Across most types of schemes, membership participation is slightly below 60% of employees, with
Stakeholder pension participation lowest at, on average, 38% of eligible employees.
• Firms say the principal reasons why employees do not join existing schemes are ‘cost’ (84%), a
‘preference to spend’ (72%) and ‘disillusionment with pensions’ (69%).
• Firms not providing pensions say they do not principally because of ‘cost’ (96%), ‘economic
conditions in their sector’ (82%) and ‘insufficient competitive pressures’ (53%).
• A quarter of firms (24%) are reviewing their pension arrangements in the year ahead.
Pension spend and contributions
• 43% of firms do not have a target for their pension costs, but 29% are targeting employer pension
costs of 4% of payroll or more.
• 21% of firms are looking to decrease their pension spend, balanced by 14% aiming to increase spend.
• Firms responding to the survey report average combined employer and employee contributions into
defined contribution schemes ranging between 7.6% and 9.3% of earnings. Average combined
contributions into defined benefit schemes are 24% of earnings.
• The average ongoing funding level of defined benefit schemes responding to the survey was 82%
expressed as a percentage of liabilities. Of those 46% of schemes in deficit, a third said their
recovery plan was in excess of ten years.
4 | P a g e
Investment
• Over the last year only 8% of schemes said they had changed to a greater proportion of investments
in bonds as opposed to equities – a big reduction in the trend reported two years ago.
• 71% of defined contribution schemes offer a default investment fund, and 62% offer only one fund
manager.
• One in six (16%) of firms assist retirees by helping them with their open market option prior to
purchasing an annuity by providing them with a range of quotations.
Pension reform
• 73% of firms say they support an increase in the State Pension Age to age 67 being completed by
2026.
• 65% of firms running defined benefit schemes say that the Government should enact legislation
enabling schemes to index pensions in line with CPI if they so wish in the future.
• 67% of firms say they want a statutory override that would enable them to adjust scheme pension
age automatically as life-spans extend.
• 54% of smaller employers support the principle of auto-enrolment into workplace pensions.
Support for NEST is mixed. 43% of smaller employers agree with it, while the remainder are split
between those who would prefer commercial provision (11%) and those who disagree with the
concept altogether (46%).
• Only 1 in 5 smaller firms (21%) has as yet budgeted for the cost of auto-enrolment. However, 55%
say the introduction of auto-enrolment and NEST will ‘significantly’ add to their business costs.
• 62% of smaller firms are likely to auto-enrol current ‘non joiners’ into existing schemes.
• However, 20% say they will close their existing scheme and auto-enrol all employees into NEST.
Around a quarter (24%) of smaller firms say they will auto-enrol employees into a new firm’s
scheme, and a fifth will restrict entry into an existing scheme placing the balance of employees in
NEST, or will use NEST as a foundation scheme.
• Smaller firms expect an employee ‘opt-out’ rate after auto-enrolment of, on average, 35%.
• 29% of smaller firms are ‘likely’ or ‘highly likely’ to consider levelling-down to mitigate the cost of
auto-enrolling additional employees.
• 66% say that employers with one employee (and 50% with fewer than five employees) should be
exempt from auto-enrolment – a view rejected by the recent review of auto-enrolment.
• 53% say that the requirement to re-enrol ‘opters-out’ every three years should be removed – a view
rejected by the recent review of auto-enrolment.
• 61% say employees with less than 3 months’ service should not be auto-enrolled – a view now being
taken up by Government.
• 39% say auto-enrolment should await legislation that allows greater freedom in pension design.
5 | P a g e
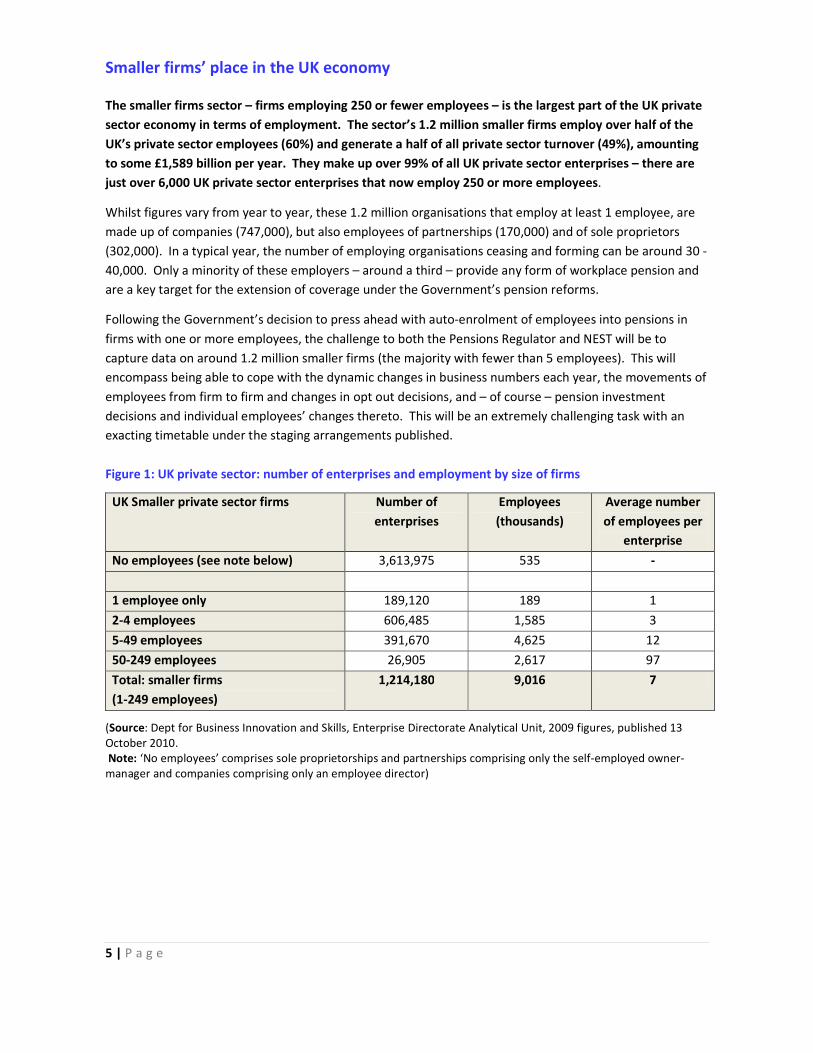
Smaller firms’ place in the UK economy
The smaller firms sector – firms employing 250 or fewer employees – is the largest part of the UK private
sector economy in terms of employment. The sector’s 1.2 million smaller firms employ over half of the
UK’s private sector employees (60%) and generate a half of all private sector turnover (49%), amounting
to some £1,589 billion per year. They make up over 99% of all UK private sector enterprises – there are
just over 6,000 UK private sector enterprises that now employ 250 or more employees.
Whilst figures vary from year to year, these 1.2 million organisations that employ at least 1 employee, are
made up of companies (747,000), but also employees of partnerships (170,000) and of sole proprietors
(302,000). In a typical year, the number of employing organisations ceasing and forming can be around 30 -
40,000. Only a minority of these employers – around a third – provide any form of workplace pension and
are a key target for the extension of coverage under the Government’s pension reforms.
Following the Government’s decision to press ahead with auto-enrolment of employees into pensions in
firms with one or more employees, the challenge to both the Pensions Regulator and NEST will be to
capture data on around 1.2 million smaller firms (the majority with fewer than 5 employees). This will
encompass being able to cope with the dynamic changes in business numbers each year, the movements of
employees from firm to firm and changes in opt out decisions, and – of course – pension investment
decisions and individual employees’ changes thereto. This will be an extremely challenging task with an
exacting timetable under the staging arrangements published.
Figure 1: UK private sector: number of enterprises and employment by size of firms
UK Smaller private sector firms Number of
enterprises
Employees
(thousands)
Average number
of employees per
enterprise
No employees (see note below) 3,613,975 535 -
1 employee only 189,120 189 1
2-4 employees 606,485 1,585 3
5-49 employees 391,670 4,625 12
50-249 employees 26,905 2,617 97
Total: smaller firms
(1-249 employees)
1,214,180 9,016 7
(Source: Dept for Business Innovation and Skills, Enterprise Directorate Analytical Unit, 2009 figures, published 13
October 2010.
Note: ‘No employees’ comprises sole proprietorships and partnerships comprising only the self-employed owner-
manager and companies comprising only an employee director)
6 | P a g e
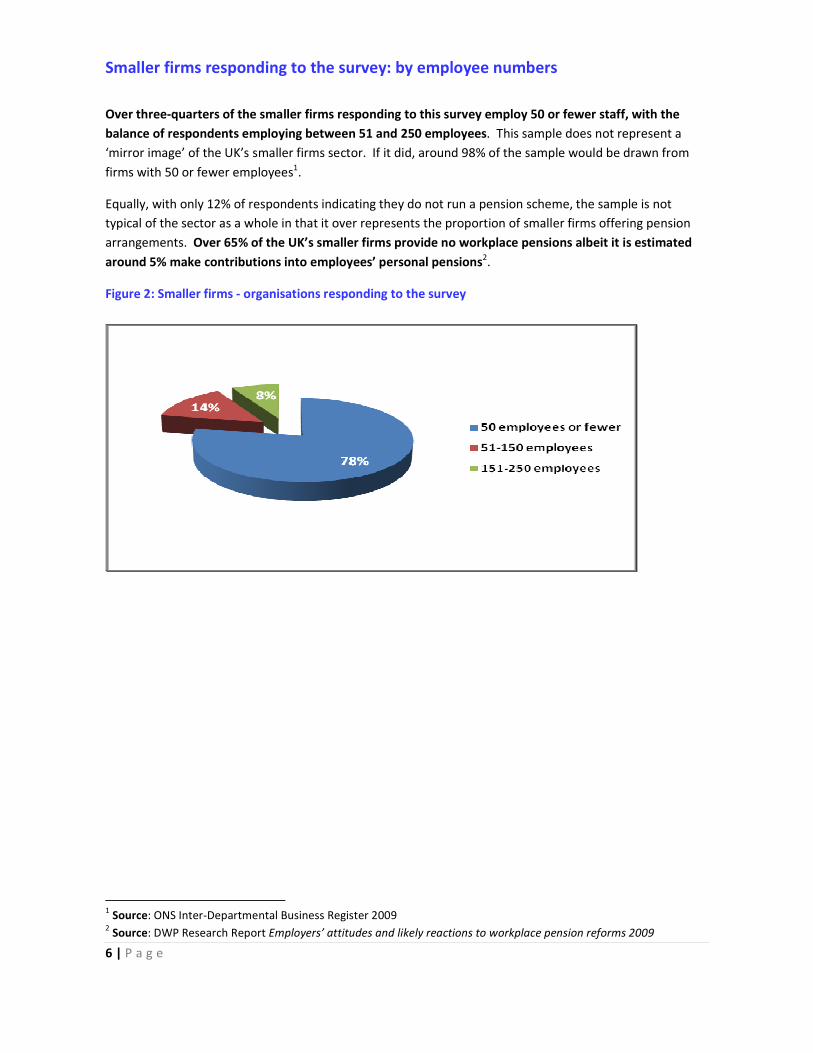
Smaller firms responding to the survey: by employee numbers
Over three-quarters of the smaller firms responding to this survey employ 50 or fewer staff, with the
balance of respondents employing between 51 and 250 employees. This sample does not represent a
‘mirror image’ of the UK’s smaller firms sector. If it did, around 98% of the sample would be drawn from
firms with 50 or fewer employees1.
Equally, with only 12% of respondents indicating they do not run a pension scheme, the sample is not
typical of the sector as a whole in that it over represents the proportion of smaller firms offering pension
arrangements. Over 65% of the UK’s smaller firms provide no workplace pensions albeit it is estimated
around 5% make contributions into employees’ personal pensions2.
Figure 2: Smaller firms - organisations responding to the survey
1 Source: ONS Inter-Departmental Business Register 2009
2 Source: DWP Research Report Employers’ attitudes and likely reactions to workplace pension reforms 2009
7 | P a g e
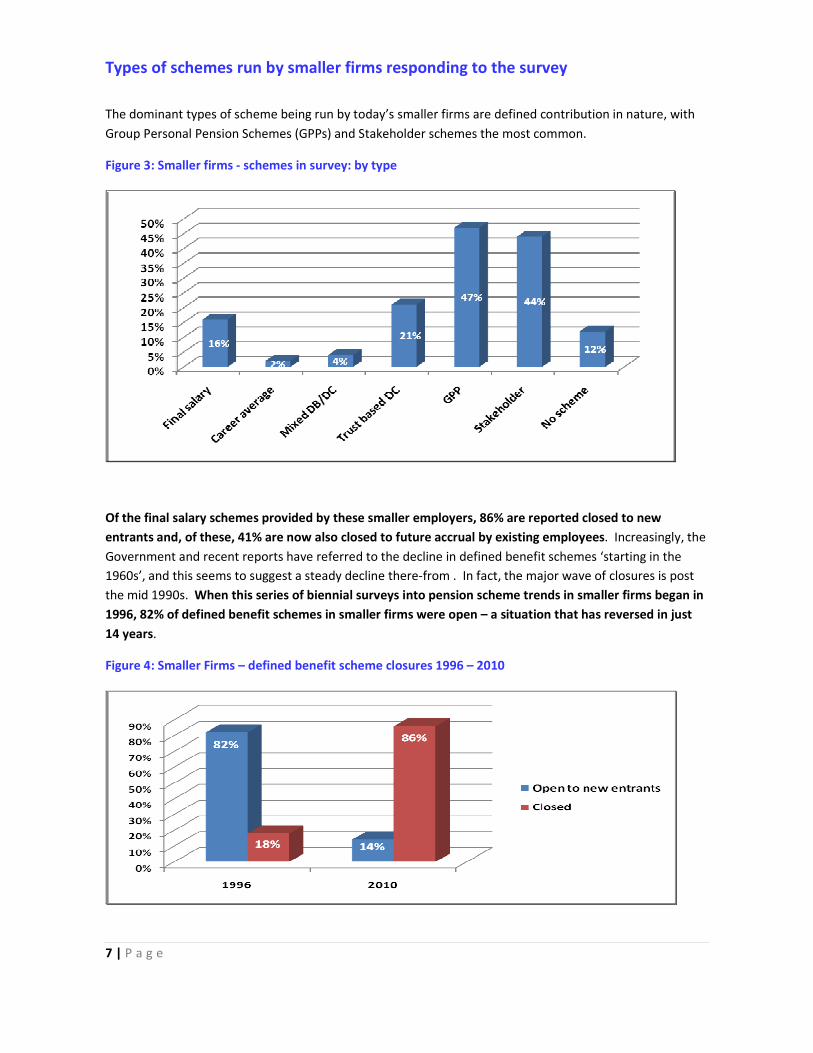
Types of schemes run by smaller firms responding to the survey
The dominant types of scheme being run by today’s smaller firms are defined contribution in nature, with
Group Personal Pension Schemes (GPPs) and Stakeholder schemes the most common.
Figure 3: Smaller firms - schemes in survey: by type
Of the final salary schemes provided by these smaller employers, 86% are reported closed to new
entrants and, of these, 41% are now also closed to future accrual by existing employees. Increasingly, the
Government and recent reports have referred to the decline in defined benefit schemes ‘starting in the
1960s’, and this seems to suggest a steady decline there-from . In fact, the major wave of closures is post
the mid 1990s. When this series of biennial surveys into pension scheme trends in smaller firms began in
1996, 82% of defined benefit schemes in smaller firms were open – a situation that has reversed in just
14 years.
Figure 4: Smaller Firms – defined benefit scheme closures 1996 – 2010

8 | P a g e
Reflecting a move away from trust based in favour of contract based defined contribution schemes, 11%
of trust based schemes are also reported as closed to new entrants, with the majority also closed to new
contributions from existing employees. The majority of firms reporting such a closure now offer either
GPPs or Stakeholder schemes.
Average scheme membership by eligible employees
Of those eligible to join workplace pension schemes in these smaller firms, average participation rates
vary between 38% in Stakeholder schemes (27% of Stakeholders reported ‘nil’ members) through to 61%
in Group Personal Pensions (GPPs). Of those firms responding to the survey just 6% already auto-enrol at
least some employees into a scheme.
With generally over 40% of employees not in membership of workplace schemes (with this rising to 100%
for the 12% of respondents who provide no scheme), there are clear cost implications for most smaller
firms when they have to auto-enrol employees into either existing ‘qualifying’ schemes or into NEST under
the Government’s staging and phasing schedule between 2014 and 2016. The degree of those cost
increases will hinge upon whether any scheme is offered at present, the level of opt-outs and the levels of
employer contributions into the future for existing and new members.
Figure 5: Smaller firms - scheme membership
9 | P a g e
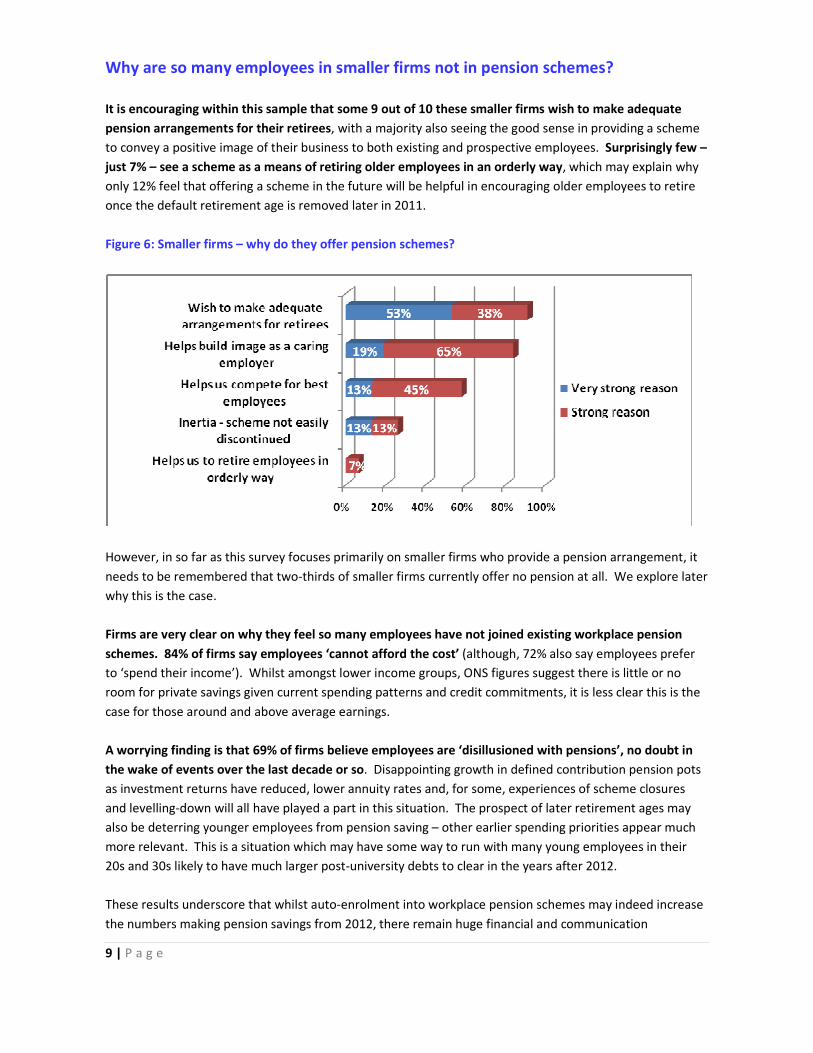
Why are so many employees in smaller firms not in pension schemes?
It is encouraging within this sample that some 9 out of 10 these smaller firms wish to make adequate
pension arrangements for their retirees, with a majority also seeing the good sense in providing a scheme
to convey a positive image of their business to both existing and prospective employees. Surprisingly few –
just 7% – see a scheme as a means of retiring older employees in an orderly way, which may explain why
only 12% feel that offering a scheme in the future will be helpful in encouraging older employees to retire
once the default retirement age is removed later in 2011.
Figure 6: Smaller firms – why do they offer pension schemes?
However, in so far as this survey focuses primarily on smaller firms who provide a pension arrangement, it
needs to be remembered that two-thirds of smaller firms currently offer no pension at all. We explore later
why this is the case.
Firms are very clear on why they feel so many employees have not joined existing workplace pension
schemes. 84% of firms say employees ‘cannot afford the cost’ (although, 72% also say employees prefer
to ‘spend their income’). Whilst amongst lower income groups, ONS figures suggest there is little or no
room for private savings given current spending patterns and credit commitments, it is less clear this is the
case for those around and above average earnings.
A worrying finding is that 69% of firms believe employees are ‘disillusioned with pensions’, no doubt in
the wake of events over the last decade or so. Disappointing growth in defined contribution pension pots
as investment returns have reduced, lower annuity rates and, for some, experiences of scheme closures
and levelling-down will all have played a part in this situation. The prospect of later retirement ages may
also be deterring younger employees from pension saving – other earlier spending priorities appear much
more relevant. This is a situation which may have some way to run with many young employees in their
20s and 30s likely to have much larger post-university debts to clear in the years after 2012.
These results underscore that whilst auto-enrolment into workplace pension schemes may indeed increase
the numbers making pension savings from 2012, there remain huge financial and communication
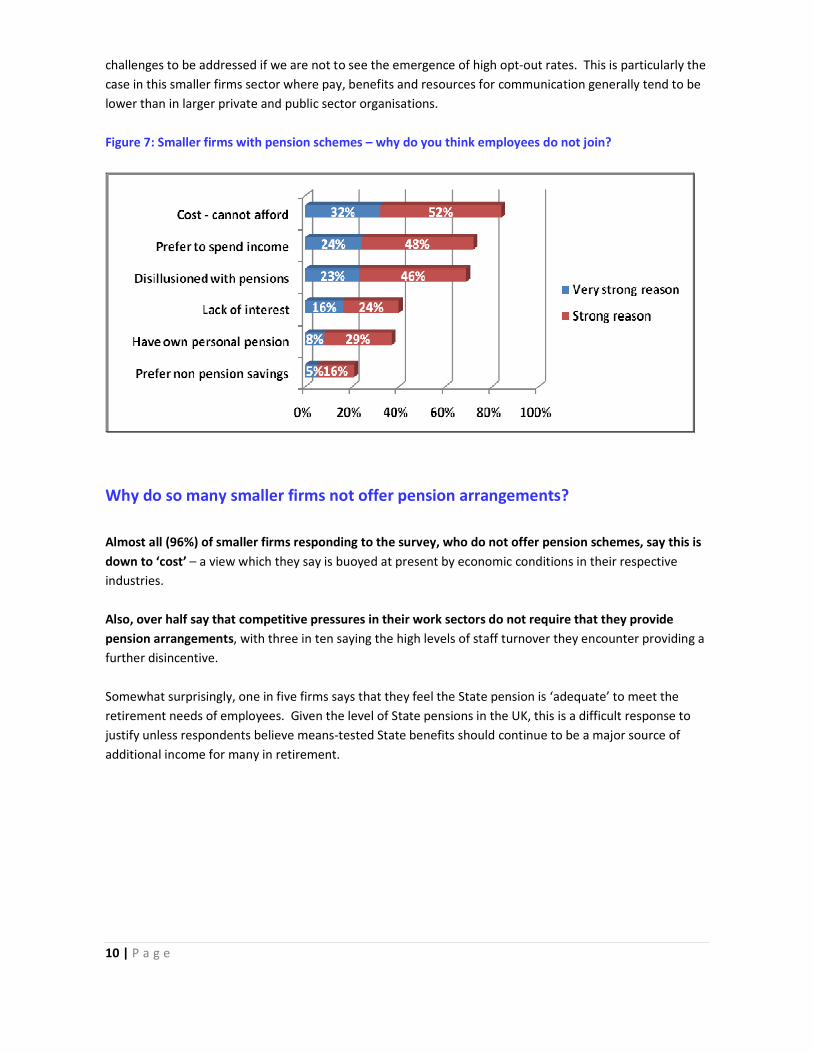
10 | P a g e
challenges to be addressed if we are not to see the emergence of high opt-out rates. This is particularly the
case in this smaller firms sector where pay, benefits and resources for communication generally tend to be
lower than in larger private and public sector organisations.
Figure 7: Smaller firms with pension schemes – why do you think employees do not join?
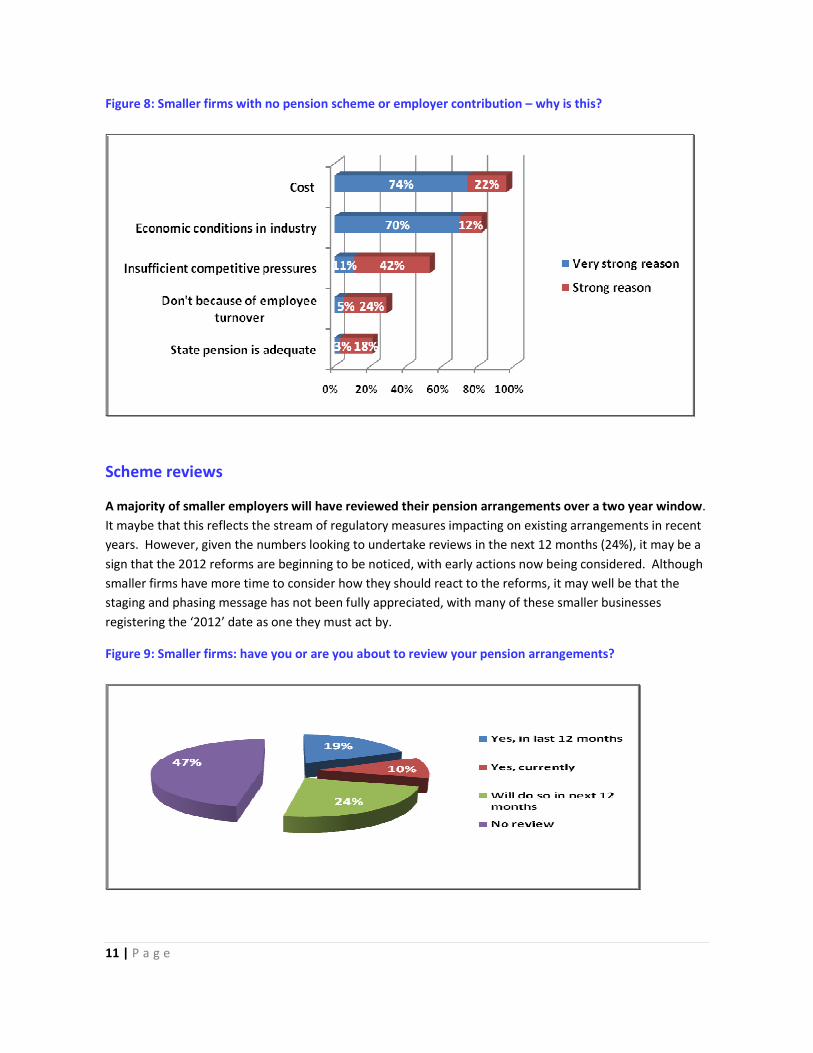
Why do so many smaller firms not offer pension arrangements?
Almost all (96%) of smaller firms responding to the survey, who do not offer pension schemes, say this is
down to ‘cost’ – a view which they say is buoyed at present by economic conditions in their respective
industries.
Also, over half say that competitive pressures in their work sectors do not require that they provide
pension arrangements, with three in ten saying the high levels of staff turnover they encounter providing a
further disincentive.
Somewhat surprisingly, one in five firms says that they feel the State pension is ‘adequate’ to meet the
retirement needs of employees. Given the level of State pensions in the UK, this is a difficult response to
justify unless respondents believe means-tested State benefits should continue to be a major source of
additional income for many in retirement.
11 | P a g e
Figure 8: Smaller firms with no pension scheme or employer contribution – why is this?
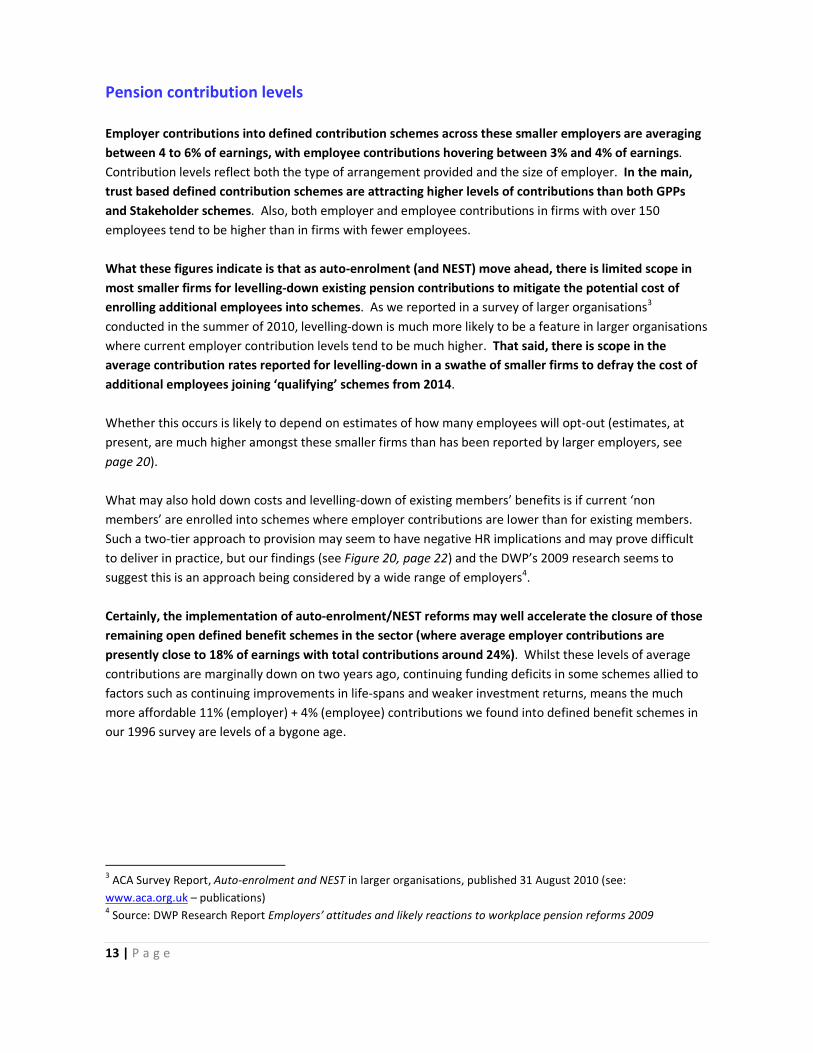
Scheme reviews
A majority of smaller employers will have reviewed their pension arrangements over a two year window.
It maybe that this reflects the stream of regulatory measures impacting on existing arrangements in recent
years. However, given the numbers looking to undertake reviews in the next 12 months (24%), it may be a
sign that the 2012 reforms are beginning to be noticed, with early actions now being considered. Although
smaller firms have more time to consider how they should react to the reforms, it may well be that the
staging and phasing message has not been fully appreciated, with many of these smaller businesses
registering the ‘2012’ date as one they must act by.
Figure 9: Smaller firms: have you or are you about to review your pension arrangements?

12 | P a g e
Targets for pension costs
Whilst four out of ten smaller firms do not have a target for their pension costs, it is encouraging that 3 in
10 are targeting employer pension costs of 4% of payroll or more (i.e. broadly in excess of the minimum
employer contribution levels that will come into full force from October 2017 for employees in membership
of ‘qualifying ’company schemes or NEST). The concern is that those saying ‘no target’ is made up of those
firms who presently make no workplace provision or where employer contributions are presently around
the minimum of 3% of earnings applying from late-2017.
Figure 10: Smaller firms: do you have a target as to what your business will spend on pensions as a
percentage of payroll?
However, given the difficult economic times many businesses are experiencing, it is relatively ‘good
news’ that those looking to reduce pension spend (21%) only modestly outnumber those looking to
increase spend (14%), with the majority holding to their current spend on pensions. Whether the
developing economic situation in 2011/12 may cause more businesses to ‘think twice’ about their budgets,
including pension costs, remains to be seen.
Figure 11: Smaller firms: overall, is your business trying to increase or decrease its’ spend on pensions?
13 | P a g e
Pension contribution levels
Employer contributions into defined contribution schemes across these smaller employers are averaging
between 4 to 6% of earnings, with employee contributions hovering between 3% and 4% of earnings.
Contribution levels reflect both the type of arrangement provided and the size of employer. In the main,
trust based defined contribution schemes are attracting higher levels of contributions than both GPPs
and Stakeholder schemes. Also, both employer and employee contributions in firms with over 150
employees tend to be higher than in firms with fewer employees.
What these figures indicate is that as auto-enrolment (and NEST) move ahead, there is limited scope in
most smaller firms for levelling-down existing pension contributions to mitigate the potential cost of
enrolling additional employees into schemes. As we reported in a survey of larger organisations3
conducted in the summer of 2010, levelling-down is much more likely to be a feature in larger organisations
where current employer contribution levels tend to be much higher. That said, there is scope in the
average contribution rates reported for levelling-down in a swathe of smaller firms to defray the cost of
additional employees joining ‘qualifying’ schemes from 2014.
Whether this occurs is likely to depend on estimates of how many employees will opt-out (estimates, at
present, are much higher amongst these smaller firms than has been reported by larger employers, see
page 20).
What may also hold down costs and levelling-down of existing members’ benefits is if current ‘non
members’ are enrolled into schemes where employer contributions are lower than for existing members.
Such a two-tier approach to provision may seem to have negative HR implications and may prove difficult
to deliver in practice, but our findings (see Figure 20, page 22) and the DWP’s 2009 research seems to
suggest this is an approach being considered by a wide range of employers4.
Certainly, the implementation of auto-enrolment/NEST reforms may well accelerate the closure of those
remaining open defined benefit schemes in the sector (where average employer contributions are
presently close to 18% of earnings with total contributions around 24%). Whilst these levels of average
contributions are marginally down on two years ago, continuing funding deficits in some schemes allied to
factors such as continuing improvements in life-spans and weaker investment returns, means the much
more affordable 11% (employer) + 4% (employee) contributions we found into defined benefit schemes in
our 1996 survey are levels of a bygone age.
3 ACA Survey Report, Auto-enrolment and NEST in larger organisations, published 31 August 2010 (see:
www.aca.org.uk – publications) 4 Source: DWP Research Report Employers’ attitudes and likely reactions to workplace pension reforms 2009
14 | P a g e
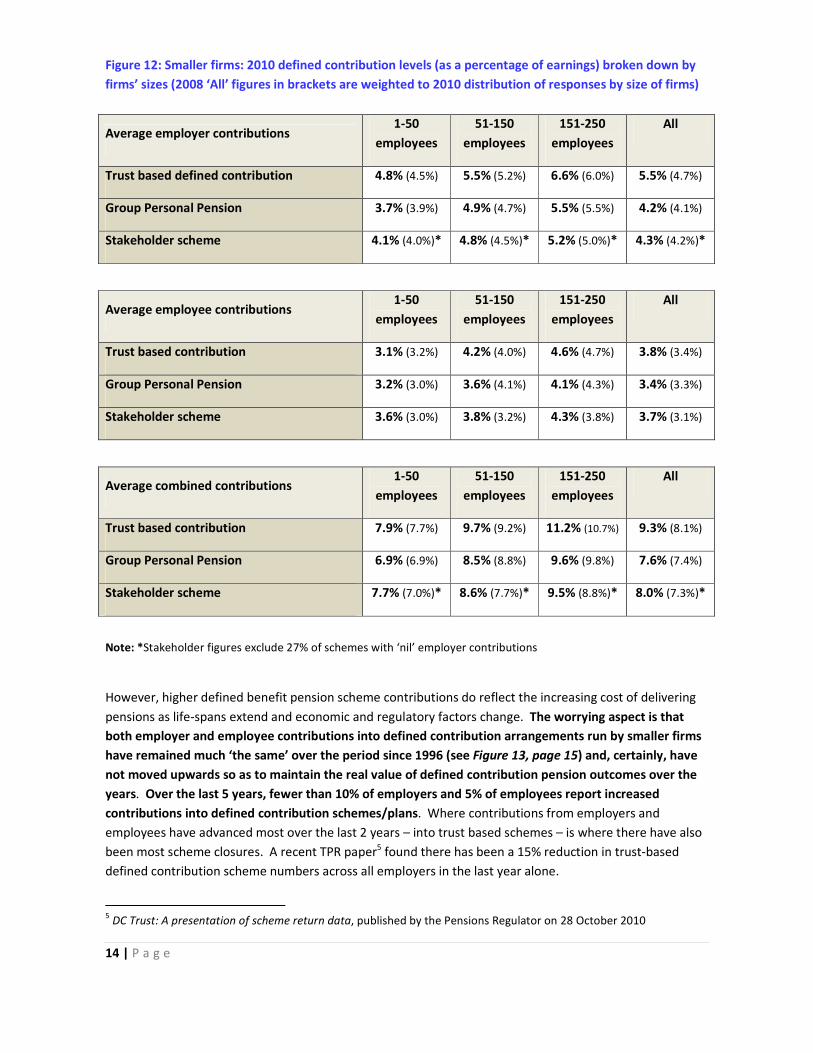
Figure 12: Smaller firms: 2010 defined contribution levels (as a percentage of earnings) broken down by
firms’ sizes (2008 ‘All’ figures in brackets are weighted to 2010 distribution of responses by size of firms)
Average employer contributions 1-50
employees
51-150
employees
151-250
employees
All
Trust based defined contribution 4.8% (4.5%) 5.5% (5.2%) 6.6% (6.0%) 5.5% (4.7%)
Group Personal Pension 3.7% (3.9%) 4.9% (4.7%) 5.5% (5.5%) 4.2% (4.1%)
Stakeholder scheme 4.1% (4.0%)* 4.8% (4.5%)* 5.2% (5.0%)* 4.3% (4.2%)*
Average employee contributions 1-50
employees
51-150
employees
151-250
employees
All
Trust based contribution 3.1% (3.2%) 4.2% (4.0%) 4.6% (4.7%) 3.8% (3.4%)
Group Personal Pension 3.2% (3.0%) 3.6% (4.1%) 4.1% (4.3%) 3.4% (3.3%)
Stakeholder scheme 3.6% (3.0%) 3.8% (3.2%) 4.3% (3.8%) 3.7% (3.1%)
Average combined contributions 1-50
employees
51-150
employees
151-250
employees
All
Trust based contribution 7.9% (7.7%) 9.7% (9.2%) 11.2% (10.7%) 9.3% (8.1%)
Group Personal Pension 6.9% (6.9%) 8.5% (8.8%) 9.6% (9.8%) 7.6% (7.4%)
Stakeholder scheme 7.7% (7.0%)* 8.6% (7.7%)* 9.5% (8.8%)* 8.0% (7.3%)*
Note: *Stakeholder figures exclude 27% of schemes with ‘nil’ employer contributions
However, higher defined benefit pension scheme contributions do reflect the increasing cost of delivering
pensions as life-spans extend and economic and regulatory factors change. The worrying aspect is that
both employer and employee contributions into defined contribution arrangements run by smaller firms
have remained much ‘the same’ over the period since 1996 (see Figure 13, page 15) and, certainly, have
not moved upwards so as to maintain the real value of defined contribution pension outcomes over the
years. Over the last 5 years, fewer than 10% of employers and 5% of employees report increased
contributions into defined contribution schemes/plans. Where contributions from employers and
employees have advanced most over the last 2 years – into trust based schemes – is where there have also
been most scheme closures. A recent TPR paper5 found there has been a 15% reduction in trust-based
defined contribution scheme numbers across all employers in the last year alone.
5 DC Trust: A presentation of scheme return data, published by the Pensions Regulator on 28 October 2010

15 | P a g e
With today’s annuities delivering typically 70% less pension than in 1996 for equivalent ‘pot’ sizes, the need
for increases in pension contributions (or other savings) is absolutely essential if we are not to see in the
future many old people living for an increasing number of years in very reduced circumstances in
retirement. For some, and alarmingly this may be a very sizeable and growing group given current
economic circumstances, pension saving will remain a distant prospect. Clearing costly debt and sheer
‘wherewithal’ may rightly prevent many from looking to pension savings now and, unfortunately, long into
the future.
However, beyond this group, persuading the wider public to think again about their spending and savings
priorities is not really even ‘work-in-progress’ in public policy terms, but this is an essential next step if we
are to reduce the proportion of those living on low incomes in later life.
Figure 13: Smaller firms – Comparison of employer and employee pension contributions (as a percentage
of earnings) 1996 – 2008/2010
Defined Benefit scheme funding and recovery plans
Whilst the number of smaller employers offering defined benefit schemes – and certainly schemes open to
new entrants and future accrual – has diminished markedly over the last 15 years, it is encouraging and
perhaps surprising that fewer than half (46%) of the firms running such schemes in this sample have been
advised by the Scheme Actuary that their scheme is in deficit.
This may be as a result of extra employer and employee contributions in recent years. And some 37% of
these schemes have made additional contributions over the last five years to improve their funding
position. As a result, the average ongoing funding level of the schemes covered by the survey, expressed
as a percentage of liabilities, is 82% (two years ago, the survey reported a 75% average funding level). This
position seems to endorse the Purple Book findings of the TPR/PPF that generally smaller schemes are
better funded than larger schemes6.
6 2010 Purple Book, DB Pensions Universe Risk Profile, page 42.

16 | P a g e
However, for those schemes that remain in deficit, the survey found a general lengthening of recovery
periods as compared to two years ago, with a third now being ten years or more, compared to just over a
fifth in 2008. Whilst the defined benefit sample is small, this seems to suggest a generally improving
funding position amongst smaller schemes, clouded by a minority of schemes run by firms where economic
circumstances may be stretching resources and thereby extending recovery plans.
Investment
Defined benefit schemes: strikingly, over the last year only 8% of schemes said they had changed to a
greater proportion of investments in bonds as opposed to equities (contrasting with 2008, when three-
quarters reported such a shift). 10% of schemes have however changed the balance of their investments to
incorporate or reduce other investments such as commodities and property, or to change the proportions
held in UK and overseas equities. On average, across the sample, 54% of scheme assets are passively
managed (an increase of 7 points on the situation found in 2008).
Defined contribution schemes: overall 71% of schemes offer a default fund, with this most prevalent
amongst the schemes run by larger employers in the sector. Three-quarters said their default strategy
offers a lifestyle fund. A quarter of the schemes (24%) have in excess of twenty-five fund options, but
62% offer only one fund manager.
One in six employers (16%) assist retirees by helping them with their open market option prior to
purchasing an annuity by providing them with a range of quotations. The balance leave the quotations
and decision to the individual.
Figure 14: Smaller firms – default funds are offered by majority of defined contribution schemes
17 | P a g e
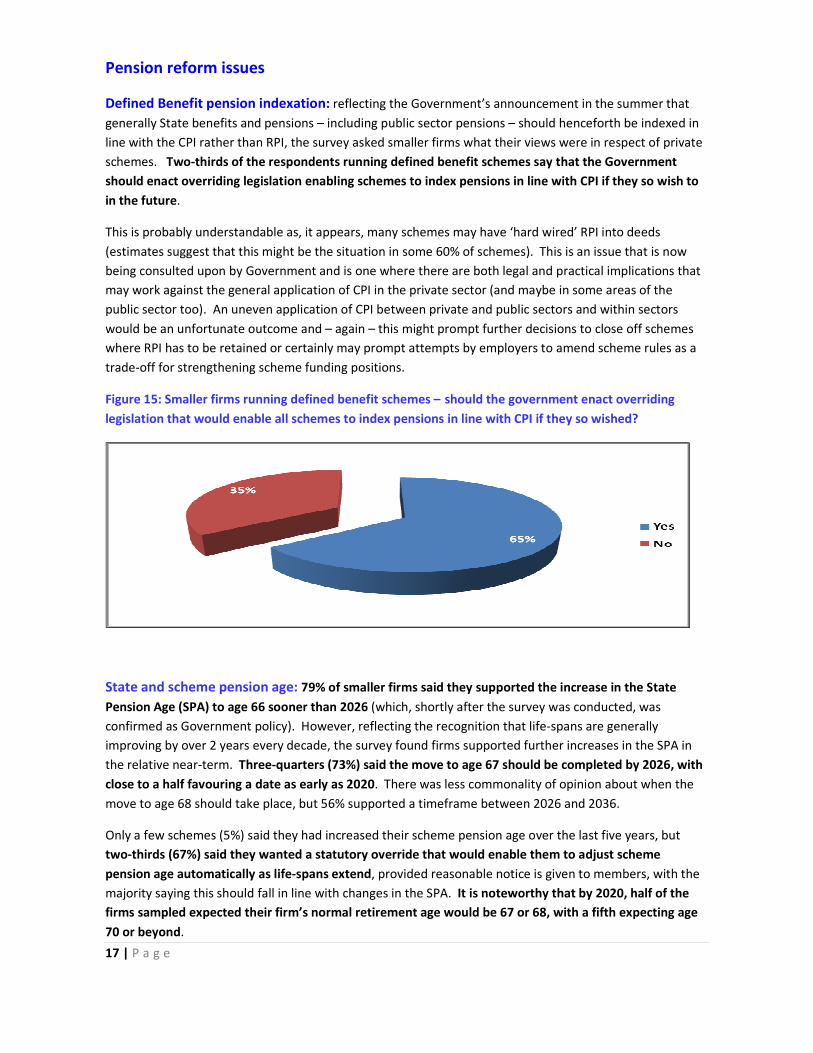
Pension reform issues
Defined Benefit pension indexation: reflecting the Government’s announcement in the summer that
generally State benefits and pensions – including public sector pensions – should henceforth be indexed in
line with the CPI rather than RPI, the survey asked smaller firms what their views were in respect of private
schemes. Two-thirds of the respondents running defined benefit schemes say that the Government
should enact overriding legislation enabling schemes to index pensions in line with CPI if they so wish to
in the future.
This is probably understandable as, it appears, many schemes may have ‘hard wired’ RPI into deeds
(estimates suggest that this might be the situation in some 60% of schemes). This is an issue that is now
being consulted upon by Government and is one where there are both legal and practical implications that
may work against the general application of CPI in the private sector (and maybe in some areas of the
public sector too). An uneven application of CPI between private and public sectors and within sectors
would be an unfortunate outcome and – again – this might prompt further decisions to close off schemes
where RPI has to be retained or certainly may prompt attempts by employers to amend scheme rules as a
trade-off for strengthening scheme funding positions.
Figure 15: Smaller firms running defined benefit schemes – should the government enact overriding
legislation that would enable all schemes to index pensions in line with CPI if they so wished?
State and scheme pension age: 79% of smaller firms said they supported the increase in the State
Pension Age (SPA) to age 66 sooner than 2026 (which, shortly after the survey was conducted, was
confirmed as Government policy). However, reflecting the recognition that life-spans are generally
improving by over 2 years every decade, the survey found firms supported further increases in the SPA in
the relative near-term. Three-quarters (73%) said the move to age 67 should be completed by 2026, with
close to a half favouring a date as early as 2020. There was less commonality of opinion about when the
move to age 68 should take place, but 56% supported a timeframe between 2026 and 2036.
Only a few schemes (5%) said they had increased their scheme pension age over the last five years, but
two-thirds (67%) said they wanted a statutory override that would enable them to adjust scheme
pension age automatically as life-spans extend, provided reasonable notice is given to members, with the
majority saying this should fall in line with changes in the SPA. It is noteworthy that by 2020, half of the
firms sampled expected their firm’s normal retirement age would be 67 or 68, with a fifth expecting age
70 or beyond.
18 | P a g e
Auto-enrolment and NEST
Smaller firms views on auto-enrolment and NEST were highlighted in our initial report on this survey. The
commentary has however been updated to reflect the Coalition Government’s decision in late October to
press ahead with the reforms, albeit with some changes in the detail, following on from the report by the
independent auto-enrolment reviewers commissioned by the government after the May general election.
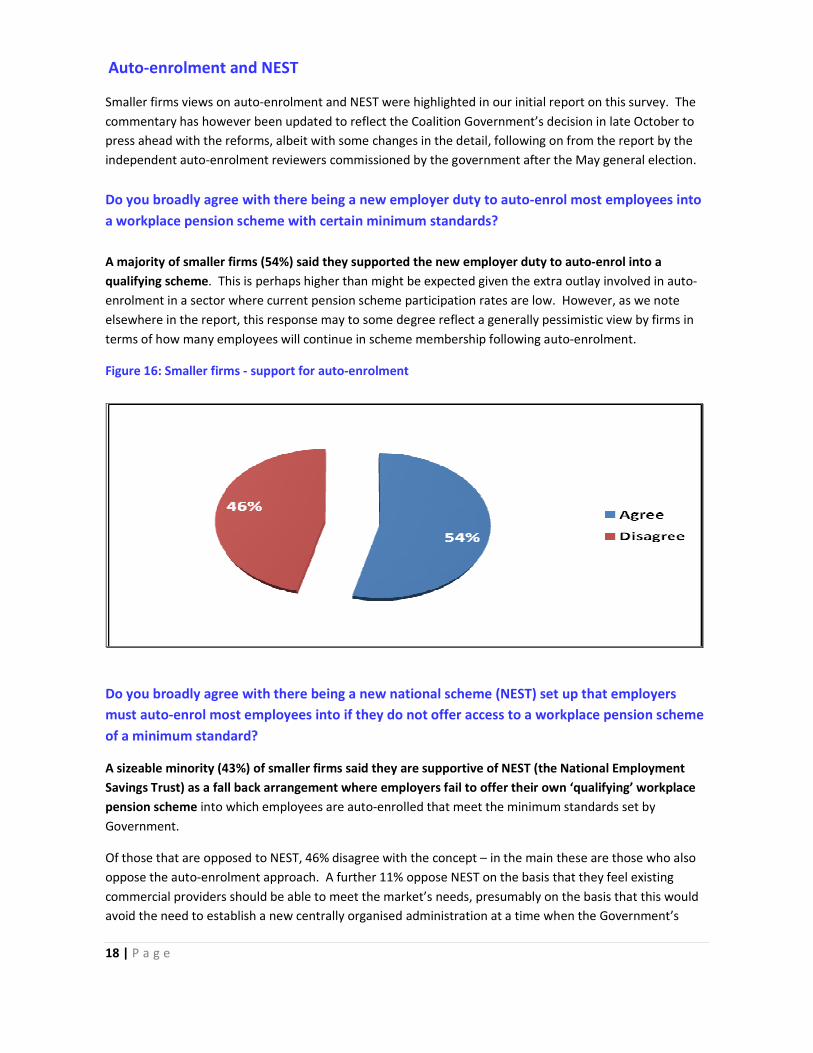
Do you broadly agree with there being a new employer duty to auto-enrol most employees into
a workplace pension scheme with certain minimum standards?
A majority of smaller firms (54%) said they supported the new employer duty to auto-enrol into a
qualifying scheme. This is perhaps higher than might be expected given the extra outlay involved in auto-
enrolment in a sector where current pension scheme participation rates are low. However, as we note
elsewhere in the report, this response may to some degree reflect a generally pessimistic view by firms in
terms of how many employees will continue in scheme membership following auto-enrolment.
Figure 16: Smaller firms - support for auto-enrolment
Do you broadly agree with there being a new national scheme (NEST) set up that employers
must auto-enrol most employees into if they do not offer access to a workplace pension scheme
of a minimum standard?
A sizeable minority (43%) of smaller firms said they are supportive of NEST (the National Employment
Savings Trust) as a fall back arrangement where employers fail to offer their own ‘qualifying’ workplace
pension scheme into which employees are auto-enrolled that meet the minimum standards set by
Government.
Of those that are opposed to NEST, 46% disagree with the concept – in the main these are those who also
oppose the auto-enrolment approach. A further 11% oppose NEST on the basis that they feel existing
commercial providers should be able to meet the market’s needs, presumably on the basis that this would
avoid the need to establish a new centrally organised administration at a time when the Government’s
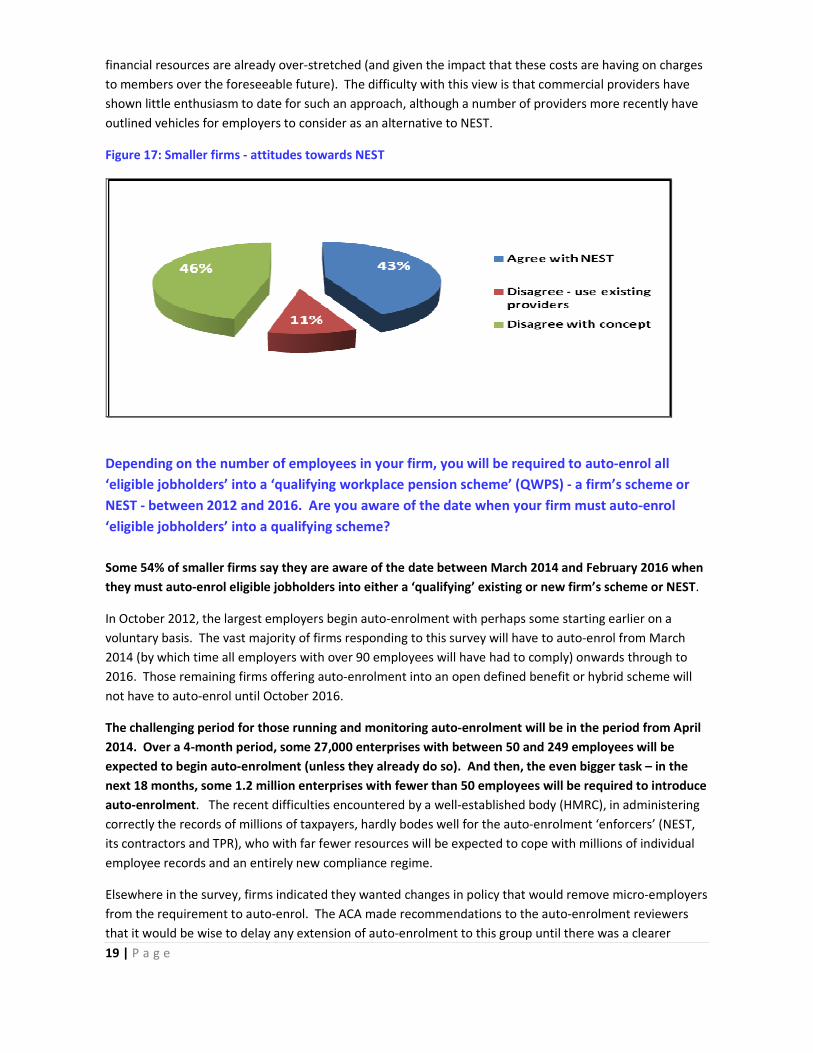
19 | P a g e
financial resources are already over-stretched (and given the impact that these costs are having on charges
to members over the foreseeable future). The difficulty with this view is that commercial providers have
shown little enthusiasm to date for such an approach, although a number of providers more recently have
outlined vehicles for employers to consider as an alternative to NEST.
Figure 17: Smaller firms - attitudes towards NEST
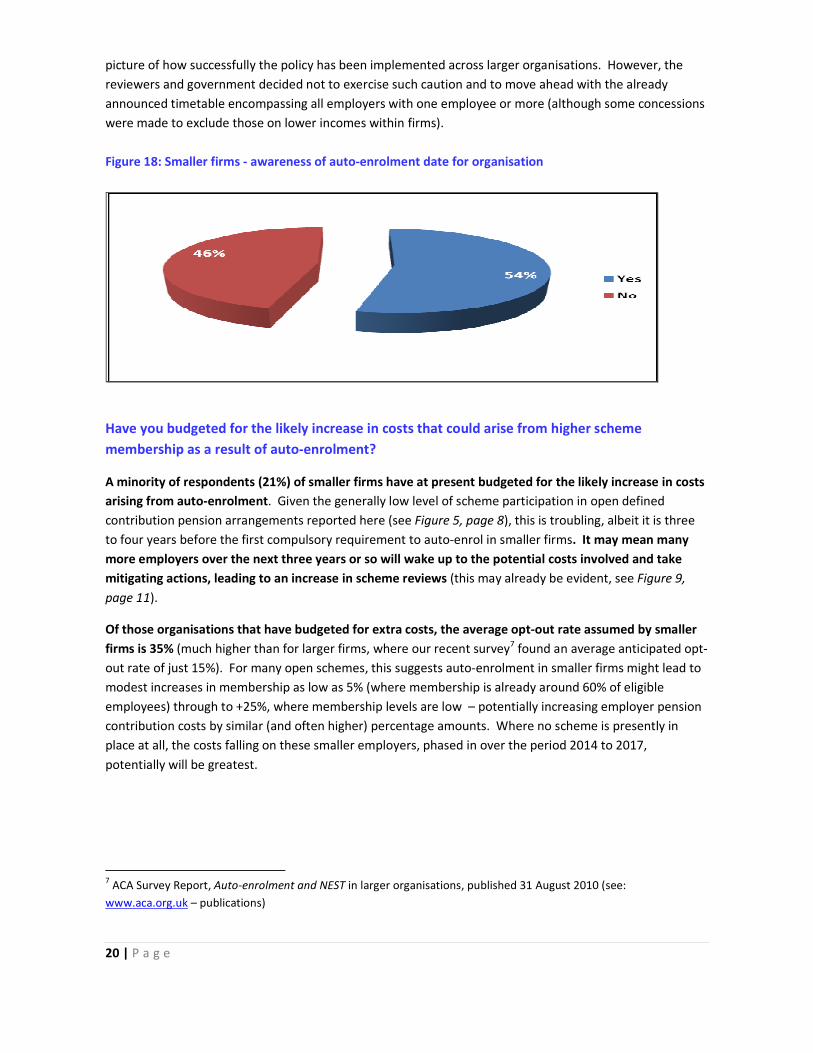
Depending on the number of employees in your firm, you will be required to auto-enrol all
‘eligible jobholders’ into a ‘qualifying workplace pension scheme’ (QWPS) - a firm’s scheme or
NEST - between 2012 and 2016. Are you aware of the date when your firm must auto-enrol
‘eligible jobholders’ into a qualifying scheme?
Some 54% of smaller firms say they are aware of the date between March 2014 and February 2016 when
they must auto-enrol eligible jobholders into either a ‘qualifying’ existing or new firm’s scheme or NEST.
In October 2012, the largest employers begin auto-enrolment with perhaps some starting earlier on a
voluntary basis. The vast majority of firms responding to this survey will have to auto-enrol from March
2014 (by which time all employers with over 90 employees will have had to comply) onwards through to
2016. Those remaining firms offering auto-enrolment into an open defined benefit or hybrid scheme will
not have to auto-enrol until October 2016.
The challenging period for those running and monitoring auto-enrolment will be in the period from April
2014. Over a 4-month period, some 27,000 enterprises with between 50 and 249 employees will be
expected to begin auto-enrolment (unless they already do so). And then, the even bigger task – in the
next 18 months, some 1.2 million enterprises with fewer than 50 employees will be required to introduce
auto-enrolment. The recent difficulties encountered by a well-established body (HMRC), in administering
correctly the records of millions of taxpayers, hardly bodes well for the auto-enrolment ‘enforcers’ (NEST,
its contractors and TPR), who with far fewer resources will be expected to cope with millions of individual
employee records and an entirely new compliance regime.
Elsewhere in the survey, firms indicated they wanted changes in policy that would remove micro-employers
from the requirement to auto-enrol. The ACA made recommendations to the auto-enrolment reviewers
that it would be wise to delay any extension of auto-enrolment to this group until there was a clearer
20 | P a g e
picture of how successfully the policy has been implemented across larger organisations. However, the
reviewers and government decided not to exercise such caution and to move ahead with the already
announced timetable encompassing all employers with one employee or more (although some concessions
were made to exclude those on lower incomes within firms).
Figure 18: Smaller firms - awareness of auto-enrolment date for organisation
Have you budgeted for the likely increase in costs that could arise from higher scheme
membership as a result of auto-enrolment?
A minority of respondents (21%) of smaller firms have at present budgeted for the likely increase in costs
arising from auto-enrolment. Given the generally low level of scheme participation in open defined
contribution pension arrangements reported here (see Figure 5, page 8), this is troubling, albeit it is three
to four years before the first compulsory requirement to auto-enrol in smaller firms. It may mean many
more employers over the next three years or so will wake up to the potential costs involved and take
mitigating actions, leading to an increase in scheme reviews (this may already be evident, see Figure 9,
page 11).
Of those organisations that have budgeted for extra costs, the average opt-out rate assumed by smaller
firms is 35% (much higher than for larger firms, where our recent survey7 found an average anticipated opt-
out rate of just 15%). For many open schemes, this suggests auto-enrolment in smaller firms might lead to
modest increases in membership as low as 5% (where membership is already around 60% of eligible
employees) through to +25%, where membership levels are low – potentially increasing employer pension
contribution costs by similar (and often higher) percentage amounts. Where no scheme is presently in
place at all, the costs falling on these smaller employers, phased in over the period 2014 to 2017,
potentially will be greatest.
7 ACA Survey Report, Auto-enrolment and NEST in larger organisations, published 31 August 2010 (see:
www.aca.org.uk – publications)
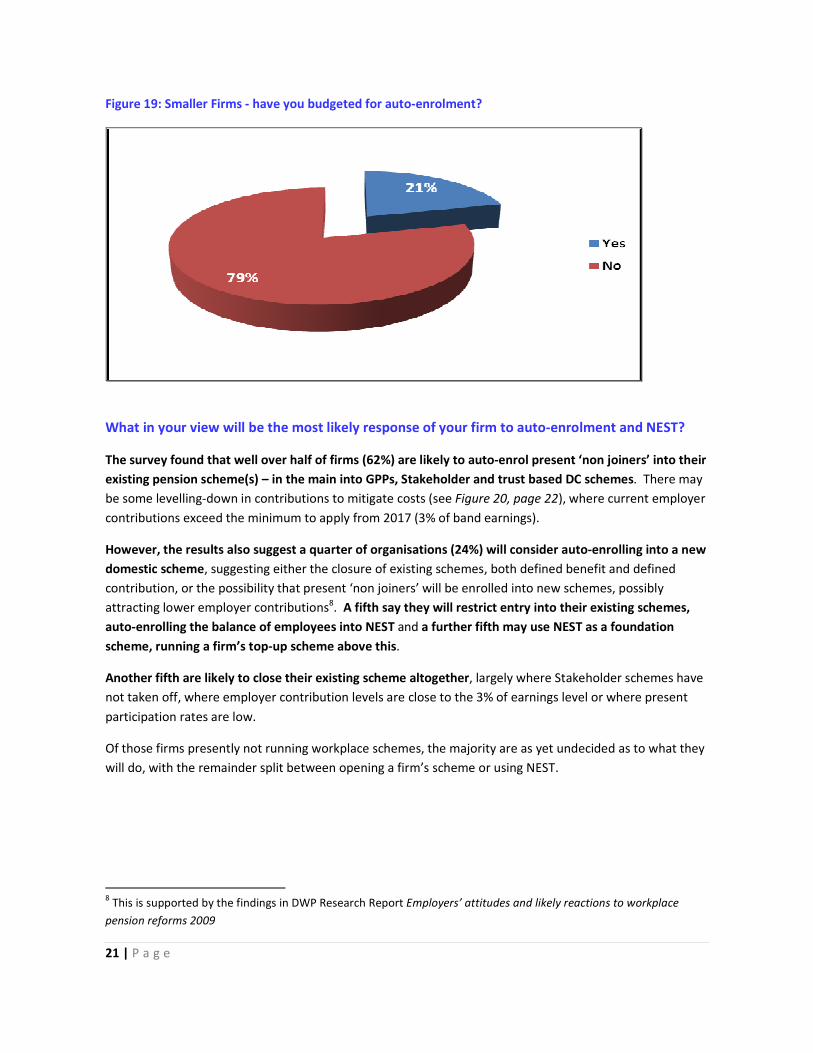
21 | P a g e
Figure 19: Smaller Firms - have you budgeted for auto-enrolment?
What in your view will be the most likely response of your firm to auto-enrolment and NEST?
The survey found that well over half of firms (62%) are likely to auto-enrol present ‘non joiners’ into their
existing pension scheme(s) – in the main into GPPs, Stakeholder and trust based DC schemes. There may
be some levelling-down in contributions to mitigate costs (see Figure 20, page 22), where current employer
contributions exceed the minimum to apply from 2017 (3% of band earnings).
However, the results also suggest a quarter of organisations (24%) will consider auto-enrolling into a new
domestic scheme, suggesting either the closure of existing schemes, both defined benefit and defined
contribution, or the possibility that present ‘non joiners’ will be enrolled into new schemes, possibly
attracting lower employer contributions8. A fifth say they will restrict entry into their existing schemes,
auto-enrolling the balance of employees into NEST and a further fifth may use NEST as a foundation
scheme, running a firm’s top-up scheme above this.
Another fifth are likely to close their existing scheme altogether, largely where Stakeholder schemes have
not taken off, where employer contribution levels are close to the 3% of earnings level or where present
participation rates are low.
Of those firms presently not running workplace schemes, the majority are as yet undecided as to what they
will do, with the remainder split between opening a firm’s scheme or using NEST.
8 This is supported by the findings in DWP Research Report Employers’ attitudes and likely reactions to workplace
pension reforms 2009
22 | P a g e
Figure 20: Smaller firms - organisation responses to auto-enrolment and NEST
Note: Where totals are below 100%, the balance of respondents said ‘not sure’.
Will you review existing scheme(s) benefits to mitigate the cost of higher scheme membership
from auto-enrolment?
Three out of ten firms (29%) are likely to review existing scheme benefits/contributions to mitigate the
cost of higher scheme membership from auto-enrolment. Given the numbers that have so far budgeted
for the costs of auto-enrolment (21% - see Figure 19, page 21), this may be a number that climbs as more
organisations identify potential cost increases over the next few years. Given current participation rates in
schemes (see Figure 5, page 8), and the anticipated increases in membership expected from auto-
enrolment suggested by this survey (increases in membership of 5-25% of employees), there must be the
expectation of some modest levelling-down of contributions, where these are presently higher than the
proposed minimum levels applying from 2017. There also may be adjustments to pay and employment
levels, or lower pension contribution rates for ‘non joiners’ and new entrants. Much is likely to hinge on
the economic situation over the next few years and how this impacts on business performance and costs.
Figure 21: Smaller firms: auto-enrolment: will your organisation mitigate the cost of higher scheme
membership
23 | P a g e
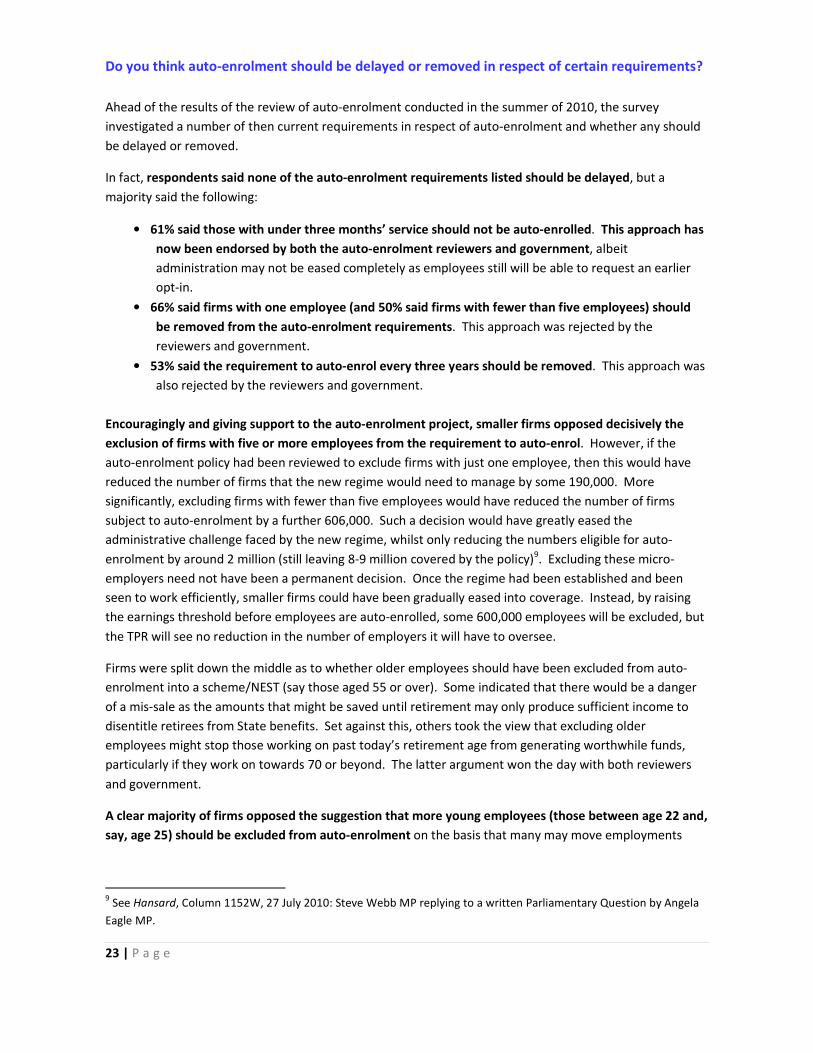
Do you think auto-enrolment should be delayed or removed in respect of certain requirements?
Ahead of the results of the review of auto-enrolment conducted in the summer of 2010, the survey
investigated a number of then current requirements in respect of auto-enrolment and whether any should
be delayed or removed.
In fact, respondents said none of the auto-enrolment requirements listed should be delayed, but a
majority said the following:
• 61% said those with under three months’ service should not be auto-enrolled. This approach has
now been endorsed by both the auto-enrolment reviewers and government, albeit
administration may not be eased completely as employees still will be able to request an earlier
opt-in.
• 66% said firms with one employee (and 50% said firms with fewer than five employees) should
be removed from the auto-enrolment requirements. This approach was rejected by the
reviewers and government.
• 53% said the requirement to auto-enrol every three years should be removed. This approach was
also rejected by the reviewers and government.
Encouragingly and giving support to the auto-enrolment project, smaller firms opposed decisively the
exclusion of firms with five or more employees from the requirement to auto-enrol. However, if the
auto-enrolment policy had been reviewed to exclude firms with just one employee, then this would have
reduced the number of firms that the new regime would need to manage by some 190,000. More
significantly, excluding firms with fewer than five employees would have reduced the number of firms
subject to auto-enrolment by a further 606,000. Such a decision would have greatly eased the
administrative challenge faced by the new regime, whilst only reducing the numbers eligible for auto-
enrolment by around 2 million (still leaving 8-9 million covered by the policy)9. Excluding these micro-
employers need not have been a permanent decision. Once the regime had been established and been
seen to work efficiently, smaller firms could have been gradually eased into coverage. Instead, by raising
the earnings threshold before employees are auto-enrolled, some 600,000 employees will be excluded, but
the TPR will see no reduction in the number of employers it will have to oversee.
Firms were split down the middle as to whether older employees should have been excluded from auto-
enrolment into a scheme/NEST (say those aged 55 or over). Some indicated that there would be a danger
of a mis-sale as the amounts that might be saved until retirement may only produce sufficient income to
disentitle retirees from State benefits. Set against this, others took the view that excluding older
employees might stop those working on past today’s retirement age from generating worthwhile funds,
particularly if they work on towards 70 or beyond. The latter argument won the day with both reviewers
and government.
A clear majority of firms opposed the suggestion that more young employees (those between age 22 and,
say, age 25) should be excluded from auto-enrolment on the basis that many may move employments
9 See Hansard, Column 1152W, 27 July 2010: Steve Webb MP replying to a written Parliamentary Question by Angela
Eagle MP.
24 | P a g e
rapidly and have other spending priorities in their early 20s. The reviewers and government supported
firms’ views on this issue.
Figure 22: Smaller firms: should auto-enrolment be removed as a requirement for:
Note: where totals fall short of 100%, the balance of respondents said ‘delay’
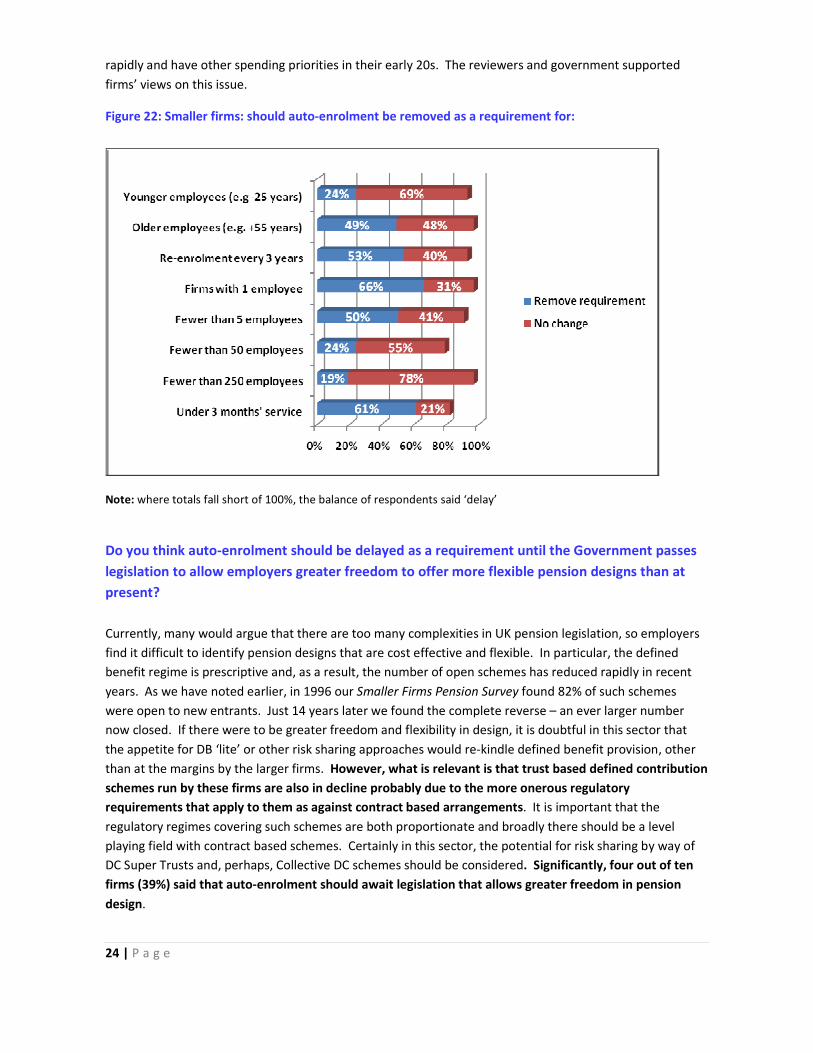
Do you think auto-enrolment should be delayed as a requirement until the Government passes
legislation to allow employers greater freedom to offer more flexible pension designs than at
present?
Currently, many would argue that there are too many complexities in UK pension legislation, so employers
find it difficult to identify pension designs that are cost effective and flexible. In particular, the defined
benefit regime is prescriptive and, as a result, the number of open schemes has reduced rapidly in recent
years. As we have noted earlier, in 1996 our Smaller Firms Pension Survey found 82% of such schemes
were open to new entrants. Just 14 years later we found the complete reverse – an ever larger number
now closed. If there were to be greater freedom and flexibility in design, it is doubtful in this sector that
the appetite for DB ‘lite’ or other risk sharing approaches would re-kindle defined benefit provision, other
than at the margins by the larger firms. However, what is relevant is that trust based defined contribution
schemes run by these firms are also in decline probably due to the more onerous regulatory
requirements that apply to them as against contract based arrangements. It is important that the
regulatory regimes covering such schemes are both proportionate and broadly there should be a level
playing field with contract based schemes. Certainly in this sector, the potential for risk sharing by way of
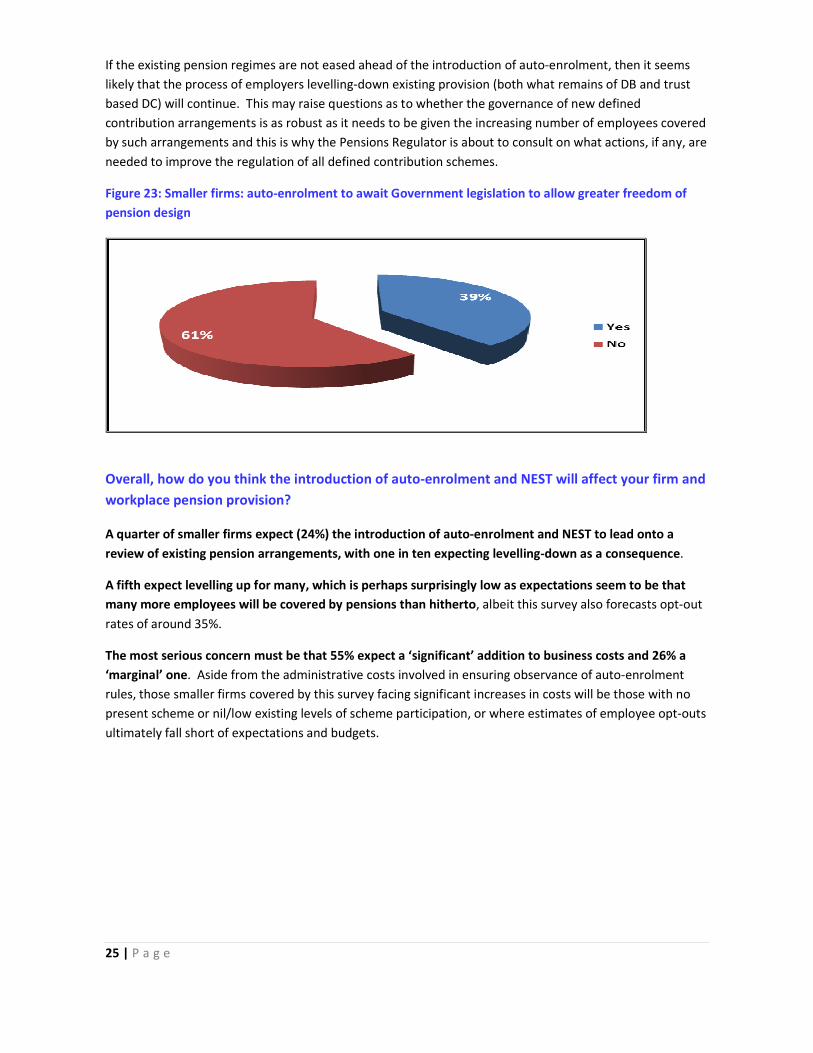
DC Super Trusts and, perhaps, Collective DC schemes should be considered. Significantly, four out of ten
firms (39%) said that auto-enrolment should await legislation that allows greater freedom in pension
design.
25 | P a g e
If the existing pension regimes are not eased ahead of the introduction of auto-enrolment, then it seems
likely that the process of employers levelling-down existing provision (both what remains of DB and trust
based DC) will continue. This may raise questions as to whether the governance of new defined
contribution arrangements is as robust as it needs to be given the increasing number of employees covered
by such arrangements and this is why the Pensions Regulator is about to consult on what actions, if any, are
needed to improve the regulation of all defined contribution schemes.
Figure 23: Smaller firms: auto-enrolment to await Government legislation to allow greater freedom of
pension design
Overall, how do you think the introduction of auto-enrolment and NEST will affect your firm and
workplace pension provision?
A quarter of smaller firms expect (24%) the introduction of auto-enrolment and NEST to lead onto a
review of existing pension arrangements, with one in ten expecting levelling-down as a consequence.
A fifth expect levelling up for many, which is perhaps surprisingly low as expectations seem to be that
many more employees will be covered by pensions than hitherto, albeit this survey also forecasts opt-out
rates of around 35%.
The most serious concern must be that 55% expect a ‘significant’ addition to business costs and 26% a
‘marginal’ one. Aside from the administrative costs involved in ensuring observance of auto-enrolment
rules, those smaller firms covered by this survey facing significant increases in costs will be those with no
present scheme or nil/low existing levels of scheme participation, or where estimates of employee opt-outs
ultimately fall short of expectations and budgets.

26 | P a g e
Figure 24: Smaller firms: overall, how will auto-enrolment impact on your organisation?
Note: ‘Addition to cost’ - 26% say ‘marginal’ additional cost and 55% say ‘significant’ increase in cost.

27 | P a g e
Summary of new employer duties under Auto-enrolment and NEST
The Pensions Commission Reports in 2005 and 2006 pointed to significant under-saving for retirement, notably
amongst low-to-moderate earners, with millions heavily reliant on inadequate State pensions. The then
Government responded by flagging its intention to restore the indexation of State Pension to earnings growth
alongside a number of other improvements (but with the State Pension Age gradually increasing in stages to 68)
Additionally, to boost pension coverage and to take in up to 10 million new pension savers, the Government
accepted the need for both a low-cost national scheme (now called NEST) for employees not offered access to an
employer’s scheme meeting certain minimum requirements and auto-enrolment into either NEST or an employer’s
scheme. Following an independent review over the summer of 2010 the coalition government has made a few
changes in the policy detail but has endorsed the launch of auto-enrolment and NEST from 2012.
The key features of the policy, as revised by the coalition government, are:
• a new employer duty is due to come into force from October 2012. From then, auto-enrolment of all ‘eligible
jobholders’ (those aged 22 and below State Pension Age) with earnings above £7,475pa (aligning the threshold with
the personal allowance for income tax from April 2011) into a ‘qualifying workplace pension scheme’ (QWPS) will
begin as a statutory requirement for the largest employers. Minimum contributions will however be calculated on
earnings above the national insurance primary threshold £5,720pa (presently) up to £33,540pa. All these earnings
figures will be up-dated for 2012.
• Medium sized and small employers will be required to auto-enrol their ‘eligible jobholders’ into a QWPS on a staged
basis geared to PAYE references, such that all employers, including single employee firms, will be integrated by
September 2016.
• ‘Jobholders’ aged over 16 and under 22 or over State Pension Age up to age 75 will be able to ask to be auto-
enrolled into a QWPS if they exceed the updated earnings level of £5,720pa (and the employer must comply and pay
the employer’s contribution). If they have no qualifying annual earnings above £5,720pa, they can enrol, but no
employer contribution is required. If they have earnings between £5,720pa and £7,475pa they can ask to be enrolled
and their employer will have to make a minimum contribution.
• All jobholders will have the right to ‘opt out’ (but eligible jobholders must be auto-enrolled first) and all eligible
jobholders will be re-enrolled every three years probably during a six month window, with a view to increasing
scheme coverage over time.
• During the staging period up to September 2016 the total minimum pension contributions will be 2% of employee
earnings, with a minimum of 1% from the employer. From October 2016 this will rise to 5% of employee earnings,
with a minimum of 2% from the employer. From October 2017 contributions will be 8% of employee earnings, with a
minimum of 3% coming from the employer plus 4% from the employee and 1% by way of tax relief. Earnings include
salary, wages, overtime, bonuses and commission, as well as statutory sick and maternity pay. The independent
reviewers recommended a ‘simple system’ by which employers could certify that their existing defined contribution
scheme meets the required contribution levels – a principle the government has accepted.
• Defined benefit and hybrid schemes will be exempt from staging – the duty to auto-enrol will instead be delayed
until October 2016.
• Employers will be able to auto-enrol eligible jobholders into a firm’s own existing (or new) QWPS, when this is
certified as such by the Pensions Regulator, or otherwise must enrol them in the new National Employment Savings
Trust (NEST), previously known as the ‘personal accounts’ scheme. A firm’s own scheme will only be certified as a
qualifying scheme if it reaches requirements that are at least equal to or better than NEST. There will be an optional
waiting period of up to 3 months before a worker needs to be auto-enrolled, although workers may opt in during the
waiting period.
• NEST has been developed as a trust-based, defined contribution, portable, low-cost scheme (0.3% annual
management charge plus 1.8% charge on each contribution until NEST set up costs are met), designed for the needs of
low-to-moderate earners. Its investment approach will reflect the needs of these groups.
• NEST will only accept transfers in and out of the scheme in very limited circumstances, but this may be reviewed.
28 | P a g e
© Association of Consulting Actuaries, 2011. All rights reserved. References to the research statistics
herein must be attributed to the Association. Otherwise, no part of this publication may be reproduced,
stored in a retrieval system or transmitted in any form or by any means, electronic, mechanical,
photocopying, recording or otherwise, without the permission of the Association of Consulting Actuaries.
The Association of Consulting Actuaries (ACA) is the representative body for UK consulting actuaries and
is the largest national grouping if consulting actuaries in the world.
Members of the ACA provide advice to thousands of pension schemes, including most of the country’s
largest schemes. Members are all qualified actuaries and all actuarial advice given is subject to the
Actuaries’ Code.
Report produced by
Association of Consulting Actuaries
St Clement's House, 27-28 Clement's Lane, London EC4N 7AE
Tel: +44(0)20 3207 9380 Fax: +44 (0)20 3207 9134 EMail: [email protected]
Web: www.aca.org.uk
January 2011