SURVEY OF SCHOOLS ICT IN DUCATION -...
12
SURVEY OF SCHOOLS: ICT IN EDUCATION COUNTRY PROFILE: NETHERLANDS November 2012
Transcript of SURVEY OF SCHOOLS ICT IN DUCATION -...
SURVEY OF SCHOOLS: ICT IN EDUCATION
COUNTRY PROFILE: NETHERLANDS
November 2012

Page 2
This report was prepared by the Contractor: European Schoolnet and University of Liège under contract SMART 2010/0039.
The views expressed in this report are those of the authors and do not necessarily reflect those of the European Commission. Neither the European Commission nor any person acting on behalf of the Commission is responsible for the information provided in this document.
Extracts and charts in this report are taken from Vier in Balans Monitor 2011, published by Kennisnet and used in accordance with Creative Commons license “Attribution + Non-commercial + No Derivative Works”. Attribution + Non-commercial + No Derivative Works 2.5 Netherlands. The user may copy, distribute, display and perform the work on the following conditions:
• Attribution. The user must attribute the work to Kennisnet. • Non-commercial. The user may not use the work for commercial purposes. • No derivative works. The user may not adapt the work. • In the event of re-use or distribution, the user must notify third parties of the license
conditions for this work. • The user may only deviate from one or more conditions with the prior consent of
Kennisnet. The above shall be without prejudice to the legal restrictions that apply to intellectual property.
(www.creativecommons.org/licenses)

Page 3
Table of Contents
1. Introduction ............................................................................................................................................... 4
ICT in the school education system of The Netherlands .............................................................................. 4
The Survey of Schools: ICT in Education ..................................................................................................... 4
Participation .................................................................................................................................................. 5
Key findings, as reported in Four in Balance ................................................................................................ 6
2. ICT infrastructure ...................................................................................................................................... 7
Availability of computers for educational purposes ...................................................................................... 7
Broadband .................................................................................................................................................... 8
‘Connectedness’ ........................................................................................................................................... 8
3. Frequency of ICT use in class .................................................................................................................. 9
Frequency of ICT use by teachers in class .................................................................................................. 9
Students’ ICT use ....................................................................................................................................... 10
4. Digital confidence ................................................................................................................................... 11
Teachers .................................................................................................................................................... 11
5. School policy, strategies and support measures .................................................................................... 12
Page 4
1. INTRODUCTION
ICT IN THE SCHOOL EDUCATION SYSTEM OF THE NETHERLANDS
In the Netherlands1 overall responsibility for the public-private education system lies with the ministry of Education, Culture. The ministry lays down conditions for primary and secondary education and the provinces have a limited role to play when it comes to managing education and its content. The administration and management of schools of primary and secondary general and vocational education is locally organised. Legislation requires schools to teach various subjects with an indication subject of what pupils must learn, in the form of attainment targets and benchmarks. Schools are free, within the framework set by the government, to decide how much time is spent on the various subjects and areas of the curriculum, and when. The only restriction relates to the minimum number of teaching periods per year, which is laid down by law. The number of periods to be spent on each subject or group of subjects in the form of a study load table is prescribed by law but is up to the schools to group the attainment targets into subjects, projects, areas of learning and so on, to work them out in detail by type of education, to set standards, choose teaching aids
According to Eurydice’s Key Data on Learning and Innovation through ICT at school in Europe2, in the Netherlands there are national strategies covering training measures for ICT in schools, e-inclusion, digital/media literacy and e-skills development, and research projects3 for ICT in schools and e-learning. There are central steering documents for one area of ICT learning objectives4 at primary and secondary education level, searching for information. In primary and secondary schools ICT is taught as a general tool for other subjects/or as a tool for specific tasks in other subjects. There are no recommendations, suggestions, or support provided for ICT hardware or for ICT software categories5. There are no official steering documents for students or teachers in the use of ICT in class or for complementary activities in subjects. There are no central recommendations on the use of ICT in student assessment. Public-private partnerships for promoting the use of ICT are encouraged.
THE SURVEY OF SCHOOLS: ICT IN EDUCATION
In 2011, the European Commission Directorate General Communications Networks, Content and Technology6 launched the Survey of Schools: ICT in Education, the primary goal of which is to benchmark countries' performance in terms of access, use and attitudes to ICT at grades 4, 8 and 11. The Survey of Schools is one of a series within the European Union's cross-sector benchmarking activities comparing national progress to Digital Agenda for Europe (DAE) and EU2020 goals. The
1 https://webgate.ec.europa.eu/fpfis/mwikis/eurydice/index.php?title=Home
2http://eacea.ec.europa.eu/education/eurydice/documents/key_data_series/129EN.pdf, published in 2011, specifically the following tables and associated commentaries: A6, B6, B7, C2, C3, C4, C12 and E10
3 from the following areas: ICT in schools, e-learning, e-inclusion, digital/media literacy, e-skills development
4i.e. knowledge of computer hardware and electronics, using a computer, using mobile devices, using office applications, searching for information, using multimedia, developing programming skills, and using social media
5 from a range of hardware and software, i.e. computers, projectors or beamers, DVDs, videos, TV, cameras, mobile devices, e-book readers, smartboards, virtual learning environments; tutorial software, office applications, multimedia applications, digital learning games, communication software, digital resources.
6 www.ec.europa.eu/dgs/connect/

Page 5
Survey is funded by the European Commission Communications Networks, Content and Technology Directorate General and is a partnership between European Schoolnet and the Service d’Approches Quantitatives des faits éducatifs in the Department of Education of the University of Liège. The survey took place between January 2011 and May 2012, with data collection in autumn 2011, and covered 31 countries (the EU27, Croatia, Iceland, Norway and Turkey). In four countries (Germany, Iceland, Netherlands and the United Kingdom) the response rate was insufficient, making reliable analysis of the data impossible; therefore the findings in this report are based on data from 27 countries.
This country profile is one of 31 country briefs and should be read in conjunction with the Report of the Survey of Schools: ICT in Education (the ‘main report’). It is different from the other country profiles in that the response rate in the Netherlands fell short of the target threshold (see below), but there is an annual survey in the Netherlands on ICT in schools, Vier in Balans Monitor 2011, published by Kennisnet. This short profile therefore highlights results from this publication and compares them where possible with comparable findings and results from the Survey of Schools: ICT in Education. All data for the Netherlands is from this source and text taken from the Four in Balance report (English translation) is reproduced within quotation marks.
Other country profiles present key indicators concerning access, use and attitudes to Information and Communication Technology in primary and secondary schools derived from responses to surveys completed by head teachers, teachers and students in autumn 2011, showing national results against the EU average.
The full report, country profiles, background information, questionnaires, tables, details of the methodology and the raw data are freely available at https://ec.europa.eu/digital-agenda/en/pillar-6-enhancing-digital-literacy-skills-and-inclusion. The authors may be contacted at [email protected] and information about the survey is at http://essie.eun.org.
PARTICIPATION
For the Survey of Schools: ICT and Education, in most countries, 300 schools were selected at random at each of three levels (grade 4, 8, 11 general, but not 11 vocational in the Netherlands) and invited to participate in the survey. Fig. 1.1 shows the percentage of those schools in which at least one survey questionnaire was submitted, the EU average ranging from 35 to 40 percent depending on the grade. In the Netherlands participation fell below the 20% threshold at all grades and so no further analysis of results took place.
10
3
3
37
40
35
36
0 20 40 60 80 100
Grade 4
Grade 8
Grade 11 gen
Grade 11 voc
Fig. 1.1: Participation rates (% of sampled schools with at least one questionnaire completed, all grades, Netherlands
and EU, 2011-12)
Netherlands
EU mean
Page 6
KEY FINDINGS, AS REPORTED IN FOUR IN BALANCE
Infrastructure
• “The ratio of computers to pupils at school is the same as last year: one computer for every five pupils.
• The adoption of interactive whiteboards has gone much faster than school managers had anticipated in previous surveys. Almost every school now has one or more interactive whiteboards.
• Wireless Internet and optical fiber connections are becoming standard at secondary schools and in the vocational education and training sector
• The majority of pupils in vocational education and training take their own laptops with them to school. This happens much less in secondary education, and scarcely at all in primary school
Compared with schools in neighbouring countries, schools in the Netherlands are among the top in the European Union in terms of ICT infrastructure.”
Use of ICT • “Three quarters of teachers use computers during lessons. This number has increased by 2 to
3% in recent years. • Teachers spend an average of 8 hours a week using computers in their lessons, • Two thirds of teachers feel that they are sufficiently or more than sufficiently familiar with the
various options that ICT can offer them in their teaching. • Teachers mainly use standard office applications such as word processing programs and e-
mail. Slightly more than half of teachers also used software associated with a course/coursebook or a subject-specific program.
• A fourth of all learning material is digital”
Confidence in using ICT
• “School managers say that eight out of ten teachers have satisfactory technical ICT skills; for example, they can use a word processing program and the Internet.
• School managers estimate that almost six out of ten teachers have mastered the pedagogical skills they need to use ICT in their teaching.”
Support and Strategies
• “Approximately eight out of ten schools have an ICT policy plan. About half of these schools are actually implementing this plan.” 7
.
7 Source: Vier-in-Balans Monitor 2011 (English version ‘Four in Balance’) published by Kennisnet
Page 7
2. ICT INFRASTRUCTURE
AVAILABILITY OF COMPUTERS FOR EDUCATIONAL PURPOSES
A computer is defined as a desktop or laptop, netbook or tablet computer, whether or not connected to the internet, available for educational purposes in school.
In the Netherlands:
“The ratio of computers to pupils in primary, secondary and vocational education is one to five. This is the same as last year.
Ten to fifteen per cent of the computers used in primary and secondary education are laptops; the number of laptops in vocational education and training is larger, i.e. somewhat more than 25%. A number of schools have set themselves the aim of having one laptop for each pupil. There are very few laptops, if any, in primary education. Close to 90% of vocational education and training programs and almost all primary and secondary schools now have an interactive whiteboard. The adoption of interactive whiteboards has gone much faster than school managers had anticipated in previous surveys. The percentage of schools with an interactive whiteboard is reaching saturation point8”
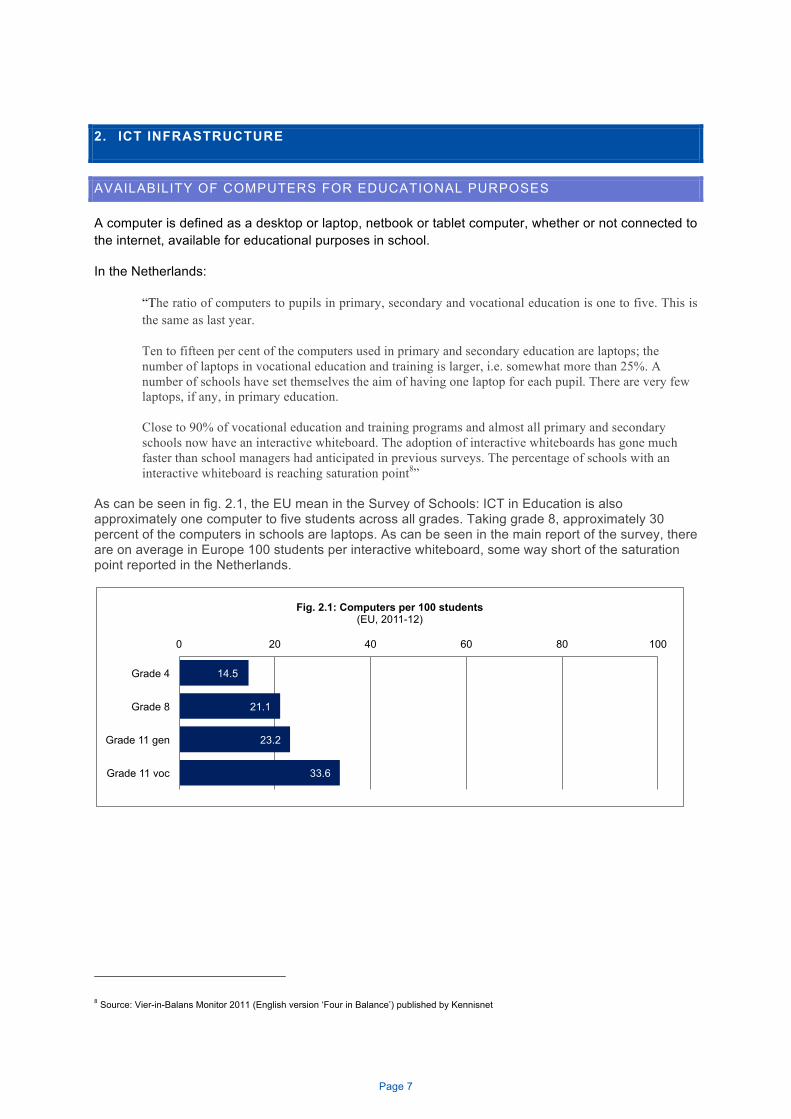
As can be seen in fig. 2.1, the EU mean in the Survey of Schools: ICT in Education is also approximately one computer to five students across all grades. Taking grade 8, approximately 30 percent of the computers in schools are laptops. As can be seen in the main report of the survey, there are on average in Europe 100 students per interactive whiteboard, some way short of the saturation point reported in the Netherlands.
8 Source: Vier-in-Balans Monitor 2011 (English version ‘Four in Balance’) published by Kennisnet
14.5
21.1
23.2
33.6
0 20 40 60 80 100
Grade 4
Grade 8
Grade 11 gen
Grade 11 voc
Fig. 2.1: Computers per 100 students (EU, 2011-12)
Page 8
BROADBAND
In The Netherlands:
“Almost every computer used in the education sector has Internet access. Eight out of ten secondary and vocational schools have an optical fiber connection to the Internet. That is not the case in primary education, where only three out of ten schools have an optical fiber connection.9”
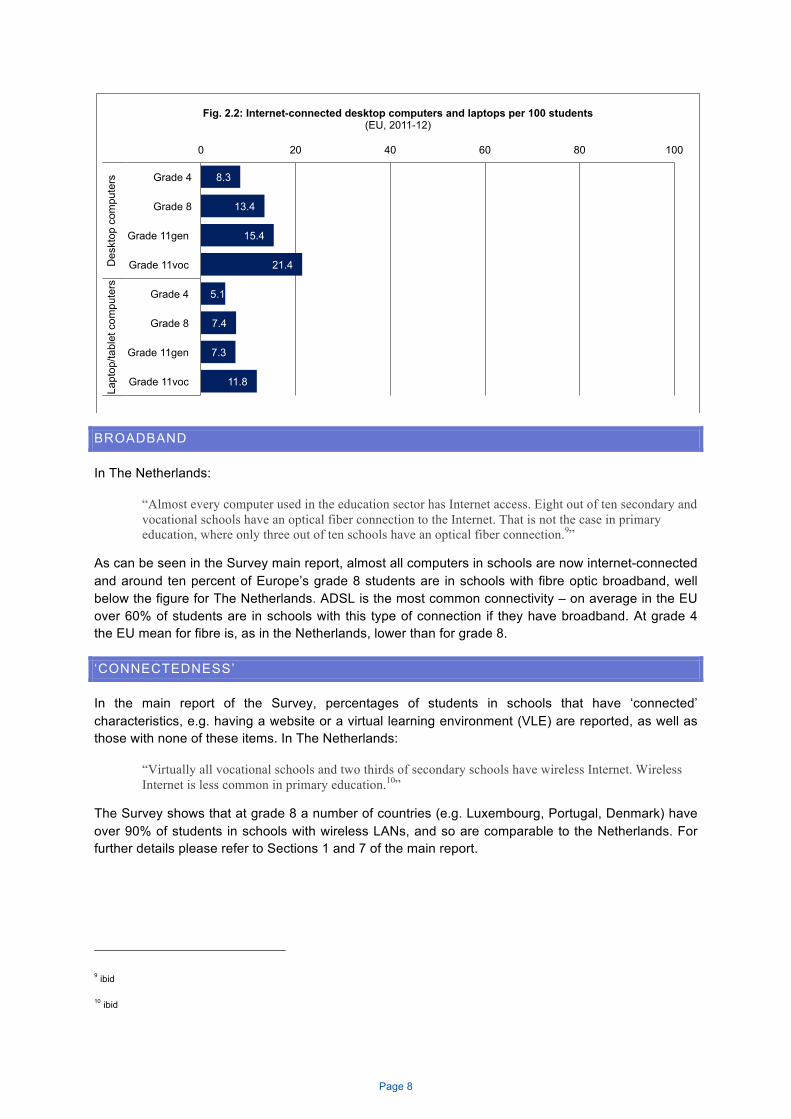
As can be seen in the Survey main report, almost all computers in schools are now internet-connected and around ten percent of Europe’s grade 8 students are in schools with fibre optic broadband, well below the figure for The Netherlands. ADSL is the most common connectivity – on average in the EU over 60% of students are in schools with this type of connection if they have broadband. At grade 4 the EU mean for fibre is, as in the Netherlands, lower than for grade 8.
‘CONNECTEDNESS’
In the main report of the Survey, percentages of students in schools that have ‘connected’ characteristics, e.g. having a website or a virtual learning environment (VLE) are reported, as well as those with none of these items. In The Netherlands:
“Virtually all vocational schools and two thirds of secondary schools have wireless Internet. Wireless Internet is less common in primary education.10”
The Survey shows that at grade 8 a number of countries (e.g. Luxembourg, Portugal, Denmark) have over 90% of students in schools with wireless LANs, and so are comparable to the Netherlands. For further details please refer to Sections 1 and 7 of the main report.
9 ibid
10 ibid
8.3
13.4
15.4
21.4
5.1
7.4
7.3
11.8
0 20 40 60 80 100
Grade 4
Grade 8
Grade 11gen
Grade 11voc
Grade 4
Grade 8
Grade 11gen
Grade 11voc
Des
ktop
com
pute
rs
Lapt
op/ta
blet
com
pute
rs
Fig. 2.2: Internet-connected desktop computers and laptops per 100 students (EU, 2011-12)

Page 9
3. FREQUENCY OF ICT USE IN CLASS
FREQUENCY OF ICT USE BY TEACHERS IN CLASS
In The Netherlands:
“Three quarters of teachers use computers during lessons. More primary school teachers use computers (91%) than teachers at secondary schools (59%) or vocational schools (72%). The number of teachers using computers in their lessons has increased by 2 to 3% in the past eight years. This is a much slower rate of growth (50%) than school managers had forecast. School managers estimate that the rate of growth will rise to more than 4% in the years ahead (Figure 3.2), but even then, it will take at least five years before all teachers are making use of computers in their lessons. Teachers use computers in their lessons for an average of 8 hours a week. This figure is the same as last year’s. Secondary school teachers make the least use of computers, relatively speaking (6 hours a week). Primary school teachers use computers for an average of 8 hours a week in their lessons. The ICT applications used most often in teaching are the Internet, practice programs, word processing software and electronic learning environments. On average, teachers use such applications eight times a month. They make the least use of gaming and Web 2.0. Virtually all teachers use their home computers for school-related work, mainly for administrative tasks and to search for, adapt, or develop lesson materials. They also often use their home computer to keep in touch with colleagues or pupils.11”
It is difficult to make comparisons with data obtained in the survey as the measures are not the same, but on average in the EU over 80% of students are in schools where teachers report using ICT (see main report fig. 2.1). As in The Netherlands there is more use in primary than secondary schools and increases in use since 2006 are marginal.
11 ibid
29%
32%
32%
50%
0% 20% 40% 60% 80% 100%
Grade 4
Grade 8
Grade 11gen
Grade 11voc
Fig. 3.1: Teachers' use of ICT in more than 25% of lessons (% schools, EU, 2011-12)
Page 10
For further details please refer to Sections 2 and 3 of the survey report.
STUDENTS’ ICT USE
Students at grade 8 and 11 were also asked how frequently they used various items of ICT equipment in their lessons for learning purposes.
In The Netherlands:
“The vast majority of secondary school pupils (80%) say that when they use the Internet at home to do schoolwork, they use it mainly in the same way as they do at school, i.e. to search for information. More than half of pupils (59%) also say that ICT makes it possible for them to collaborate with other pupils on school assignments from home. The biggest change in recent years is that pupils have begun submitting their homework assignments by e-mail. The number of pupils who do this has risen from 24% to 34%. Pupils are also increasingly using the Internet to find out what homework has been assigned (via the school’s ELE) ICT adds to the time pupils spend learning because they are given more opportunity to learn outside of school hours. This indicates that teachers use ICT to bridge the gap between formal learning (at school) and informal learning (outside school). Until recently, computers were considered tools that schools purchased for use during lessons. Today, however, laptops no longer belong to the school but are the pupil’s personal property, to be used both at home and in the classroom. Some schools assist pupils in purchasing a laptop. Pupils at 23% of primary and more than half of secondary schools take their own laptops with them to school. Usually only a few pupils do this. At vocational schools, however, it is customary for pupils to take their own laptops with them to classes. At 86% of secondary schools, pupils rarely take their laptops with them to classes. Primary school pupils are even less likely to require a laptop, and only one out of seven teachers feels that every pupil should have a laptop. 12”
In Europe generally student use of their own equipment is also rising – as reported in sections 2 and 3 of the survey report.
12 ibid

Page 11
4. DIGITAL CONFIDENCE
TEACHERS
Teachers were asked to rate their level of confidence in their ability to perform twenty ICT related tasks according to a Likert scale ranging from ‘none’ to ‘a lot’. By subjecting the data to factorial analysis two scales emerged from the twenty items. These included what we categorized as operational skills and social media skills. For a detailed definition of these skills, please refer to section 4 of the survey report.
In The Netherlands:
“The percentage of teachers who believe that they are sufficiently or more than sufficiently familiar with the various options that ICT can offer them has increased in the past few years to 66%. This seems like an impressive number, but it also means that a third of teachers feel inadequately informed. The percentage of teachers who possess sufficient ICT skills to use word processing software and the Internet has increased slightly in recent years and now stands at 80%. The percentage of teachers with adequate pedagogical ICT skills is smaller. School managers say that almost six out of ten teachers have mastered these skills.
Teachers themselves believe that their pedagogical ICT skills are gradually improving. An average of 57% have mastered a set of nine skills. Since 2009, that figure has increased every year by an average of 6% to 7%.13”
In the survey (main report) at grade 8, students are on average taught by teachers with more confidence in their operational ICT competence than their social media competence, and the percentage of teachers confident in using ICT have increased considerably since 2006. For further details please refer to Section 4 of the survey report..
13 ibid
Page 12
5. SCHOOL POLICY, STRATEGIES AND SUPPORT MEASURES
In The Netherlands:
“School managers and teachers are largely in agreement on pedagogical vision. For example, they share the view that ICT will become more significant in the classroom in the next three years.
Some eight out of ten schools have an ICT policy plan. About half of these schools are actually implementing this plan, and a third are not.14”
A major finding of the Survey of Schools: ICT in Education is that the existence of an ICT policy is only effective if accompanied by strong support, notably the presence of an ICT coordinator with a pedagogical as well as technical role. For further details please refer to Section 5 of the survey report.
1414 ibid