Survey of Main Concerns
49
Survey of Modern Concerns Related to Chemicals and Materials. Prof. Attilio Citterio Dipartimento CMIC “Giulio Natta” https://iscamapweb.chem.polimi.it/citterio/it/education/course-topics/ School of Industrial and Information Engineering Course 096125 (095857) Introduction to Green and Sustainable Chemistry
Transcript of Survey of Main Concerns
Survey of Modern Concerns
Related to Chemicals and Materials. Prof. Attilio Citterio
Dipartimento CMIC “Giulio Natta”
https://iscamapweb.chem.polimi.it/citterio/it/education/course-topics/
School of Industrial and Information Engineering
Course 096125 (095857)
Introduction to Green and Sustainable Chemistry

Attilio Citterio
The economic activity depend on:
• Energy Sources and Raw Materials
• Transformation Efficiency/effectiveness
• Waste elimination/reuse
• Available services
• Space for economical activity and goods
trade+
ECONOMIC
ACTIVITY
GOODS
WASTE
ECOLOGIC
SERVICES
ENERGY MATTER
But also from
global factors
Economy and Environment: Key Connections.

Attilio Citterio
Environmental Issues.
POLITICAL DEVELOPMENT
During the 1970's the environmental movement emerged, led by
Greenpeace and Friends of the Earth and other organizations
At early 1980's, the environment moved towards the political
mainstream
• “Green parties”
• Environmental protection and management became major issue
Nowadays, environmental policies
• Are like all other policies
• Are created through the political process in one form or another
• Had been mapped
• The theoretical basis for many of the possible strategies defined
• Agreement for some limitations (i.e. 1.5 degree in temperature
increase) was established in 2015.

Attilio Citterio
Some Facts About The State of the World (2003)*.
Energy/Atmosphere
• Fossil fuel use grows 1.5%– Oil - .5%. Coal – 1.9%, Gas, Natural gas 2%
• Nuclear power capacity grows 1.5%
• Wind energy capacity grows 27%
• Atmospheric CO2 level up 18% since 1960– Most likely highest level in 20M yrs.
• Severe weather events on the rise– 31% since 1750
– Weather disaster economic losses grow 93% over 2001 to $53B
– Cyclone intensity increases 10-20% with increasing temperature
Economic
• Humanity withdrawing earth resources 20% faster then renewal rate (45% in the US)
Nature
• 12% of 9800 bird species threatened with extinction in this century
– Causes are habitat loss, exotic species, poorly regulated hunting, long line fishing
– Birds disperse seeds, pollinate flowers, control insect & rodent populations
Transportation/Communication
• Vehicle production grows 2%
• Number of mobile & cell phone subscribers increases 21% to 1.15B
• Ratio of internet users between industrial & developing countries is 17:1 (40:1 in 1995)
Health & Social
• World births exceeded deaths by 74M leading to population of 6.23B
• Population of the 49 poorest countries grows 2.4%, 10 times the rate of industrial countries
• Number of people with HIV/AIDS rose to 42M– 5M became infected and 3.1M died
– 70% in sub-Saharan Africa
• Cigarette production down .5% to 5.6T– 82% of 1.1B smokers in low/middle income countries;
expected hi growth due to marketing focus
– Smoking killed 4.9M (more than HIV/AIDS)
• Consumption patterns contribute to mortality,– Heart condition and stroke kill 16.7M
– Infectious & parasitic disease kill 14.4M
– Cancer kills 6.9M
Military
• Resource wars plague developing nations (funds from resource extraction fund armed conflict)
*Data from State of the World 2003 published by the Worldwatch Institute, Washington, D.C.

Attilio Citterio
Some Facts About The State of the World (2013)*.
*Data from State of the World 2013 published by the Worldwatch Institute, Washington, D.C.
Energy/Atmosphere
• Fossil fuel use grows 1.9%– Oil - .1.2%. Coal – 2.2%, Gas, Natural gas 1.2%,
Electricity 2.2%
• Nuclear power capacity stop in 2010
• Wind energy capacity grows 27%
• Atmospheric CO2 level rise up to a 400 ppm since 1960
– Most likely highest level in 20M yrs.
• Severe weather events on the rise– 15% since 1750
– Weather disaster economic losses grow 103% over 2001
– Cyclone intensity increases 10-20% with increasing temperature
Economic
• Humanity withdrawing earth resources 20% faster then renewal rate (35% in the US)
Nature
• 12% of 9800 bird species threatened with extinction in this century
– Causes are habitat loss, exotic species, poorly regulated hunting, long line fishing
– Birds disperse seeds, pollinate flowers, control insect & rodent populations
Transportation/Communication
• Vehicle production grows 0.3%
• Number of mobile & cell phone subscribers increases 50% to 200 B.
• Ratio of internet users between industrial & developing countries is 2,5:1 (40:1 in 2003)
Health & Socialt
• Increase of population (7.1B): • More developed country 1.2 %
• Less developed country: 5.9 %
• Africa’s population is estimated o increase to 2.4 billion, from 1.1 billion in 2013.
• The average life expectancy at birth for women in Japan is 86, one of the highest in the world
• In 1950, 117 million people lived in the top 30 metros but that number rose to 426 million by 2013.
– Heart condition and stroke kill 16.7M
Military
• Resource wars plague developing nations (funds from resource extraction fund armed conflict)

Attilio Citterio
Global Threats to Ecosystem Viability.
• loss of crop & grazing land
• depletion of world’s tropical
forests
• extinction of species
• rapid population growth
• shortage of fresh water
resources
• over-fishing, habitat destruction
pollution in the fresh water and
marine environment
threats to human health
climate change, GW
acid rain
ozone layer depletion
pressures on energy resources
solid waste pollution
………..Bird population decline

Attilio Citterio
State of the World Environment Warrants Attention.
1. Population (x billion people) 2.5 3.8 5.8 10.7
2. Megacities (>8 million) 2 9 25 200
3. Food (calories/capita) 1980 2450 2770 2200
4. Fisheries (Million ton·yr-1) 19 58 91 35
5. Water use (km3·yr-1) 1300 2600 4200 7500
6. Rainforest (1950=100) 100 85 70 45
7. CO2 Emissions (billion ton·yr-1) 1.6 4.9 7.0 14.0
8. Ozone Layer (CFC in ppb) – 1.4 3.0 7.0
Source: World Resource Institute, 1996
1950 1972 1997 2050

Attilio Citterio
Unsustainable Place.

Attilio Citterio
Major Trends Affecting the Bio-economy.
1. Changing trade patterns:
2. Climate change:
3. World population trends:
4. Environmental considerations:
5. Shifts in energy supply:
- globalisation
- Common Agricultural Policy (CAP) reform
- consumer-led production
- spread of plant diseases (e.g. fungi affecting banana, olive and rubber farms)
- new varieties/crops
- water and temperature issues
- soil degradation
- 6.5 bn in 2005 - 8.3 bn in 2030
- increasing calorie consumption per capital
- rising meat demand – up 70% by 2030
- land use and reduction of inputs
- habitat protection
- maintaining biodiversity
- higher costs of fossil fuels/scarcity
- security of supply
- reduction of GHG emissions

Attilio Citterio
Concerns Related to Human Activity.
• Global issues
Greenhouse gas emission and global warming
Ozone depletion in the stratosphere
Global population growth
Resource depletion
• Environmental issues
Air and water pollution
Acid and base deposition
VOC and photochemical smog
• Health and Safety issues
Particulate matter
Freshwater contamination by hazardous wastes
At work accidents and disasters

Attilio Citterio
The 21 Emerging issues. (UNEP 2012)
Issue ID Issue Title Ranking
Cross-cutting issues
001 Aligning Governance to the Challenges of Global Sustainability 1
002 Transforming Human Capabilities for the 21st Century: Meeting Global Environmental
Challenges and Moving Towards a Green Economy
2
003 Broken Bridges: Reconnecting Science and Policy 4
004 Social Tipping Points? Catalyzing Rapid and Transformative Changes in Human Behavior
towards the Environment
5
005 New Concepts for Coping with Creeping Changes and Imminent Thresholds 18
006 Coping with Migration Caused by New Aspects of Environmental Change 20
Food, biodiversity and land issues
007 New Challenges for Ensuring Food Safety and Food Security for 9 Billion People 3
008 Beyond Conservation: Integrating Biodiversity Across Environmental and Economic Agendas 7
009 Boosting Urban Sustainability and Resilience 11
010 The New Rush for Land: Responding to New National and International Pressures 12
Freshwater and marine issues
011 New Insights on Water-Land Interactions: Shift in the Management Paradigm? 6
012 Shortcutting the Degradation of Inland Waters in Developing Countries 15
013 Potential Collapse of Oceanic Systems Requires Integrated Ocean Governance 13
014 Coastal Ecosystems: Addressing Increasing Pressures with Adaptive Governance 19

Attilio Citterio
The 21 Emerging issues (UNEP 2012) - cont.
Issue ID Issue Title Ranking
Climate change issues
015 New Challenges for Climate Change Mitigation and Adaptation: Managing the Unintended
Consequences
7
016 Acting on the Signal of Climate Change in the Changing Frequency of Extreme Events 16
017 Managing the Impacts of Glacier Retreat 21
Energy, technology, and waste issues
018 Accelerating the Implementation of Environmentally-Friendly Renewable Energy Systems 7
019 Greater Risk than Necessary? The Need for a New Approach for Minimizing Risks of Novel
Technologies and Chemicals
10
020 Changing the Face of Waste: Solving the Impending Scarcity of Strategic Minerals and
Avoiding Electronic Waste
14
021 The Environmental Consequences of Decommissioning Nuclear Reactors 17
* Ranking based on scoring by the UNEP Foresight Panel and after considering the polling results of more than 400
scientists worldwide.
Attilio Citterio
Population Boom.
260 240 280 427730
1670
2600
5250
6000
0
1000
2000
3000
4000
5000
6000
7000
0 500 1000 1500 2000
Millio
ns
Year
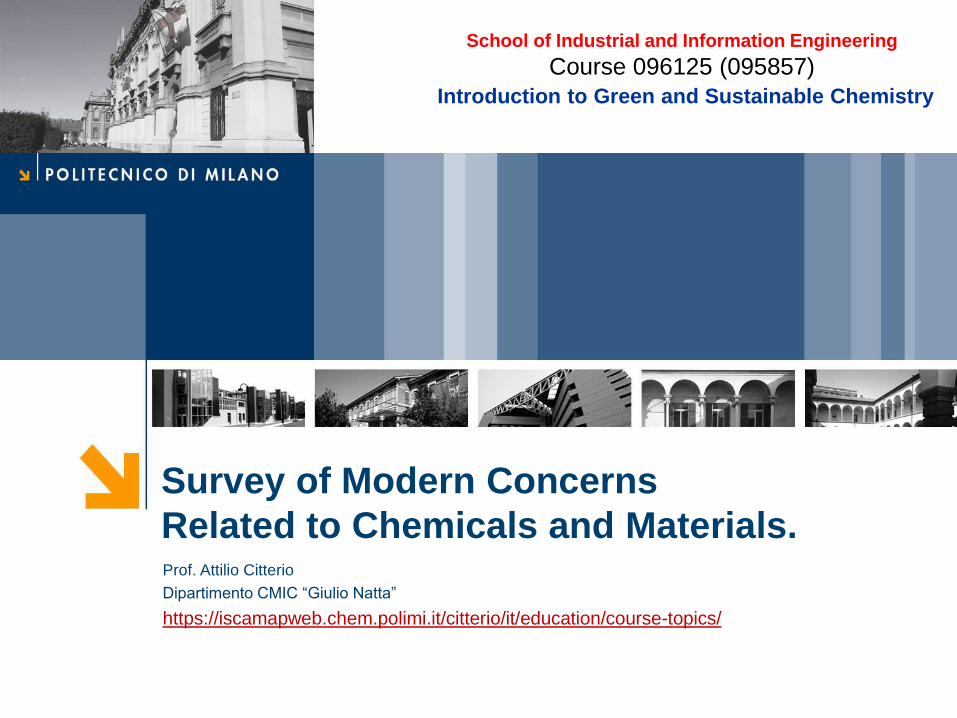
The world will need to support 5 billion
more people.
World population passed 6 billion in 2000,
up from 2.5 in 1850 and 4.4 in 1950 and it
is projected to grow to about 8 billion in
2025 and 11 billion in 2050.
Attilio Citterio
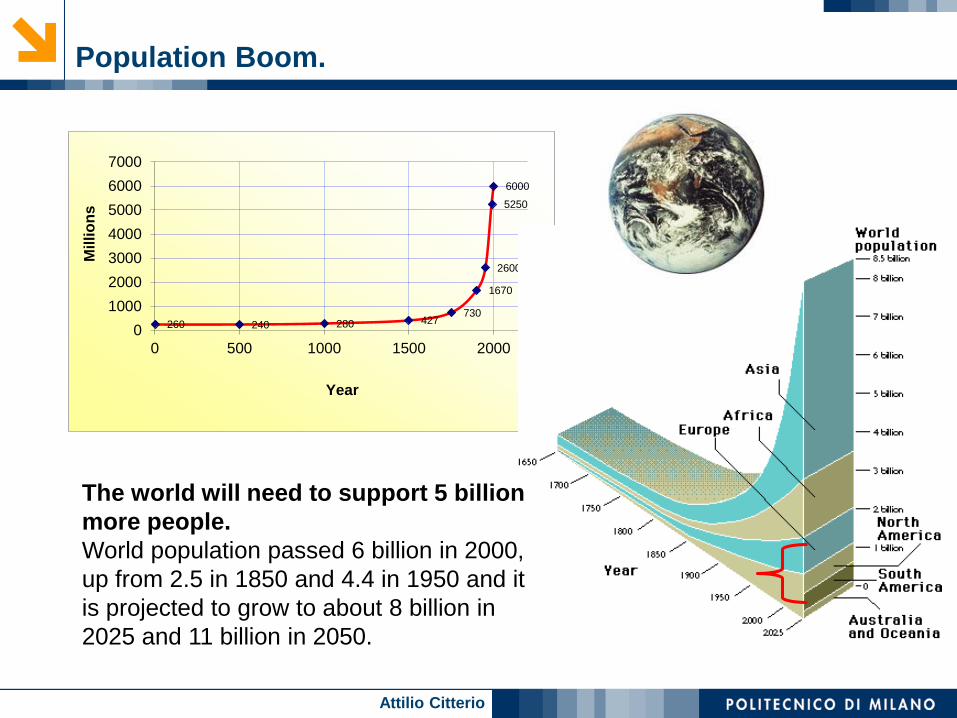
Materials and Energy Use under Socio-
Ecological Regimes in World History.
per capita annual use
Energy Material
Basic human metabolism (biomass intake by nutrition)
3,5 GJ 1 t
Hunter-gatherers(uncontrolled solar energy use)
10-20 GJ 2-3 t
Agrarian societies (controlled solar energy use)
60-80 GJ 4-5 t
Industrial/Technological
societies(fossil energy use)
250 GJ 20-22 t

Attilio Citterio
Deforestation.
Agricultural expansion is the main cause of deforestation.Permanent cultivation and shifting agricultural and pastures are the main contributes
to deforestation. In tropical areas, the major change has been a decline in closed
forest, in case with urban expansion. In developing regions, continuing population
growth and increased demand for food, combined with declining in agricultural
productivity, increase pressure for deforestation.
The capacity of forest to provide goods and services is decreasing (U.N. - The
Millennium Development Goals Report 2011)
-100
-80
-60
-40
-20
0
20
40
60
80
100
Closed forest Open forest
Fallow and Shrubs
Agriculture and other
Forest plantations
Change in Tropical Forest(million hectares)
Incre
ase
Decre
ase -4,1
-0,6
0,9
-0,3 -0,04
-4,2
-3,4
2,2
0,7 0 0,7
-4
-5
-4
-3
-2
-1
0
1
2
3
Net gain
1990-2000 2000-2010 1990-2000 2000-2010
Net loss
AFRICA ASIA EUROPE N/ S AMERICA OCEANA S America

Attilio Citterio
Species Extinctions Since 1800.
http://www.whole-systems.org/extinctions.html
0
10000
20000
30000
40000
50000
60000
1800 1830 1860 1890 1920 1950 1980 2010 2040
Exti
ncti
on
s
Year

Attilio Citterio
The Element Shortage – Some Element are
Rare on the Earth.
U.S. Geological Survey Fact Sheet 087-02
Attilio Citterio
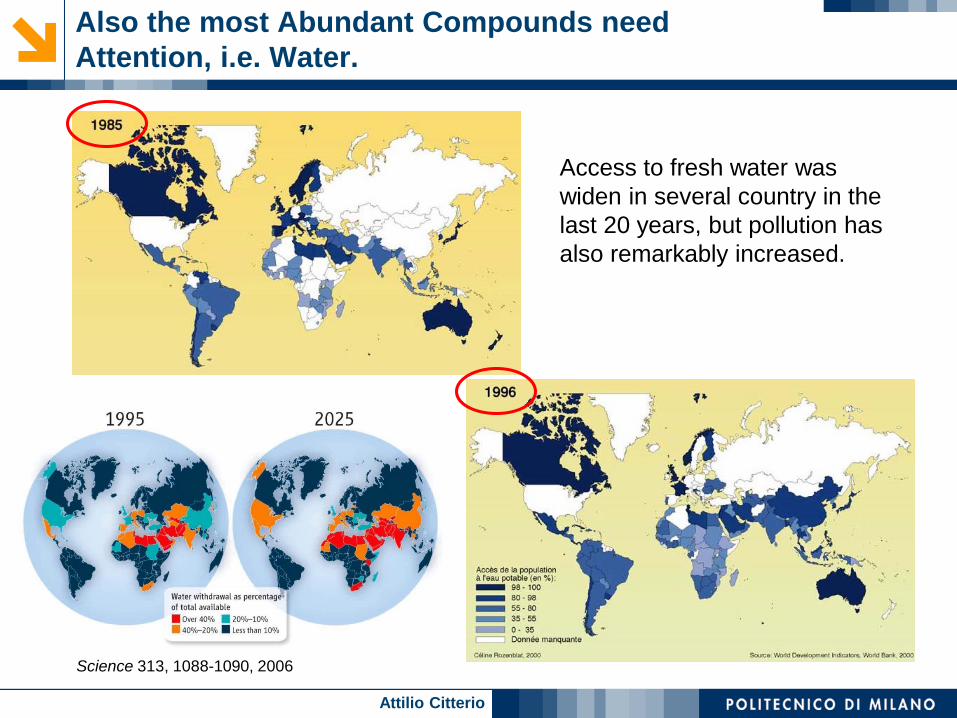
Also the most Abundant Compounds need
Attention, i.e. Water.
Access to fresh water was
widen in several country in the
last 20 years, but pollution has
also remarkably increased.
Science 313, 1088-1090, 2006
Attilio Citterio
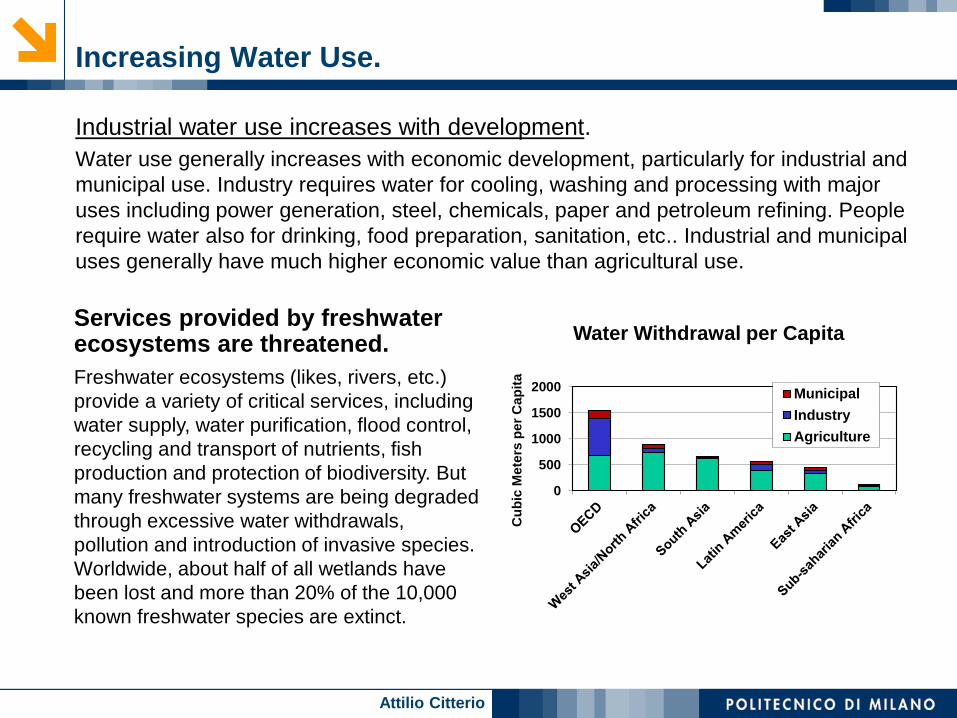
Increasing Water Use.
Industrial water use increases with development.
Water use generally increases with economic development, particularly for industrial and
municipal use. Industry requires water for cooling, washing and processing with major
uses including power generation, steel, chemicals, paper and petroleum refining. People
require water also for drinking, food preparation, sanitation, etc.. Industrial and municipal
uses generally have much higher economic value than agricultural use.
Services provided by freshwater ecosystems are threatened.
Freshwater ecosystems (likes, rivers, etc.)
provide a variety of critical services, including
water supply, water purification, flood control,
recycling and transport of nutrients, fish
production and protection of biodiversity. But
many freshwater systems are being degraded
through excessive water withdrawals,
pollution and introduction of invasive species.
Worldwide, about half of all wetlands have
been lost and more than 20% of the 10,000
known freshwater species are extinct.
0
500
1000
1500
2000
Cu
bic
Me
ters
pe
r C
ap
ita
Water Withdrawal per Capita
Municipal
Industry
Agriculture
Attilio Citterio
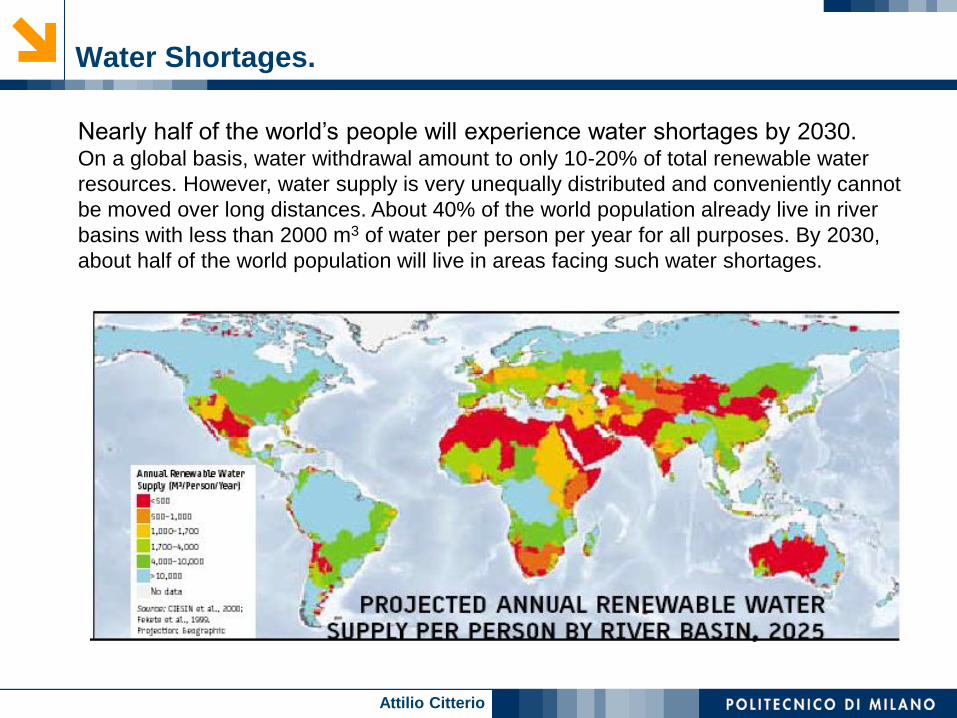
Water Shortages.
Nearly half of the world’s people will experience water shortages by 2030.On a global basis, water withdrawal amount to only 10-20% of total renewable water
resources. However, water supply is very unequally distributed and conveniently cannot
be moved over long distances. About 40% of the world population already live in river
basins with less than 2000 m3 of water per person per year for all purposes. By 2030,
about half of the world population will live in areas facing such water shortages.

Attilio Citterio
The Impact of Buildings.
In developed country houses need:
65.2% of total electricity consumption
> 36% of total primary energy use
30% of total greenhouse gas emissions
136 million tons of construction and demolition waste
(approx. 1.26 kg·person-1·day-1)
12% of potable water
40% (3 billion tons·yr-1) of raw materials use globally

Attilio Citterio
Indoor Air Pollution.
• Bacteria
• Molds and mildews
• Viruses
• Animal dander and cat saliva
• Plants
• House dust
• Mites
• Cockroaches
• Pollen
More than 3 million deaths each year are
caused by air pollution, mostly due to
particulate pollution. Acute respiratory
infections due to indoor pollution are mainly
responsible for these deaths.

Attilio Citterio
Increasing Energy Consumption.
Natural Capital
by A. Lovins 2000“It is cheaper to save fuel than to
buy it, no matter what kind it is”
Global population and
consumption of
energy has increased
steadily in the last 100
years. This has
occurred mainly from
nonrenewable fossil
sources!
Attilio Citterio
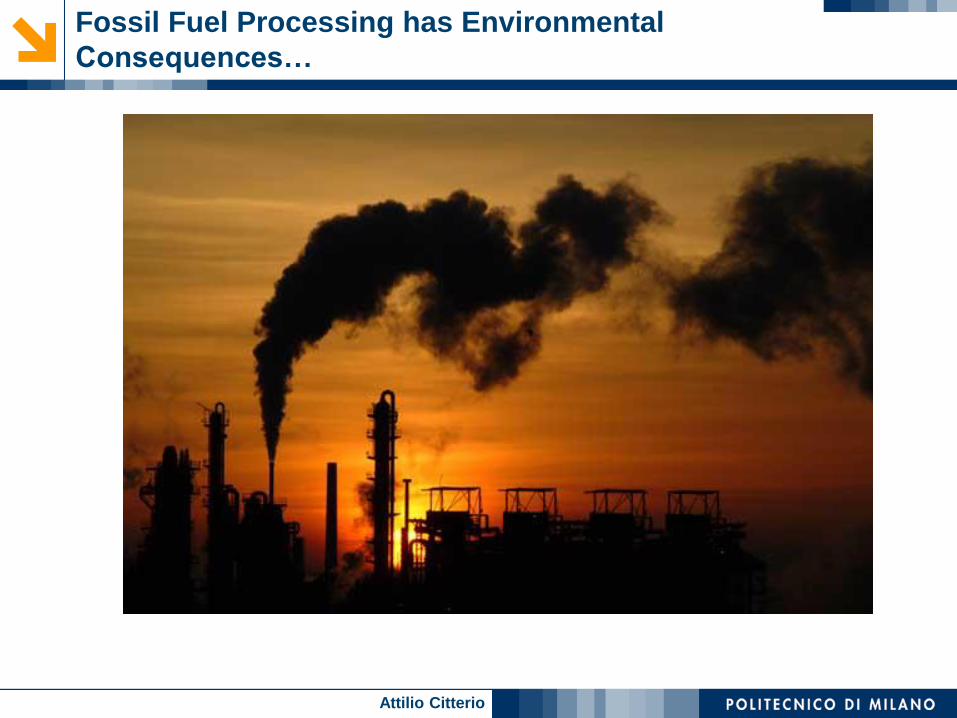
Fossil Fuel Processing has Environmental
Consequences…

Attilio Citterio
Effects of Fossil Fuel Combustion.
• Fossil fuels are hydrocarbons containing traces of nitrogen, sulfur and
other elements.
• Typical combustion reaction:
CwHxOzNaSb + O2 + cN2 w(CO2+CO) + x/2 H2O + (a+c/2)NOx + bSO2 + …
• Only H2O is essentially benign ...
• CO and many HC's are toxic to humans.
• NOx and SO2 combine with rainwater to form nitric and sulfuric acids,
i.e., "acid rain".
• CO2 is the primary culprit in global warming, but other GHG gases are
also important.
• Stratospheric Ozone Depletion (if halogen are present).
• Transition metal pollution from ashes.

Attilio Citterio
270
280
290
300
310
320
330
340
350
360
370
1750 1800 1850 1900 1950 2000
part
i per
mili
one in v
olu
me
Mauna Loa (1958-2000)
Stazione Siple (1750-)
Source: C.D. Keeling and T.P. Whorf, Atmospheric CO2 Concentrations (ppmv) derived from in situ air samples
collected at Mauna Loa Observatory, Hawaii, Scripps Institute of Oceanography, 1998. A. Neftel et al,
Historical CO2 Record from the Siple Station Ice Core, Physics Institute, University of Bern, Switzerland, 1994.
Atmospheric carbon dioxide concentrations (from 1750 to 2000 ac).
N.B. In 2013 the CO2 level growths to 400 ppm!!!
Increase of Global CO2 Emissions.

Attilio Citterio
The Effect of Industrial Revolution on
Atmospheric CO2 Concentration.
Figure. Carbon dioxide
(CO2) concentrations (in
parts per million) for the
last 1100 years,
measured from air
trapped in ice cores (up
to 1977) and directly in
Hawaii (from 1958
onwards).
Something new may have happened between 1800 AD and 2000 AD. The year 1769 is marked
because in that year James Watt patented his steam engine. (The first practical steam engine was
invented 70 years earlier in 1698, but Watt’s was much more efficient)
Source: D.J.C. Mackay
sewtha.pdf :
Sustainable Energy —
without the hot air
Version 3.5.2. Nov. 3, 2008.

Attilio Citterio
Note: Human perturbation, occurred in the last 200 years, is now close to CO2 changes of glacial-interglacial cycles,
occurred in ten of Townshend years. In the insert the time trend of CO2 vs. time in the last 400,000 years is reported as
estimated from glass carrots (Petit et al.1999, Indermuehle et al., 1999) and direct atmospheric observations (Keeling e
al., 1995, Tans e al., 1999).
105
104
103
102
101
100
10-1
10-2
109 108 107 106 105 104 103 102 101 100 10-1 10-2 10-3
time [years]
Day Cycle
Year Cycle
Glacial-interglacial
human Perturbation
Hig
h [
pp
m]
-450 -400 -350 -300 -250 -200 -150 -100 -50 0 50150
150
150
150
150
150
atm
ospheric C
O2
[ppm
v]
Human Perturbation
Time Dependence of Atmospheric CO2
Fluctuation Width.

Attilio Citterio
Greenhouse Gas Emissions for Earth
Regions vs. Population.
Each rectangle’s area represents the greenhouse gas emissions of one region. The width of the rectangle is the
population of the region, and the height is the average per-capita emissions in that region.
Source: D.J.C. Mackay sewtha.pdf :
Sustainable Energy — without the hot air
Version 3.5.2. November 3, 2008.
Attilio Citterio
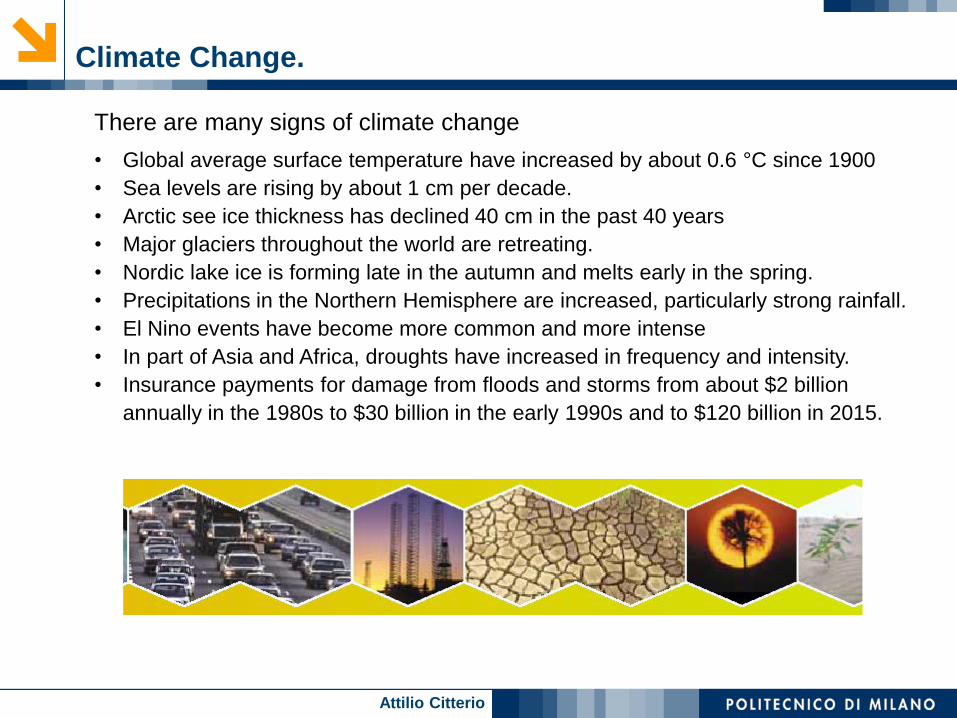
Climate Change.
There are many signs of climate change
• Global average surface temperature have increased by about 0.6 °C since 1900
• Sea levels are rising by about 1 cm per decade.
• Arctic see ice thickness has declined 40 cm in the past 40 years
• Major glaciers throughout the world are retreating.
• Nordic lake ice is forming late in the autumn and melts early in the spring.
• Precipitations in the Northern Hemisphere are increased, particularly strong rainfall.
• El Nino events have become more common and more intense
• In part of Asia and Africa, droughts have increased in frequency and intensity.
• Insurance payments for damage from floods and storms from about $2 billion
annually in the 1980s to $30 billion in the early 1990s and to $120 billion in 2015.

Attilio Citterio
A Greenhouse...
• Sunlight at = 0.5 m mostly
passes through the glass
• Re-emitted radiant energy from the
~300 K interior is at 10 m
• The glass is opaque to this infrared
wavelength, so re-emitted energy
cannot radiate away
• The greenhouse warms up
glass
“earth”
sun=0.5 m
e=10 mTe = 300 K
The Greenhouse Effect
Tsun = 5760 K
Borosilicate glass, 0.478 cm thick
Fused silica glass, 1.27 cm thick
Visibleregion
0.1 0.2 0.4 1 2 30
0.2
0.4
0.6
0.8
1.0
Wavelength , m
Ove
rall
sp
ectr
al
tra
nsm
itta
nce T
Glass absorption

Attilio Citterio
Leading Facts about CO2 Science.
• The earth absorbs anthropogenic CO2 at a limited rate
Emissions would have to drop to about half of their current value
to stabilize atmospheric concentration at 550 ppm
This in the face of a doubling of energy demand in the next 50
years (1.5% per year emissions growth)
• The lifetime of CO2 in the atmosphere is 200-300 years
The atmosphere will accumulate emissions during the 21st Century
Near-term emissions growth can be offset by greater long-term
reductions
Limited emissions reductions only delay the concentration growth
(20% emissions reduction buys 15 years)
Attilio Citterio
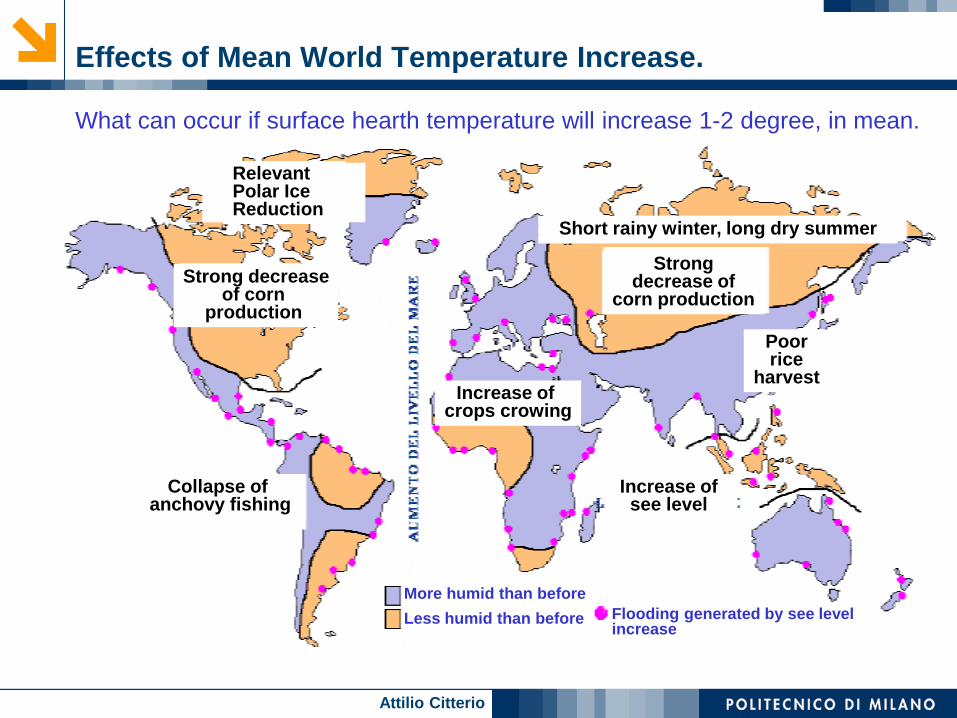
Effects of Mean World Temperature Increase.
What can occur if surface hearth temperature will increase 1-2 degree, in mean.
Relevant Polar Ice Reduction
Strong decreaseof corn
production
Collapse of anchovy fishing
Increase of crops crowing
Flooding generated by see level increase
More humid than before
Less humid than before
Increase of see level
Poorrice
harvest
Strong decrease of
corn production
Short rainy winter, long dry summer
Attilio Citterio
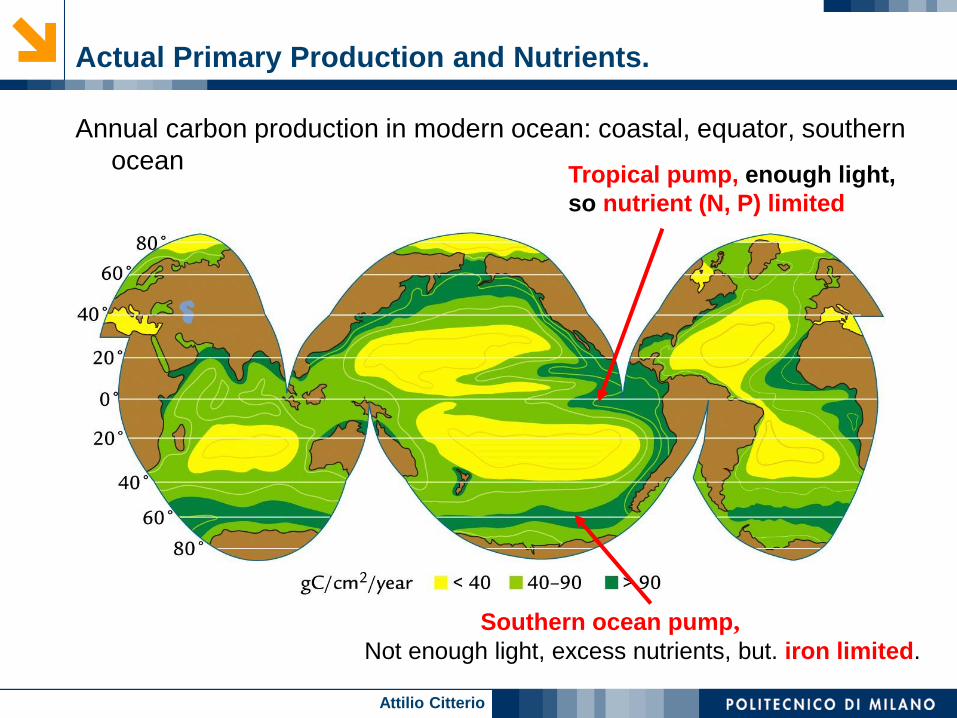
Actual Primary Production and Nutrients.
Annual carbon production in modern ocean: coastal, equator, southern
oceanTropical pump, enough light,
so nutrient (N, P) limited
Southern ocean pump, Not enough light, excess nutrients, but. iron limited.
Attilio Citterio
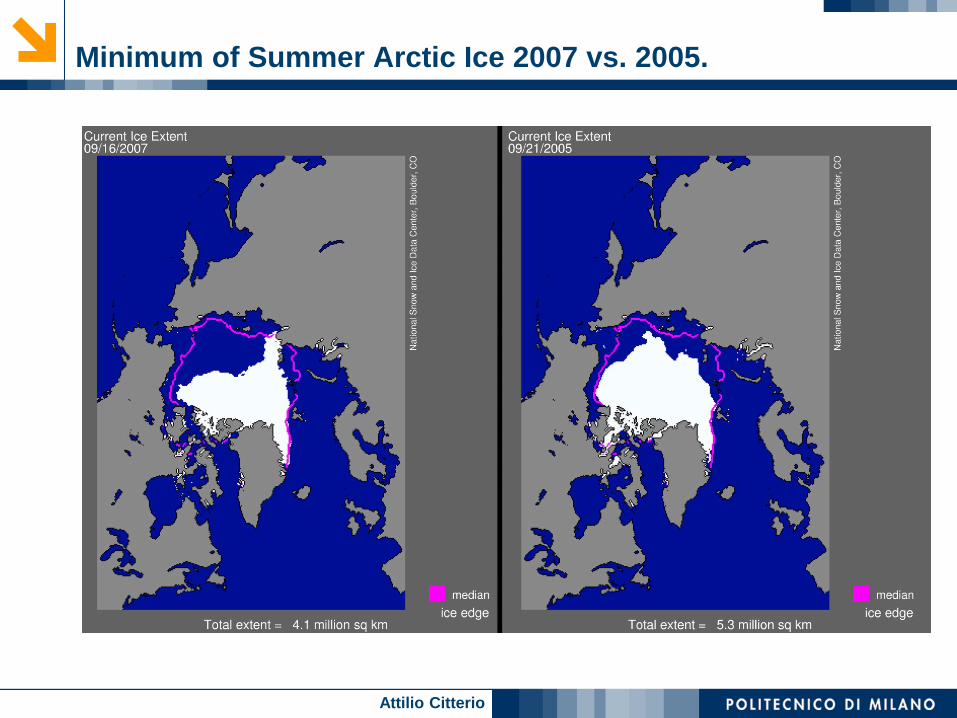
Minimum of Summer Arctic Ice 2007 vs. 2005.
Attilio Citterio
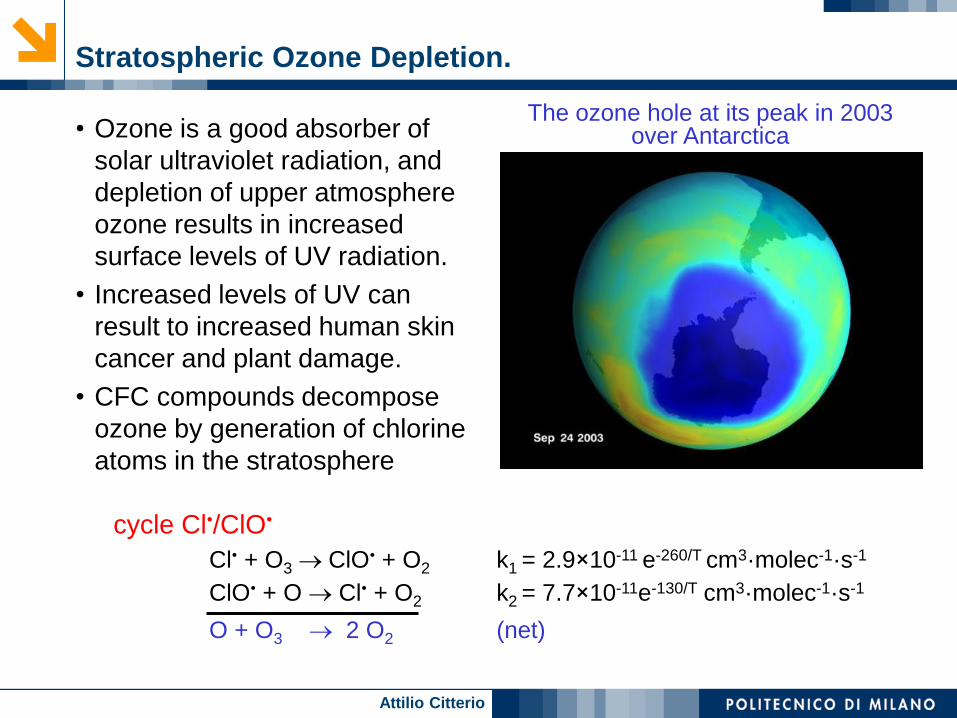
Stratospheric Ozone Depletion.
• Ozone is a good absorber of
solar ultraviolet radiation, and
depletion of upper atmosphere
ozone results in increased
surface levels of UV radiation.
• Increased levels of UV can
result to increased human skin
cancer and plant damage.
• CFC compounds decompose
ozone by generation of chlorine
atoms in the stratosphere
The ozone hole at its peak in 2003 over Antarctica
cycle Cl•/ClO•
Cl• + O3 ClO• + O2 k1 = 2.9×10⁻¹¹ e-260/T cm3·molec-1·s-1
ClO• + O Cl• + O2 k2 = 7.7×10⁻¹¹e-130/T cm3·molec-1·s-1
O + O3 2 O2 (net)

Attilio Citterio
• Refrigerators, air conditioners and heat pumps have used
chlorofluorocarbons (CFC's) as their working fluids (refrigerants).
• CFC's at normal conditions are extremely inert, stable and non-toxic.
Their use leads to good equipment efficiency and safety.
• Because they are so inert, CFC's are not destroyed in the lower
atmosphere and eventually rise to upper atmosphere (stratosphere).
• UV light in the stratosphere breaks down the CFC molecule, releasing
chlorine atoms, which attacks ozone (O3) converting to O2 and O.
• The Cl atoms are released after breaking down an O3 molecule, and
both the O and the Cl are free to attack other O3 molecules.
• Release of CFCs has already caused significant stratospheric ozone
depletion, particularly in the South and North Polar regions.
CFC from HVAC Equipment and Ozone.
CFC-12
CF2Cl2Refrigerant
CFC-11
CFCl3Blowing agent
CFC-113
CF2ClCFCl2Cleaning agent

Attilio Citterio
Outdoor Air Quality Issues: Smog Formation.
“A smog inversion layer blanketing downtown Los
Angeles in 1956.” Source: www.epa.gov
0
5
10
15
20
25
30
35
40
45
50
4 6 8 10 12 14 16 18
Co
ncen
trati
on
(p
ph
/m3)
Day hour
Hydrocarbons
Aldehydes
NO2
NOO3
NO
HC
hn hn
sun sunO3, PAN, etc.NO2

Attilio Citterio
Acid Rain: Defoliation – Corrosion.
Atmospheric intake of sulfur
produce acid oxides SO2 and
SO3 and then sulfuric acid
(H2SO4) starting a process
known as acid rain.
Emission
source
Dry deposition
of Gas,
Particles and
Aerosols
Natural
ammonia
Wet deposition
of dissolved
acids
NOX
SO2
Dry deposition
NOX SO2
NOX HNO3H+ + NO3
-
Wet deposition
NH3 + H+ NH4+
SO2 H2SO42H+ + SO4
2-
DissolutionOxidation
H2Osun
Light O3
H+ + NH4+ + NO3
- + SO42-

Attilio Citterio
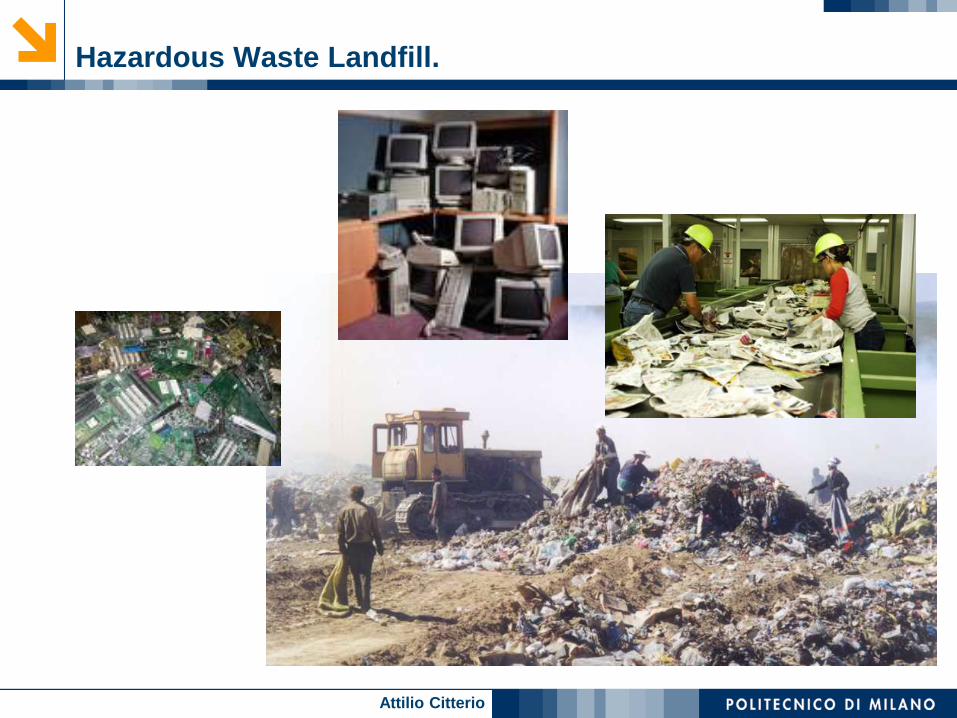
The Waste Concern.
• “End line” Technologies
• Containing systems for stocks and landfills
Costly
Constant Monitoring
Potentially fail
Attilio Citterio
Hazardous Waste Landfill.

Attilio Citterio
Relevant Industrial Accidents!
BASF,
Oppau/Ludwigshafen,
September 21, 1921
Crater: 80 m diameter,
16 m deep
450 dead
AZF, Toulouse,
September 21, 2001
Crater: 50 m diameter,
10 m deep
29 dead
NH4NO3 N2 + ½O2 + 2H2O
{300°, DG<0}
Attilio Citterio
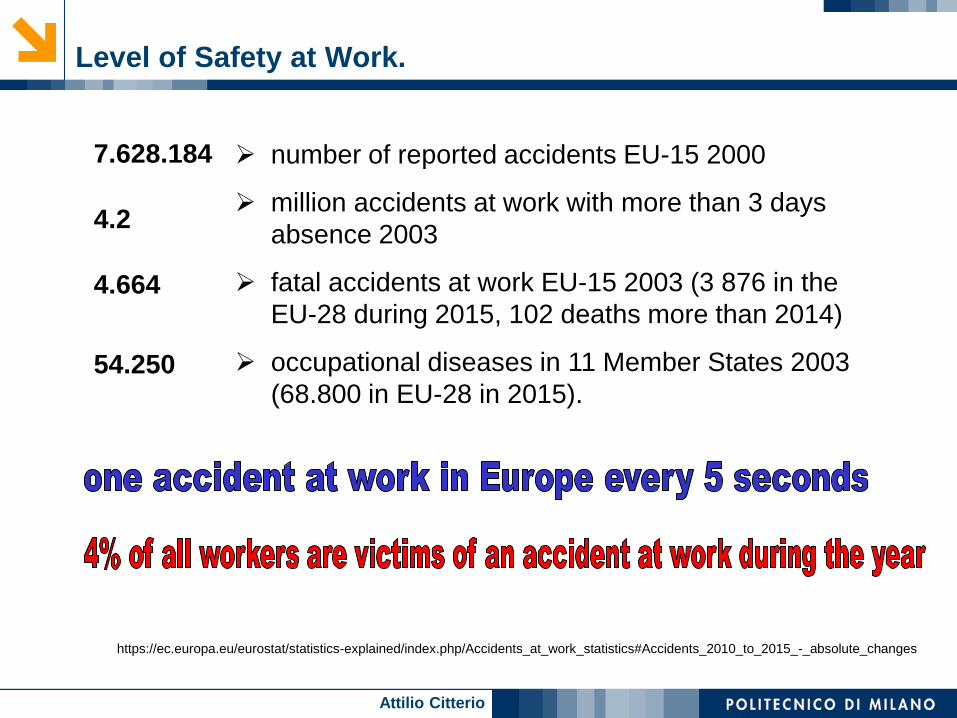
Level of Safety at Work.
7.628.184
4.2
4.664
54.250
number of reported accidents EU-15 2000
million accidents at work with more than 3 days
absence 2003
fatal accidents at work EU-15 2003 (3 876 in the
EU-28 during 2015, 102 deaths more than 2014)
occupational diseases in 11 Member States 2003
(68.800 in EU-28 in 2015).
https://ec.europa.eu/eurostat/statistics-explained/index.php/Accidents_at_work_statistics#Accidents_2010_to_2015_-_absolute_changes
Attilio Citterio
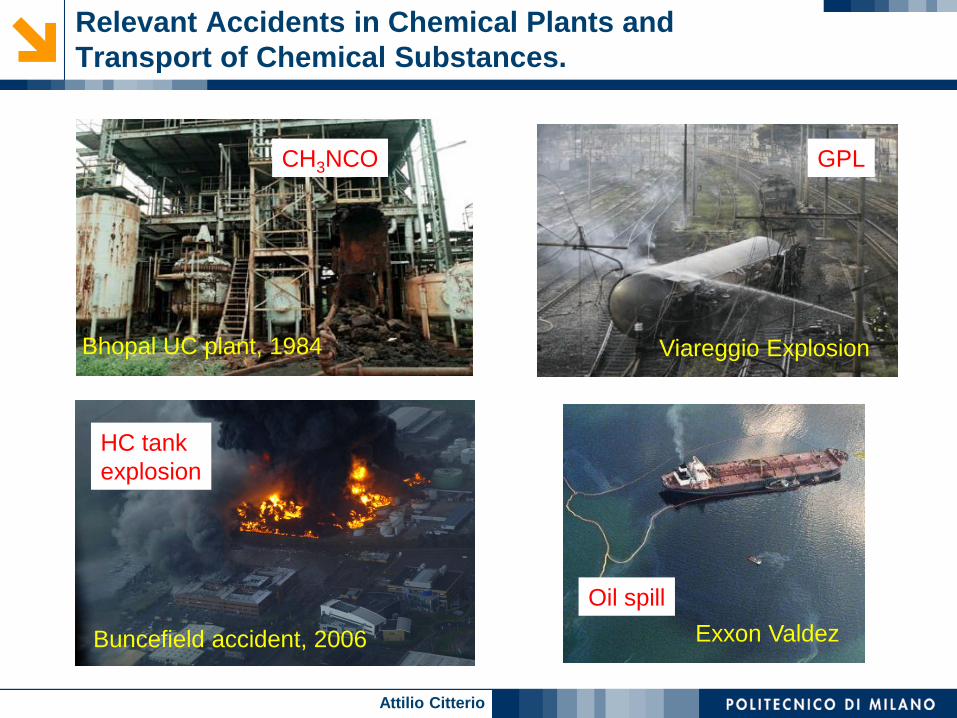
Relevant Accidents in Chemical Plants and
Transport of Chemical Substances.
Bhopal UC plant, 1984
Buncefield accident, 2006
CH3NCO
HC tank
explosion
Viareggio Explosion
GPL
Exxon Valdez
Oil spill

Attilio Citterio
What Happened at Bhopal?
Methyl isocyanate (“MIC”, CH3NCO) used to
manufacture carbaryl (Sevin®) at a Union Carbide
plant in Bhopal, India.
Water (somehow) got into a storage tank
containing 15 Tons of MIC
CH3NCO + H2O CH3OH + HNCO
(b.p. 40ºC) (b.p. 100ºC) (b.p. 65ºC) (b.p. ca. 25ºC)
DHrxn - 250 kJ·mol-1
T , rate {Arrhenius Law, k = exp(-Eact/RT)}
DP = (nR DT)/V plus vaporization:
pressure valve burst open, backup scrubber did
not work, flare tower did not work
4 Tons of MIC vaporized, wind carried vapor across the city. At least
3,800 people died, 1,000 more injured and blinded. Legal claims arose.
What could
have been
done
differently?
Attilio Citterio
Unintended Consequences on Health.
• The Surprises (see REACh – EU regulation)
Persistent Organic Pollutants (POP e.g. DDT, PCB, Polyacrylates..)
Bioaccumulation
• PCB at 1 ppb conc. in H2O, accumulate to 6,400 in plankton, 240,000 in squid,
13,000,000 in dolphin and tuna
Atmospheric Distillation (especially in northern latitudes)
Endocrine disruption
• The Messes Left Behind
Thousands of tons of abandoned pesticides
Nuclear legacy with $300 billion price tag
Industrial contaminated sites
Spread of POP in environment and humans
Attilio Citterio
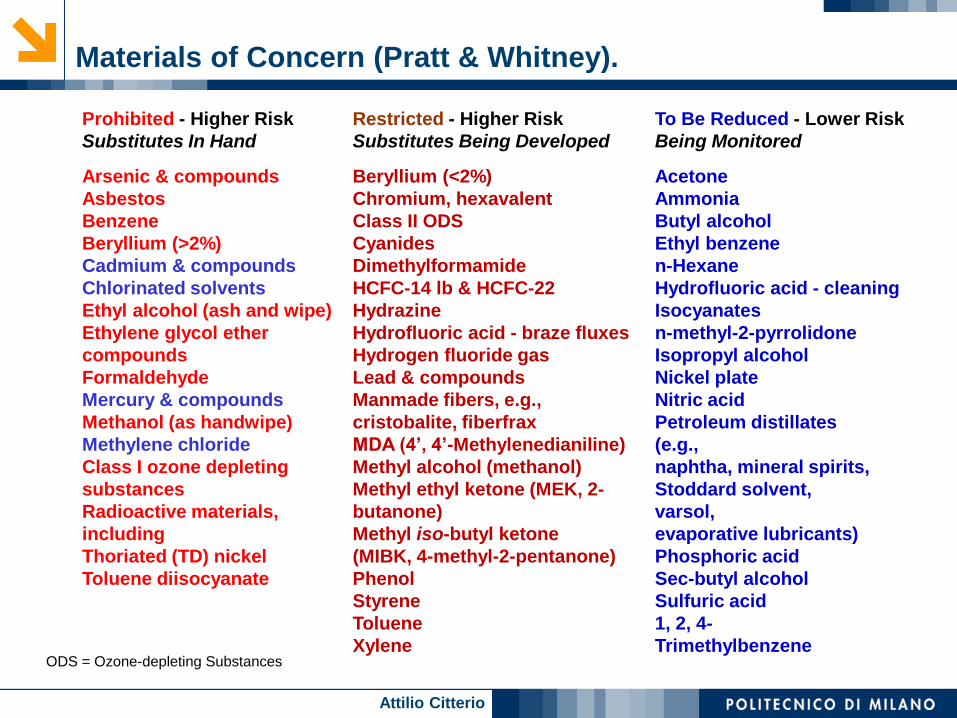
Materials of Concern (Pratt & Whitney).
Prohibited - Higher Risk
Substitutes In Hand
Arsenic & compounds
Asbestos
Benzene
Beryllium (>2%)
Cadmium & compounds
Chlorinated solvents
Ethyl alcohol (ash and wipe)
Ethylene glycol ether
compounds
Formaldehyde
Mercury & compounds
Methanol (as handwipe)
Methylene chloride
Class I ozone depleting
substances
Radioactive materials,
including
Thoriated (TD) nickel
Toluene diisocyanate
Restricted - Higher Risk
Substitutes Being Developed
Beryllium (<2%)
Chromium, hexavalent
Class II ODS
Cyanides
Dimethylformamide
HCFC-14 lb & HCFC-22
Hydrazine
Hydrofluoric acid - braze fluxes
Hydrogen fluoride gas
Lead & compounds
Manmade fibers, e.g.,
cristobalite, fiberfrax
MDA (4’, 4’-Methylenedianiline)
Methyl alcohol (methanol)
Methyl ethyl ketone (MEK, 2-
butanone)
Methyl iso-butyl ketone
(MIBK, 4-methyl-2-pentanone)
Phenol
Styrene
Toluene
Xylene
To Be Reduced - Lower Risk
Being Monitored
Acetone
Ammonia
Butyl alcohol
Ethyl benzene
n-Hexane
Hydrofluoric acid - cleaning
Isocyanates
n-methyl-2-pyrrolidone
Isopropyl alcohol
Nickel plate
Nitric acid
Petroleum distillates
(e.g.,
naphtha, mineral spirits,
Stoddard solvent,
varsol,
evaporative lubricants)
Phosphoric acid
Sec-butyl alcohol
Sulfuric acid
1, 2, 4-
TrimethylbenzeneODS = Ozone-depleting Substances
Attilio Citterio
Banned Chemicals.
• Atrazine: banned in EU in 2003 because of unavoidable water
contamination
• Tributyltin (TBT): Most antifoulant uses phased out by 2003,
remaining uses by 2008
• Alkyl phenols and their ethoxylates: EU Directive prevents use as co-
formulants in new products from 2005; voluntary UK agreement to
replace AP(E)s in existing pesticide formulations
• Lead, mercury, cadmium, hexavalent chromium, polybrominated
biphenyls (PBB) or polybrominated biphenyl ethers are banned from
2006 in electronic equipment (EU RoHS directory)
• Some fluorocarbons (i.e. HCFC-141b, CFC-11) are banned from 2004
• Vinclozolin, Procymidone, Fenarimol: EU discussing phasing out all
uses .
• In Europe the REACh encourage new bans. (see
https://echa.europa.eu/regulations/reach/understanding-reach)

Attilio Citterio
Beyond the Environment: the Triple Bottom Line.
Living within
environmental
limits:
Ensure natural
resources to support
life remain unimpaired
Ensuring a
strong, healthy &
just society:
Meet diverse needs of
all; promote wellbeing
inclusion/opportunity
Achieving a
sustainable
economy:
Strong, stable,
efficient & fair