Survey of Cruise Visitors to Maine - MOT Partners
33
Prepared by: Maine Office of Tourism Survey of Cruise Visitors to Maine Behavior, Attitudes, and Spending of Passengers and Crew August 2019 Prepared by:
Transcript of Survey of Cruise Visitors to Maine - MOT Partners

Prepared by:
Maine Office of Tourism
Survey of Cruise Visitors to Maine
Behavior, Attitudes, and Spending of Passengers and Crew
August 2019
Prepared by:

Table of Contents
2
Executive Summary 3
Background and Methodology 4
Key Findings 5
Cruise Travel to Maine 6
On-shore Experiences 9
Views Toward Ports and Port Experiences 15
Cruise Visitor Spending 22
Demographics of Cruise Visitors 28
Appendix: Summary of Economic Impact Calculations 31

Executive Summary
3

Background and Methodology
4
Background
• The Maine Office of Tourism, in association with CruiseMaine, commissioned DPA to conduct a study of cruise ship visitors to Maine. The goal of the research was to help the state measure: cruise visitor characteristics, how cruise visitors spend their time on-shore, how cruise visitors feel about their on-shore visits, their likelihood to return to the state by cruise or other methods, and the economic impact generated by cruise visitor spending in the state.
• The research was conducted between July 13 and November 7, 2018 at the following ports:
• Surveying was conducted on ships of all sizes (ranging from those with fewer than 200 passengers and crew to those with more than 6,000 passengers and crew) and included a wide variety of cruise lines.
Please note that this research was intended to quantify the direct expenditures of cruise visitors to Maine and the associated economic impacts of those expenditures. It was not designed to measure the other economic impact of cruise visiting, such as docking fees, piloting fees, or food or beverages purchased by the cruise lines. More information about the scope of the study is included on page 23.
Methodology
• Professional survey interviewers were stationed where passengers and crew returned to their ship or tender. These interviewers provided a paper questionnaire to visitors as they returned to their ship from a shore visit.
• All visitors – both passengers and crew members – were invited to complete the questionnaire.
• The questionnaire was designed to take respondents no more than five minutes to complete.
• A total of 2,535 passengers and crew members took part in the survey.
• In all, surveys were conducted at 79 cruise ship port arrivals.
• Interviews were conducted by one or two interviewers in four-hour shifts, with the goal of obtaining 25 or more questionnaires per interviewer during each shift.
• The estimated berth capacity of ships and the number of surveys actually collected at each port is shown at left.
• Several cruises to Maine stop at multiple ports in the state. Every effort was made to avoid surveying visitors from a single ship more than twice.
• In order to avoid skewing passenger-specific information from visitors surveyed more than once, the questionnaire included a question about whether the respondent had taken the survey previously. All demographic information presented in this report only includes those who had not taken the survey at another port.
• The survey data are balanced to represent the total population of estimated cruise ship arrivals by month and surveyed port.
Berth Capacity* Total Surveyed
Bar Harbor 387,711 1,248Bath 2,238 93Belfast 2,320 95Boothbay Harbor 4,695 45Camden 4,945 31Castine 2,320 86Eastport 1,169 76Portland 253,190 556Rockland 7,219 305
Total 665,800 2,535
* Information provided by CruiseMaine. Refers to potential passenger and crew arrivals, assuming ships were at full capacity. Actual, measured occupancy is 94%.

Key Findings
5
Cruises Inspire Continued Visitation.
More than half of cruise passengers are first-time visitors to Maine, and
one-third of all passengers say they are likely to return to the state, either
by cruise or other means.
Cruise Visitors Are Highly Pleased With
Their Visits to the State.
Eight out of ten cruise visitors are highly satisfied with
their time on-shore in Maine.
Another eight out of ten are highly likely to
recommend a trip to Maine to others based on their
time on-shore.
At least eight out of ten cruise visitors believe the port
towns they visited offer natural and unspoiled
environments, high-quality service, and a warm
welcome.
More than 400,000 cruise visitors spent a total of $29 million in the state during the 2018 cruise season.
When coupled with indirect (induced) spending, cruise visitor spending generates at least $33 million in
overall economic impact, supports almost 400 jobs, and provides $1.7 million in tax revenue for Maine.
Cruise Visitors Spend Several Hours in Port Towns and
Take Part in a Number of Activities.
The typical cruise visitor spends four hours in the port towns they visit.
Nine out of ten go sightseeing or touring in the areas they visit, and many
go shopping or visit specific port attractions.

Cruise Travel to Maine
6

More than half of all surveyed cruise ship visitors (including passengers and crew) have not visited Maine prior to their cruise. Two out of ten passengers have taken previous cruises to Maine.
7Have you ever been to Maine prior to this cruise (regardless of how you arrived)? IF YES: Number of previous visits:__Have you taken previous cruises that have stopped in Maine? IF YES: Number of previous cruises:__Includes only those visitors who are confirmed to have taken the survey only once.
46%
18%
Have Been to Maine Before Have Taken Previous Cruise to Maine
Prior Visits to Maine
Prior Visits to Maine
Among all (n=1,327)
Among passengers (n=1,222)
Repeat visitors to Maine have been to the state 3.4 times, on average. Passengers who have taken
previous cruises to Maine have taken 2.1 cruises to the state, on
average.

Two out of three cruise ship passengers are traveling as a couple. The typical passenger is traveling in a group of 2 to 3 people.
8
66%
17%
13%
3%
<0.5%
1%
As a couple
As a family
With friends
By yourself
With business associates
Other
Travel Party Composition(Among passengers)
Travel Party Size and
Composition
On this cruise, are you traveling: (Please select all that apply.)Including yourself, how many people are in your immediate travel party on this cruise? (Please only include those individuals you are traveling with as a group.)Includes only those visitors who are confirmed to have taken the survey only once.
(n=1,371)
Statewide Average Number of Passengers in Travel Party on Ship:
2.6

On-shore Experiences
9

The large majority of cruise ship visitors who disembark – nine out of ten – do so only once.
10
1 time92%
2 times
6%
3 or more times2%
Number of Times Visitors Disembark While at Port
Number of Times Visitors
Disembark
How many times, in all, have you left (or expect to leave) your cruise ship on your visit to this port today? *Assumes visitors surveyed in Bar Harbor come to shore one time. The number of times passengers disembark and the amount of time they spend on-shore are dramatically impacted by whether ships dock or tender at that port. So it is important to note that these are the overall state averages across both types of ports.
Statewide Average Number of Times On-shore: 1.1 times*
(n=2,474)
Statewide Average Amount of Time Spent On-shore:
4.1 hours

The typical passenger comes to shore in a group of two to three people.
11
14%
64%
6% 8% 8%
1 person 2 people 3 people 4 people 5 or more people
Party Size On-shore (Among passengers)
Shore Visit Party Size
How many people accompanied you off the ship on this visit? (Again, please only include the people you are traveling with. If no one accompanied you, please write “0.”)
Statewide Average Number of Passengers
in Party On-shore: 2.5
(n=2,043)

Eight out of ten visitors receive information about Maine’s ports from cruise lines. The internet, used by two out of ten visitors, is a distant second.
12
79%
17%
8%
6%
3%
2%
2%
1%
9%
Cruise line (inc. website, crew)
Internet (non-social media)
Word of mouth
Information at pier
Social media
Travel magazine article
Print advertisement
TV advertisement
Somewhere else
Sources of Information About Ports
Sources of Information About Ports
How did you get information about this area? (Please select all that apply.)
(n=2,286)
No more than one out of ten visitors use any other source of
information about Maine’s ports.

Three out of four cruise visitors walk around the ports they visit, making it by far the most common way visitors get around on shore. Far fewer – one out of three – use shore excursion buses.
13
74%
31%
4%
4%
3%
2%
6%
Walking
Bus (part of shore excursion or other type)
Cab/Uber/Lyft
Ferry
Island Explorer (Bar Harbor, n=1,195)
Local bus or public transportation
Some other form of transportation
Transportation Method
Shore Transportation
What form(s) of transportation did you use after leaving the pier? (Please select all that apply.)
(n=2,441)
No other form of transportation is used by more than a handful of
people at any specific port.

Nine out of ten visitors tour or explore port towns when they leave their ship. About half go shopping, and one-third visit a specific historic or cultural attraction in or around the ports they visit.
14
78%41%
24%10%
9%1%
42%8%
2%2%
16%15%
4%4%4%3%5%
1%1%
4%
Sightseeing
Dining out/Eating in restaurants
Guided tours of communities or sites
Nature tour/Viewing wildlife
Visiting lighthouses
Attending fairs or festivals
At stores outside of malls
For antiques, arts, crafts
At outlet centers
At malls (NOT outlets)
State or national parks
Historic sites
Museums
Beaches
Art galleries
Art museums
Hiking/Biking
Boating
Swimming
Other activities not listed above
Specific Activities (Across all ports)
Shore Activities
Which of the following specific activities did you participate in after leaving the ship? (Please select all that apply.)
(n=2,402)
Total: 90%
Total: 47%
Total: 34%
Total: 6%
Total Experiencing the Area
Total Shopping
Total Visiting
Total Outdoor Activities
Statewide Average Number of Activities:
2.8
Views Toward Ports and Port Experiences
15

Half of all passengers say a port in Maine had a highly important role in their overall choice of which cruise to take.
16
Importance of
Ports in Itinerary
How important was this area in your decision to take this cruise or select this itinerary? Scale: 1 “Not at all important” to 5 “Extremely important.” Note: Scale points 2-4 had no label. “Highly important” includes the percentage selecting 4 or 5 on this scale.
(n=2,247)
5 - Extremely Important
20%
429%
328%
213%
1 - Not at all Important
9%
Importance of Port in Itinerary Selection
Total Highly Important Role: 50%

Excellent51%
Very Good33%
Good13%
Fair2%
Poor<0.5%
Providing a Warm, Welcoming Atmosphere
Large majorities of visitors – eight out of ten overall – rate Maine’s ports as excellent or very good at providing a welcoming atmosphere or good service.
17
Ratings of Ports –
Welcome and Service
Overall, how would you rate the area(s) you visited while you were off the ship in terms of the following?
(n=2,202)(n=2,276)Total Excellent/Very Good: 84%
Excellent49%
Very Good31%
Good12%
Fair2%
Poor<0.5%
Not Sure6%
Providing Good Service in Shops and Restaurants
Total Excellent/Very Good: 80%

Excellent64%
Very Good24%
Good8%
Fair2%
Poor<0.5% Not Sure
2%
Providing Natural Beauty
Nearly nine out of ten cruise visitors rate Maine’s ports as excellent or very good in terms of providing natural beauty or a clean, well-kept environment.
18
Ratings of Ports –Natural
Environment
Overall, how would you rate the area(s) you visited while you were off the ship in terms of the following?
(n=2,240)(n=2,220)Total Excellent/Very Good: 88%
Excellent57%
Very Good29%
Good11%
Fair2%
Poor<0.5%
Not Sure2%
Providing a Clean, Well-kept Environment
Total Excellent/Very Good: 86%

Eight out of ten surveyed cruise visitors are highly satisfied with their experiences on shore, with almost half calling themselves extremely satisfied.
19
5 - Extremely Satisfied
47%
434%
315%
24%
1 - Not at all Satisfied
1%
Satisfaction With On-shore Experiences
Satisfaction With On-
shore Experience
How satisfied would you say you are, overall, with your experience on shore on this visit to the area?Scale: 1 “Not at all Satisfied” to 5 “Extremely Satisfied.” Note: Scale points 2-4 had no label. “Highly satisfied” includes the percentage selecting 4 or 5 on this scale.
Total Highly Satisfied: 81%
(n=2,282)

More than eight out of ten cruise visitors to Maine would recommend a trip to the state to others. Most of these – almost six out of ten overall –would definitely recommend a trip to Maine.
20
Likelihood to Recommend a Trip to Maine
Based on your experience on shore, if asked, how likely would you be to recommend a trip to Maine to others?
5 - Definitely Will56%4
28%
3 - May or May Not13%
22%
1 - Definitely Will Not
1%
Likelihood of Recommending a Trip to Maine
Total Highly Likely to Recommend: 84%
(n=2,263)
Predictably, overall satisfaction and likelihood to recommend are related, though the strength of the relationship (on a scale of 0 to
1) is a very strong 0.9. This suggests that cruise visitors to Maine are highly likely to act on
their satisfaction and spread the word about Maine, perhaps spurring additional visitation.

About one out of three passengers consider themselves likely to return to Maine in the near future – whether by cruise or other methods. Most of the rest would likely consider it.
21
5 - Definitely Will16%
414%
3 - May or May Not48%
214%
1 - Definitely Will Not
8%
Likelihood to Return to Maine by Cruise (Among passengers)
Likelihood to Return
How likely would you say you are to return to Maine in the next five years by cruise?How likely would you say you are to return to Maine – by methods besides a cruise – in the next five years?Includes only those visitors who are confirmed to have taken the survey only once.
5 - Definitely Will18%
4%17%
3 - May or May Not43%
213%
1- Definitely Will Not
9%
Likelihood to Return to Maine by Other Methods(Among passengers & crew)
(n=1,343)(n=1,261)Total Likely to Return: 29% Total Likely to Return: 35%

22
Cruise Visitor Spending
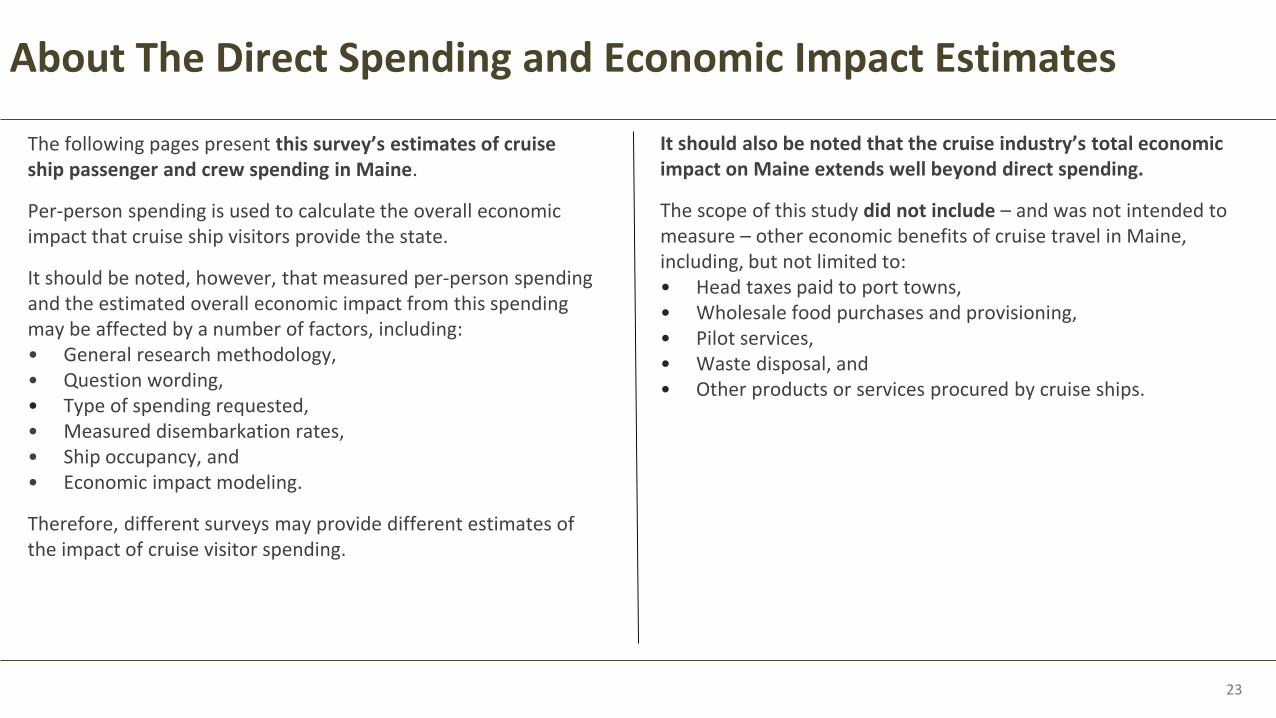
About The Direct Spending and Economic Impact Estimates
23
The following pages present this survey’s estimates of cruise ship passenger and crew spending in Maine.
Per-person spending is used to calculate the overall economic impact that cruise ship visitors provide the state.
It should be noted, however, that measured per-person spending and the estimated overall economic impact from this spending may be affected by a number of factors, including:• General research methodology,• Question wording,• Type of spending requested, • Measured disembarkation rates,• Ship occupancy, and• Economic impact modeling.
Therefore, different surveys may provide different estimates of the impact of cruise visitor spending.
It should also be noted that the cruise industry’s total economic impact on Maine extends well beyond direct spending.
The scope of this study did not include – and was not intended to measure – other economic benefits of cruise travel in Maine, including, but not limited to:• Head taxes paid to port towns, • Wholesale food purchases and provisioning, • Pilot services, • Waste disposal, and• Other products or services procured by cruise ships.

Four out of ten passenger trips on-shore include an excursion that was booked through a cruise line, at an average cost of about $120 per party and nearly $60 per person.
24
Took Shore Excursion
40%
Paid Shore Excursions
Statewide Average Cost of Cruise Line Shore Excursions:
Cruise Line Shore
Excursions
Did you take a shore excursion today that you booked through your cruise line?How much did you pay for the excursion for your travel party (and just the excursion)?
121 per party57 per person
(n=2,329)
$
It is estimated that at least 50% of this excursion spending remains in Maine’s economy.

Shopping41%
Food and Beverages24%
Excursions*21%
Recreation or Entertainment
7%
Transportation5%
All Other Expenses3%
Statewide Average Spending Per-person Per Shore Visit
The average visitor on cruise ships spends about $70 on each visit to Maine’s ports.
25
Spending
How much did your travel party spend during your time off the ship today on the following types of purchases?*Represents the costs of organized shore excursions paid to cruise lines. ** The “Averages Among Spenders” include only visitors who spent any money on the specific categories shown above; those who did not spend anything on a category are not included in these means. The other figures provided do include those who did not spend anything.
Statewide Averages Among Spenders (per-person on each shore visit)**
Shopping $39
Recreation or Entertainment $38
Transportation (not including the cruise) $28
Food and Beverages $23
Excursions* $57
All Other Expenses $34
Statewide Average Spending Per-personon Each Shore Visit: $69
Overall per-person spending, including cruise line sponsored shore excursions, is $69.02.
For the economic impact analyses shown on the following pages, we assume that 50% of spending on cruise line sponsored shore excursions stays in Maine’s economy.
With 50% of cruise line sponsored shore excursion expenses included, average per-person spending would be $61.76 for passengers and $66.67 for crew.
These are the spending figures used for the economic impact analysis shown on the following pages.

At least 420,000 visits to shore are made by passengers and crew, resulting in direct spending of $29 million across the state.
26
Spending
Total Direct Spending
Shopping $13.3 million
Food and Beverages $7.7 million
Recreation or Entertainment $2.2 million
Transportation (not including the cruise) $1.5 million
All other expenses (including shore excursions*) $4.3 million
Total Spent by Cruise Ship Passengers and Crew:
$28.9 Million
*In gauging the economic impact on Maine, only half of any spending on cruise line sponsored shore excursions is included, as not all of that spending provided to the cruise line remains in the state. The total per-person spending figure used for the economic impact analysis is therefore $61.76 for passengers and $66.67 for crew.
Total spending across the state is calculated by applying the average per-person spending* on each shore visit to 423,000 disembarking visitors, derived from:• A 94% occupancy rate on ships at each
port, • An 85% overall disembarkation rate
among passengers, and • A 23% overall disembarkation rate for
crew.
More information about the approach for estimating economic impact can be found in the Appendix, page 32.

Spending by cruise passengers and crew generates at least $33 million in total economic impact, supports 400 jobs, and generates $1.7 million in tax revenuefor Maine.
27
Total Economic
Impact
Total Economic Impact of Visitor Spending:
Number of Jobs Supported (Full-time Equivalent):
Total Earnings:
Tax Receipts:
This study captured spending by visitors (passengers and crew) on cruise ships and estimates the overall economic impact of this spending. Cruise ships require a variety of other services, however, which they may or may not receive at a given port. This research was not designed to measure the economic impact of passenger head taxes, food purchases, pilot services, waste disposal, or other services obtained directly by the cruise ship and paid for by the cruise lines. Total economic impact estimates, number of jobs, earnings, and tax receipts are calculated using a RIMS II model.
$33.5 Million
398
$9.3 Million
$1.7 Million

Demographics of Cruise Visitors
28

The average surveyed cruise visitor is just over 60 years old, and makes more than $100,000 per year. Three out of four have a college degree, and eight out of ten are married or living with a partner.
29
Demographics
Total
Average age 62 years
Average income $104,000
% female 60%
College degree or higher 76%
Married/Living with partner 81%
% of respondents who are passengers 96%
Most demographics include only those visitors who are confirmed to have taken the survey only once.
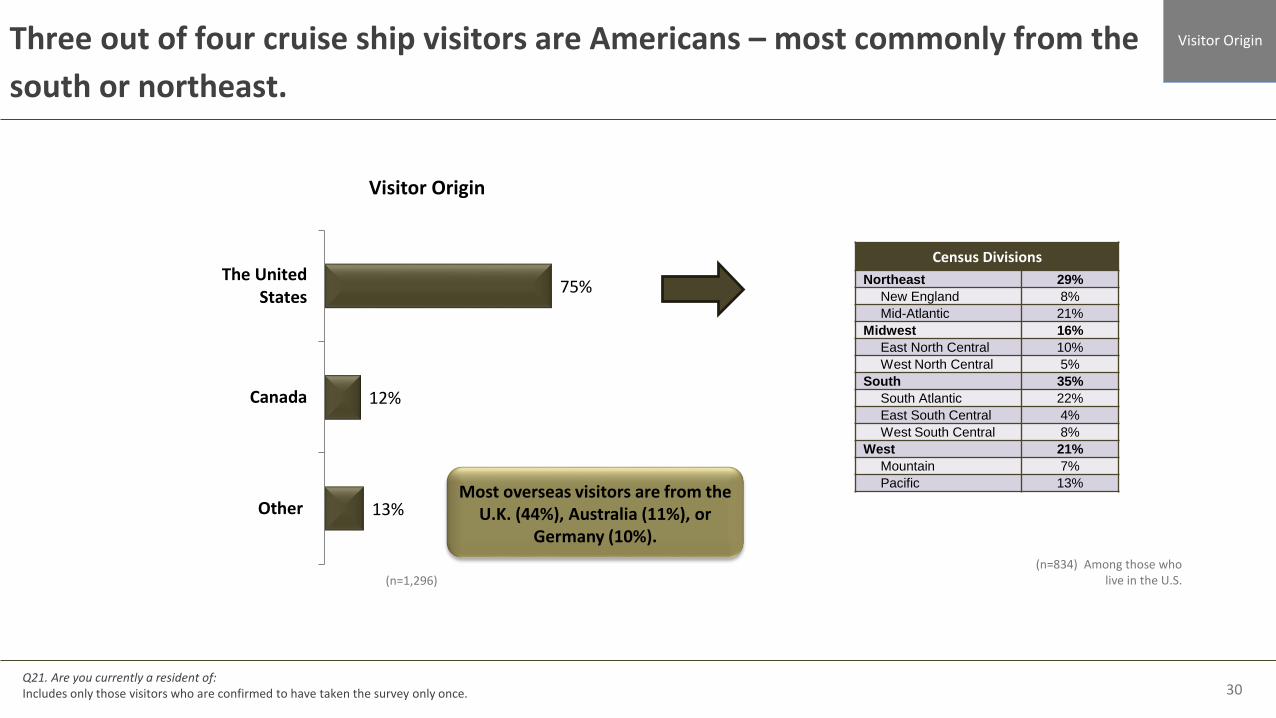
Three out of four cruise ship visitors are Americans – most commonly from the
south or northeast.
30
13%
12%
75%
Other
Canada
The UnitedStates
Visitor Origin
Census Divisions
Northeast 29%
New England 8%
Mid-Atlantic 21%
Midwest 16%
East North Central 10%
West North Central 5%
South 35%
South Atlantic 22%
East South Central 4%
West South Central 8%
West 21%
Mountain 7%
Pacific 13%
Visitor Origin
Q21. Are you currently a resident of:Includes only those visitors who are confirmed to have taken the survey only once.
(n=1,296)(n=834) Among those who
live in the U.S.
Most overseas visitors are from the U.K. (44%), Australia (11%), or
Germany (10%).

APPENDIX: Summary of Economic Impact
Calculations
31

Economic Impact Calculations
32
Direct Economic
Impact
Berth Capacity (Number of potential visitors to all ports in
Maine): 665,800*
Actual Ship Occupancy: 94%
(451,000 passengers/175,000 crew)
PASSENGER Disembarkation Rate:
85%** (383,000 on shore)
Average PASSENGER Spending on Each
Shore Visit: $61.76***
Average Number of Shore Visits: 1.1
* Information provided by CruiseMaine. ** Passenger disembarkation provided by the Cruise Line International Association based on average disembarkation in the Northeast; Crew disembarkation reflects information provided by Bar Harbor (a port where visitors are tendered to shore) and Portland (a port where
ships dock). *** Includes all spending on shopping, food and beverages, recreation, transportation, and 50% of spending on cruise line shore excursions.
CREW Disembarkation Rate:
23%** (40,000 on shore)
Average CREW Spending on Each
Shore Visit: $66.67***

172 Commercial Street
Portland, ME 04101
207.985.7660
www.digitalresearch.com