Survey of Childcare and Early Years Providers 2019 ... · questionnaire was fully redesigned in...
70
Survey of Childcare and Early Years Providers 2019 Technical report November 2019 Lydia Marshall, Sandy Chidley, Klaudia Lubian, Migle Aleksejunaite, Franziska Marcheselli NatCen Social Research
Transcript of Survey of Childcare and Early Years Providers 2019 ... · questionnaire was fully redesigned in...
Survey of Childcare and Early Years Providers 2019 Technical report
November 2019
Lydia Marshall, Sandy Chidley, Klaudia Lubian, Migle Aleksejunaite, Franziska Marcheselli
NatCen Social Research
2
Contents Contents 2
1. Introduction 4
2. Sampling 6
2.1 Group-based providers sample 6
2.2 School-based providers sample 8
2.3 Childminders sample 10
3. Questionnaire and testing 13
3.1 Main SCEYP: Questionnaire development 13
3.2 Main SCEYP: Pilot 15
3.3 Main SCEYP: Questionnaire sections 17
3.4 Short SCEYP: Questionnaire development 18
4. Survey fieldwork 20
4.1 Main SCEYP: Interviewer training and project briefings 20
4.2 Main SCEYP: Fieldwork dates 20
4.3 Main SCEYP: Making contact 21
4.4 Short SCEYP: Fieldwork dates 24
4.5 Short SCEYP: Making contact 24
5. Response rates 26
5.1 Main SCEYP: Response 26
5.2 Main SCEYP: Interview length 29
5.3 Short SCEYP: Response 29
5.4 Short SCEYP: Interview length 30
6. Data processing 32
6.1 Coding 32
6.2 Main SCEYP: Data cleaning 32
6.3 Main SCEYP: Calculating hourly pay 33
7. Weighting 35
7.1 Weighting the main SCEYP 35
7.1.1 Main SCEYP: Weighting for group-based providers 35
7.1.2 Main SCEYP: Weighting for school-based providers 37

3
7.1.3 Main SCEYP: Weighting for childminders 38
7.2 Weighting the short SCEYP 39
Appendix – Survey materials 41
A. Main SCEYP: Survey invitation letter 41
B. Main SCEYP: Preparation sheet 47
C. Main SCEYP: Qualifications sheet 62
D. Short SCEYP: Survey invitation letter 64

4
1. Introduction The Survey of Childcare and Early Years Providers (SCEYP) is important for monitoring and evaluating childcare and early years provision. Covering group-based providers (private, voluntary and school/college/LA/other unclassified1), school-based providers (those offering nursery provision and maintained nursery schools) and childminders, it provides a representative snapshot of early years provision in England. It helps the Government, including the Department for Education (DfE), understand the issues that providers face, informing development of early years and childcare policy.
The DfE commissioned the National Centre for Social Research (NatCen) and Frontier Economics to conduct the SCEYP 2019. The programme of research entailed two surveys. The main SCEYP 2019 entailed a large mixed mode survey, which could be completed either online or on the telephone. It collected data on a variety of topics such as staff-to-child ratios, delivery of Government policies including funded entitlements and Tax-Free Childcare (TFC), children with Special Educational Needs and Disabilities (SEND), staff qualifications and pay, and the financial side of providing childcare such as costs, incomes and fees. There were also a number of core questions such as the number of children registered at the setting. The short SCEYP was delivered online and on paper, and included questions on fees and Government funding received, as well as a small number of core questions, such as the number of children registered at the setting. The purpose of this short survey was to provide robust fee and funding estimates at a local authority (LA) level by aggregating data collected across this and the main SCEYP.
Earlier waves of the SCEYP were commissioned by the DfE and its predecessor departments and were conducted by telephone. The survey began in 1998 and was repeated in 2001, 2003, annually from 2005 to 2011, 2013, 2016 and 2018. The questionnaire was fully redesigned in 2016 to reflect changes in the childcare market. These changes to the design meant that the 2016 data is not directly comparable with previous years of the survey; the 2016 data was intended to provide a new and enhanced baseline. There were some changes to the 2018 survey to improve the quality of data and to reflect new policy priorities, but otherwise it was designed to be comparable with the 2016 survey.
In 2018, the DfE sought user perspectives on the frequency, sampling approach, mode and topic coverage of the SCEYP2. Following this consultation, the DfE decided to intensify the early years focus of the survey by sampling and recruiting only providers
1 Although this third group is included in the group-based provider total, it is not reported on in the official statistics publication. 2 Department for Education (2018) Surveys on childcare and early years in England: Government consultation response London: DfE

5
for pre-school children aged 0-4 years. Previous surveys had included reception provision as well as wraparound and holiday care for school-aged children aged up to seven. After a mode experiment in 2018, the DfE also decided to move the survey to a mixed mode approach including web completions. With the exception of this change in scope, minimal changes were made to the survey between 2018 and 2019 (see Section 2). The published tables in 2018 included estimates for school-based providers that included reception only. Because these were not in scope in the 2019 survey, the “all school-based provider” group is not directly comparable between previously published 2018 (or 2016) results and 2019 results. Where 2018 figures have been presented in the 2019 publication, these have been adjusted in order to be comparable.

6
2. Sampling As in previous waves of the Survey of Childcare and Early Years Providers (SCEYP), the study comprised a representative sample of the three distinct provider populations in England, each of which was analysed separately:
• Group-based providers (GBP): childcare providers registered with Ofsted and operating in non-domestic premises;
• School-based providers (SBP): nursery provision in schools, including before- and after-school provision and maintained nursery schools;
• Childminders: Ofsted-registered childminders providing early years care and operating in domestic settings (excluding providers solely on the voluntary register).
When reporting, these three groups were reported as five groups:
• private GBPs;
• voluntary GBPs;
• school-based providers offering nursery;
• maintained nursery schools (MNS); and
• childminders.
This section describes the sampling approaches adopted for the main SCEYP and short SCEYP in 2019, including a pilot of the main SCEYP.
2.1 Group-based providers sample GBPs are childcare providers registered with Ofsted and operating in non-domestic premises3. The survey collected further details about the ownership and type of childcare offered.
A request was made to Ofsted to provide information for all records in the “childcare on non-domestic premises” category (excluding those classified as inactive and those appearing on the Voluntary Childcare Register (VCR) only) from their July 2018 monthly snapshot database. The sample was conducted in July 2018 to be consistent with the timing of sampling for previous years’ surveys. The data was provided in two stages, with stage 1 providing the variables necessary for drawing the sample and stage 2 containing provider contact details (address, telephone numbers and e-mail address). At stage 1, 25,286 cases were provided. As in 2018, a few cases (12) had missing information on key
3 This does not include provision in schools.

7
stratification variables and were removed from the sample frame. Subsequently, 25,274 GBPs4 were left in the sample frame and used to select samples for all survey components. The National Centre for Social Research (NatCen) used response rates from the SCEYP 2018 (41% of issued cases responding to the main survey and 25% to the short survey) to determine required sample sizes. The sample size calculations were made under the assumption of issuing 100 GBPs into the pilot survey, achieving 6,200 interviews with the main survey and issuing all remaining cases to the short survey.
A stratified random sampling approach was used to select all of the samples. The pilot sample of the main survey was selected in proportion to the regional distribution of cases (in order to protect smaller areas from exhausting cases for other surveys), and stratified by local authority (LA), register type, ownership status, deprivation band based on the Income Deprivation Affecting Children Index (IDACI) and postcode5. The same stratification variables were used for sampling of the mainstage sample of the main survey (15,121 cases selected). As in 2018, it was decided to oversample the North East to enable more robust comparisons between regions.
The selected sample was then allocated systematically (using the same stratification variables) to one of three questionnaire variants (16%/42%/42% split)6 and, within each variant, to a specific day of the week about which to answer certain questions. All GBPs that remained in the sample frame following sampling to the main survey were treated as eligible for the short survey (10,053).
Following the receipt of stage 2 data, the samples were checked for duplication of records7, availability of contact details8 and eligibility9. Thereafter, 768 cases were dropped from the sample files – 455 from the mainstage main survey and 313 from the short survey. See Table 1 Number of group-based providers issued to each survey element for a breakdown of GBP sample numbers across the different survey components.
4 The sample frame for the SCEYP 2018 included 25,221 GBPs. 5 Following discussions with DfE, number of places registered was dropped from the list of stratifying variables in 2019 as it had proved to be out of date in 2018. 6 In 2016 and 2018, about 42% of GBPs were allocated to the variant with finance questions, another 42% to the variant with staff loops, and about 16% to the variant with questions about SEND and holiday provision. It was agreed to keep the same proportions for the study in 2019. 7 14 cases were identified as duplicates and dropped from the sample files. 8 7 cases were dropped from the sample files due to missing contact details. 9 747 cases were identified manually as ineligible to take part in the study; most of them were holiday schools.

8
Table 1 Number of group-based providers issued to each survey element
Survey element Issued (n)
Main SCEYP - pilot 100
Main SCEYP - mainstage 14,666
Short SCEYP - mainstage 9,740
Total 24,506
2.2 School-based providers sample The sample of SBPs consisted of maintained and independent primary schools with nursery and reception provision, including maintained nursery schools (MNS). Although schools offering reception provision alongside nursey provision were eligible for the study, they were only asked about their nursery provision. This sample was drawn from the Schools Census collected in January 2018 from all schools in England, complemented with further information from the Get Information About Schools (GIAS)10 extract. The types of schools eligible for the study were identified using the following criteria:
• Independent schools with reception and nursery provision: independent schools with statutory lowest age equal to 0, 1, 2 or 3 years (according to School Census) and offering nursery classes (according to GIAS);
• Maintained nursery schools: State-funded nursery schools (according to School Census);
• Maintained schools with reception and nursery provision: state-funded mainstream and special schools which offer nursery classes (which have at least one pupil in nursery and with at least one pupil in reception).
Due to the information available in the sampling frame, independent and maintained schools needed to be selected separately though they were subsequently analysed as a single group.
Eligible schools for the study were identified in the same way as in 2018 (see the 2018 technical report for more details)11 with one important exception. In 2019, but not 2018, it
10 Get Information About Schools (GIAS) is a register of educational establishments in England and Wales. It is maintained by the Department for Education. 11https://assets.publishing.service.gov.uk/government/uploads/system/uploads/attachment_data/file/752606/Survey_of_Childcare_and_Early_Years_Providers_2018_Technical_Report.pdf

9
was possible specifically to identify schools offering nursery classes whereas for SCEYP 2018 this flag was not available in the sampling frame12.
The sampling frames were checked for duplication of records and availability of contact details. Subsequently, -three cases were identified as duplicates and removed from the sampling frame. After the sampling frame data was cleaned, it included 9,150 school-based providers13.
To decide the required issued sample sizes, NatCen assumed the same response rates as in the SCEYP 2018 mainstage sample (which was administered via Computer Assisted Telephone Interviewing, also known as “CATI”). The response rates differed significantly between key school types, so in the calculation of the issued sample size NatCen used the response rate assumptions as presented in Table 2.
Table 2 Response rate assumptions for school-based providers by type
School type Main survey
Short survey
Independent schools with reception and nursery provision 31% 25%
Maintained nursery schools 63% -
Maintained schools with reception and nursery provision 31% 25%
In 2018, a mode experiment was conducted to inform the mainstage of SCEYP 2019. However, given a short fieldwork period and suboptimal conditions for the experiment (relative to full fieldwork), it was decided not to use the response rate from the mode experiment in the response calculations for 2019. Only the CATI response rates to the main survey were used.
A stratified random sampling approach was used to select the samples of school-based providers. Table 3 Number of school-based providers issued to each survey element presents the sample sizes selected for the pilot, mainstage main survey as well as the short survey. As in 2018, it was necessary to include all maintained nursery schools that were sampled in the main survey in order to ensure achieving sufficient interviews for regional analysis. The samples were stratified by school type (disproportionate sampling),
12 The population of SCEYP 2018 included schools that offered reception provision only. However, lack of such a flag resulted in some ‘reception only’ schools turning out to have been offering nursery too (37 schools). 13 9 cases had missing information about the address, which had been checked online. E-mail address was not available for 278 schools in the sampling frame.

10
region and IDACI score to ensure geographical representativeness of the sample14,15. After stratification, 60 schools were selected for the pilot and 5,881 for the mainstage of the main survey. The samples were then allocated systematically (using the same stratification variables) to one of two questionnaire variants (50%/50% split) and, within each variant, to a specific day of the week about which to answer questions.
The 3,209 schools that remained in the sample frame after sampling for the main survey were allocated to the short survey. These were only maintained and independent schools offering both reception and nursery.
Table 3 Number of school-based providers issued to each survey element
Survey element Issued (n)
Main SCEYP – pilot 60
Main SCEYP – mainstage 5,881
Short SCEYP – mainstage 3,209
Total 9,150
2.3 Childminders sample The sample of childminders, those offering provision on domestic premises, was drawn from the July 2018 monthly snapshot of the Ofsted register of childminders16. Only those who confirmed they were still practicing childminders at the time of the interview were eligible to be interviewed.
A request was made to Ofsted to provide information for all records of active childminders (excluding those appearing on the VCR only) from their July 2018 monthly snapshot database. The data was provided in two stages, with stage 1 providing the variables necessary for drawing the sample, and stage 2 containing the provider name, address and contact details (telephone numbers, e-mail address). Following the cleaning process17 the
14 Stratification by index of multiple deprivation was introduced in 2018. 15 Neither number of places registered nor register type were variables available in the sampling frame for school-based providers. 16 Childminders must either register with Ofsted or a childminder agency. Only those who were registered with Ofsted were included in the SCEYP sample frame. 17 41,219 cases were provided by Ofsted. However, these included 227 cases from the category Childcare – Domestic. As in the previous year, these have been removed as they were not eligible for the study. As last year, a few cases (4) have missing information on key strata (region, LA and deprivation) and were removed from the sample frame.

11
stage 1 database included 40,988 active childminders18. This database was used to select samples for all survey components.
As with other provider types, NatCen used response rates from the SCEYP 2018 (31% of issued cases responding to the main survey and 25% to the short survey) to determine required sample sizes.
The sample size calculations were made under the assumption of inviting 100 childminders to take part in the pilot survey, achieving 1,500 interviews with the main survey and allocating a maximum of 25,000 childminders for the short survey. Given the contact details could only be provided by Ofsted for the selection of cases, NatCen decided to select 3% as a reserve sample for the main survey in case selected cases were missing both telephone and e-mail addresses (assumption based on 2018 survey). Therefore, NatCen selected 109 cases for the pilot sample and 4,981 for the mainstage sample. As in the previous year, the design of the short survey sample was driven by the need to provide estimates at LA level. Therefore, NatCen estimated how many interviews including data on fees would be achieved with the main survey and how many more would need to be invited to complete the short survey so that at least 100 interviews in each LA (from both the short and main survey) could be achieved. In the smaller LAs (where it was not possible to achieve 100 interviews), it was decided to invite all eligible childminders to participate whilst the remaining sample capacity was distributed proportionately between other LAs.
A stratified random sampling approach was used to select all of the samples. Following the design of SCEYP 2018, for the mainstage sample of the main survey, smaller regions were oversampled to enable reporting by region and questionnaire variants. The sample was further stratified by LA, register type, time elapsed since registration and IDACI score19, and then checked to ensure that the selection was representative of the entire population of childminders.
The selected sample was then allocated systematically (using the same stratification variables) to one of two questionnaire variants (50%/50% split) and, within each variant, to a specific day of the week to answer questions about. The sample for the short survey was stratified by the same set of variables (explicitly stratifying by LA), and then allocated to a specific day of the week about which to answer certain questions.
Following the receipt of stage 2 data, the samples were checked for duplication of records and availability of contact details. Subsequently, 134 cases were dropped from the sample
18 The sample drawn for childminders followed exactly the same criteria in 2019 as it did in 2018. There was a notable reduction in the size of the sampling frame between 2019 and 2018, as there was between 2018 and 2016. In 2018 there were 42,682 childminders to sample from. 19 Following discussions with DfE, number of places registered was dropped from the list of stratifying variables this year as it was proved to be out of date.

12
files20. Table 4 Number of childminders issued to each survey element presents the final childminder sample numbers across the different survey components.
Table 4 Number of childminders issued to each survey element
Survey element Issued (n)
Main SCEYP - pilot 109
Main SCEYP - mainstage 4,848
Short SCEYP - mainstage 24,999
Total 29,956
20 879 childminders in the sample frame missed information about phone number, 14,074 missed e-mail address, 793 missed both e-mail and telephone number: 660 cases allocated to the short survey and 133 to the mainstage main survey. Since either phone number or e-mail was necessary to administer the main survey, 133 cases were dropped from the sample frame. Additionally, one case was identified as a duplicate and dropped from the short survey sample.

13
3. Questionnaire and testing
3.1 Main SCEYP: Questionnaire development As outlined in the introduction to this report, the scope of the Survey of Childcare and Early Years Providers (SCEYP) changed between 2018 and 2019 to focus more specifically on provision for pre-school children aged 0-4 years. This involved removing all questions about reception provision in schools. Beyond this change, the questionnaire for the main SCEYP 2019 was designed to be as similar as possible to the main SCEYP 2018 to facilitate analysis of change over time. A small number of changes were proposed between 2018 and 2019 in order to improve the quality and relevance of the data collected. These changes – set out in Table 5 - were piloted and most were implemented for the mainstage (see below).
Table 5 Changes to the main 2019 SCEYP questionnaire since 2018
Question Question wording Change Q9disab Does your setting/does your nursery/do
you provide care for children with… 1 Minor Special Educational
Needs or disabilities 2 Moderate Special Educational
Needs or disabilities 3 Severe Special Educational
Needs or disabilities
New question added in 2019
QEHChelp Over the past 12 months, has your setting/has your nursery/have you provided support for parents to apply for an Education, Health and Care plan (EHC)?
New question added in 2019
QSBPFees Does your school charge fees for nursery provision?
New question added in 2019
Qothercosts And finally, how much do you typically spend on any other costs associated with delivering your childcare provision?
New question added in 2019
Qotherincome How much income do you/does your nursery typically receive from any other sources?
New question added in 2019
QHLEhelp Over the past 12 months, has your setting/has your nursery/have you provided support for parents with improving the Home Learning Environment?
New question added in 2019

14
Question Question wording Change Qweekprov Does your school provide weekend care
for children under the age of five? Question removed. School-based providers (SBP) now asked Qdays in line with other provider types. Qdays: Which days do you/does your nursery typically open in term-time?
Qcmdaycapa How many, if any, extra under school-aged children that needed childcare throughout the whole day would you have been willing and able to take on that day?
The word “extra” added to clarify that interest is in extra capacity as well as to align the wording with questions for other type of providers.
Qbefaft The next questions are about the types of provision offered at your school. First, does your school provide before or after school care for school children in term time?
Wording changed to focus on school children rather than under 8s
Qholprov Does your school provide holiday activities or childcare for school children during any school holidays?
Wording changed to focus on school children rather than under 8s
Term1534yo Can parents use these 15 funded hours 1. Throughout the year (both during
and out of school term time)? 2. During school term time only? 3. During school holidays only?
Asked of all providers in 2019 (previously a variant question)
Term3034yo Can parents use these 30 funded hours 1. Throughout the year (both during
and out of school term time)? 2. During school term time only? 3. During school holidays only?
Asked of all providers in 2019 (previously a variant question)
Qmanage What type of group, organisation or individual owns or manages {Textfill: “Provider_name”}?
Question is now a single code rather than multi-code question
Qtempstaff Excluding apprentices, how many paid staff do you currently employ on a temporary basis?
Asked of all group-based providers (GBP) in 2019 (previously a variant question)
Qtempstaffnurs Excluding apprentices, how many paid staff in your nursery are currently employed on a temporary basis?
Asked of all SBPs in 2019 (previously a variant question)
QavefeeSC What is the average hourly fee that you charge/your school charges for before or after school care” for school-aged children aged 4 or older?
Asked of SBPs in 2019 (previously asked of GBPs and childminders only)

15
Question Question wording Change QfeesSCinc How much income do you typically
receive in parent fees for school-aged children aged 4 or older?
Asked of SBPs in 2019 (previously asked of GBPs and childminders only)21
3.2 Main SCEYP: Pilot The main SCEYP was piloted from 19th January22 to 10th February 2019. The pilot was a mixed mode survey, which could be completed either online (known as Computer Assisted Web Interviewing, or “CAWI”) or on the telephone (known as Computer Assisted Telephone Interviewing, or “CATI”). A “web-first” design was followed, with the online survey launched first and a communication strategy designed to maximise the number of online completions. Telephone fieldwork ran from Tuesday 29th January to Friday 8th February 2019. Telephone fieldwork was carried out by five interviewers from the National Centre for Social Research (NatCen) Telephone Unit.
The pilot had the following aims:
1. To test the survey questionnaire, including newly added variables;
2. To gain feedback on the survey processes, including the “web-first” approach, explaining the survey to respondents and gaining participation; and
3. To test the survey documents (preparation sheets, respondent letters and emails, interviewer project instructions etc.)
The pilot sample was made up of 269 providers (see Section 2. Sampling). Table 6 shows that the response rate was highest for SBPs (47%) and childminders (46%) and lowest for GBPs (38%). The refusal rate was 11%, and refusals were most common among GBPs. Reasons for refusals included not having enough time, recent participation in other early years surveys, and not getting approval from someone more senior in the organisation.
The majority (82%) of providers who took part in the pilot did so online, reflecting the strong ”push-to-web” approach adopted as well as the fact that the sample had not been exhausted by the close of the pilot fieldwork. Table 7 shows that SBPs had the greatest proportion (86%) of respondents completing the survey via the web.
21 It was decided at a late stage to make this change for the pilot. However, following further discussions around the low importance of this source of income for SBPs, NatCen, Frontier Economics and DfE decided that the mainstage questionnaire would revert to not asking this question of SBPs. 22 The survey went live and invitation letters were sent on Friday 18th January. Fieldwork was scheduled to commence on Tuesday 22nd January, when invitation emails were also sent, but providers actually began completing the questionnaire from Saturday 19th January.

16
Interviews were considered productive if the provider completed the questionnaire sections about attendance and capacity, funded hours and staff-to-child ratios. “Partially” productive interviews included those cases where the provider completed these sections but did not reach the very end of the questionnaire – usually missing some of the topics allocated to “variants” of the questionnaire. Overall, there were 15 partial completions (14% of all productive interviews). All partial interviews were from providers taking part online (see Table 6).
Table 6 Pilot response rates
Response rates Group based providers
School based providers Childminders Total
Issued sample (n.) 100 60 109 269
Achieved (n.) 36 28 43 107
- Complete 30 25 37 92
- Partial 6 3 6 15
Overall response rate23 38% 47% 46% 43% Cooperation rate 60% 70% 83% 70%
Contact rate 64% 67% 56% 61%
Refusal rate 14% 10% 9% 11%
Eligibility rate 94% 100% 85% 92%
Table 7 Pilot response mode (% of productive cases by telephone and web)
Response mode Group based providers
School based providers Childminders Total
% n. % n. % n. % n.
Telephone 22% 8 14% 4 16% 7 18% 19
Web 78% 28 86% 24 84% 36 82% 88 The pilot found the planned fieldwork procedures and communication strategy to be effective in encouraging response, and online response in particular. As a result, NatCen, Frontier Economics and the Department for Education (DfE) agreed to make minimal changes to the communication plans for mainstage. Likewise, the questionnaire itself worked well in the pilot. There were minimal changes to the questionnaire between 2018 and 2019 and no issues arose with the new questions added to the questionnaire.
23 Response rate was calculated by dividing the number of productive cases by the number of productive and unproductive cases, and assuming a certain eligibility rate for the unknown cases. Cases with unknown eligibility were those who were ‘non-contacts’ and ‘other unproductive’.

17
Two recommendations were agreed:
1. To drop Qsessnum on sessional provision:
“How many different under school-aged children were booked to attend [your/your nursery’s] sessional provision at any time throughout that [reference day]?”
Interviewers reported that respondents did not always understand what ‘different’ meant and often added morning and afternoon sessions together to calculate their answer, which could result in double counting children. This problem was also reported in the 2018 fieldwork. It was agreed to remove Qsessnum from the questionnaire due to the risk of inaccurate data being collected, particularly in the online mode. This data has not been reported in the statistical release – instead attendance and capacity were looked at separately for full day care, morning sessions and afternoon sessions.
2. To monitor partial completions during the mainstage fieldwork and consider focusing telephone interviewer resource on calling providers who had dropped out partway through the questionnaire, to encourage them to complete the “variant” questions that they had missed.
This was done towards the end of fieldwork, with a focus on the financial variants.
3.3 Main SCEYP: Questionnaire sections Table 8 sets out the questionnaire structure used in the main SCEYP 2019. As in previous years, the questionnaire was split into variants in order to reduce the time burden of completing it, while still ensuring a large enough response to enable detailed analysis.
The core questionnaire for each provider type asked a series of contextual questions as well as covering capacity and attendance.
GBPs answered the core questionnaire and one of three provider-specific variants. The content of these variants consisted of questions on either funded hours and expanding provision (variant 1), staffing (variant 2) or finances (variant 3).
SBPs and childminders answered the core questionnaire and one of two provider-specific variants. One variant asked about staffing and children with SEND (variant 1), while the other comprised financial questions (variant 2).

18
Table 8 Main SCEYP questionnaire sections
3.4 Short SCEYP: Questionnaire development The questionnaire for the short SCEYP 2019 was designed to be as similar as possible to the short SCEYP 2018, in order to facilitate analysis of change over time.
A small number of questions were added to or amended in the short SCEYP between 2018 and 2019 in order to enhance financial analysis and improve comparability between the main and short surveys. These changes are set out in
School-based providers
Group-based providers Childminders
Provider background Core Core Core
Attendance and capacity Core Core Core
Funded hours – delivery Core Core Core
Funded hours – flexibility Variant 2 Variant 1 Variant 1
Staff-to-child ratios Variant 2 Variant 1+3 n/a
Children with SEND Core Variant 1+3 Core
Access to SENCO Variant 1 Variant 1 Variant 1
Provider level staff questions* Core/Variant 1 Core/Variant 2 Core/Variant1
Looped staff questions Variant 1 Variant 2 Variant 1
Fees & Free Entitlements Core Variant 1+3 Variant 2
EYPP and TFC Core Variant 3 Core
Expansion of provision Variant 2 Variant 1 Variant 1
Costs of childcare Variant 2 Variant 3 Variant 2
Income from childcare Variant 2 Variant 3 Variant 2
Additional services Core Core Core** *Some questions in these sections were core and asked of all, some questions allocated to a specific variant.
**Only some of these questions were asked of childminders because not all were relevant.

19
Table 9.
Table 9 Changes to the short SCEYP 2019 questionnaire since 2018
Question Question wording Change Qmanage What type of group, organisation or
individual owns or manages {Textfill: “Provider_name”}?
Question wording aligned with main survey (2018 short SCEYP used a different question with simplified categories)
QSCyn Do you currently look after any/Does your setting provide before or after school care for/Does your school provide before or after school care for school children aged 4 and over?
Question wording aligned with main survey (focusing on before and after school provision)
Qdays Which days do you/does your nursery typically open in term-time?
New question added in 2019 (to align with main survey)
QavefeeSC What is the average hourly fee that you charge/your school charges for before or after school care, for school children aged 4 or older?
Question wording and routing aligned with main survey
QfeeschangeSC Have the average fees that you charge/your school charges for before or after school care, for school children aged 4 or older changed over the past 12 months?
Question wording and routing aligned with main survey
Fund1534yo Do any of the 3 or 4 year olds attending your setting/attending your nursery/you look after receive Government-funded hours under the universal 15 hours Free Entitlement?
New question added in 2019 (to align with main survey)

20
4. Survey fieldwork The 2019 main Survey of Childcare and Early Years Providers (SCEYP) was conducted as a mixed mode survey, which could be completed either online (via Computer Assisted Web Interviewing, also known as “CAWI”) or on the telephone (Computer Assisted Telephone Interviewing, also known as “CATI”). The online web survey was hosted by the National Centre for Social Research (NatCen) and the telephone fieldwork was conducted by NatCen and IFF Research. IFF Research provided additional telephone capacity for the project and took responsibility for 50% of the main survey sample.
Data for the mixed mode short SCEYP was collected online and using a paper questionnaire. Fieldwork was conducted by NatCen.
4.1 Main SCEYP: Interviewer training and project briefings Before starting work on the survey, all interviewers were required to attend a face-to-face project briefing on the survey. These briefings covered:
• Purpose of the study and how the data are used;
• Questionnaire content;
• Study procedures, including initial contact with respondents and reminder communications;
• Motivating respondents to take part;
• Practice interviews.
NatCen provided a fieldwork briefing to IFF Research to ensure consistency across the fieldwork.
4.2 Main SCEYP: Fieldwork dates The main SCEYP fieldwork took place between 18th March24 and 10th July 2019. A “web-first” design was followed, with the online survey launched first and a communication strategy designed to maximise the number of online completions (see Error! Reference source not found. for communication dates). Telephone fieldwork ran from 8th April to 10th July 2019.
24 The survey went live and invitation letters were sent on Friday 15th March. Fieldwork was scheduled to commence on Tuesday 19th March, when invitation emails were also sent, but providers actually began completing the questionnaire from Monday 18th March.

21
4.3 Main SCEYP: Making contact Potential respondents were sent a range of survey materials to motivate participation, increase the completeness of the data collected and reduce participant burden by helping respondents to prepare in advance. Building on previous years, NatCen worked with the Department for Education (DfE) in order to make these materials as accessible, appealing and persuasive as possible. Changes made between 2018 and 2019 to encourage response included:
• Contents of materials. Increased the emphasis on the benefits of survey participation by stressing what results will be used for. NatCen also attempted to decrease the cost of survey participation for respondents, by reducing the length and complexity of communications and making responding as convenient as possible.
• Using different motivational statements across the different contact attempts. Research evidence25,26 shows that varying the messaging across different communications increases response rates by attracting participants with different motivations to take part. Initial communications focussed on the most popular motive for survey participation - altruism (by emphasising the importance of the research, the value of taking part, and being able to help the families and children they support by telling the government about the impact of any changes). Later letters and emails highlighted other potential motivations, such as self-interest and the survey topic.
• Design of mailings. Efforts were made to ensure that all mailings looked professional and legitimate, and would not be mistaken for junk mail or commercial marketing. The layout was engaging and concise, clearly spelling out what was being asked of participants and why.
• ‘Nudges’ for participants without email addresses. A postcard nudge was sent out a couple of days after the invitation letter. This was to remind those who may not have acted immediately upon receipt of the invitation letter.
25 Dillman, D. A., Smyth, J. D., Christian, L. M. (2014). Internet, Phone, Mail, and Mixed-Mode Surveys: The Tailored Design Method, 4th Edition, Wiley. 26 Nicolaas, G., Smith, P., Pickering, K. & Branson, C. (2015). Increasing response rates in postal surveys while controlling costs: an experimental investigation. Social Research Practice Issue 1 Winter 2015. http://the-sra.org.uk/wp-content/uploads/social-research-practice-journal-issue-01-winter-2015.pdf

22
The full range of communications sent to potential respondents was as follows:
Letter to chain directors
Large chains of childcare settings are a growing part of the early years sector in England. Prior to the start of fieldwork, Lydia Marshall, the project lead at NatCen, wrote to the directors of all large chains (10 settings or more) identifiable in the sample. The letter explained the SCEYP, signposted people to reports from 2018, explained that head offices might be contacted during the telephone fieldwork and thanked directors in advance for their co-operation.
Ministerial letter (from the Parliamentary Under-Secretary of State for Children and Families)
In order to encourage school-based providers to take part, a letter was sent from Nadhim Zahawi, Parliamentary Under-Secretary of State for Children and Families, to this participant group at the outset of fieldwork. This letter was sent in place of the pre-notification email sent to other providers. This letter highlighted the importance of the survey in providing robust and up to date evidence on the childcare and early years sector, and encouraged schools to take part.
Pre-notification email
Prior to the start of fieldwork, all group-based providers and childminders with an email address on the sample file were sent a pre-notification email. The purpose of this email was to make initial contact with the providers to let them know that they would be invited to participate in the survey. School-based providers were not sent this email as they had been sent the ministerial letter.
Invitation letter and email
All providers were sent an invitation letter and (if they had an email address available) an invitation email. These invitations gave full details about the study, including information security, and invited the provider to take part. They also included details on how to take part online and informed providers that they would hear from an interviewer via telephone if they did not complete the survey online. Both letters and emails included either a physical preparation sheet or a link to one online to help providers prepare to take part. See Appendix A for the survey invitation letter sent to each provider type.
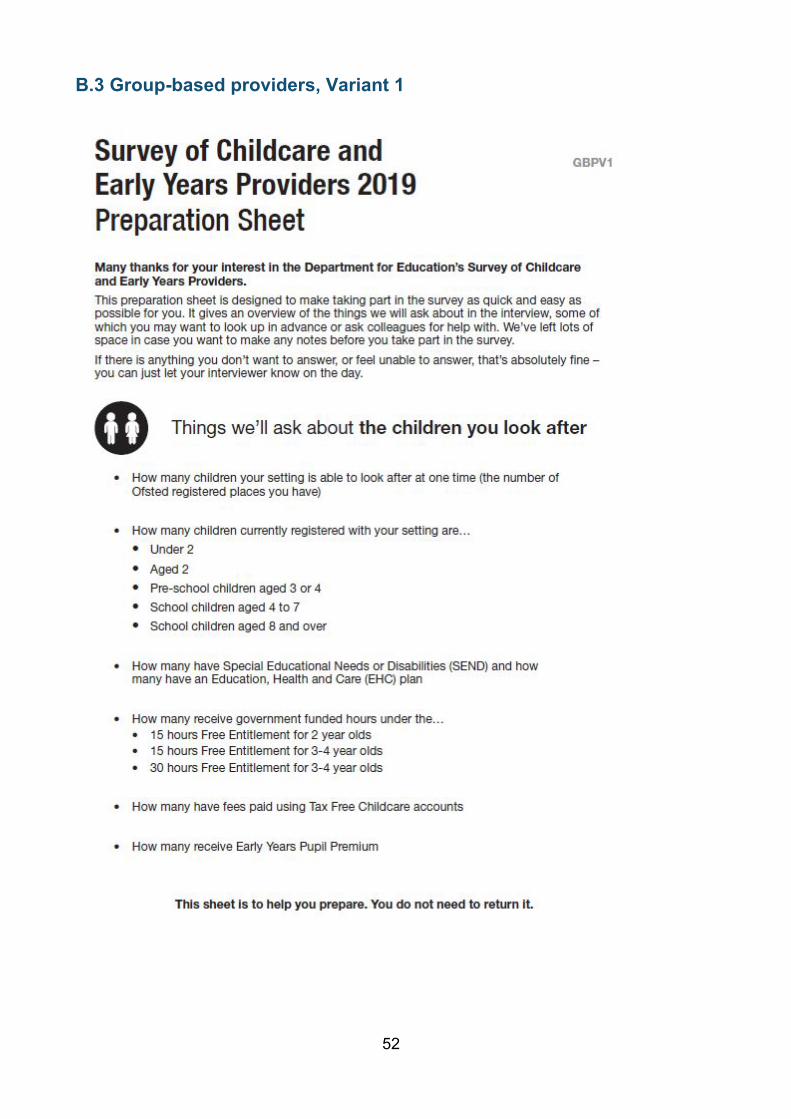
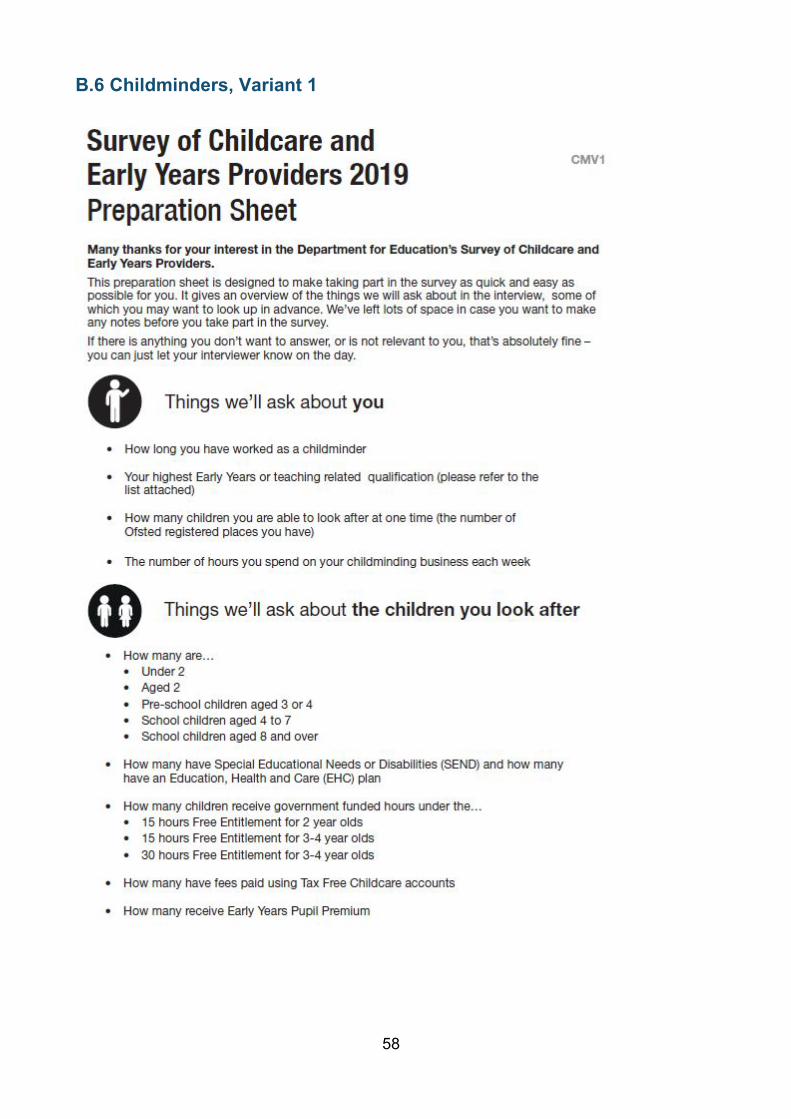
Preparation sheet
The preparation sheet helped providers prepare for the telephone interview by listing information that they might need to look up in advance, such as financial figures that they were unlikely to know by heart or the qualifications of staff members. These preparation sheets were tailored according to the provider type and the variant of the survey that they
23
would be asked to complete. They also asked respondents to focus on a particular day of the working week (Monday to Friday) in order to get precise answers that also allowed for analysis of trends in attendance and capacity that vary by weekday. See Appendix B for the preparation sheets.
Qualifications list
A list of qualifications was enclosed with the invitation letter and email to help providers identify which levels of Early Years or teaching qualifications their staff members held. Telephone interviewers were able to resend the invitation email with a link to the preparation sheet and qualifications list to providers who wanted to prepare before completing the survey. Providers were encouraged to complete the preparation sheet, but this was not compulsory. See Appendix C for the qualifications list.
Postcard nudge
A postcard reminder was sent to all providers with no email address or mobile phone number available. The purpose of these postcards was not to convert refusals, but to jog the memories of those who may have intended to take part, but had forgotten to, and to catch the attention of those who may not have seen the first invitation.
Reminder emails and texts
Up to three reminder texts and four reminder emails were sent to all non-responding providers for whom NatCen had the relevant contact details. Each reminder stressed a different potential motivation for taking part. The final email was sent only to those who had begun the questionnaire but not completed it.

24
Table 10 Main SCEYP fieldwork and communication dates
Communication Sent out To arrive Ministerial letter (to school-based providers only)
Friday 8th March 2019 Tuesday 12th March 2019
Pre-notification email Tuesday 12th March 2019 Tuesday 12th March 2019
Invitation letter Friday 15th March 2019 Tuesday 19th March 2019
Start of fieldwork Tuesday 19th March 2019
Invitation email Tuesday 19th March 2019 Tuesday 19th March 2019
Postcard nudge (to those without an email address)
Tuesday 19th March 2019 Thursday 21st March 2019
Reminder email 1 Wednesday 27th March 2019 Wednesday 27th March 2019
Reminder SMS 1 Wednesday 27th March 2019 Wednesday 27th March 2019
Reminder email 2 Monday 1st April 2019 Monday 1st April 2019
Reminder SMS 2 Wednesday 3rd April 2019 Wednesday 3rd April 2019
Reminder letter Wednesday 3rd April 2019 Friday 5th April 2019
Reminder email 3 Thursday 25th April 2019 Thursday 25th April 2019
Reminder SMS 3 Thursday 25th April 2019 Thursday 25th April 2019
Reminder email 4 Wednesday 22nd May 2019 Wednesday 22nd May 2019
Reminder SMS 4 Wednesday 22nd May 2019 Wednesday 22nd May 2019
Reminder email 5 Friday 28th June 2019 Friday 28th June 2019
End of fieldwork Wednesday 10th July 2019
4.4 Short SCEYP: Fieldwork dates The short SCEYP fieldwork ran from Tuesday 30th April until Wednesday 10th July 2019. As with the main survey, a “web-first” design was followed, with the online survey launched first and a communication strategy designed to maximise the number of online completions (see Error! Reference source not found. for communication dates). Paper questionnaires were sent out with reminder letters a month into fieldwork and were supplemented with email reminders.
4.5 Short SCEYP: Making contact Changes to the communication strategy for the short SCEYP mirrored the changes made to the main SCEYP (see section 4.3). Potential respondents were sent a range of survey materials to motivate participation, increase the completeness of the data collected and reduce participant burden by helping respondents to prepare in advance. Building on previous years, NatCen worked with DfE in order to make these materials as accessible,

25
appealing and persuasive as possible. Changes made between 2018 and 2019 to encourage response included changes to the contents of materials to contain varying motivational statements.
The full range of communications sent to potential respondents was as follows:
Ministerial letter (from the Parliamentary Under-Secretary of State for Children and Families)
In order to encourage school-based providers to take part, a letter was sent from Nadhim Zahawi, Parliamentary Under-Secretary of State for Children and Families, to this participant group at the outset of fieldwork. This letter highlighted the importance of the survey in providing robust and up to date evidence on the childcare and early years sector, and encouraged schools to take part.
Invitation letter and email
All providers were sent an invitation letter and an invitation email if they had an email address (over half (52%, n=20,006) of the sample had email addresses). These invitations gave full details about the study, including information security, and invited the provider to take part. They also included details on how to take part online. See Appendix D for the survey invitation letter sent to each provider type.
Reminder emails
Up to three reminder emails were sent to all non-responding providers who NatCen had the relevant contact details for. Each reminder stressed a different potential motivation for taking part.
Table 11 Short SCEYP fieldwork and communication dates
Communication Sent out To arrive Ministerial letter (to school-based providers only)
Tuesday 23rd April 2019 Thursday 25th April 2019
Invitation letter Friday 26th April 2019 Tuesday 30th April 2019
Start of fieldwork Tuesday 30th April 2019
Invitation email Tuesday 30th April 2019 Tuesday 30th April 2019
Reminder letter 1 Monday 20th May 2019 Wednesday 22nd May 2019
Reminder email 1 Wednesday 22nd May 2019 Wednesday 22nd May 2019
Reminder letter 2 Tuesday 4th June 2019 Thursday 6th June 2019
Reminder email 2 Thursday 13th June 2019 Thursday 13th June 2019
Reminder email 3 Wednesday 19th June 2019 Wednesday 19th June 2019
End of fieldwork Wednesday 10th July 2019

26
5. Response rates
5.1 Main SCEYP: Response In total, 10,660 productive interviews were carried out as part of the main Survey for Childcare and Early Years Providers (SCEYP). This included:
• 6,599 interviews with group-based providers (GBP);
o 3,922 private GBPs;
o 2,456 voluntary GBPs;
o 221 school/college/LA/other unclassified GBPs27;
• 2,309 interviews with school-based providers (SBP);
o 2,095 interviews with SBPs offering nursery provision;
o 214 interviews with maintained nursery schools (MNS);
• 1,752 interviews with childminders.
Table 12 shows the outcomes achieved for each provider type. Tables 13 to 15 show the response rates achieved for each provider type and variant. Table 16 shows the productive response rate by mode.
27 Although this third group is included in the group-based provider total, it is not reported on in the official statistics publication.

27
Table 12 Main SCEYP: Outcomes by provider type
n. Group-based providers
School-based providers Childminders Total
Issued sample 14,666 5,881 4,848 25,395 Productive 6,599 2,309 1,752 10,660
• Fully productive 6,163 1,964 1,617 9,744
• Partially productive28 436 345 135 916
Unavailable 793 211 205 1,209
Refused 1953 494 291 2,738
Non-contact 4,761 2,821 2,173 9,755
• Bad number 678 44 297 1,019
• Other non-contact 4,083 2,777 1,876 8,736
Other unproductive29
3 0 0 3
Ineligible 557 46 427 1,030
Table 13 Main SCEYP: Group-based provider response rates
Response rates Variant 1 Variant 2 Variant 3 Total
Achieved (n.) 1,103 2,883 2,613 6,599
Overall response rate30
49% 50% 45% 48%
Cooperation rate31 73% 73% 67% 71%
Contact rate 68% 68% 67% 67%
Refusal rate 14% 13% 15% 14%
Eligibility rate 95% 94% 95% 95%
28 Interviews on the main SCEYP survey were considered productive if the provider completed the questionnaire sections about attendance and capacity, funded hours and staff-to-child ratios. “Partially” productive interviews include those cases where the provider completed these sections but did not reach the end of the questionnaire – usually missing some of the topics allocated to “variants” of the questionnaire. 29 There were three cases that requested their data to be deleted during fieldwork. 30 Response rate was calculated by dividing the number of productive cases by the number of productive and unproductive cases, and assuming a certain eligibility rate for the unknown cases. Cases with unknown eligibility were those who were ‘non-contacts’ and ‘other unproductive’. 31 Cooperation rate was calculated by dividing the number of productive cases by the total number of known eligible providers in the sample.

28
Table 14 Main SCEYP: School-based provider response rates
Response rates Variant 1 Variant 2 Total
Achieved (n.) 1,216 1,093 2,309
Overall response rate 42% 38% 40%
Cooperation rate 78% 75% 77%
Contact rate 54% 50% 52%
Refusal rate 8% 9% 9%
Eligibility rate 99% 98% 98%
Table 15 Main SCEYP: Childminder response rates
Response rates Variant 1 Variant 2 Total
Achieved (n.) 924 828 1,752
Overall response rate 45% 41% 43%
Cooperation rate 80% 76% 78%
Contact rate 56% 54% 55%
Refusal rate 7% 8% 7%
Eligibility rate 85% 83% 84%
Table 16 Main SCEYP: Response mode (% of productive cases by telephone and web)
As illustrated in Tables 13 to 15, the response rates differed across the variants. In particular, providers who were allocated to the financial variants (school-based providers allocated to variant 2, group-based providers allocated to variant 3 and childminders allocated to variant 2) were less likely to take part. Overall, slightly more than half of the interviews were completed online (57%). This proportion was higher for childminders (63%) and SBPs (60%) than for GBPs (54%).
Response mode
Group-based providers
School-based providers Childminders Total
% n. % n. % n. % n.
Telephone 46 3,022 40 930 37 652 43 4,604
Web 54 3,577 60 1,379 63 1,100 57 6,056

29
5.2 Main SCEYP: Interview length Average telephone interview lengths and web interview lengths for the different provider types and variants are provided below in Tables 17 and 18. These are based on fully productive interviews that were completed within an hour on the same day; partials and any interviews longer than one hour were excluded from the analysis of interview lengths, as the timings for these outlier interviews are likely to be inaccurate. Table 17 Main SCEYP: Average telephone interview length by provider type and questionnaire variant
Provider type Variant Average interview length (minutes)
Group-based providers 1 20
2 21
3 26
School-based providers 1 27
2 26
Childminders 1 12
2 19 Table 18 Main SCEYP: Average web interview length by provider type and questionnaire variant
Provider type Variant Average interview length (minutes)
Group-based providers 1 23
2 26
3 29
School-based providers 1 30
2 28
Childminders 1 13
2 22
5.3 Short SCEYP: Response The total issued sample for the mainstage short SCEYP was 38,264: 10,053 GBPs, 3,211 SBPs, and 25,000 childminders.
In total, the survey achieved 10,729 completions. This included full and partially completed surveys from 2,720 GBPs, 1,410 from SBPs, and 6,599 from childminders. Table 19 displays the outcomes and response rates achieved for the whole sample, and by provider type. It was not possible to estimate eligibility rates given online and postal modes of data
30
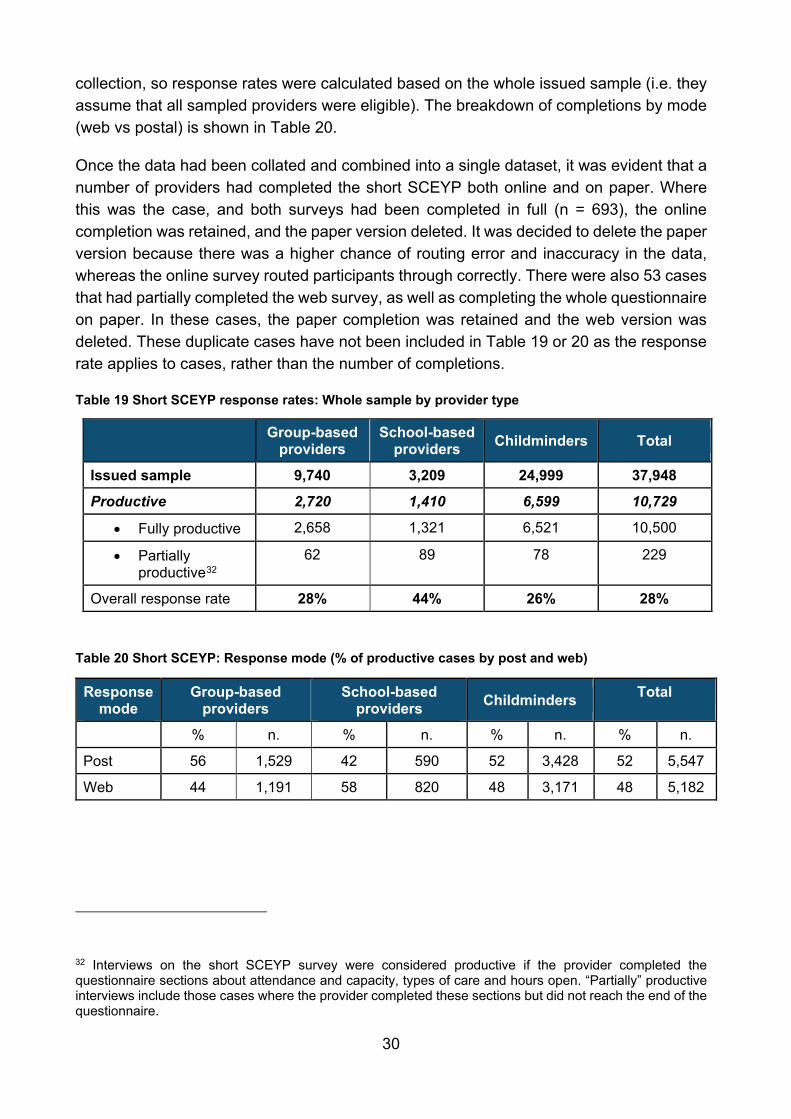
collection, so response rates were calculated based on the whole issued sample (i.e. they assume that all sampled providers were eligible). The breakdown of completions by mode (web vs postal) is shown in Table 20.
Once the data had been collated and combined into a single dataset, it was evident that a number of providers had completed the short SCEYP both online and on paper. Where this was the case, and both surveys had been completed in full (n = 693), the online completion was retained, and the paper version deleted. It was decided to delete the paper version because there was a higher chance of routing error and inaccuracy in the data, whereas the online survey routed participants through correctly. There were also 53 cases that had partially completed the web survey, as well as completing the whole questionnaire on paper. In these cases, the paper completion was retained and the web version was deleted. These duplicate cases have not been included in Table 19 or 20 as the response rate applies to cases, rather than the number of completions.
Table 19 Short SCEYP response rates: Whole sample by provider type
Group-based providers
School-based providers Childminders Total
Issued sample 9,740 3,209 24,999 37,948 Productive 2,720 1,410 6,599 10,729
• Fully productive 2,658 1,321 6,521 10,500
• Partially productive32
62 89 78 229
Overall response rate 28% 44% 26% 28%
Table 20 Short SCEYP: Response mode (% of productive cases by post and web)
32 Interviews on the short SCEYP survey were considered productive if the provider completed the questionnaire sections about attendance and capacity, types of care and hours open. “Partially” productive interviews include those cases where the provider completed these sections but did not reach the end of the questionnaire.
Response mode
Group-based providers
School-based providers Childminders Total
% n. % n. % n. % n.
Post 56 1,529 42 590 52 3,428 52 5,547
Web 44 1,191 58 820 48 3,171 48 5,182

31
5.4 Short SCEYP: Interview length The average web interview length for the different provider types are provided below in Table 21. These are based on fully productive interviews that were completed within an hour on the same day; partials and any interviews longer than one hour were excluded from the analysis of interview length, as the timings for these outlier interviews are likely to be inaccurate. As table 21 shows, the length of the short SCEYP ranged from six minutes on average for childminders to 10 minutes on average for SBPs.
Table 21 Short SCEYP: Average web interview length by provider type
Provider type Average interview length (minutes)
School-based providers 10
Group-based providers 9
Childminders 6

32
6. Data processing
6.1 Coding Neither the main nor the short Survey for Childcare and Early Years Providers (SCEYP) contained any open-ended questions. However, it did include a small number of questions which offered the respondent the option to choose “other” as their response code and to provide details. After the interview, the data from these questions was coded into the existing code frames (that were used in 2018 SCEYP) by trained coders at the National Centre for Social Research (NatCen). Queries arising from the coding process were examined by the research team to ensure that answers were coded correctly.
6.2 Main SCEYP: Data cleaning Numeric information collected as part of the main SCEYP, such as childcare fees or opening hours, was typed in by respondents themselves (online), keyed in by interviewers (telephone) or recorded on paper and keyed in by NatCen’s Data Unit (paper). It was possible for mis-keying to occur and on inspection, a small number of answers appeared either much too large or much too small or nonsensical given other survey answers. Therefore, it was decided to implement rules whereby certain values would be removed from the data. The following rules were applied:
• Where the reported number of the childminder’s own children booked for childminding provision on the reference day was higher than the total number of children booked for childminding provision, both the number of children booked and the number of own children booked was set to missing.
• Where the reported number of registered children aged either under two, two, or three/four years old was above 200 and was five times greater than the reported maximum number allowed to attend at any one time, the number of registered children of whichever age was recoded to missing.
• Where the reported number of places that were spare was the same as the total number of registered places, but the number of children booked was not zero, spare capacity was recoded to missing.
• Where the reported number of children booked to attend on the reference day was greater than 200 and greater than the reported maximum number allowed to attend, the number of children booked was set to missing (for school-based providers (SBP) and group-based providers (GBP) only).
• Where the reported start time of the reference day was given as “0”, this was recoded to missing. Where the duration of time on the reference day was equal to 0, and the end time given was before 8am, both were recoded to missing.

33
Only a small number of variables were affected and a small number of answers were removed. Table 22 summarises the topics and numbers of cases affected by these data cleaning protocols. Further detail about the protocols can be found in the user guides published alongside the SCEYP 2019 data, which will be available through the UK Data Archive.
Table 22 Topics and numbers of cases affected by data cleaning protocols
Information gathered Number of cases affected
Number of children booked to attend childminding provision on a given day 4
Registered number of pre-school age children 4
Spare capacity in provision on a given day 246
Number of children booked to attend full day care on a given day 1
Opening hours 71
6.3 Main SCEYP: Calculating hourly pay Respondents were asked a variety of questions in the staff loop section to help collect data on hourly pay. First, respondents were given the choice to provide an answer about pay for each member of staff for any period (i.e. hourly, daily, weekly, monthly and annually). Hourly pay was then calculated for each member of staff, based on their answer to how many hours they worked per week and what income period was given. If they could not provide an exact answer about pay they were asked to give a banded answer from the list presented to them.
When deriving the hourly pay variable, a small number of answers appeared either much too large or much too small. Accordingly, the following rules33 were applied:
• Where the reported rate of pay was zero, the derived variable was set to missing (as the analysis was interested in paid staff)
• Where the calculated rate of hourly pay was greater than zero but less than £2:
The derived variable was set to the reported level of pay if that value was less than £40 (on the assumption that the answer was given for hourly pay, and the wrong time period was selected);
The derived variable was set to missing if the reported level of pay for any period was greater than £40;
33 These rules were also applied in 2018.

34
• Where the calculated rate of hourly pay was more than £300, the derived variable was set to missing34.
Table 23 displays the rules and numbers of cases affected by these data cleaning protocols.
Table 23 Data cleaning protocols for deriving hourly pay and numbers of cases affected
Data cleaning protocol Number of cases affected
Where the reported rate of pay was zero, the derived variable was set to missing as the analysis was interested in paid staff. 290
Where hourly pay was calculated to be more than £0 but less than £2, and the reported level of pay for another time period was £40 or less, it was assumed that the value given was for hourly pay, and that the wrong time period had been selected in the questionnaire. The value for derived hourly pay was therefore replaced with the original value given for another period.
425
Where hourly pay calculated to be more than £0 but less than £2, and the reported level of pay for another time period was more than £40, it was not possible to estimate where the extremely low figure had originated from. In this case, derived hourly pay was set to missing.
54
Where the calculated rate of hourly pay was more than £300, the derived variable was set to missing as this figure was understood to be too high to be real.
63
In each of these cases, the original pay variables were left unedited. The transformations described above were only applied to the derived variable. This meant that the dataset retained original survey data for completeness and verification purposes.
34 The same cut off of £300 was used in 2019 as in 2018. The rationale for the £300 cut-off was to remove outliers which were having a substantial impact on the mean.

35
7. Weighting
7.1 Weighting the main SCEYP Weighting was used to ensure that the final achieved samples were representative of early years and childcare providers in England. Survey weights were designed separately for the three provider types35 to correct for unequal selection probabilities and non-response bias. Grossing weights were created in order to ensure that the weighted achieved samples gross up to the population of early years and childcare providers in England.
7.1.1 Main SCEYP: Weighting for group-based providers
Population totals
The achieved sample of group-based providers was weighted to be representative of all active group-based childcare providers (GBP) in England that were eligible for the study. However, the sampling frame did not allow for the exclusion of all ineligible institutions prior to sampling, therefore the eligible population size and profile were estimated using information about institutions found to be ineligible. It was decided that settings that were subsequently found to not provide any childcare (i.e. if they had shut down) would be treated as eligible for the estimation of eligible population totals. This was in line with the approach taken in the previous waves on the basis that establishments that had opened in the intervening period would not be included in the sample frame. This was done on the assumption that any that had opened would be roughly analogous to those that had closed. Similarly, establishments coded as “duplicates” were treated as eligible for population totals36. The total eligible population was estimated at 24,001 establishments – 97.9%37 of the sample frame.
35 Survey weights were designed for the three overall provider types (group-based, school-based and childminders). In the official statistics report, there are five provider types reported on separately. However, private and voluntary are sub-groups of the overall group-based provider type (and were sampled in the same way), and maintained nursery schools and school-based providers offering nursery provision are sub-groups of the overall school-based provider type (and were sampled in the same way). 36 As in 2018, settings were removed from either the group-based or the school-based sampling frame if they appeared on both. However, they were included in the population estimates for both. 37 Following data cleaning, 24,527 cases were included in the modelling of the eligible population.

36
Weighting process
Design weights
Design weights were first calculated to correct for unequal selection probabilities arising from the fact that establishments in the North East were oversampled to enable more robust comparisons between regions.
Calibration weighting
Calibration weighting was used to remove the (measurable) bias introduced through non-response to the main Survey of Childcare and Early Years Providers (SCEYP) and align the profile of the achieved sample to the profile of the eligible population defined by: region, register type, ownership type, and deprivation band based on Income Deprivation Affecting Children Index (IDACI).
Questionnaire variant weights
Questionnaire variant weights were calculated for the analysis of providers allocated to each of the three GBP variants of the questionnaire. The final overall weight served as a pre-weight for adjustments to the responding cases and their profiles were grossed up to the eligible population profile.
Day of the week weights
The selected sample was allocated systematically within each variant of the questionnaire to a specific day of the week (Monday to Friday), about which they were asked certain questions. However, providers were able to complete the survey about a different day. The questionnaire included questions ascertaining which days of the week each group was open. The profile and the overall population size for each day were estimated from the main SCEYP (weighted by overall interview weight). Subsamples of each day were then calibrated to the population profile.
Staff weights
In addition to calculating weights to make the sample representative of GBPs in England, weights for analysis of information on staff in such settings were also calculated. Staff weights were needed to account for the fact that settings employing more than a certain number of staff at one qualification level would only be asked to give information about one or two members of their team. The design weight was multiplied by the interview weights to obtain staff level weights for each case. Additional calibration was applied to ensure that the total number of staff and the staff profile (by level of education) was in line with the data collected about the number of staff working reported by the most senior manager.

37
7.1.2 Main SCEYP: Weighting for school-based providers
Population totals
To create a sampling frame of school-based providers the Schools’ Census database from January 2018 was used, enhanced with further information from a Get Information About Schools (GIAS) extract. During the interviews some institutions were found to be ineligible to take part in the survey: schools that had closed down and schools that did not offer nursery provision. As for group-based providers, and school-based providers in 2018, establishments coded as “duplicates” and those that had shut down were treated as eligible on the assumption that any school that had opened in the intervening period that would therefore not be included in the sampling frame, would be roughly analogous to those that had subsequently closed. The total eligible population was estimated at 9,051 – 98.9% of the initial sample frame38.
Weighting process
Design weights
Design weights were calculated to correct for disproportionate sampling of different types of schools.
Calibration weighting
Calibration weighting was used to remove the (measurable) bias introduced through non-response to the main SCEYP and align the profile of the achieved sample to the profile of the eligible population on the following variables: school type (main stratum), region, type of establishment, quintile of number of places registered.
Questionnaire variant weights
Questionnaire variant weights were calculated for the analysis of school-based providers allocated to each of the two variants of the questionnaire. The responding cases and their profiles were grossed-up to the eligible population profile.
Day of the week weights
As with GBPs, although respondents were allocated a random day of the week (Monday – Friday) to answer certain questions about, they were able to complete the survey about a different day. As in 2018, an assumption was made that all schools were open every
38 Following data cleaning, 9,150 cases were included in the modelling of the eligible population.

38
weekday and the sample of schools which answered about each day of the week was weighted to the overall profile of the eligible population.
Staff weights
Weights were also prepared for analysis of information on staff in nursery provision. To reduce both the burden on providers and the overall length of interview, settings allocated to variant 1 questionnaire employing more than a certain number of staff at a qualification level were asked to select one member of staff from their nursery provision.
Information on the number of staff in the nursery at each qualification level was collected and design weights were calculated. The design weights were multiplied by the respective interview weights to obtain staff level weights for each case. Additional calibration was applied to ensure that the total number of staff and the staff profiles (by level of education) were in line with the data collected about the number of nursery staff working and reported by the early years coordinator/head teacher.
7.1.3 Main SCEYP: Weighting for childminders
Population totals
The childminders’ data was weighted to be representative of the eligible population of childminders in England as of July 2018. At the mainstage some cases were found to be ineligible in that they were no longer offering provision. As in the previous waves, it was decided not to redefine the population and to assume that the population was stable in its characteristics. As in 2018, providers with zero registered places were included on the assumption that at the time of the interview, information about the number of registered places might have already been outdated. It was decided, as in 2018, that cases who reported zero registered places during the interview would be re-coded as ineligible, and responding childminders would be weighted to the profile of population excluding cases with zero registered places in the sample frame. The total eligible population was 39,367.
Weighting process
Design weights
Design weights were first calculated to correct for unequal selection probabilities arising from the oversampling of smaller regions.
Calibration weights
Calibration weighting was used to remove measurable bias introduced through non-response to the main SCEYP and to align the profile of achieved sample to the profile of the population. The population targets used for calibration weighting included: region,

39
whether on all three registers (Early Years Register, Compulsory Childcare Register and Voluntary Childcare Register), registration year, and deprivation band based on IDACI.
Questionnaire variant weights
Questionnaire variant weights were calculated for the analysis of childminders allocated to each of the two childminder variants of the questionnaire. The responding cases and their profiles were grossed-up to the eligible population profile.
Day of the week weights
The selected sample was allocated systematically within each variant of the questionnaire to a specific day of the week (Monday to Friday) about which they were asked certain questions. The questionnaire included questions ascertaining which days of the week each group was open – these were recoded into binary variables for each day of the week and the profile as well as the overall population size for each day were estimated from the main SCEYP (weighted by overall interview weight). Subsamples of each day were then calibrated to population estimates.
Staff weights
Respondents that answered questionnaire Variant 1 were asked several follow up questions about the assistants they employ. There were up to two loops in the questionnaire for assistants, so for respondents with more than two assistants design weighting was required to compensate for this. The final staff level weight was re-scaled so that the total weighted number of assistants was in line with an estimate of the total number of assistants.
7.2 Weighting the short SCEYP Data from the short SCEYP was combined with data from the financial variant of the main SCEYP where variables were available in both, i.e. the fees and funding questions.
The weighting strategy was designed to create a weight to be used in analysis of the combined dataset comprising data from the short SCEYP and the financial variants of the main SCEYP. Three separate weights were created for SBPs, GBPs and childminders as set out below.
The weighting strategy was the same for all provider types taking part in the short SCEYP or the financial variant of the main SCEYP. Data from the two surveys were combined for use in financial analysis, and calibrated to the same variables and population totals as used for the main SCEYP.
A combined weight was also created for analysis of all groups together. Combined weights for SBPs, GBPs and childminders were scaled so that the weighted profile by provider type

40
was aligned with the percentage distribution of provider types in the population (modelled estimates). Additionally, the weighted total base size was equal to the unweighted total base size (it was not necessary to use grossing-up for the financial weights).

41
Appendix – Survey materials
A. Main SCEYP: Survey invitation letter
A.1 School-based providers

42

43
A.2 Group-based providers

44

45
A.3 Childminders

46

47
B. Main SCEYP: Preparation sheet
B.1 School-based providers, Variant 1

48

49
B.2 School-based providers, Variant 2

50

51
52
B.3 Group-based providers, Variant 1

53

54
B.4 Group-based providers, Variant 2

55

56
B.5 Group-based providers, Variant 3

57
58
B.6 Childminders, Variant 1

59

60
B.7 Childminders, Variant 2

61

62
C. Main SCEYP: Qualifications sheet

63
Big image of text

64
D. Short SCEYP: Survey invitation letter
D.1 School-based providers

65

66
D.2 Group-based providers

67

68
D.3 Childminders

69

70
© Crown copyright 2019
This publication (not including logos) is licensed under the terms of the Open Government Licence v3.0 except where otherwise stated. Where we have identified any third party copyright information you will need to obtain permission from the copyright holders concerned.
To view this licence: visit www.nationalarchives.gov.uk/doc/open-government-licence/version/3 email [email protected] write to Information Policy Team, The National Archives, Kew, London, TW9 4DU
Reference: Survey of Childcare and Early Years Providers 2019
Follow us on Twitter: @educationgovuk
Like us on Facebook: facebook.com/educationgovuk