SCHOOL OF HEALTH RELATED PROFESSIONS STRATEGIC PLAN 2003 DRAFT.

OFFICE OF INSPECTOR GENERAL
Catalyst for Improving the Environment
Evaluation Report
Survey of Air Quality InformationRelated to the World TradeCenter Collapse
Report No. 2003-P-00014
September 26, 2003

Report Contributors: Sarah FabirkiewiczJim HatfieldChris DunlapDarryl Weatherhead Rick BeusseElizabeth Grossman
Abbreviations
EPA Environmental Protection AgencyHEPA High Efficiency Particulate AirNYC New York CityOIG Office of Inspector GeneralOMB Office of Management and BudgetWTC World Trade Center
Cover Photo: Image from French SPOT satellite, which shows the plume from the WorldTrade Center site in Lower Manhattan blowing over Brooklyn. Source: imageobtained from NASA web site - http://l7fot.gsfc.nasa.gov/NYC.html
UNITED STATES ENVIRONMENTAL PROTECTION AGENCY
WASHINGTON, D.C. 20460
THE INSPECTOR GENERAL
September 26, 2003
MEMORANDUM
SUBJECT: Survey of Air Quality Information Related to the World Trade Center CollapseReport No. 2003-P-00014
TO: Marianne L. Horinko Acting Administrator
This memorandum transmits the results of an Office of Inspector General (OIG) survey thatgauged the public’s perception of air quality information received after the collapse of theWorld Trade Center (WTC) towers. Data from this survey supplement our earlier report,EPA’s Response to the World Trade Center Collapse: Challenges, Successes, and Areas forImprovement (Report No. 2003-P-00012), dated August 21, 2003.
EPA communicated air quality information to the public through press releases, interviews withprint and television journalists, appearances at public forums, and posting of extensive data onthe Agency’s public web site. Concerns were raised, however, about governmentcommunications in the aftermath of the WTC disaster and the impact these communications hadon the actions taken by the public and responders to reduce their exposure to WTC contaminants. More than a year after the WTC disaster, a city-wide study had not been undertaken to gauge theeffectiveness of the crisis communication efforts following September 11, 2001. To that end, theOIG conducted a survey of New York City (NYC) residents on a variety of issues related to airquality. Based on the survey’s response rate of 11.8 percent, the data presented in this reportrepresent the responses from 1,110 survey respondents, and should not be generalized to thepopulation of NYC.
Summary of Results
Overall, the majority of respondents wanted more information regarding outdoor and indoor airquality, wanted this information in a more timely manner, and did not believe the informationthey received.
The survey results also suggest a disconnect between government statements about air qualityand respondents’ perceptions of possible health risks from breathing the air in Lower Manhattan. The majority of respondents reported that they thought breathing outdoor and indoor air in Lower

Manhattan in the weeks following the WTC collapse could expose them to short- and long-termhealth effects.
Further, data indicated that contamination from the collapse of the WTC towers spread into thehomes of respondents located beyond the perimeter of the zone designated as eligible for theEPA-led testing and cleaning program.
Our data indicated only about 1 out of 10 respondents knew about EPA’s “Response toSeptember 11” web site, and even fewer visited the site. The majority of respondents, however,were aware of key WTC-related information, such as EPA’s recommendation to havecontaminated homes professionally cleaned and the EPA-led testing and cleaning program ineligible areas of Manhattan. Despite this awareness, relatively few respondents with homecontamination had their homes tested for asbestos or professionally cleaned.
Actions Already Being Taken
EPA has initiated several actions to improve its risk communications in the aftermath of theWTC collapse. Also, our prior report included many recommendations for improving riskcommunications that the Agency has agreed to implement. As such, we have not madeadditional recommendations in this report based on the survey. We appreciate the efforts of EPA officials and staff in working with us to develop this survey. If you or your staff have any questions regarding this report, please contact me at (202) 566-0847or Kwai Chan, Assistant Inspector General for Program Evaluation, at (202) 566-0827.
Nikki L. Tinsley
Attachment
cc:Thomas J. Gibson, Chief of Staff, Office of the Administrator Jane M. Kenny, Regional Administrator, EPA Region 2Barry N. Breen, Principal Deputy Assistant Administrator, Office of Solid Waste and
Emergency ResponseJeffrey R. Holmstead, Assistant Administrator for Air and RadiationJ. Paul Gilman, Ph.D., Assistant Administrator for Research and Development Kimberly Terese Nelson, Assistant Administrator for Environmental InformationLisa B. Harrison, Acting Associate Administrator, Office of Public AffairsKathleen Callahan, Assistant Regional Administrator for New York City Response and
Recovery OperationsMary U. Kruger, Director, EPA Office of Homeland Security
ii

Table of Contents
Introduction . . . . . . . . . . . . . . . . . . . . . . . . . . . . . . . . . . . . . . . . . . . . . . . . . . . . . . 1
Purpose . . . . . . . . . . . . . . . . . . . . . . . . . . . . . . . . . . . . . . . . . . . . . . . . . . . . . . . . . . 1 Background . . . . . . . . . . . . . . . . . . . . . . . . . . . . . . . . . . . . . . . . . . . . . . . . . . . . . . . . 1 Scope and Methodology . . . . . . . . . . . . . . . . . . . . . . . . . . . . . . . . . . . . . . . . . . . . . . 2 Survey Response Rate . . . . . . . . . . . . . . . . . . . . . . . . . . . . . . . . . . . . . . . . . . . . . . . 3
Survey Results . . . . . . . . . . . . . . . . . . . . . . . . . . . . . . . . . . . . . . . . . . . . . . . . . . . . 7
Section 1: Respondents’ Satisfaction With Information . . . . . . . . . . . . . . . . . . . . . . 7 Section 2: Respondents’ Perceptions of Air Quality . . . . . . . . . . . . . . . . . . . . . . . . 9 Section 3: Awareness of WTC-Related Information and Actions Taken by Respondents . . . . . . . . . . . . . . . . . . . . . . . . . . . . . . . . . . . . . 11 Limitations of Survey Results . . . . . . . . . . . . . . . . . . . . . . . . . . . . . . . . . . . . . . . . . . . 17
Observations . . . . . . . . . . . . . . . . . . . . . . . . . . . . . . . . . . . . . . . . . . . . . . . . . . . . . 19
Appendices . . . . . . . . . . . . . . . . . . . . . . . . . . . . . . . . . . . . . . . . . . . . . . . . . . . . . . . 21
A Survey Cover Letter . . . . . . . . . . . . . . . . . . . . . . . . . . . . . . . . . . . . . . . . . . . . 21 B Survey of Air Quality Issues After September 11, 2001 . . . . . . . . . . . . . . . . . 23 C Sample Details . . . . . . . . . . . . . . . . . . . . . . . . . . . . . . . . . . . . . . . . . . . . . . 25 D Distribution . . . . . . . . . . . . . . . . . . . . . . . . . . . . . . . . . . . . . . . . . . . . . . . . . 27
iii


1 From October 25 through November 1, 2001, the NYC Department of Health conducted a door-to-door survey ofresidents in Lower Manhattan’s Battery Park City, Southbridge Towers, and Independence Plaza. “A CommunityNeeds Assessment of Lower Manhattan Following the World Trade Center Attack,” December 2001.
1
Introduction
Purpose
This survey was undertaken in order to obtain information to satisfy objective 4 of our priorWorld Trade Center (WTC) report (No. 2003-P-00012). Objective 4 sought to measure theextent to which government communications regarding air quality and associated health riskswere:
C Rated satisfactory by the public;C Understood and interpreted by the public; andC Effective in getting people to take desired precautions or actions.
After the September 11, 2001, terrorist attacks on the WTC towers, government communicationswere criticized for not providing timely and accurate air quality information to the public. Inpreparing the prior report, the Office of Inspector General (OIG) found that, as of September2002, a year after the disaster, no city-wide study of the effectiveness of governmentcommunications had been undertaken.1 As such, the OIG conducted a survey of residents in allfive boroughs of New York City (NYC) to address the above objective.
Background
A critical component in helping the public to minimize its exposure to potential health hazardsresulting from a terrorist attack or other disaster involves effectively communicating riskinformation. Armed with such information, the public can take positive steps to mitigatepotential exposures as well as take other precautions to avoid unnecessary health risks.
Following the collapse of the WTC towers, EPA announced its intention to keep the public andrescue workers informed about safety and health risks related to air quality. The Agency’s firstWTC-related press release, on September 13, 2001, noted that EPA:
. . . will work with the appropriate officials to ensure that rescue workers,cleanup crews and the general public are properly informed about appropriatesteps that should be taken to ensure proper handling, transportation anddisposal of potentially contaminated debris or materials.
EPA communicated air quality information to the public through press releases, appearances atpublic forums, media interviews, and its public web site. In the days and months following the

2 The earliest instance we could locate was on October 26, 2001, when the EPA Administrator recommendedprofessional cleaning in a televised interview on MSNBC.
2
attacks, EPA’s overriding message was that the public did not need to be concerned aboutairborne contaminants. This reassurance appeared to apply to both indoor and outdoor air. EPA’s press releases generally did not discuss potential adverse short-term health effects or thepotential risks to sensitive populations, although Agency spokespersons orally discussed theseissues.
With respect to actions people should take to minimize their exposure to health risks, EPA’spress releases advised residents and business owners that they could clean their own spaces ifthey used “appropriate” vacuum filters and followed “recommended” and “proper” procedures,but the releases did not define these terms. However, Agency spokespersons, including EPA’sAdministrator, recommended in televised interviews2 and other public forums that residentsshould obtain professional cleaning (by professional asbestos contractors) of indoor spaces whendust reached certain levels.
Scope and Methodology
To obtain information directly from the public about the impact of government communicationsregarding air quality concerns following the WTC towers’ collapse, the OIG developed andmailed out a Survey of Air Quality Issues After September 11, 2001 (see Appendices A and B). In accordance with the Paperwork Reduction Act, the OIG obtained approval from the Office ofManagement and Budget (OMB) and solicited public comment regarding the survey through theFederal Register. In addition, former Administrator Christine Todd Whitman reviewed the draftsurvey questionnaire. Based on her input we included questions about the public’s knowledge ofEPA’s WTC response web site. The survey was pre-tested with selected citizens of NYC priorto its delivery.
The survey requested information from respondents in four areas:
• Section 1: Satisfaction with outdoor and indoor air quality information received. Respondents were asked to rate their satisfaction on a scale of “1” (Not at All Satisfied) to“5” (Completely Satisfied).
• Section 2: Understanding and interpretation of air quality information received. Questionsasked respondents -- in terms of how it was affected by the collapse of the WTC towers --their perception of air quality in Lower Manhattan in the weeks just after September 11, 2001and at the time they took the survey in 2003.
• Section 3: Awareness of WTC-related information and actions taken in response to thecollapse. This section asked respondents if they had taken various actions and/or precautionsin response to the dust/debris and if they were aware of certain WTC-related information.

3 Response rate was calculated by dividing the number of surveys OIG received by the number of surveys delivered. Out of10,000 addresses, 191 were deemed insufficient and/or undeliverable by the U.S. Postal Service and did not get delivered. Thus, the response rate = 1,161 / 9,809, or 11.8 percent.
3
• Section 4: Demographic information. Voluntary demographic information was requested todetect, assess, and adjust for non-response bias within the sample, and to cross-tabulatevariances within sub-populations of interest.
Appendix C provides a detailed description of how we obtained our sample. We began sendingout the surveys on March 27, 2003, and accepted responses until July 31. We completed ouranalysis of the survey responses on September 4, 2003.
Our earlier report, EPA’s Response to the World Trade Center Collapse: Challenges, Successes,and Areas for Improvement (Report No. 2003-P-00012), dated August 21, 2003, included manyrecommendations for improving risk communications that the Agency has agreed to implement. As such, this report on the survey is not making any additional recommendations.
Our review was conducted in accordance with Government Auditing Standards, issued by theComptroller General of the United States.
Survey Response RateThis report is based on surveys received from 1,110 respondents who reported living in NYC asof September 11, 2001. We actually received 1,161 responses, for an overall response rate of11.8 percent.3 However, the data analyzed and referred to throughout this report excludes 51 ofthe 1,161 surveys received because they contained either no zip code or a zip code from outsideof NYC. Based on the response rate and a lack of information regarding certain characteristics ofnon-respondents, we determined that, for purposes of this report, results from the data presentedwould be limited only to the pool of survey respondents who reported living in NYC as ofSeptember 11, 2001, and we did not draw any inferences about the overall population of the fiveboroughs of NYC.
Figure 1 depicts the distribution of respondents across NYC based on where respondents reportedliving as of September 11, 2001. For purposes of drawing a sample for the survey and to be ableto analyze data by zip code, OIG defined Lower Manhattan as the area south of Broome and E.Houston Streets.

4
53.8%
61.1%
46.2%38.9%
79.4%73.6%
20.6%26.4%
62.9%
95.1%
23.8%
53.1%
29.2%
13.7%
0%
10%
20%
30%
40%
50%
60%
70%
80%
90%
100%
Female Male Age18-59 Age 60+ H.S. Diplomaor Higher
Bachelor'sDegree or
Higher
English NotPrimary
NYC Population All Respondents
Figure 1: Distribution of Respondents by Where They Lived on September 11, 2001*
* Respondents were asked their five-digit zip code as of September 11, 2001, and thenumber of responses by borough is based on the respondent’s address at that time. Anadditional 51 surveys contained either no zip code or a zip code from outside of NYC.
Figure 2 shows how the survey respondents compare to the population of NYC in terms ofselected demographic characteristics, including sex, age, education level, and language.
Figure 2: Demographic Characteristics of OIG Survey Respondents Compared toCharacteristics of NYC Population*
* Source: 2000 Census

5
Figure 2 indicates that based on the 2000 Census, females are over represented amongrespondents (61.1 percent versus 53.8 percent in the NYC population). In terms of age, therespondents are somewhat older than the actual population of NYC, with under representation of18-59 year-olds and over representation of people aged 60 years or more. Overall, respondentshave a much higher level of education than the NYC population, with 95.1 percent having atleast a high school diploma compared to 62.9 percent in the actual population; and with53.1 percent having a bachelor’s degree or higher compared to 23.8 percent in the actualpopulation. People who do not speak English as their primary language are under represented among respondents at 13.7 percent compared to 29.2 percent in the population.

6

7
Majority of respondents not satisfied withinformation on air quality
Survey Results
The majority of survey respondents indicated they were not satisfied with information theyreceived regarding outdoor and indoor air quality. Despite reassuring statements by EPA that theair was “safe” to breathe, the majority of respondents thought breathing the outdoor and indoorair in Lower Manhattan could expose them to short- and long-term health risks. Most reports ofhome contamination came from respondents from Manhattan and Brooklyn. The majority ofrespondents knew that contaminated homes should be professionally cleaned, but few had theirresidence tested for asbestos and few who reported home contamination in Manhattan andBrooklyn had their home professionally cleaned. Furthermore, few respondents knew about orvisited EPA’s “Response to September 11” web site. Details follow.
Section 1: Respondents’ Satisfaction With Information
Section 1 of the survey asked respondents torate their satisfaction with variouscharacteristics of the information theyreceived about outdoor and indoor air qualityby circling a number on a scale of 1 to 5, with“1” equaling Not at All Satisfied and “5” equaling Completely Satisfied. In our analysis, ratingsof “1” and “2” were considered dissatisfied, while ratings of “4” and “5” were consideredsatisfied. The scale’s midpoint is 3.0. Table 1 displays satisfaction ratings from all respondents.
Table 1: Respondents’ Satisfaction With Information Received About Outdoorand Indoor Air Quality in the Weeks Just After Collapse of WTC Towers
Scale:1 = Not At All Satisfied 5 = Completely Satisfied
1 to 2 (%)
3 (%)
4 to 5 (%)
MeanRating
Total(no.)
Out
door
Amount 59.4 24.0 16.7 2.3 1,051
Understandability 47.7 25.9 26.3 2.6 1,018
Timeliness 57.1 23.3 19.6 2.4 1,009
Believability 61.2 19.8 19.0 2.3 1,011
Overall 57.3 24.5 18.2 2.3 1,019
Indo
or
Amount 66.1 20.1 13.8 2.1 1,029
Understandability 52.4 25.1 22.6 2.5 978
Timeliness 62.3 21.4 16.3 2.2 974
Believability 63.0 19.4 17.6 2.2 974
Overall 63.5 21.3 15.2 2.2 986

8
Table 1 indicates that more than half of all respondents were dissatisfied with the amount,timeliness and believability of the information they received in the weeks just after September11, 2001. Approximately 6 out of every 10 respondents gave a dissatisfactory overall rating forthe information they received. Respondents’ ratings of the understandability of the informationthey received for outdoor air quality was slightly higher, but the average rating of 2.6 was stillbelow the scale midpoint of 3.0.
Respondents were also asked to rate their satisfaction with health-related information theyreceived in the weeks following the collapse. Satisfaction ratings were calculated for allrespondents as well as for those respondents who reported working within the perimeter ofGround Zero between September 11, 2001, and December 31, 2001, and for those respondentswho reported living in Lower Manhattan as of September 11, 2001. Table 2 depicts how allrespondents, Ground Zero workers, and respondents from Lower Manhattan rated the health-related information they received.
Table 2: Satisfaction With Information Received About Health Risks in Weeks After theCollapse of WTC Towers for All Respondents, Ground Zero Workers, and Residents ofLower Manhattan
Scale: 1 = Not At All Satisfied 5 = Completely Satisfied
1 or 2(%)
3(%)
4 or 5(%)
MeanRating
Total(no.)
Explanation of possiblehealth threats related toair quality
All Respondents 64.3 17.5 18.3 2.2 1,013
Ground Zero Workers 71.3 14.4 14.4 2.0 188
Lower Manhattan 68.0 15.5 16.5 2.1 194
Explanation of how tominimize exposure topotential health risksrelated to air quality
All Respondents 65.3 17.0 17.7 2.2 1,018
Ground Zero Workers 71.0 17.2 11.8 2.0 186
Lower Manhattan 69.1 13.1 17.8 2.1 191
Explanation of healthproblems one mayexperience due to airquality
All Respondents 65.0 18.1 17.0 2.2 1,014
Ground Zero Workers 70.6 16.0 13.4 2.0 187
Lower Manhattan 69.1 16.0 15.0 2.0 194
Explanation of what todo if one experienced ahealth problem relatedto air quality
All Respondents 64.6 18.2 17.2 2.2 1,010
Ground Zero Workers 68.7 17.3 14.1 2.0 185
Lower Manhattan 69.3 14.6 16.2 2.1 192
Overall rating ofinformation receivedabout health risksrelated to air quality
All Respondents 64.0 19.9 16.2 2.2 1,027
Ground Zero Workers 72.3 16.2 11.5 1.9 191
Lower Manhattan 71.4 14.6 14.1 2.1 192

9
Majority of respondents thoughtbreathing outdoor and indoor air inLower Manhattan in weeks after collapseof WTC towers could expose them toshort- and long-term risks
21.8%
65.4%
38.1%
9.0%
41.6%
7.9%
74.7%
18.1%
69.2%
26.9%
88.8%
43.8%
6.6%
26.7%
14.1%
31.5%
11.2%
4.5%
0% 20% 40% 60% 80% 100%
Present
9/11/01
Present
9/11/01
Present
9/11/01
Nee
dpr
otec
tive
gear
for
brea
thin
gLo
ng T
erm
heal
th ri
sks
Sho
rt Te
rmhe
alth
risk
s
Not Sure No Yes
More than 6 out of every 10 respondents reported dissatisfaction with (a) explanations ofpossible health threats related to air quality; (b) how to minimize their exposure to health risksrelated to air quality; (c) health problems they might experience due to air quality; and (d) whatto do if they experienced a health problem related to air quality. The mean rating among all respondents for overall satisfaction with health-related information received in the weeksfollowing the collapse was 2.2.
Among Ground Zero workers and those living in Lower Manhattan during September 2001 whoresponded, more than 7 out of 10 were dissatisfied with the overall quality of health-relatedinformation they received. For both of these groups, over two-thirds reported dissatisfaction withexplanations across all categories of health-related information, resulting in a mean rating foroverall satisfaction of 1.9 among Ground Zero workers and 2.1 for residents of LowerManhattan.
Section 2: Respondents’ Perceptions of Air Quality Section 2 of the survey asked residents theirthoughts about the health risks associated with airquality in Lower Manhattan in the weeksimmediately following the collapse of the WTC, aswell as their thoughts at the time they completedthe survey approximately 18 months later.
Figures 3a and 3b illustrate respondents’ perceptions of outdoor and indoor air quality,respectively, in terms of how it was affected by the collapse of the WTC towers in the weeks justafter the collapse (shown in the figure as “9/11/01”) and at the time they completed the survey inMay-July 2003 (shown as “Present”).
Figure 3a: Respondents’ Perceptions of Exposure to Health Risks Associated with OutdoorAir Quality in Lower Manhattan in Weeks After Collapse and at Time of 2003 Survey
10
43.2%
26.5%
66.8%
40.4%
15.9%
43.9%
6.5%
51.8%
16.4%
57.6%
22.0%
76.2%
22.0%
34.1%
14.0%
26.7%
26.2%
9.8%
0% 20% 40% 60% 80% 100%
Present
09/11/01
Present
09/11/01
Present
09/11/01N
eed
prot
ectiv
ege
ar fo
rbr
eath
ing
Long
Ter
mhe
alth
risk
sS
hort
Term
heal
th ri
sks
Not Sure No Yes
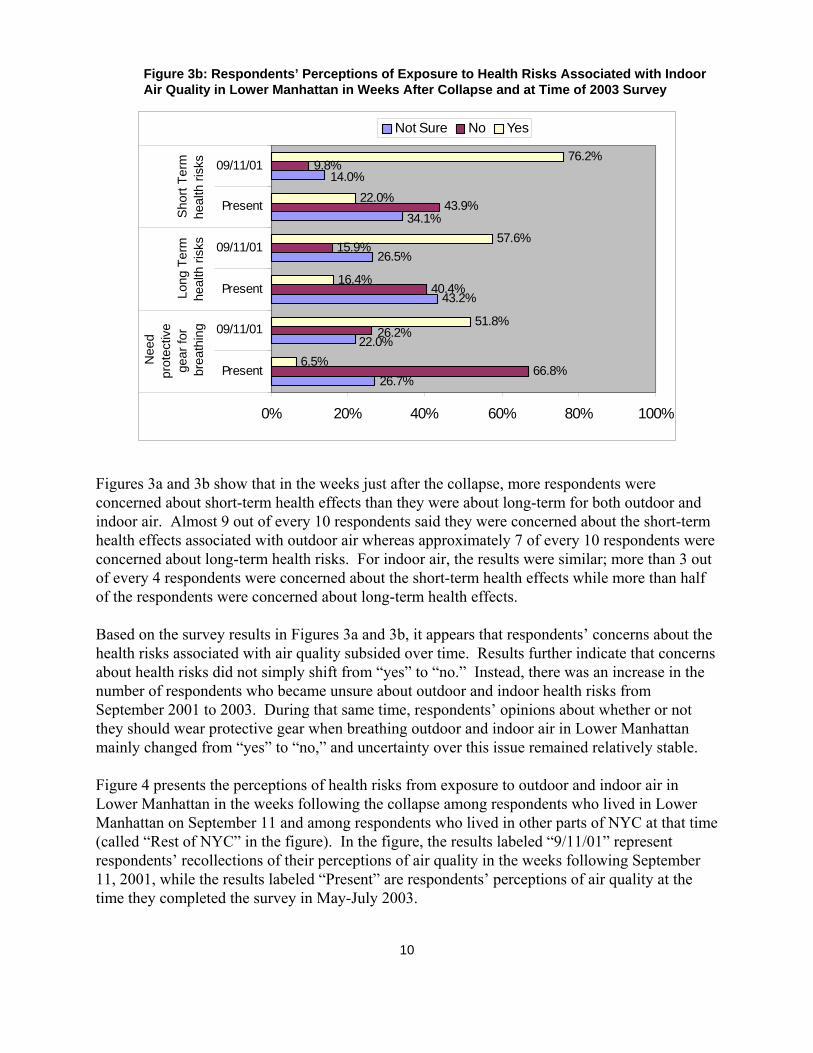
Figure 3b: Respondents’ Perceptions of Exposure to Health Risks Associated with IndoorAir Quality in Lower Manhattan in Weeks After Collapse and at Time of 2003 Survey
Figures 3a and 3b show that in the weeks just after the collapse, more respondents were concerned about short-term health effects than they were about long-term for both outdoor andindoor air. Almost 9 out of every 10 respondents said they were concerned about the short-termhealth effects associated with outdoor air whereas approximately 7 of every 10 respondents wereconcerned about long-term health risks. For indoor air, the results were similar; more than 3 outof every 4 respondents were concerned about the short-term health effects while more than halfof the respondents were concerned about long-term health effects. Based on the survey results in Figures 3a and 3b, it appears that respondents’ concerns about thehealth risks associated with air quality subsided over time. Results further indicate that concernsabout health risks did not simply shift from “yes” to “no.” Instead, there was an increase in thenumber of respondents who became unsure about outdoor and indoor health risks fromSeptember 2001 to 2003. During that same time, respondents’ opinions about whether or notthey should wear protective gear when breathing outdoor and indoor air in Lower Manhattanmainly changed from “yes” to “no,” and uncertainty over this issue remained relatively stable.
Figure 4 presents the perceptions of health risks from exposure to outdoor and indoor air inLower Manhattan in the weeks following the collapse among respondents who lived in LowerManhattan on September 11 and among respondents who lived in other parts of NYC at that time(called “Rest of NYC” in the figure). In the figure, the results labeled “9/11/01” representrespondents’ recollections of their perceptions of air quality in the weeks following September11, 2001, while the results labeled “Present” are respondents’ perceptions of air quality at thetime they completed the survey in May-July 2003.

11
18.2%
24.6%
78.5%
68.0%
29.0%
88.4%88.9%
26.4%
75.6%
17.0%
58.6%
21.3%
69.5%17.4%
53.3%
13.6%
0% 20% 40% 60% 80% 100%
Present
9/11/01
Present
9/11/01
Present
9/11/01
Present
9/11/01Lo
ng T
erm
heal
th ri
sks
Sho
rt Te
rmhe
alth
risk
sLo
ng T
erm
heal
th ri
sks
Sho
rt Te
rmhe
alth
risk
s
Indo
orO
utdo
orRest of NYC Lower Manhattan
Most reports of home contamination camefrom respondents in Lower Manhattan, therest of Manhattan, and Brooklyn; EPA website not widely used; and homes oftencleaned without professional assistance
Figure 4: Proportion of Respondents Perceiving Health Risks Associated with Outdoor andIndoor Air Quality in Lower Manhattan in Weeks Just After Collapse of WTC Towers and atTime of Survey in 2003 -- Lower Manhattan Residents and the Rest of NYC
Section 3: Awareness of WTC-Related Information and Actions Takenby Respondents Section 3 of the survey asked respondents iftheir homes had been contaminated with dustand/or debris due to the collapse of the WTCtowers. This section also asked respondentswhether they knew about certain WTC-relatedinformation and whether they had takencertain actions in response to the dust anddebris created by the collapse of the WTCtowers. Respondents were asked about some specific EPA communications, such as whetherthey: (a) knew about EPA’s “Response to September 11” web site, (b) visited the web site,(c) knew that homes contaminated with dust and/or debris should be professionally cleaned, (d)knew about the EPA-led program to test and clean eligible residences in Lower Manhattan, and(e) had their residence professionally cleaned.
Data indicate that contamination from the collapse of the WTC towers spread into the homes ofrespondents located beyond the zone designated as eligible for the EPA-led testing and cleaningprogram. The Indoor Residential Cleaning Program was available to residences located southand west of Canal, Allen, and Pike streets, river to river. Specifically:
• Of the 180 residents of Lower Manhattan who responded, 46.7 percent (84 respondents)reported that their residence had been contaminated with dust and/or debris due to thecollapse.

4 The number of “yes” responses from the three remaining areas was as follows: Bronx - 1 out of 58 (1.7 percent); Queens -5 out of 131 (3.82 percent); and Staten Island - 2 out of 44 (4.55 percent)
12
• Of the 204 residents of Brooklyn who responded, 23.5 percent (48 respondents) reported thattheir residence had been contaminated with dust and/or debris due to the collapse.
• Of the 213 respondents who lived in the rest of Manhattan, 11.3 percent (24 respondents)reported that their residence had been contaminated with dust and/or debris due to thecollapse.4
Figures 5a and 5b show that, among respondents, the most incidents of contamination werereported by those in Lower Manhattan, followed by Brooklyn and the rest of Manhattan. In thefigure below, the zip code appears on the first line of each box inset. On the second line, thenumber of respondents answering “Yes” to contamination is followed by the number of totalrespondents from the zip code.
Figure 5a: Reports of Contamination from Zip Codes in Manhattan*
Source: Created using ESRI by the University Neighborhood Housing Program, www.unhp.org
*Contamination was also reported in two Manhattan zip codes north of the area shown on this map (2 out of 22 respondents from zip code 10025, and 1 out of 9 respondents from zip code 10027). With the exception of zip code 10005, the map only shows results for those zip codes in Lower Manhattan where at least one respondent reported contamination. Ground Zero is located within zip code 10280 in the map above.

13
Figure 5b: Reports of Contamination From Zip Codes in Brooklyn*
Source: Created using ESRI by the University Neighborhood Housing Program, www.unph.org
* For each zip code, the respondent’s zip code is the five-digit number; the number of respondentsanswering “Yes” to contamination is followed by the number of total respondents from the zip code. The map only shows results for those zip codes in Brooklyn where at least one respondent reportedcontamination.

14
Few Respondents Knew About or Visited EPA’s “Response to September 11”Web SiteAccording to EPA officials, one of the primary means of communicating WTC air quality-relatedinformation to the public after September 11 was through EPA’s “Response to September 11”web site. Figure 6 illustrates respondents’ awareness and use of the web site among allrespondents, respondents from Lower Manhattan, Brooklyn, and the rest of Manhattan.
Figure 6: Proportion of Respondents Aware of EPA’s Web Site - - All Respondents and Respondents From Lower Manhattan, Brooklyn, and Rest of Manhattan
10.5%20.4%
9.3% 9.8% 6.0%14.5%
5.3% 4.7%
0%
20%
40%
60%
80%
100%
Knew of Web Site Visited Web Site
All Respondents Lower Manhattan Brooklyn Rest of Manhattan
Data in Figure 6 indicate that approximately 1 out of 10 of all respondents and respondents fromBrooklyn and the rest of Manhattan knew about EPA’s web site, but fewer visited the site. Among respondents from Lower Manhattan, approximately 2 out of 10 respondents knew of theweb site and about 70 percent of those who knew of the web site visited it.
Figure 7 indicates that, among all respondents, approximately 6 out of 10 heard the message inthe weeks just after the collapse that homes contaminated with dust and/or debris should beprofessionally cleaned for asbestos. More than half (58 percent) knew that some residents ofLower Manhattan were eligible to have EPA test and clean their homes. About 6 out of every100 respondents had their residence tested for asbestos. Among respondents from LowerManhattan, approximately 20 out of every 100 had their residence tested. Among respondentsfrom the rest of Manhattan and Brooklyn, less than 2 out of every 100 respondents had theirresidence tested.

15
60.2
%
58.0
%
54.9
%
58.4
%
58.2
% 68.7
%
51.2
%
56.9
%
5.9%
21.6
%
1.7%
1.3%
0%
20%
40%
60%
80%
100%
Heard About"Profes s ional
Cleaning"
Knew of EPA'sTes t/Clean Program
Had Res idenceTes ted
All Res pondents Lower Manhattan Brooklyn Res t of Manhattan
Figure 7: Proportion of All Respondents, Respondents from Lower Manhattan, Brooklyn,and Rest of Manhattan Who Were Aware of the Need for Professional Cleaning and of theEPA-Led Testing and Cleaning Program, and Had Their Residences Tested for Asbestos
Respondents who reported that their home was contaminated with dust and/or debris due to thecollapse (see Appendix B, survey question 3.e.) were further asked whether or not they had takencertain cleaning precautions, including using professional assistance to clean their home,cleaning without professional assistance, or using a HEPA (High Efficiency Particulate Air)vacuum to clean their home. Figure 8 depicts these cleaning activities among respondents fromLower Manhattan, Brooklyn, and the rest of Manhattan who reported home contamination.
Figure 8: Proportion of Respondents in Contaminated Homes Who Had Their HomeProfessionally Cleaned, Cleaned Without Professional Assistance, or Used HEPA Vacuum*
38.3%
2.1%0.0%
70.3% 66.0% 66.7%
53.8%
28.3%25.0%
0%
20%
40%
60%
80%
100%
ProfessionallyCleaned
Cleaned, NotProfessional
HEPA VacuumUsed
Lower Manhattan Brooklyn Res t of Mahnattan
*Some respondents reported that their residence was cleaned both with and without professional assistance.
16
Data in Figure 8 indicate that about 4 in 10 of the Lower Manhattan respondents who reportedhome contamination cleaned their homes with professional assistance. Approximately 2 percentfrom Brooklyn did so, and no respondents from the rest of Manhattan who reported homecontamination used professional assistance to clean their home. At least two-thirds ofrespondents from each of the three areas indicated they had cleaned their residence but did sowithout the use of professional assistance.
Section 3 also asked respondents whether they took certain health-related actions in response tothe dust and debris created by the collapse of the WTC towers, such as whether they wore orpurchased protective breathing gear they normally would not have, or whether they visited ahealth professional for symptoms they believed were related to air quality after the collapse.
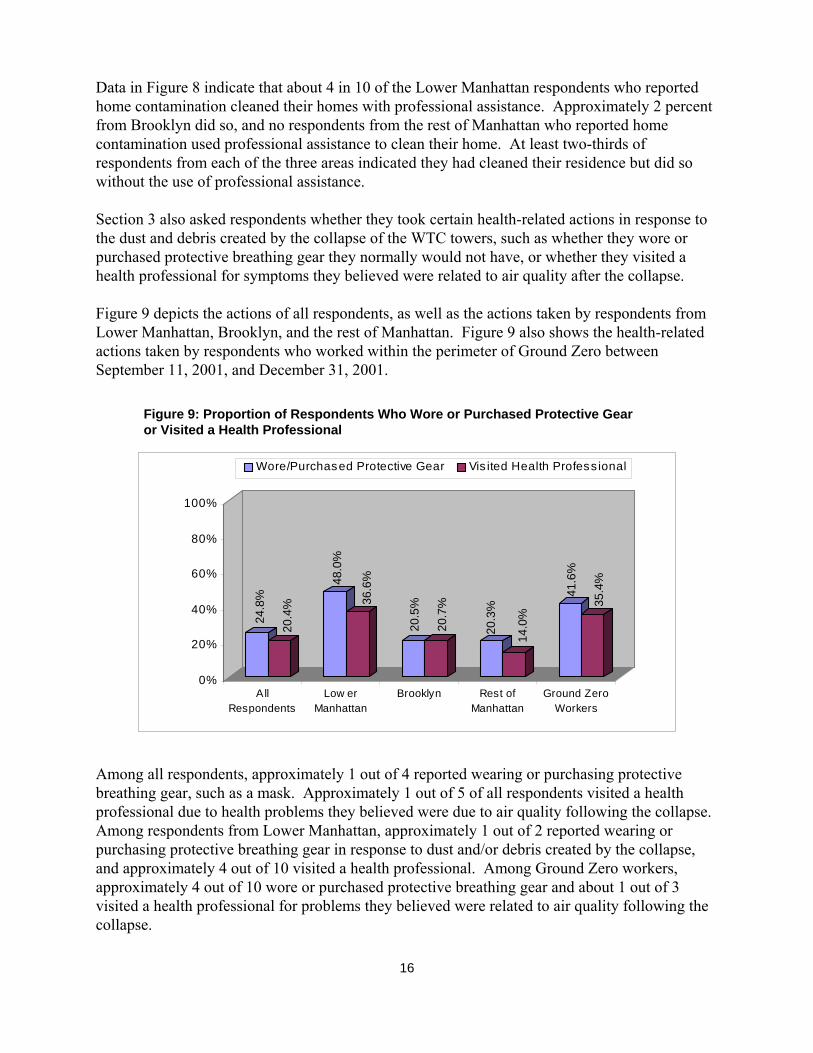
Figure 9 depicts the actions of all respondents, as well as the actions taken by respondents fromLower Manhattan, Brooklyn, and the rest of Manhattan. Figure 9 also shows the health-relatedactions taken by respondents who worked within the perimeter of Ground Zero betweenSeptember 11, 2001, and December 31, 2001.
Figure 9: Proportion of Respondents Who Wore or Purchased Protective Gearor Visited a Health Professional
24.8
%
20.4
%
48.0
%
36.6
%
20.5
%
20.7
%
20.3
%
14.0
%
41.6
%
35.4
%
0%
20%
40%
60%
80%
100%
AllRespondents
Low erManhattan
Brooklyn Rest ofManhattan
Ground ZeroWorkers
Wore/Purchased Protective Gear Vis ited Health Profess ional
Among all respondents, approximately 1 out of 4 reported wearing or purchasing protectivebreathing gear, such as a mask. Approximately 1 out of 5 of all respondents visited a healthprofessional due to health problems they believed were due to air quality following the collapse.Among respondents from Lower Manhattan, approximately 1 out of 2 reported wearing orpurchasing protective breathing gear in response to dust and/or debris created by the collapse,and approximately 4 out of 10 visited a health professional. Among Ground Zero workers,approximately 4 out of 10 wore or purchased protective breathing gear and about 1 out of 3visited a health professional for problems they believed were related to air quality following thecollapse.

17
Limitations of Survey ResultsMost important among the limitations associated with the OIG’s survey is the low response rate –less than 12 percent. The low response rate limits our ability to generalize survey results to thepopulation of NYC with sufficient confidence. Reasons may vary as to why potentialrespondents and/or certain groups of demographically similar people opted not to complete andreturn the survey. For some potential respondents, the urgency, and possibly the relevancy, of thematters covered in the survey could have been affected due to the passage of time between thecollapse of the WTC towers and when the survey was administered. The first survey forms weredistributed more than a year and a half after September 11, 2001. It is possible that one’sopinions about air quality information may have weakened or intensified, depending on one’sexperiences, during that time. Thus, data could be skewed toward the positive or negativeextremes.
Another limitation associated with this survey is that some survey questions required respondentsto recollect events and experiences that occurred over a year and a half ago from the time theytook the survey. The tragic and striking nature of this event and the fact that some cleanupactivities were still ongoing in parts of NYC at the time our survey was conducted may mitigatethe likelihood of faded memories, but it is also possible that respondents’ recollections may havefaded or been skewed over time.
Further, although we asked that the person who most recently celebrated a birthday respond tothe survey, because it was a mail survey we cannot be certain that this occurred. Therefore, eventhough the households were randomly selected, we cannot be sure that respondents from withineach household were selected at random as requested in the survey cover letter

18

19
ObservationsData from the survey suggest that the majority of respondents were generally dissatisfied with theamount, timeliness, believability, and overall quality of the information they received in theweeks just after the collapse of the WTC towers for both outdoor and indoor air quality. Morerespondents reported dissatisfaction when asked specifically about health-related information,suggesting that potential health risks related to air quality was an area of particular concern.
Despite reassuring statements about air quality following the collapse of the WTC towers, themajority of respondents living in Lower Manhattan and the rest of NYC believed that there werehealth risks associated with breathing outdoor and indoor air in Lower Manhattan. In the weeksfollowing the collapse, more than 3 out of 4 respondents thought that there were short-termhealth risks associated with breathing outdoor and indoor air in Lower Manhattan, and more thanhalf of respondents thought that breathing outdoor and indoor air in Lower Manhattan couldexpose them to long-term health risks. In the period just after the collapse until 2003, dataindicate that immediate concerns over air quality in Lower Manhattan subsided; however, overtime, substantially more respondents became unsure about whether or not breathing outdoor andindoor air in Lower Manhattan could expose them to health risks.
The responses suggest that one of EPA’s major sources of information, its “Response toSeptember 11” web site, was largely unused. Only about 10 percent of the respondents knewabout EPA’s web site, and even fewer actually visited the site. Approximately 6 out of 10respondents had heard that residences contaminated with dust and debris should beprofessionally cleaned for asbestos, and knew about the EPA-led program to test and clean forasbestos in certain residences in Lower Manhattan. However, despite this awareness, less than6 percent of all respondents had their residence tested for asbestos.
Most reports of residential contamination came from respondents in Lower Manhattan, Brooklyn,and the rest of Manhattan. Among respondents from these areas who reported homecontamination, relatively few reported having their residence professionally cleaned.

20

UNITED STATES ENVIRONMENTAL PROTECTION AGENCYWASHINGTON, DC 20460
THE INSPECTOR GENERAL
February 28, 2003
Dear New York City Resident:
It has been over one year since the terrorist attacks on the World Trade Center, yet concernsabout New York City’s air quality still remain. The Office of Inspector General would like toknow your opinion of the air quality information you received following the attacks. By completing and returning the enclosed survey you can help us determine whether the U.S.Environmental Protection Agency (EPA) needs to improve the way it responds to disasters.This survey should take 10 minutes or less to complete.
Please be assured that all responses are confidential. Your name will not be linked to yourresponses and individual answers will not be revealed. For statistical purposes only, we ask thatthe survey be completed by someone residing in the household who is 18 years of age or older,and is the person who most recently celebrated a birthday. Following these instructions willensure that our results are as meaningful as possible.
A pre-addressed, postage paid envelope has been provided for you to return your completedsurvey. We appreciate your prompt response. If you have any questions about this survey,please call us at 1-800-846-3117.
Thank you in advance for your time and cooperation. In appreciation, we will send all households a postcard providing them with a web address and phone number for accessing thesurvey results.
You may be interested in knowing more about the Office of Inspector General. We conductindependent reviews of EPA programs and activities. To learn more about our office, pleasevisit our website at http://www.epa.gov/oigearth.htm.
Sincerely,
Nikki L. TinsleyInspector General
Si desea recibir esta encuesta en español, por favor llama a 1-800-846-3117.If you wish to receive this survey in Spanish, please call 1-800-846-3117.
Appendix A
21

Completing questions on the survey should take approximately 10 minutes or less. The total public reporting burden for this sur-vey is estimated to average 15 minutes per respondent as a one-time-only burden. Burden means the total time, effort, or finan-cial resources expended by persons to generate, maintain, or disclose or provide information to or for a Federal agency. Thisincludes: the time needed to review instructions; develop, acquire, install, and utilize technology and systems for the purposes ofcollecting, validating, and verifying information; processing and maintaining information; disclosing and providing information;adjusting the existing ways to comply with any previously applicable instructions and requirements; training personnel to be ableto respond to a collection of information; searching data sources; completing and reviewing the collection of information; and,transmitting or otherwise disclosing or reporting on the information. An agency may not conduct or sponsor, and a person is notrequired to respond to a collection of information unless it displays a currently valid OMB control number. The OMB controlnumbers for EPA’s regulations are listed in 40 CFR Part 9 and 48 CFR Chapter 15.
Send comments on the Agency’s need for this information, the accuracy of the provided burden estimates, and any suggestedmethods for minimizing respondent burden, including through the use of automated collection techniques to the Director,Collection Strategies Division, U.S. Environmental Protection Agency (2822), 1200 Pennsylvania Ave. NW, Washington DC,20460. Include the EPA ICR number 2094.01 in any correspondence. Please do not send completed surveys to this address, usethe provided envelope instead.
22

a. Did you think breathing outdoor air in lower Manhattan could expose you to long-term health risks, such as cancer?In the weeks just after the collapse? Yes No Wasn’t Sure NAHow about outdoor air now? Yes No Not Sure NA
b. Did you think breathing indoor air in lower Manhattan could expose you to long-term health risks, such as cancer?In the weeks just after the collapse? Yes No Wasn’t Sure NAHow about indoor air now? Yes No Not Sure NA
c. Did you think breathing outdoor air in lower Manhattan could expose you to short-term health problems, such as coughing, sore throat, or asthma attacks?
In the weeks just after the collapse? Yes No Wasn’t Sure NAHow about outdoor air now? Yes No Not Sure NA
d. Did you think breathing indoor air in lower Manhattan could expose you to short-term health problems, such as coughing, sore throat, or asthma attacks?
In the weeks just after the collapse? Yes No Wasn’t Sure NAHow about indoor air now? Yes No Not Sure NA
e. Did you think you should have worn protective gear, such as a mask, when breathing outdoor air in lower Manhattan?In the weeks just after the collapse? Yes No Wasn’t Sure NAHow about wearing it now? Yes No Not Sure NA
f. Did you think you should have worn protective gear, such as a mask, when breathing indoor air in lower Manhattan?In the weeks just after the collapse? Yes No Wasn’t Sure NAHow about wearing it now? Yes No Not Sure NA
Survey of Air Quality Issues After September 11, 2001EPA Office of Inspector General - 1200 Pennsylvania Ave. NW, Washington, DC 20460
Instructions: Listed on the front and back of this page are three main topics relating to air quality. Some of the main topics ask youto think about specific times, such as “just after the collapse.” Below each of the main topics are several questions. Please respondto each question by choosing the response that best reflects your thoughts or actions during the specified time period. Please complete the front and back of this survey. Circle “NA” (not applicable) if you have no response because a question does notapply to you.
2.) Please circle the response for both time periods that best reflects your thoughts about air quality in terms of how it wasaffected by the collapse of the World Trade Center towers:
1 2 3 4 5 NA
1 2 3 4 5 NA
1 2 3 4 5 NA
1 2 3 4 5 NA
1 2 3 4 5 NA
1 2 3 4 5 NA
1 2 3 4 5 NA
1 2 3 4 5 NA
1 2 3 4 5 NA
1 2 3 4 5 NA
1 2 3 4 5 NA
1 2 3 4 5 NA
1 2 3 4 5 NA
1 2 3 4 5 NA
1 2 3 4 5 NA
Comple
tely
Satis
fied
Not at
All
Satis
fied
PPLLEEAASSEE TTUURRNN PPAAGGEE OOVVEERR TTOO CCOOMMPPLLEETTEE SSUURRVVEEYY
a. The amount of information I heard or received about outdoor air quality
b. The amount of information I heard or received about indoor air quality
FOR THE INFORMATION YOU HEARD OR RECEIVED, PLEASE RATE:
c. The “understandability” of information I heard or received about outdoor air quality
d. The “understandability” of information I heard or received about indoor air quality
e. The timeliness of information I heard or received about outdoor air quality
f. The timeliness of information I heard or received about indoor air quality
g. The “believability”of information I heard or received about outdoor air quality
h. The “believability”of information I heard or received about indoor air quality
i. My overall rating of information I heard or received about outdoor air quality
j. My overall rating of information I heard or received about indoor air quality
k. Explanation of possible threats to my health related to air quality
l. Explanation of how to minimize my exposure to potential health risks related to air quality
m. Explanation of health problems I might experience due to air quality
n. Explanation of steps I should take if I experienced health problems related to air quality
o. My overall rating of information I received about health risks related to air quality
1.) Please rate your satisfaction with the information you heard or received about airquality in the weeks just after the collapse of the World Trade Center towers:
OMB#2020-0027 Expires: 5/31/03
Appendix B
23

Yes No Not sure NA
Yes No Not sure NA
Yes No Not sure NA
Yes No Not sure NA
Yes No Not sure NA
Yes No Not sure NA
Yes No Not sure NA
Yes No Not sure NA
Yes No Not sure NA
Yes No Not sure NA
Yes No Not sure NA
Yes No Not sure NA
Yes No Not sure NA
Yes No Not sure NA
Yes No Not sure NA
3.) Please circle the response that best describes the actions you took in response to dust or debris created by the collapse of the World Trade Center towers and your awareness of certain WTC-related information:
4.) Thank you for your help so far. There are only a few more questions to go. The following information is optional, but itwill help us to make sure that everyone’s opinion is included.
a. How many children under the age of 18 lived in your home as of September 11, 2001?None 1 2 3 4 5 or more
b. Not counting you, how many adults between the age of 18 and 60 lived in your home as of September 11, 2001?None 1 2 3 4 5 or more
c. Not counting you, how many adults over the age of 60 lived in your home as of September 11, 2001?None 1 2 3 4 5 or more
d. What is your age? _______ years old
e. What is your gender? Female Male
f. What was your 5-digit zip code as of September 11, 2001? ___ ___ ___ ___ ___
g. Which choice best represents the area in which you worked during the month of September, 2001? (pick one)Manhattan: South of Canal or Pike St. Bronx ConnecticutManhattan: On Canal or Pike to South of 14th Brooklyn New JerseyManhattan: On 14th to 42nd Queens Other: ________________________Manhattan: On 42nd to top of Manhattan Staten Island
h. Between 9-11-01 and 12-31-01, did you ever work within the perimeter of Ground Zero? Yes No
i. What is the highest level of education you have completed?Less than High School High School Diploma Some College Bachelor’s DegreePost-Grad. Degree Associate’s Degree Tech/Vocational Degree Other: ________________________
j. Is your primary language English? Yes No
Thank you for completing our survey. Please use the pre-addressed, postage-paid envelope to return your responses.
If you have further comments regarding the issues covered in this survey, please contact our office at 1-800-846-3117 or write to us at EPAOffice of Inspector General, 1200 Pennsylvania Ave. NW, Washington, DC 20460.
a. I wore or purchased protective gear, such as a mask, that I normally would not have.
b. I visited a health professional for health problems I believed were related to air quality.
c. A HEPA vacuum was used to clean the carpeting and/or rugs in my residence.
d. My residence was tested for asbestos.
e. My residence was contaminated with dust/debris due to the collapse. (If you answer“No” or “NA”, skip to m.)
f. My residence was cleaned for dust/debris with professional assistance.
g. My residence was cleaned for dust/debris without professional assistance.
h. The floors and surfaces in my residence were wiped for dust/debris with a wet cloth.
i. All of the clothes in my residence were laundered due to dust from the collapse.
j. I have permanently vacated my residence due to dust/debris from the collapse. (If you answer “Yes”, skip to m.)
k. I temporarily (at least 24 hrs) vacated my residence due to dust/debris from the collapse.(If you answer “No”, “Not sure” or “NA”, skip to m.)
l. How long was it before anyone moved back into your residence?1 to 6 days 7 to14 days 15 to 21 days21 days to 1 month more than 1 month No one has moved back in yet
m. I know about EPA’s “Response to September 11” Internet website.
n. I have visited EPA’s “Response to September 11” Internet website.
o. In the weeks just after the collapse, I heard that homes contaminated with dust/debrisshould be professionally cleaned for asbestos.
p. I know that some residents of lower Manhattan are eligible to have EPA test and clean their homes.
24

25
Appendix C
Sample DetailsThe sampling frame – the universe from which the OIG drew its sample – consisted of alladdresses in the five boroughs of NYC (Bronx, Brooklyn, Manhattan, Queens, and StatenIsland). These areas were selected based on the proximity of residences to the WTC towers siteand their potential exposure to the dust and debris created by the collapse. The sample waspurchased from R.L. Polk Co., of Detroit, Michigan.
A sample of 10,000 addresses was selected from this frame and divided into two sample groupsof 5,000. The proportion of addresses in each set were drawn to approximate the proportion ofhouseholds in each borough as reported in the 2000 Census. The distribution of addresses wasapproximated so that Manhattan could be over sampled. Manhattan was divided into two parts:Lower Manhattan, which, for purposes of this report, is defined to include residences south of E.Houston and Broome Streets; and the rest of Manhattan, which is defined to include residencesnorth of E. Houston and Broome Streets. The final distribution of addresses in the sample was:
C Bronx: 13%C Brooklyn: 27%C Lower Manhattan: 13%
C Rest of Manhattan: 21%C Queens: 22%C Staten Island: 4%
The Survey of Air Quality Issues After September 11, 2001, was initiated with the delivery of thepre-notification postcard on March 25, 2003 and collection was closed on July 31, 2003.
A pre-notification postcard was delivered to 5,000 addresses in the first sample group 2 daysbefore the surveys were mailed to inform recipients that a survey was coming and to ask for theircooperation. This was done to promote a high response rate. In addition, a toll-free hotline wasprovided in both English and Spanish for respondents to ask questions and/or request a Spanishversion of the survey. The package delivered to each address in the sample included: (1) a coverletter printed on OIG stationery and signed by the Inspector General; (2) a one-page, double-sided survey; and (3) a postage-paid business reply envelope for the survey’s return. Appendix Bprovides the survey form. Based on the response rate from the first 5,000 surveys released, theOIG released surveys to the second set of 5,000 addresses to increase the number of responses. A pre-notification postcard was not sent to the second set of addresses. As a followup reminder,a postcard was delivered to every address in both sample groups asking potential respondents tofill out and return the survey.

26

27
Appendix D
Distribution
EPA Headquarters
Acting AdministratorActing Assistant Administrator for Solid Waste and Emergency ResponseAssistant Administrator for Air and RadiationAssistant Administrator for Research and DevelopmentAssistant Administrator for Environmental InformationActing Associate Administrator, Office of Public AffairsComptroller (2731A)Agency Audit Follow-up Coordinator (2724A)Audit Follow-up Coordinator, Office of Solid Waste and Emergency ResponseAudit Follow-up Coordinator, Office of Air and RadiationAudit Follow-up Coordinator, Office of Research and DevelopmentAudit Follow-up Coordinator, Office of Environmental InformationAudit Follow-up Coordinator, Office of Public AffairsAssociate Administrator for Congressional and Intergovernmental Relations (1301A)
Director, Office of Regional Operations (1108A)
EPA Regions
Regional AdministratorsRegional Audit Follow-up Coordinators
New York City
City of New York Law Department
EPA Office of Inspector General
Inspector General (2410)