Surface Tension Measurements
13
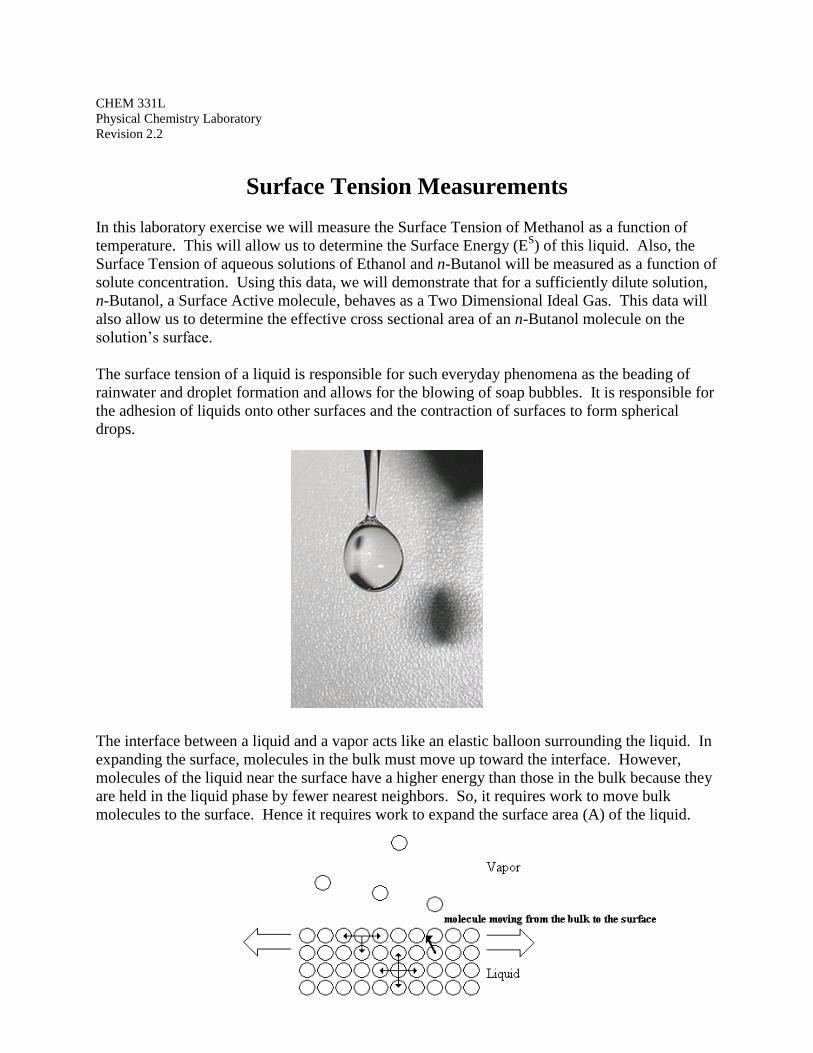
CHEM 331L Physical Chemistry Laboratory Revision 2.2 Surface Tension Measurements In this laboratory exercise we will measure the Surface Tension of Methanol as a function of temperature. This will allow us to determine the Surface Energy (E S ) of this liquid. Also, the Surface Tension of aqueous solutions of Ethanol and n-Butanol will be measured as a function of solute concentration. Using this data, we will demonstrate that for a sufficiently dilute solution, n-Butanol, a Surface Active molecule, behaves as a Two Dimensional Ideal Gas. This data will also allow us to determine the effective cross sectional area of an n-Butanol molecule on the solution’s surface. The surface tension of a liquid is responsible for such everyday phenomena as the beading of rainwater and droplet formation and allows for the blowing of soap bubbles. It is responsible for the adhesion of liquids onto other surfaces and the contraction of surfaces to form spherical drops. The interface between a liquid and a vapor acts like an elastic balloon surrounding the liquid. In expanding the surface, molecules in the bulk must move up toward the interface. However, molecules of the liquid near the surface have a higher energy than those in the bulk because they are held in the liquid phase by fewer nearest neighbors. So, it requires work to move bulk molecules to the surface. Hence it requires work to expand the surface area (A) of the liquid.
-
Upload
truongmien -
Category
Documents
-
view
238 -
download
1
Transcript of Surface Tension Measurements
CHEM 331L
Physical Chemistry Laboratory
Revision 2.2
Surface Tension Measurements
In this laboratory exercise we will measure the Surface Tension of Methanol as a function of
temperature. This will allow us to determine the Surface Energy (ES) of this liquid. Also, the
Surface Tension of aqueous solutions of Ethanol and n-Butanol will be measured as a function of
solute concentration. Using this data, we will demonstrate that for a sufficiently dilute solution,
n-Butanol, a Surface Active molecule, behaves as a Two Dimensional Ideal Gas. This data will
also allow us to determine the effective cross sectional area of an n-Butanol molecule on the
solution’s surface.
The surface tension of a liquid is responsible for such everyday phenomena as the beading of
rainwater and droplet formation and allows for the blowing of soap bubbles. It is responsible for
the adhesion of liquids onto other surfaces and the contraction of surfaces to form spherical
drops.
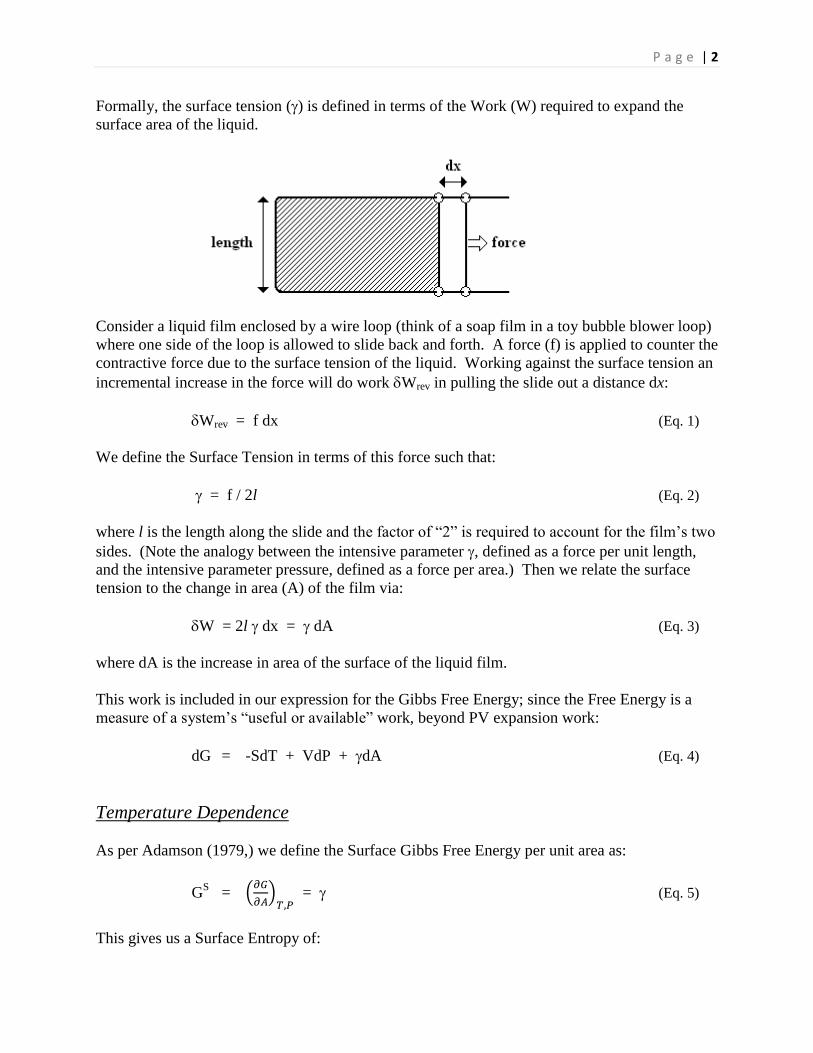
The interface between a liquid and a vapor acts like an elastic balloon surrounding the liquid. In
expanding the surface, molecules in the bulk must move up toward the interface. However,
molecules of the liquid near the surface have a higher energy than those in the bulk because they
are held in the liquid phase by fewer nearest neighbors. So, it requires work to move bulk
molecules to the surface. Hence it requires work to expand the surface area (A) of the liquid.
P a g e | 2
Formally, the surface tension () is defined in terms of the Work (W) required to expand the
surface area of the liquid.
Consider a liquid film enclosed by a wire loop (think of a soap film in a toy bubble blower loop)
where one side of the loop is allowed to slide back and forth. A force (f) is applied to counter the
contractive force due to the surface tension of the liquid. Working against the surface tension an
incremental increase in the force will do work Wrev in pulling the slide out a distance dx:
Wrev = f dx (Eq. 1)
We define the Surface Tension in terms of this force such that:
= f / 2l (Eq. 2)
where l is the length along the slide and the factor of “2” is required to account for the film’s two
sides. (Note the analogy between the intensive parameter , defined as a force per unit length,
and the intensive parameter pressure, defined as a force per area.) Then we relate the surface
tension to the change in area (A) of the film via:
W = 2l dx = dA (Eq. 3)
where dA is the increase in area of the surface of the liquid film.
This work is included in our expression for the Gibbs Free Energy; since the Free Energy is a
measure of a system’s “useful or available” work, beyond PV expansion work:
dG = -SdT + VdP + dA (Eq. 4)
Temperature Dependence
As per Adamson (1979,) we define the Surface Gibbs Free Energy per unit area as:
GS =
= (Eq. 5)
This gives us a Surface Entropy of:
P a g e | 3
SS = -
= -
(Eq. 6)
Measurably, the Surface Energy (ES) and Enthalpy (H
S) are usually indistinguishable, so:
ES ~ H
S = G
S + TS
S = - T
(Eq. 7)
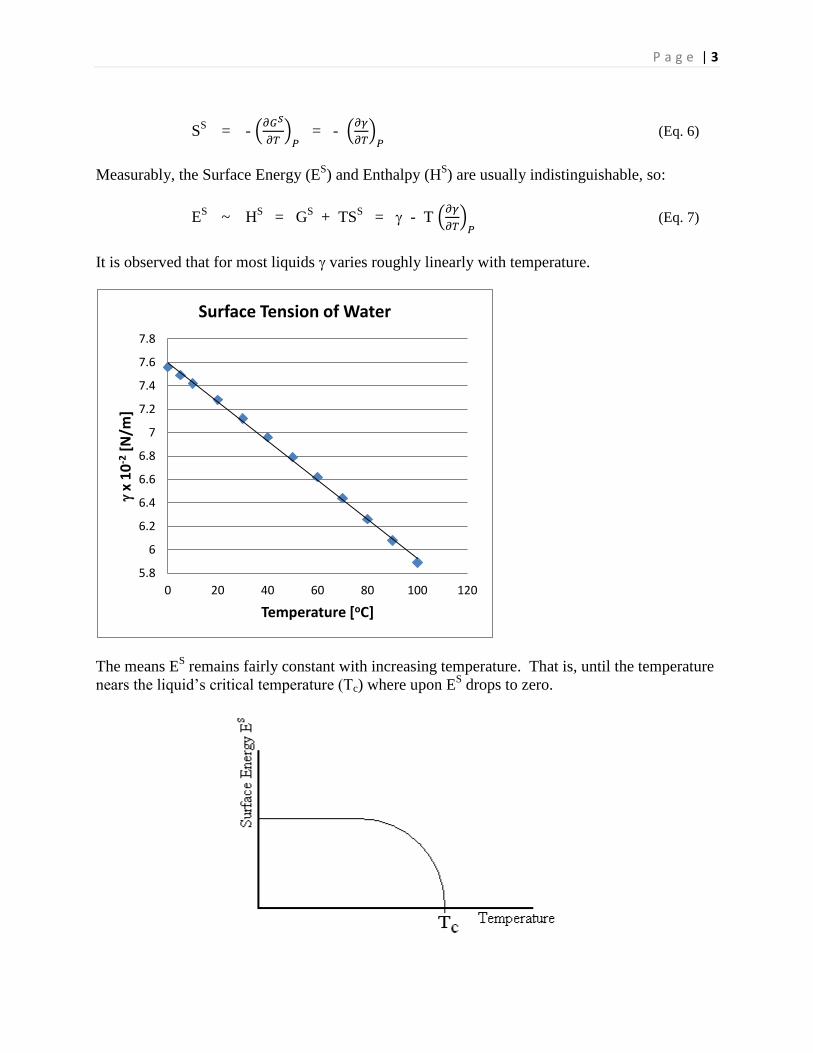
It is observed that for most liquids varies roughly linearly with temperature.
The means ES remains fairly constant with increasing temperature. That is, until the temperature
nears the liquid’s critical temperature (Tc) where upon ES drops to zero.
5.8
6
6.2
6.4
6.6
6.8
7
7.2
7.4
7.6
7.8
0 20 40 60 80 100 120
x
10
-2 [
N/m
]
Temperature [oC]
Surface Tension of Water
P a g e | 4
Concentration Dependence
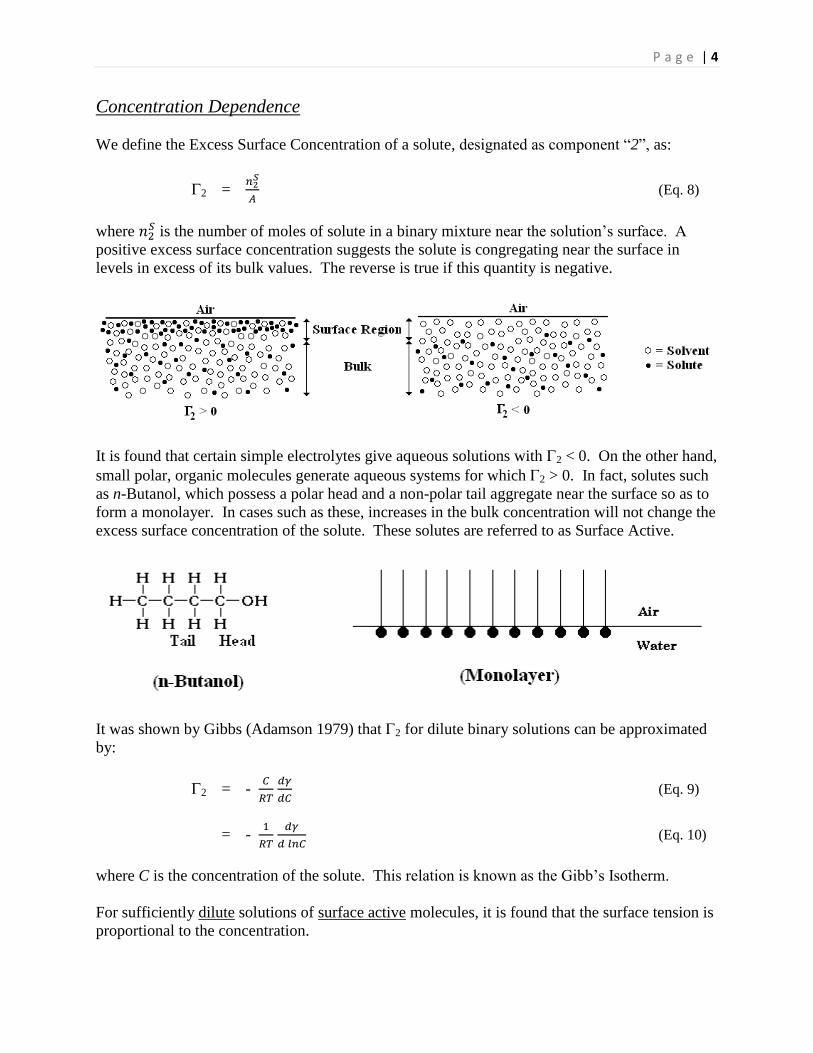
We define the Excess Surface Concentration of a solute, designated as component “2”, as:
2 =
(Eq. 8)
where is the number of moles of solute in a binary mixture near the solution’s surface. A
positive excess surface concentration suggests the solute is congregating near the surface in
levels in excess of its bulk values. The reverse is true if this quantity is negative.
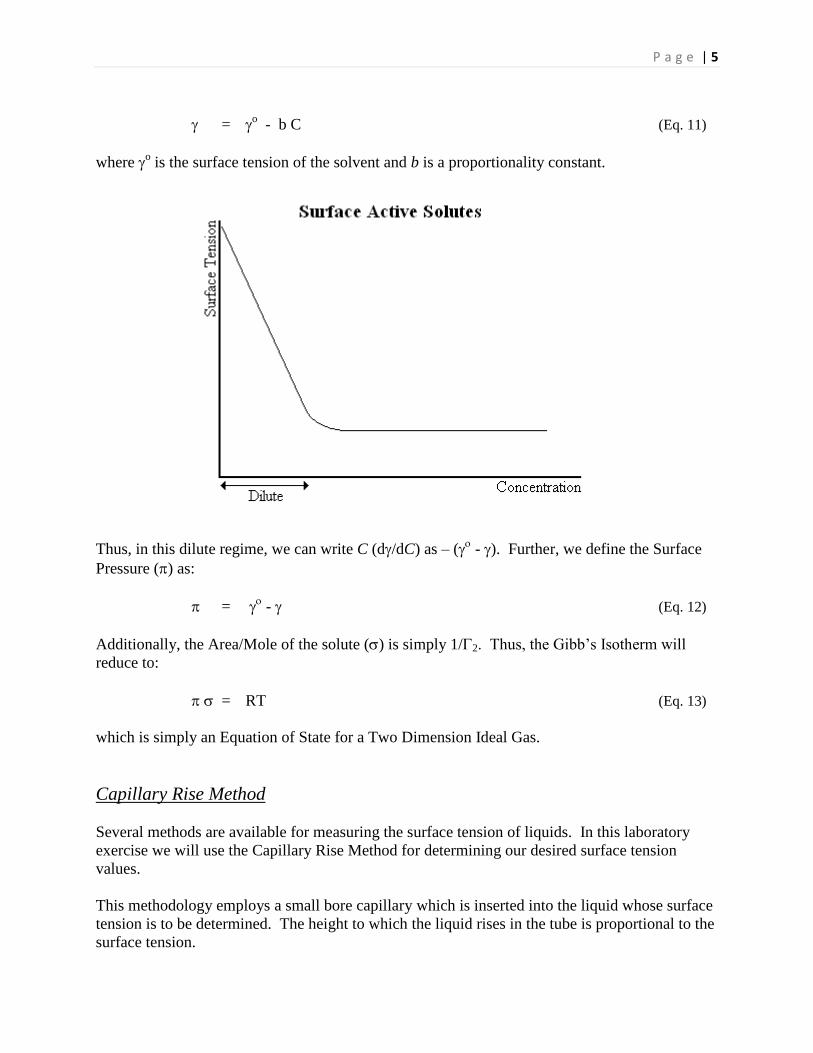
It is found that certain simple electrolytes give aqueous solutions with 2 < 0. On the other hand,
small polar, organic molecules generate aqueous systems for which 2 > 0. In fact, solutes such
as n-Butanol, which possess a polar head and a non-polar tail aggregate near the surface so as to
form a monolayer. In cases such as these, increases in the bulk concentration will not change the
excess surface concentration of the solute. These solutes are referred to as Surface Active.
It was shown by Gibbs (Adamson 1979) that 2 for dilute binary solutions can be approximated
by:
2 = -
(Eq. 9)
= -
(Eq. 10)
where C is the concentration of the solute. This relation is known as the Gibb’s Isotherm.
For sufficiently dilute solutions of surface active molecules, it is found that the surface tension is
proportional to the concentration.
P a g e | 5
= o - b C (Eq. 11)
where o is the surface tension of the solvent and b is a proportionality constant.
Thus, in this dilute regime, we can write C (d/dC) as – ( - ). Further, we define the Surface
Pressure () as:
= - (Eq. 12)
Additionally, the Area/Mole of the solute () is simply 1/2. Thus, the Gibb’s Isotherm will
reduce to:
= RT (Eq. 13)
which is simply an Equation of State for a Two Dimension Ideal Gas.
Capillary Rise Method
Several methods are available for measuring the surface tension of liquids. In this laboratory
exercise we will use the Capillary Rise Method for determining our desired surface tension
values.
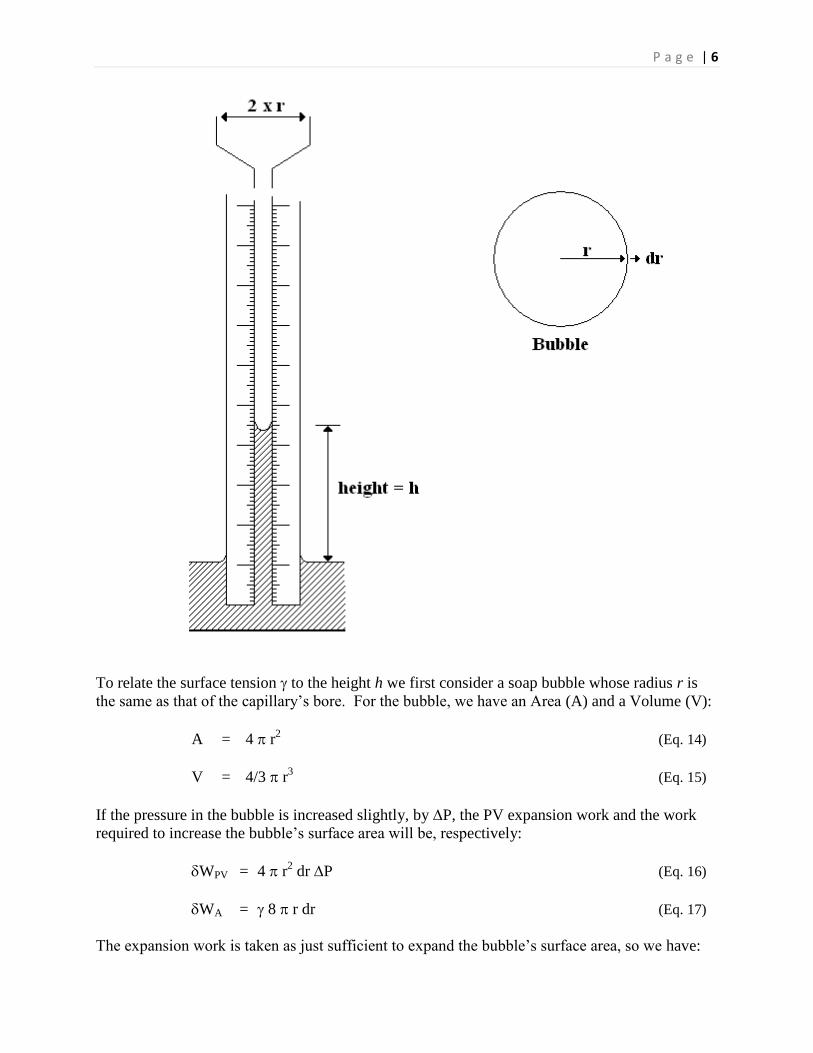
This methodology employs a small bore capillary which is inserted into the liquid whose surface
tension is to be determined. The height to which the liquid rises in the tube is proportional to the
surface tension.
P a g e | 6
To relate the surface tension to the height h we first consider a soap bubble whose radius r is
the same as that of the capillary’s bore. For the bubble, we have an Area (A) and a Volume (V):
A = 4 r2 (Eq. 14)
V = 4/3 r3 (Eq. 15)
If the pressure in the bubble is increased slightly, by P, the PV expansion work and the work
required to increase the bubble’s surface area will be, respectively:
WPV = 4 r2 dr P (Eq. 16)
WA = 8 r dr (Eq. 17)
The expansion work is taken as just sufficient to expand the bubble’s surface area, so we have:
P a g e | 7
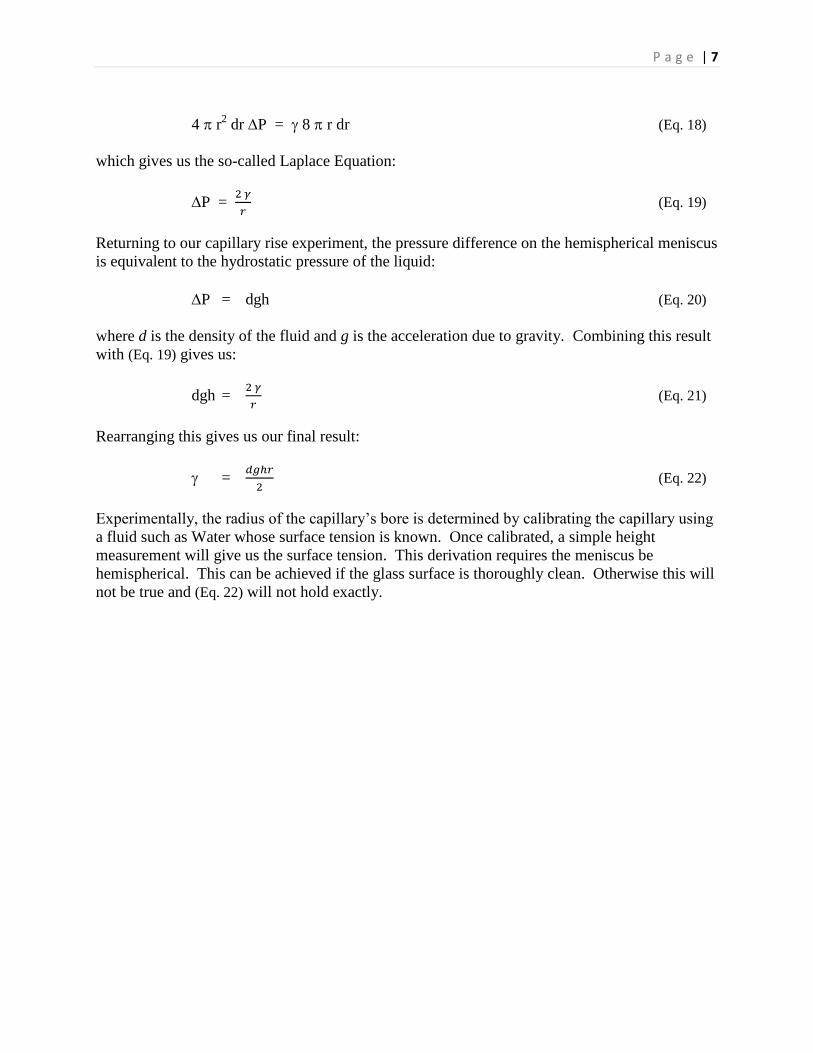
4 r2 dr P = 8 r dr (Eq. 18)
which gives us the so-called Laplace Equation:
P =
(Eq. 19)
Returning to our capillary rise experiment, the pressure difference on the hemispherical meniscus
is equivalent to the hydrostatic pressure of the liquid:
P = dgh (Eq. 20)
where d is the density of the fluid and g is the acceleration due to gravity. Combining this result
with (Eq. 19) gives us:
dgh =
(Eq. 21)
Rearranging this gives us our final result:
=
(Eq. 22)
Experimentally, the radius of the capillary’s bore is determined by calibrating the capillary using
a fluid such as Water whose surface tension is known. Once calibrated, a simple height
measurement will give us the surface tension. This derivation requires the meniscus be
hemispherical. This can be achieved if the glass surface is thoroughly clean. Otherwise this will
not be true and (Eq. 22) will not hold exactly.
P a g e | 8
Procdure
Week 1
1. Prepare solutions of solutes to be measured. These will include:
0.8M aqueous n-Butanol and 7 dilutions of this solution; each a ¾-fold dilution of
the previous mix. n-Butanol is an irritant. Work with it in the Fume Hood.
Aq. Ethanol solutions at 20, 40, 60, 80, 100 wt%
2. Be sure the capillary is soaking in Chromic Acid cleaning solution. (The capillary should
be stored in Distilled Water when not is use.)
Pre-Lab work:
Work out a scheme for preparing about 100 mL of each of the above solutions.
Week 2
1. Rinse the capillary thoroughly with Distilled Water. Also, rinse with the sample to be
measured.
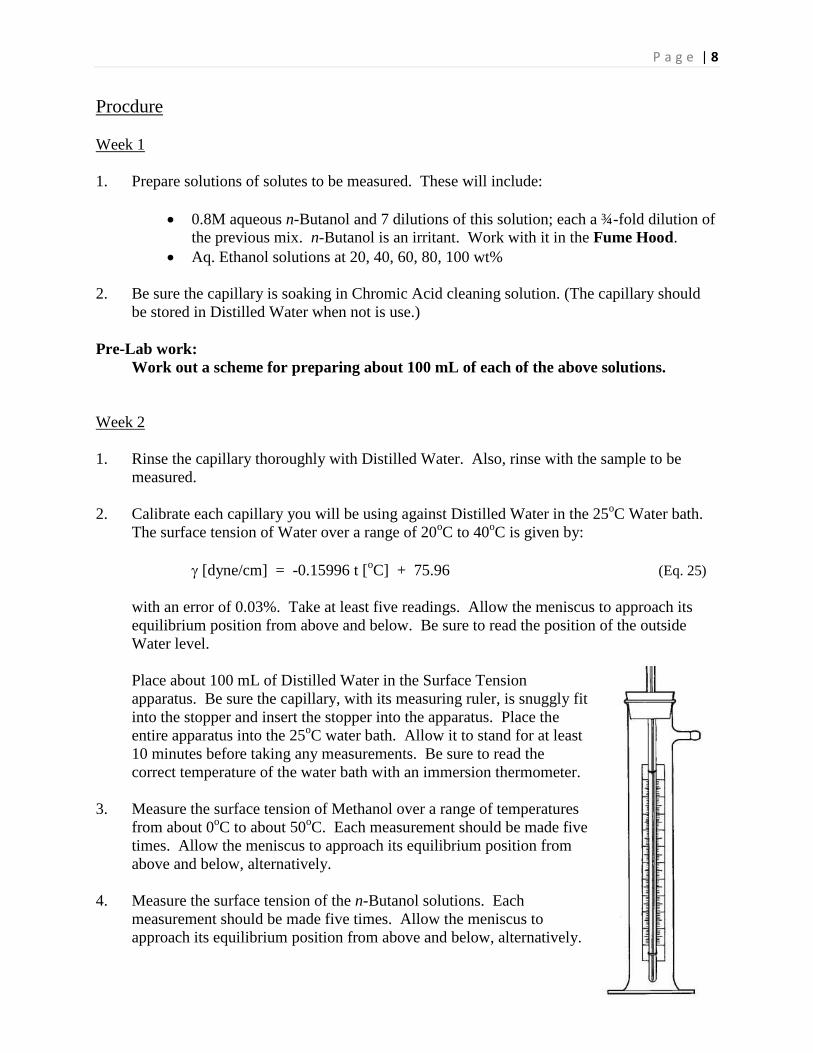
2. Calibrate each capillary you will be using against Distilled Water in the 25oC Water bath.
The surface tension of Water over a range of 20oC to 40
oC is given by:
[dyne/cm] = -0.15996 t [oC] + 75.96 (Eq. 25)
with an error of 0.03%. Take at least five readings. Allow the meniscus to approach its
equilibrium position from above and below. Be sure to read the position of the outside
Water level.
Place about 100 mL of Distilled Water in the Surface Tension
apparatus. Be sure the capillary, with its measuring ruler, is snuggly fit
into the stopper and insert the stopper into the apparatus. Place the
entire apparatus into the 25oC water bath. Allow it to stand for at least
10 minutes before taking any measurements. Be sure to read the
correct temperature of the water bath with an immersion thermometer.
3. Measure the surface tension of Methanol over a range of temperatures
from about 0oC to about 50
oC. Each measurement should be made five
times. Allow the meniscus to approach its equilibrium position from
above and below, alternatively.
4. Measure the surface tension of the n-Butanol solutions. Each
measurement should be made five times. Allow the meniscus to
approach its equilibrium position from above and below, alternatively.
P a g e | 9
6. Measure the surface tension of the Aq. Ethanol solutions. Each measurement should be
made five times. Allow the meniscus to approach its equilibrium position from above and
below, alternatively.
Be sure to rinse the capillary thoroughly between each measurement and that the samples have
come to equilibrium in the Water Baths. Make all the solution measurements at about 25oC.
The meniscus can be difficult to see. If you force the meniscus away from its equilibrium
position and watch it return, you should be able to see it more clearly.
P a g e | 10
Data Analysis
All results should be accompanied by an appropriate error estimate.
1. Determine the radius of each capillary used; according to Eq. 22.. Use a precise value for
the density of Water at your working temperature. (The density of Water can be found in
any CRC Handbook of Chemistry and Physics.) for Water is given by Eq. 25. Take note
of the estimated error in this value. Report both the average result and the std. dev. of the
mean for each capillary.
2. Determine the surface tension for Methanol at each temperature for which it was measured.
(The density of Methanol as a function of temperature can be found at the "literature" link.)
Plot vs. T; your plot should include appropriate error bars. Literature results should be
included on your graph. Determine ( / T)P and the Surface Energy ES. Include an error
estimate for ES.
3. Determine the surface tension for each n-Butanol solution. These solutions are dilute
enough that the density can be taken as that of Water at the measuring temperature. Plot
vs. C; including appropriate error bars. Identify the “dilute solution” regime. Determine
and for each solution in this regime. Verify the solute on the surface is behaving as a
Two Dimensional Ideal Gas by plotting vs. 1/. (Like a plot of P vs. 1/V for an Ideal 3D-
Gas, this plot should be linear.) Now, plot vs. lnC. Again, include appropriate error bars.
Calculate 2, along with an appropriate error estimate. Express the result in molecules per
Å2. Obtain the effective cross sectional area of one n-Butanol molecule in Å
2. Include an
appropriate error estimate. Compare your result with literature values.
4. Determine the surface tension for each Ethanol solution. (Accurate solution densities will
be required. See the data under the "literature" link.) Plot vs. C; including appropriate
error bars. Interpret the results.
P a g e | 11
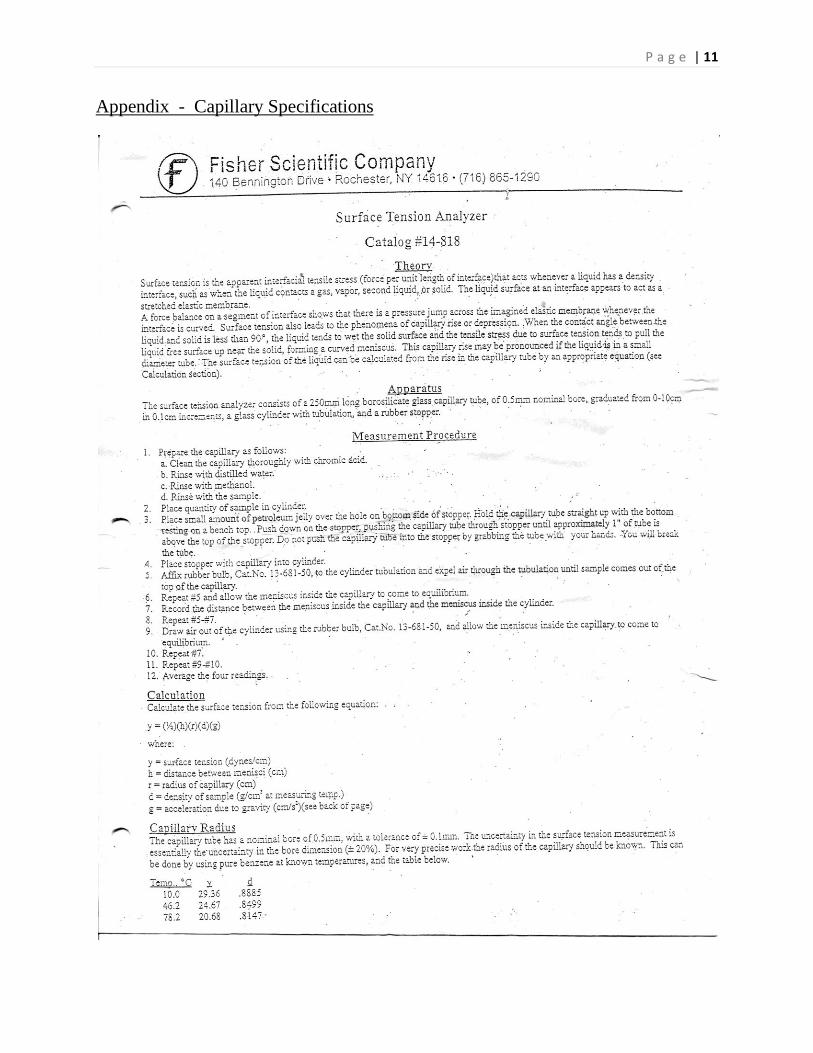
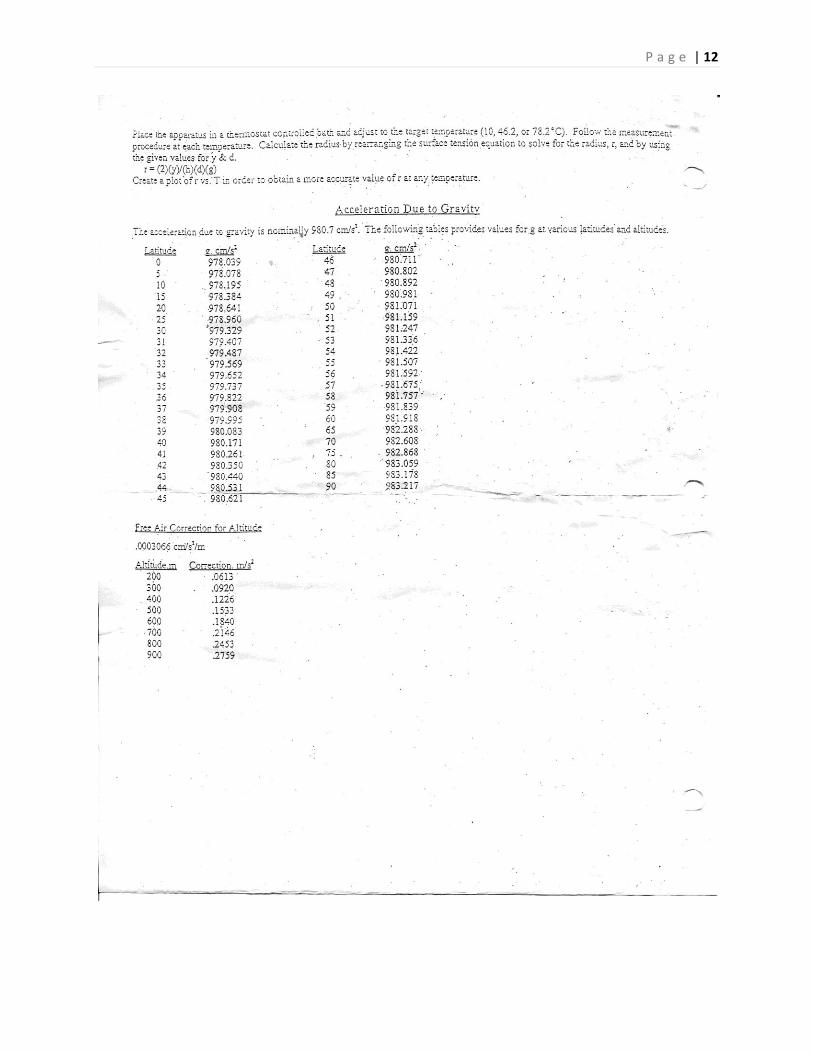
Appendix - Capillary Specifications
P a g e | 12

P a g e | 13
References
Adamson, Arthur W. (1979). “A Textbook of Physical Chemistry,” 2nd
Ed. Academic Press,
New York.
Castellan, Gilbert W. (1983). “Physical Chemistry,” 3rd
Ed. Addison-Wesley.
Harkins, William D. and Wampler, Roy W. “Tha Activity Coefficients and the Adsorption of
Organic Solutes. I. Normal Butyl Alcohol in Aqueous Solution by the Freezing Point
Method,” JACS 53 (1931) 850.
Moore, Walter J. (1972). “Physical Chemistry,” 4th
Ed. Prentice-Hall, New Jersey.
Shoemaker, David P.; Garland, Carl W. and Nibler, Joseph W. (1996) “Experiments in Physical
Chemistry,” 6th
Ed. McGraw-Hill, New York.
Sime, Rodney J. (1990). “Physical Chemistry: Methods, Techniques and Experiments.”
Saunders College Publishing, Philadelphia.
http://hyperphysics.phy-astr.gsu.edu/hbase/surten.html; accessed September 4, 2010.
http://www.engineeringtoolbox.com/water-surface-tension-d_597.html; accessed September 4,
2010.