Surface modification of mineral dust particles by sulphuric acid ...
20
Atmos. Chem. Phys., 11, 7839–7858, 2011 www.atmos-chem-phys.net/11/7839/2011/ doi:10.5194/acp-11-7839-2011 © Author(s) 2011. CC Attribution 3.0 License. Atmospheric Chemistry and Physics Surface modification of mineral dust particles by sulphuric acid processing: implications for ice nucleation abilities P. Reitz 1,2 , C. Spindler 3 , T. F. Mentel 3 , L. Poulain 4 , H. Wex 4 , K. Mildenberger 4 , D. Niedermeier 4 , S. Hartmann 4 , T. Clauss 4 , F. Stratmann 4 , R. C. Sullivan 5 , P. J. DeMott 5 , M. D. Petters 6 , B. Sierau 7 , and J. Schneider 1 1 Particle Chemistry Department, Max Planck Institute for Chemistry, Mainz, Germany 2 Institute for Atmospheric Physics, Johannes Gutenberg University Mainz, Mainz, Germany 3 Institute for Energy- and Climate Research Troposphere (IEK-8), Research Center J¨ ulich GmbH, J ¨ ulich, Germany 4 Department of Physics, Leibniz Institute for Tropospheric Research, Leipzig, Germany 5 Department of Atmospheric Science, Colorado State University, Fort Collins, USA 6 Department of Marine Earth and Atmospheric Science, North Carolina State University, Raleigh, USA 7 Institute for Atmospheric and Climate Science, ETH Z ¨ urich, Z¨ urich, Switzerland Received: 11 February 2011 – Published in Atmos. Chem. Phys. Discuss.: 2 March 2011 Revised: 20 July 2011 – Accepted: 21 July 2011 – Published: 3 August 2011 Abstract. The ability of coated mineral dust particles to act as ice nuclei (IN) was investigated at LACIS (Leipzig Aerosol Cloud Interaction Simulator) during the FROST1- and FROST2-campaigns (Freezing of dust). Sulphuric acid was condensed on the particles which afterwards were op- tionally humidified, treated with ammonia vapour and/or heat. By means of aerosol mass spectrometry we found evi- dence that processing of mineral dust particles with sulphuric acid leads to surface modifications of the particles. These surface modifications are most likely responsible for the ob- served reduction of the IN activation of the particles. The ob- served particle mass spectra suggest that different treatments lead to different chemical reactions on the particle surface. Possible chemical reaction pathways and products are sug- gested and the implications on the IN efficiency of the treated dust particles are discussed. 1 Introduction Aerosol particles have various direct and indirect effects on earth climate (Lohmann and Feichter, 2005). One of the im- portant indirect effects is their ability to act as heterogeneous ice nuclei. Heterogeneous ice nucleation influences the earth radiation budget by the change of cloud albedo (Kay et al., Correspondence to: P. Reitz ([email protected]) 2007) and plays a major role in the formation of precipita- tion, especially in mid latitudes (Roedel, 2000). The exact effect of ice clouds on the Earth’s climate is yet not well un- derstood (Forster et al., 2007) and more research is needed to determine the mechanisms of heterogeneous ice nucle- ation (Cantrell and Heymsfield, 2005). Mineral dust has been found to be one of the major components of snow crystal residuals (Kamphus et al., 2010; Mertes et al., 2007; Richard- son et al., 2007; Cziczo et al., 2004; DeMott et al., 2003). In the atmosphere mineral dust is often internally mixed with organic and inorganic material due to particle ageing pro- cesses in the atmosphere (Wiacek and Peter, 2009; Sullivan et al., 2007; Sullivan and Prather, 2007; Hinz et al., 2005; Falkovich et al., 2001). Such additions may influence the ef- ficiency of mineral dust to act as ice nuclei (Sullivan et al., 2010a,b; Niedermeier et al., 2010; Gallavardin et al., 2008; M¨ ohler et al., 2005, 2008). Niedermeier et al. (2010) found that active sites were lost when particles were processed with concentrated sulphuric acid and Sullivan et al. (2010b) show that the loss of these active sites was irreversible. How- ever, the surface processes that lead to the destruction of ac- tive sites are not fully understood. Here we present a study of reactions taking place on the particle surface of Arizona Test Dust after processing with sulphuric acid. The exper- iments were performed during the FROST1 and FROST2 (Freezing of dust 1 and 2) campaigns at the LACIS (Leipzig Aerosol Cloud Interaction Simulator, (Hartmann et al., 2011; Stratmann et al., 2004)) facility located at the Institute for Published by Copernicus Publications on behalf of the European Geosciences Union.
Transcript of Surface modification of mineral dust particles by sulphuric acid ...
Atmos. Chem. Phys., 11, 7839–7858, 2011www.atmos-chem-phys.net/11/7839/2011/doi:10.5194/acp-11-7839-2011© Author(s) 2011. CC Attribution 3.0 License.
AtmosphericChemistry
and Physics
Surface modification of mineral dust particles by sulphuric acidprocessing: implications for ice nucleation abilities
P. Reitz1,2, C. Spindler3, T. F. Mentel3, L. Poulain4, H. Wex4, K. Mildenberger4, D. Niedermeier4, S. Hartmann4,T. Clauss4, F. Stratmann4, R. C. Sullivan5, P. J. DeMott5, M. D. Petters6, B. Sierau7, and J. Schneider1
1Particle Chemistry Department, Max Planck Institute for Chemistry, Mainz, Germany2Institute for Atmospheric Physics, Johannes Gutenberg University Mainz, Mainz, Germany3Institute for Energy- and Climate Research Troposphere (IEK-8), Research Center Julich GmbH, Julich, Germany4Department of Physics, Leibniz Institute for Tropospheric Research, Leipzig, Germany5Department of Atmospheric Science, Colorado State University, Fort Collins, USA6Department of Marine Earth and Atmospheric Science, North Carolina State University, Raleigh, USA7Institute for Atmospheric and Climate Science, ETH Zurich, Zurich, Switzerland
Received: 11 February 2011 – Published in Atmos. Chem. Phys. Discuss.: 2 March 2011Revised: 20 July 2011 – Accepted: 21 July 2011 – Published: 3 August 2011
Abstract. The ability of coated mineral dust particles toact as ice nuclei (IN) was investigated at LACIS (LeipzigAerosol Cloud Interaction Simulator) during the FROST1-and FROST2-campaigns (Freezingof dust). Sulphuric acidwas condensed on the particles which afterwards were op-tionally humidified, treated with ammonia vapour and/orheat. By means of aerosol mass spectrometry we found evi-dence that processing of mineral dust particles with sulphuricacid leads to surface modifications of the particles. Thesesurface modifications are most likely responsible for the ob-served reduction of the IN activation of the particles. The ob-served particle mass spectra suggest that different treatmentslead to different chemical reactions on the particle surface.Possible chemical reaction pathways and products are sug-gested and the implications on the IN efficiency of the treateddust particles are discussed.
1 Introduction
Aerosol particles have various direct and indirect effects onearth climate (Lohmann and Feichter, 2005). One of the im-portant indirect effects is their ability to act as heterogeneousice nuclei. Heterogeneous ice nucleation influences the earthradiation budget by the change of cloud albedo (Kay et al.,
Correspondence to:P. Reitz([email protected])
2007) and plays a major role in the formation of precipita-tion, especially in mid latitudes (Roedel, 2000). The exacteffect of ice clouds on the Earth’s climate is yet not well un-derstood (Forster et al., 2007) and more research is neededto determine the mechanisms of heterogeneous ice nucle-ation (Cantrell and Heymsfield, 2005). Mineral dust has beenfound to be one of the major components of snow crystalresiduals (Kamphus et al., 2010; Mertes et al., 2007; Richard-son et al., 2007; Cziczo et al., 2004; DeMott et al., 2003). Inthe atmosphere mineral dust is often internally mixed withorganic and inorganic material due to particle ageing pro-cesses in the atmosphere (Wiacek and Peter, 2009; Sullivanet al., 2007; Sullivan and Prather, 2007; Hinz et al., 2005;Falkovich et al., 2001). Such additions may influence the ef-ficiency of mineral dust to act as ice nuclei (Sullivan et al.,2010a,b; Niedermeier et al., 2010; Gallavardin et al., 2008;Mohler et al., 2005, 2008). Niedermeier et al.(2010) foundthat active sites were lost when particles were processed withconcentrated sulphuric acid andSullivan et al.(2010b) showthat the loss of these active sites was irreversible. How-ever, the surface processes that lead to the destruction of ac-tive sites are not fully understood. Here we present a studyof reactions taking place on the particle surface of ArizonaTest Dust after processing with sulphuric acid. The exper-iments were performed during the FROST1 and FROST2(Freezingof dust 1 and 2) campaigns at the LACIS (LeipzigAerosol Cloud Interaction Simulator, (Hartmann et al., 2011;Stratmann et al., 2004)) facility located at the Institute for
Published by Copernicus Publications on behalf of the European Geosciences Union.
7840 P. Reitz et al.: Surface modification of mineral dust INs
Tropospheric Research in Leipzig, Germany. A unique com-bination of data from ice nucleus counters, a cloud conden-sation nucleus counter, and from aerosol mass spectrometerspermitted deeper insights into the chemical processes tak-ing place on the particle surface after processing with sul-phuric acid. After condensing sulphuric acid on the particles,they were optionally humidified, chemically neutralised andheated. These treatments and the resulting aerosol propertiesmodifications provided additional information on the natureof the processes taking place on the aerosol particle surfaces.The possibility to link surface modifications to the modifi-cation of freezing behaviour is valuable for attaining betterunderstanding of the key characteristics that are responsiblefor the ability of mineral dust particles to act as ice nuclei.
2 Methods
2.1 Particle generation
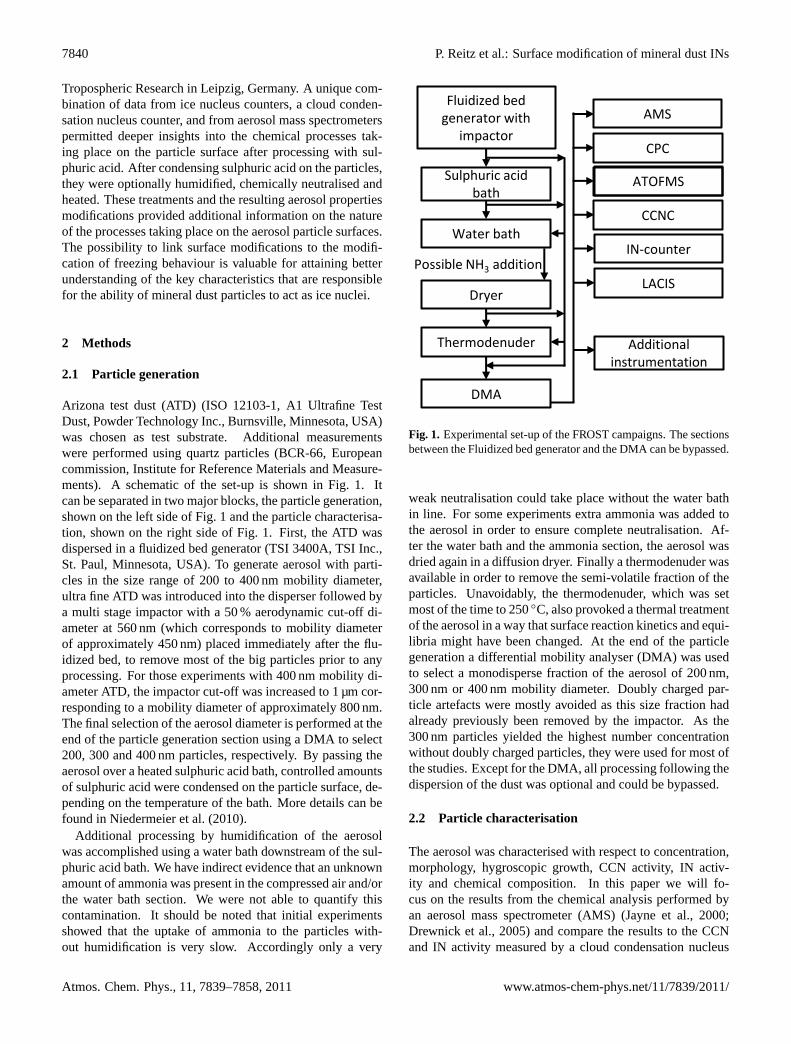
Arizona test dust (ATD) (ISO 12103-1, A1 Ultrafine TestDust, Powder Technology Inc., Burnsville, Minnesota, USA)was chosen as test substrate. Additional measurementswere performed using quartz particles (BCR-66, Europeancommission, Institute for Reference Materials and Measure-ments). A schematic of the set-up is shown in Fig.1. Itcan be separated in two major blocks, the particle generation,shown on the left side of Fig.1 and the particle characterisa-tion, shown on the right side of Fig.1. First, the ATD wasdispersed in a fluidized bed generator (TSI 3400A, TSI Inc.,St. Paul, Minnesota, USA). To generate aerosol with parti-cles in the size range of 200 to 400 nm mobility diameter,ultra fine ATD was introduced into the disperser followed bya multi stage impactor with a 50 % aerodynamic cut-off di-ameter at 560 nm (which corresponds to mobility diameterof approximately 450 nm) placed immediately after the flu-idized bed, to remove most of the big particles prior to anyprocessing. For those experiments with 400 nm mobility di-ameter ATD, the impactor cut-off was increased to 1 µm cor-responding to a mobility diameter of approximately 800 nm.The final selection of the aerosol diameter is performed at theend of the particle generation section using a DMA to select200, 300 and 400 nm particles, respectively. By passing theaerosol over a heated sulphuric acid bath, controlled amountsof sulphuric acid were condensed on the particle surface, de-pending on the temperature of the bath. More details can befound inNiedermeier et al.(2010).
Additional processing by humidification of the aerosolwas accomplished using a water bath downstream of the sul-phuric acid bath. We have indirect evidence that an unknownamount of ammonia was present in the compressed air and/orthe water bath section. We were not able to quantify thiscontamination. It should be noted that initial experimentsshowed that the uptake of ammonia to the particles with-out humidification is very slow. Accordingly only a very
Fluidized bed generator with
impactor
Sulphuric acid bath
Water bath
Dryer
Thermodenuder
DMA
AMS
CPC
CCNC
IN-counter
Additional instrumentation
Possible NH3 addition
LACIS
ATOFMS
Fig. 1. Experimental set-up of the FROST campaigns. The sectionsbetween the Fluidized bed generator and the DMA can be bypassed.
weak neutralisation could take place without the water bathin line. For some experiments extra ammonia was added tothe aerosol in order to ensure complete neutralisation. Af-ter the water bath and the ammonia section, the aerosol wasdried again in a diffusion dryer. Finally a thermodenuder wasavailable in order to remove the semi-volatile fraction of theparticles. Unavoidably, the thermodenuder, which was setmost of the time to 250◦C, also provoked a thermal treatmentof the aerosol in a way that surface reaction kinetics and equi-libria might have been changed. At the end of the particlegeneration a differential mobility analyser (DMA) was usedto select a monodisperse fraction of the aerosol of 200 nm,300 nm or 400 nm mobility diameter. Doubly charged par-ticle artefacts were mostly avoided as this size fraction hadalready previously been removed by the impactor. As the300 nm particles yielded the highest number concentrationwithout doubly charged particles, they were used for most ofthe studies. Except for the DMA, all processing following thedispersion of the dust was optional and could be bypassed.
2.2 Particle characterisation
The aerosol was characterised with respect to concentration,morphology, hygroscopic growth, CCN activity, IN activ-ity and chemical composition. In this paper we will fo-cus on the results from the chemical analysis performed byan aerosol mass spectrometer (AMS) (Jayne et al., 2000;Drewnick et al., 2005) and compare the results to the CCNand IN activity measured by a cloud condensation nucleus
Atmos. Chem. Phys., 11, 7839–7858, 2011 www.atmos-chem-phys.net/11/7839/2011/

P. Reitz et al.: Surface modification of mineral dust INs 7841
counter (CCNC,Roberts and Nenes, 2005), an ice nucleuscounter (CFDC,Sullivan et al., 2010b, original instrumentversion:Rogers et al.(2001)) and the Leipzig Aerosol CloudInteraction Simulator LACIS (Hartmann et al., 2011; Strat-mann et al., 2004), which measured both CCN and IN effi-ciency. However, this study focuses on the IN data measuredwith LACIS. Data from an Aerosol Time of Flight MassSpectrometer (ATOFMS) (Nordmeyer and Prather, 1994)was used to estimate the number-fraction of particles coated.
2.2.1 Determination of the particle soluble massloadings from CCNC data
A detailed discussion of the hygroscopic growth properties ofthe probed aerosol is given inWex et al.(2011). In the CCNCthe supersaturation was varied in the range of 0.07 to 0.6 %supersaturation and the number concentration fraction of ac-tivated particles was recorded. The supersaturation at which50 % of the particles were activated as cloud droplets wasconsidered to be the critical supersaturation. As the aerosolis nearly monodisperse, the curves obtained show a relativelysteep increase at a given supersaturation. To facilitate com-parisons between AMS data and CCNC data, soluble massloadings per particle have been calculated using single pa-rameter Kohler theory (Petters and Kreidenweis, 2007; Wexet al., 2007). At the supersaturationScrit at which the par-ticles activate, the maximum of the Kohler curve was cal-culated to determine the apparent hygroscopicity parameterκapp which can then be compared toκcoat of the pure sub-stance used as the coating material. Equation (1) shows theKohler equation linking the wet sizeD of a particle to thesaturation ratioS needed.
S(D) =
D3−D3
dry
D3−D3dry(1−κapp)
expA
D(1)
Ddry is the dry diameter of the particle andA is a constantthat depends on the temperature and the surface tension at thesolute/air interface. We use the term “apparent” hygroscop-icity, as we determine the intrinsic hygroscopicity, biased bythe possibly limited solubility of a fraction of the particle ma-terial (Sullivan et al., 2009b; Petters and Kreidenweis, 2008).The apparent hygroscopicity is the additive value of the ap-parent hygroscopicities of individual components of the par-ticle weighted by their volume fractions. Withκcoat beingthe hygroscopicity parameter of the coating substance,κATDbeing the hygroscopicity parameter of the unprocessed ATDandεcoat andεATD their respective volume fractions, we getEq. (2) for κapp:
κapp= εcoatκcoat+εATDκATD (2)
As the sum of the volume fractions must be equal to 1(εcoat+ εATD = 1), Eq. (2) can be rearranged to get the vol-ume fraction of the coating (Sullivan et al., 2009a). This vol-ume fraction can be multiplied by the particle volume and
the density of the coating material, yielding the mass of thesoluble fraction of the particle (Eq.3). κapp of the ATD wasfound to be 0.002 (Sullivan et al., 2010b).
msoluble= ρsoluble×Vcoat
= ρsoluble×Vtotal×εcoat
= ρsoluble×Vtotal×κapp−κATD
κcoat−κATD(3)
This method works best if no reactions take place on theparticle surface, as these can result in the formation of un-known substances for which the hygroscopicity parameterand the density are no longer exactly known.
2.2.2 Determination of IN efficiency
The CFDC is a continuous flow diffusion chamber. Thedry aerosol enters a region between two cylinders which arecoated with ice and set to a controlled temperature. By cre-ating a temperature gradient between the cylinder walls, thesaturation ratio between the walls can be controlled. Particleswhich activate and grow to ice crystals are counted with anoptical particle counter at the end of the chamber. The instru-ment can measure both in immersion/condensation freezingmode (particles activate as cloud droplets before freezing) aswell as in deposition freezing mode (water vapour directlydeposits on the particles to form ice without prior activationof the particles as liquid droplets). The different freezingmodes are described inPruppacher and Klett(1997). Detailsabout the CFDC chamber used during the FROST2 campaignare described inSullivan et al.(2010b).
In the LACIS chamber, moisture conditioned aerosol iscooled down in a laminar flow tube in order to achieve super-saturation above water. The supersaturation and the temper-ature of the aerosol are controlled via the wall temperaturesand the initial air moisture. Downstream of the activationof the particles to droplets, further cooling occurs, that caneventually lead to the freezing of the droplets. At the out-let an optical particle counter is used to detect the ice andthe droplets formed. Ice is formed in the immersion freezingmode. Details about the LACIS chamber and its use as an icenucleation instrument are given inHartmann et al.(2011).Both CFDC and LACIS data are shown in Figs.10 and11,respectively.
2.2.3 Determination of the chemical composition of theparticles’ non refractory fraction
In the AMS particles of 40 nm to 1000 nm vacuum aerody-namic diameter are focused on a narrow particle beam us-ing an aerodynamic lens. 100 % transmission is achieved forparticles in the range from 60 nm to 600 nm vacuum aerody-namic diameter (Liu et al., 2007). The focused particle beamis introduced into a differentially pumped vacuum chamberand directed onto a thermal vaporiser whose temperature was
www.atmos-chem-phys.net/11/7839/2011/ Atmos. Chem. Phys., 11, 7839–7858, 2011
7842 P. Reitz et al.: Surface modification of mineral dust INs
set to 600◦C or 820◦C. The use of two different evaporationtemperatures provided additional information on the volatil-ity of the particle material, allowing further restriction of itspossible composition. The produced vapour is ionized by70 eV electron impaction and the positive ion fraction is fo-cused into an orthogonal extraction time-of-flight mass spec-trometer.
The main objective of the AMS measurements was toquantify the amount of sulphuric acid condensed on the par-ticle surface. The temperatures set at the AMS vaporiser arefar too low to evaporate mineral dust like ATD (melting pointaccording to manufacturer: 1615±75◦C). Rather, the instru-ment is sensitive to the more volatile fraction of the particles,thereby enabling the detection of even very low amounts ofnon-refractory material on the refractory particle cores. Asthe aerosol was quasi monodisperse, the average mass perparticle could be calculated by normalising the mass concen-trations given by the AMS to the particle number concen-tration from a condensation particle counter (CPC) that wasoperated parallel to the AMS.
To accurately quantify the mass per particle of the sul-phuric acid and its chemical reaction products, the AMSmass concentrations must be corrected for systematic errors.These include deviations of the relative ionisation efficiency(RIE) from the standard values and the collection efficiency(CE) of the instrument for ATD like particles. The particlesize range used in this study exceeded 600 nm in vacuumaerodynamic diameter, which is the maximum particle sizewhich is transmitted without losses into the instrument. Theamount of particles lost in the instrument inlet has been cal-culated and the data was corrected for these losses. Detailsabout the calculation of the correction factors are presentedin the appendix (Sect.A).
In addition to the AMS, an Aerosol Time of Flight MassSpectrometer (ATOFMS; TSI Model 3800) was used in thisstudy to determine aerodynamic size and chemical composi-tion of single particles. It uses an aerodynamic sizing tech-nique to measure particle size and time of flight mass spec-trometry to determine the chemical composition of particlesof unit mass resolution. Particles in the size range betweenapproximately 200–3000 nm are drawn into the instrumentthrough a nozzle inlet and are first aerodynamically sized bymeasuring their transit time in between two laser beams ofknown distance. Downstream of the sizing region, the parti-cles reach the ion source region where the particles are hit bypulsed UV laser fires that induces laser desorption/ionisation.Due to the bipolar design of the mass spectrometer, a positiveand a negative ion spectrum are acquired from each particle.
The main differences compared to the AMS are the capa-bility of the ATOFMS to analyse single particles, as well asto collect information on refractory materials such as sodiumchloride, elemental carbon and mineral dust constituents dueto the different ionisation method applied. However, com-pared to the AMS, the ATOFMS does not measure mass con-centrations. A common method to analyse ATOFMS spectra
is to classify analysed particles into groups of certain massspectrometric signatures (e.g.:Kamphus et al., 2010) whichwas also done in the context of this experiment. Particlesshowing a peak atm/z = −97 (HSO−
4 ) in the mass spectrawere identified as sulphates. Applying different peak thresh-olds (conservative: peak area>1000 a.u.; less conservative:peak height>50 a.u.), the number fraction of particles thatproduce a sulphate ion signal could be determined.
3 Results and discussion
The presentation of the results starts with the identification ofchemical compounds found in the non-refractory fraction ofthe ATD followed by the quantification of the average massper particle for the main species. We show evidence for reac-tions of the sulphuric acid with the particle surface and pro-pose possible products for these reactions depending on theapplied treatments. The mass per particle loadings, as de-duced from the AMS data, are compared to the soluble massfractions calculated from the CCNC activation curves. Thiscomparison allows for further restricting the possible prod-ucts on the particles’ surface. Finally, the effects of the dif-ferent treatments are linked to the IN-fractions determined bythe CFDC and LACIS, to show their effects on the IN-abilityof ATD.
In general, for all particles the mass per particle was cal-culated for the species organics, sulphate, ammonium andsilicone. The species chloride and nitrate were always be-low the AMS detection limits. The detection limits havebeen calculated from the amplitude of the noise of the back-ground signal similar as inDrewnick et al.(2009) using analgorithm described inReitz and Schneider(2011) to sepa-rate long scale background fluctuations from statistic noise.The correction factors described in Sect.2 were applied to allspecies.
3.1 Average non-refractory mass per particle
The average non-refractory mass per particle was determinedby normalising the mass concentrations of carbon containingmaterial (CCM), sulphate, ammonium and silicone measuredwith the AMS to the particle number concentration measuredby a CPC. The term CCM was introduced instead of the termorganics, as it also contains carbonates and methyl silicone,which cannot be clearly distinguished from organic material.The fragmentation table is the same as for organics (Allanet al., 2004). The ATOFMS data show that, depending onthe respective signal area threshold used, 84 to 97 % or 93to 100 % of the particles contained sulphate after passing thesulphuric acid coating section. Based on the signal qualityof the individual mass spectra, the less conservative thresh-old can be applied for the investigated experiments. How-ever, sulphate peaks were also detected for “pure” ATD par-ticles, which makes the identification of sulphate compounds
Atmos. Chem. Phys., 11, 7839–7858, 2011 www.atmos-chem-phys.net/11/7839/2011/

P. Reitz et al.: Surface modification of mineral dust INs 7843
10-6
10-5
10-4
10-3
10-2
10-1
100
101
102
mas
s co
ncen
trat
ion
/ µg/
m³
14012010080604020m/z
Air Water Nitrate Sulphate CCM Ammonium Chloride Other
55 56 57
73 (silicone)
147 (silicone)
Fig. 2a. Average AMS mass spectrum for unprocessed ATD during the FROST1 campaign. The AMS vaporiser was set to 600◦C. Notableare the clear peaks that can be attributed to methyl silicone contaminant.
10-6
10-5
10-4
10-3
10-2
10-1
100
101
102
Nitr
ate
equi
vale
nt m
ass
/ µg/
m³
14012010080604020m/z
Air Water Nitrate Sulphate CCM Ammonium Chloride Other
23Na
+
44 (CO2+)
39K
+
41K
+
73 (silicone)
85Rb
+
87Rb
+
133Cs
+
135Ba
+
147 (silicone)
Fig. 2b. Average AMS mass spectrum for untreated ATD during the FROST2 campaign. Beside the silicone peaks already visible duringFROST1, some new very distinct metal peaks show up in this spectrum, due to the elevated vaporiser temperature of 820◦C: 23Na+, 39K+,41K+, 85Rb+, 87Rb+, 133Cs+ and135Ba+.
on the particles somewhat ambiguous. The fraction of pureATD particles that showed a sulphate peak ranges from 3to 8 % and 5 to 46 % using similar threshold definitions asdescribed above. The fact that a small fraction of the coatedparticles showed no sulphate peak in the ATOFMS is likelyrelated to the very low amounts of sulphate on the particlesurface. Due to this it is possible that even when sulphate waspresent, it did not necessarily produce a significant signal inthe ATOFMS. The CCNC data also indicated that the aerosolwas not externally mixed, as the activation of the particles
took place in a small supersaturation interval without show-ing multiple steps. This would have been expected in caseof an uncoated fraction (Wex et al., 2011). A compilation ofthe coated particle fraction determined with the ATOFMS isshown in Table1.
Figure2ato 2cshow average mass spectra recorded duringthe FROST1 and FROST2 campaign for particles of 200 nmand 300 nm, respectively. No correction factors have beenapplied for these graphs. Figure2ashows the data measuredusing ATD without sulphuric acid processing. Two clear
www.atmos-chem-phys.net/11/7839/2011/ Atmos. Chem. Phys., 11, 7839–7858, 2011
7844 P. Reitz et al.: Surface modification of mineral dust INs
10-6
10-5
10-4
10-3
10-2
10-1
100
101
102
Nitr
ate
equi
vale
nt m
ass
/ µg/
m³
14012010080604020m/z
Air Water Nitrate Sulphate CCM Ammonium Chloride Other
23Na
+
39K
+
41K
+
44 (CO2+)
85Rb
+
87Rb
+
133Cs
+
135Ba
+
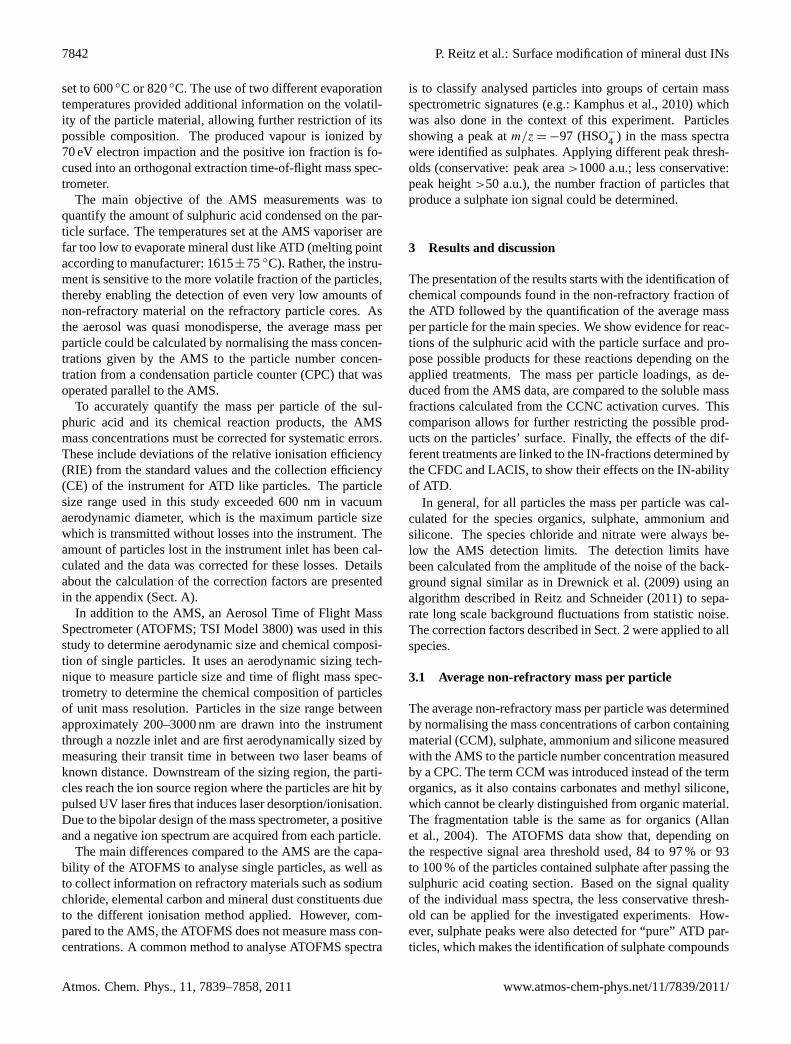
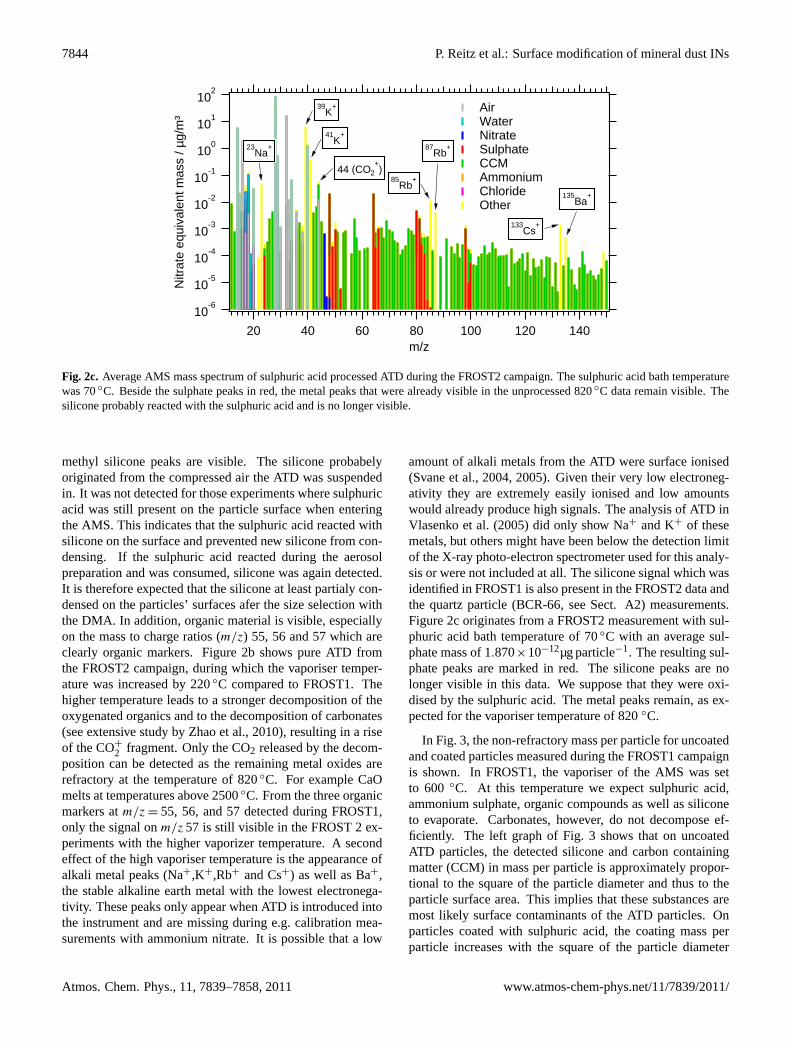
Fig. 2c. Average AMS mass spectrum of sulphuric acid processed ATD during the FROST2 campaign. The sulphuric acid bath temperaturewas 70◦C. Beside the sulphate peaks in red, the metal peaks that were already visible in the unprocessed 820◦C data remain visible. Thesilicone probably reacted with the sulphuric acid and is no longer visible.
methyl silicone peaks are visible. The silicone probabelyoriginated from the compressed air the ATD was suspendedin. It was not detected for those experiments where sulphuricacid was still present on the particle surface when enteringthe AMS. This indicates that the sulphuric acid reacted withsilicone on the surface and prevented new silicone from con-densing. If the sulphuric acid reacted during the aerosolpreparation and was consumed, silicone was again detected.It is therefore expected that the silicone at least partialy con-densed on the particles’ surfaces afer the size selection withthe DMA. In addition, organic material is visible, especiallyon the mass to charge ratios (m/z) 55, 56 and 57 which areclearly organic markers. Figure2b shows pure ATD fromthe FROST2 campaign, during which the vaporiser temper-ature was increased by 220◦C compared to FROST1. Thehigher temperature leads to a stronger decomposition of theoxygenated organics and to the decomposition of carbonates(see extensive study byZhao et al., 2010), resulting in a riseof the CO+
2 fragment. Only the CO2 released by the decom-position can be detected as the remaining metal oxides arerefractory at the temperature of 820◦C. For example CaOmelts at temperatures above 2500◦C. From the three organicmarkers atm/z = 55, 56, and 57 detected during FROST1,only the signal onm/z 57 is still visible in the FROST 2 ex-periments with the higher vaporizer temperature. A secondeffect of the high vaporiser temperature is the appearance ofalkali metal peaks (Na+,K+,Rb+ and Cs+) as well as Ba+,the stable alkaline earth metal with the lowest electronega-tivity. These peaks only appear when ATD is introduced intothe instrument and are missing during e.g. calibration mea-surements with ammonium nitrate. It is possible that a low
amount of alkali metals from the ATD were surface ionised(Svane et al., 2004, 2005). Given their very low electroneg-ativity they are extremely easily ionised and low amountswould already produce high signals. The analysis of ATD inVlasenko et al.(2005) did only show Na+ and K+ of thesemetals, but others might have been below the detection limitof the X-ray photo-electron spectrometer used for this analy-sis or were not included at all. The silicone signal which wasidentified in FROST1 is also present in the FROST2 data andthe quartz particle (BCR-66, see Sect.A2) measurements.Figure2c originates from a FROST2 measurement with sul-phuric acid bath temperature of 70◦C with an average sul-phate mass of 1.870×10⁻¹²µg particle−1. The resulting sul-phate peaks are marked in red. The silicone peaks are nolonger visible in this data. We suppose that they were oxi-dised by the sulphuric acid. The metal peaks remain, as ex-pected for the vaporiser temperature of 820◦C.
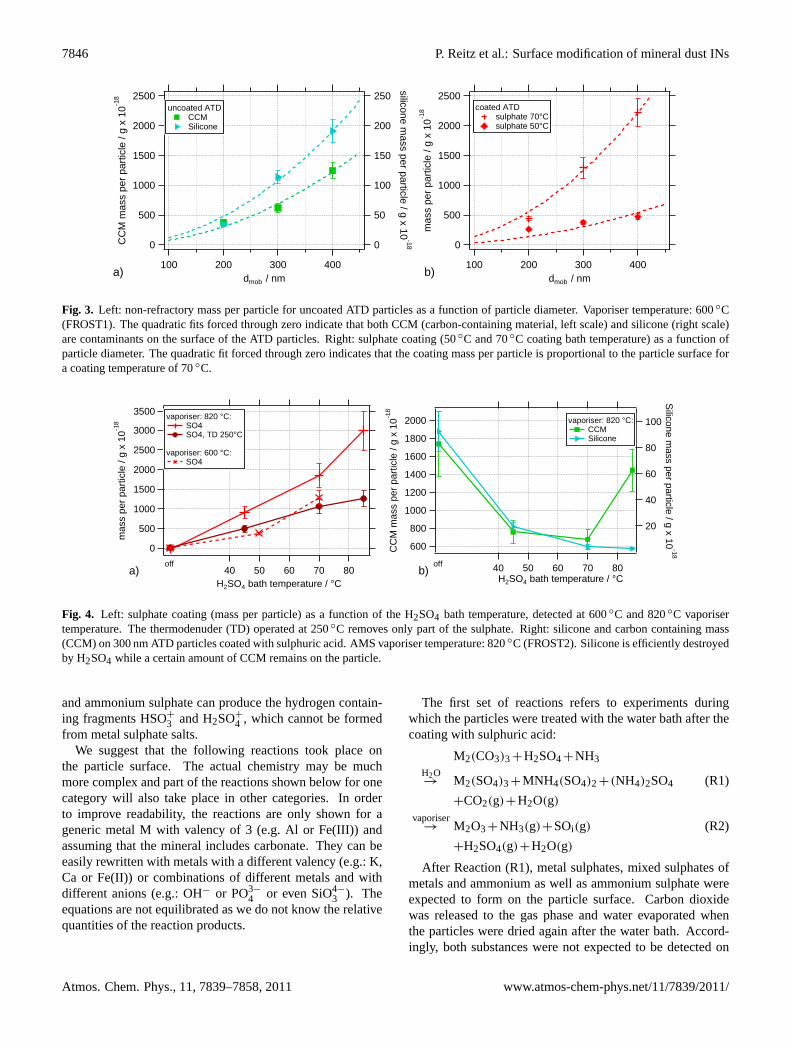
In Fig.3, the non-refractory mass per particle for uncoatedand coated particles measured during the FROST1 campaignis shown. In FROST1, the vaporiser of the AMS was setto 600 ◦C. At this temperature we expect sulphuric acid,ammonium sulphate, organic compounds as well as siliconeto evaporate. Carbonates, however, do not decompose ef-ficiently. The left graph of Fig.3 shows that on uncoatedATD particles, the detected silicone and carbon containingmatter (CCM) in mass per particle is approximately propor-tional to the square of the particle diameter and thus to theparticle surface area. This implies that these substances aremost likely surface contaminants of the ATD particles. Onparticles coated with sulphuric acid, the coating mass perparticle increases with the square of the particle diameter
Atmos. Chem. Phys., 11, 7839–7858, 2011 www.atmos-chem-phys.net/11/7839/2011/

P. Reitz et al.: Surface modification of mineral dust INs 7845
Table 1. Compilation of the percentage of particles showing a clear sulphate signal in the ATOFMS spectra after passing the sulphuric acidcoating section. The temperature indicated is the temperature of the sulphuric acid coating bath. TD indicates the use of the thermodenuderwhich, if applied, was set to 250◦C for all experiments. WB marks experiments with the water bath in use and NH3 refers to experimentsduring which ammonia was added to the aerosol.
Experiment 45◦C 70◦C 70◦C 70◦C 70◦C 85◦CWB WBNH3 NH3
TD TD
Conservative threshold [%] 97 92 96 84 93 89Less conservative threshold [%] 100 95 100 93 95 94
(Fig. 3, right graph) when the sulphuric acid bath is oper-ated at 70◦C. For particles which were coated at a tem-perature of 50◦C the increase in sulphate is lower than theincrease in surface area. It is possible that at lower H2SO4bath temperatures (50◦C) insufficient H2SO4 is released tothe gas phase to coat larger particles with the same thicknessas smaller particles. However, for the later evaluation this isnot relevant.
Figure4 shows the measured mass per particle values for300 nm particles as a function of the coating bath temper-ature. The left graph of Fig.4 shows the amount of coat-ing material as a function of the coating bath temperature.As expected we find an increase of sulphate with increasingbath temperature. This increase is larger for 820◦C vaporisertemperature than for 600◦C, indicating that a certain amountof sulphate is not evaporated at 600◦C. Experiments withthe thermodenuder in operation at 250◦C also indicate thata certain amount of the sulphate coating is not evaporated at250◦C.
Average coating thicknesses could be estimated assumingthat the surface area of the ATD particles was equal to thesurface area of a sphere with the same mobility diameterthan the ATD particles. The coating thickness was estimatedto 1.8 nm for the lowest coating temperature of 45◦C whensulphuric acid was condensed on the particle surface with-out further processing. For the highest temperature a coatingthickness of 7 nm was estimated.
The right graph in Fig.4 shows that CCM and siliconedecreased with increasing bath temperature, as both speciespotentially react with sulphuric acid. Also for the 200 nmparticles (not shown), the silicone signal is reduced to zerofor 70◦C coating temperature and also shows a reduction at45 and 50◦C. In contrast, CCM is not reduced at higherH2SO4 bath temperatures (Fig.4, right graph).
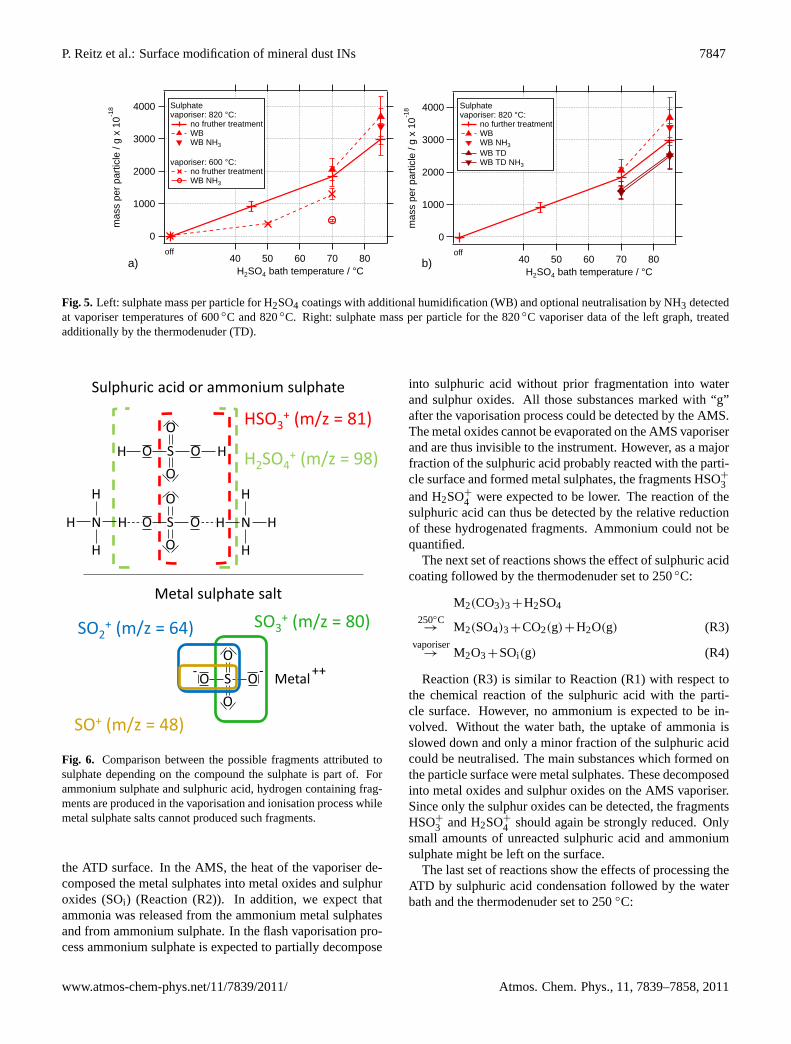
To study the influence of humidity and neutralisation byammonia, particles were humidified after the coating and af-terwards optionally exposed to an elevated ammonia gas con-centration. The left graph of Fig.5 shows the sulphate massper particle for these experiments with 300 nm particles forvaporiser temperatures of 600◦C and 820◦C.
Interestingly, the sulphate signal is clearly reduced afterthis processing for the lower vaporiser temperature, while itis increased for higher vaporiser temperatures. This indicatesa reaction of H2SO4 with some particle components, forminga reaction product that cannot be evaporated by the AMS at600◦C but at 820◦C. Further indication for such a reactionis the finding that silicon is not removed as effectively duringthese experiments than it is during the experiments withouthumidification. Thus, humidification appears to acceleratethe reaction of H2SO4 with the surface components of theparticle.
The right graph of Fig.5 shows the data for 820◦C va-poriser temperature and data where the thermodenuder wasadditionally applied at 250◦C. There is a reduction of thesulphate signal by 10 to 20 % for both data sets (with andwithout NH3), but the decrease of the sulphate signal is byfar smaller than in Fig.4 (right graph) where the pure H2SO4coating was treated by the thermodenuder. This is a furtherindication for the accelerated reaction by humidifying thecoated particles, leading to the formation of a low-volatilityproduct.
The addition of ammonia to the aerosol has no clear effectto any of the experiments. Nevertheless, for those experi-ments with the water bath in use, the amount of ammoniumdetected is increased. In the case of the experiments witha coating bath temperature of 85◦C, the experiments withwater bath provided sufficient ammonia for neutralisation ofabout 50 % of the sulphuric acid. These two experiments arethe only experiments for which the ammonium signal washigh enough to be detected. With the thermodenuder, theammonium signal is reduced by approximately a factor offour but could not be quantified anymore.
3.2 ATD surface reactions
Analysing the effects of the thermodenuder and applyingthe water bath gave insight into the possible reactions tak-ing place on the particle surface. For that we analysed themass per particle and the fragmentation pattern. Figure6shows the expected fragmentation for sulphuric acid, ammo-nium sulphate and metal sulphate salts. Only sulphuric acid
www.atmos-chem-phys.net/11/7839/2011/ Atmos. Chem. Phys., 11, 7839–7858, 2011
7846 P. Reitz et al.: Surface modification of mineral dust INs
2500
2000
1500
1000
500
0
mas
s pe
r pa
rtic
le /
g x
10-1
8
400300200100dmob / nm
coated ATD sulphate 70°C sulphate 50°C
2500
2000
1500
1000
500
0CC
M m
ass
per
part
icle
/ g
x 10
-18
400300200100dmob / nm
250
200
150
100
50
0
silicone mass per particle / g x 10
-18
uncoated ATD CCM Silicone
a) b)
Fig. 3. Left: non-refractory mass per particle for uncoated ATD particles as a function of particle diameter. Vaporiser temperature: 600◦C(FROST1). The quadratic fits forced through zero indicate that both CCM (carbon-containing material, left scale) and silicone (right scale)are contaminants on the surface of the ATD particles. Right: sulphate coating (50◦C and 70◦C coating bath temperature) as a function ofparticle diameter. The quadratic fit forced through zero indicates that the coating mass per particle is proportional to the particle surface fora coating temperature of 70◦C.
3500
3000
2500
2000
1500
1000
500
0
mas
s pe
r pa
rtic
le /
g x
10-1
8
8070605040H2SO4 bath temperature / °C
vaporiser: 820 °C: SO4 SO4, TD 250°C
vaporiser: 600 °C:
SO4
off
2000
1800
1600
1400
1200
1000
800
600CC
M m
ass
per
part
icle
/ g
x 10
-18
8070605040H2SO4 bath temperature / °C
100
80
60
40
20
Silicone m
ass per particle / g x 10-18
vaporiser: 820 °C: CCM Silicone
off a) b)
Fig. 4. Left: sulphate coating (mass per particle) as a function of the H2SO4 bath temperature, detected at 600◦C and 820◦C vaporisertemperature. The thermodenuder (TD) operated at 250◦C removes only part of the sulphate. Right: silicone and carbon containing mass(CCM) on 300 nm ATD particles coated with sulphuric acid. AMS vaporiser temperature: 820◦C (FROST2). Silicone is efficiently destroyedby H2SO4 while a certain amount of CCM remains on the particle.
and ammonium sulphate can produce the hydrogen contain-ing fragments HSO+3 and H2SO+
4 , which cannot be formedfrom metal sulphate salts.
We suggest that the following reactions took place onthe particle surface. The actual chemistry may be muchmore complex and part of the reactions shown below for onecategory will also take place in other categories. In orderto improve readability, the reactions are only shown for ageneric metal M with valency of 3 (e.g. Al or Fe(III)) andassuming that the mineral includes carbonate. They can beeasily rewritten with metals with a different valency (e.g.: K,Ca or Fe(II)) or combinations of different metals and withdifferent anions (e.g.: OH− or PO3−
4 or even SiO4−
3 ). Theequations are not equilibrated as we do not know the relativequantities of the reaction products.
The first set of reactions refers to experiments duringwhich the particles were treated with the water bath after thecoating with sulphuric acid:
M2(CO3)3+H2SO4+NH3H2O→ M2(SO4)3+MNH4(SO4)2+(NH4)2SO4 (R1)
+CO2(g)+H2O(g)
vaporiser→ M2O3+NH3(g)+SOi(g) (R2)
+H2SO4(g)+H2O(g)
After Reaction (R1), metal sulphates, mixed sulphates ofmetals and ammonium as well as ammonium sulphate wereexpected to form on the particle surface. Carbon dioxidewas released to the gas phase and water evaporated whenthe particles were dried again after the water bath. Accord-ingly, both substances were not expected to be detected on
Atmos. Chem. Phys., 11, 7839–7858, 2011 www.atmos-chem-phys.net/11/7839/2011/
P. Reitz et al.: Surface modification of mineral dust INs 7847
4000
3000
2000
1000
0
mas
s pe
r pa
rtic
le /
g x
10-1
8
8070605040H2SO4 bath temperature / °C
Sulphatevaporiser: 820 °C:
no fruther treatment WB WB NH3
vaporiser: 600 °C:
no fruther treatment WB NH3
off
4000
3000
2000
1000
0
mas
s pe
r pa
rtic
le /
g x
10-1
8
8070605040H2SO4 bath temperature / °C
Sulphatevaporiser: 820 °C:
no further treatment WB WB NH3
WB TD WB TD NH3
off a) b)
Fig. 5. Left: sulphate mass per particle for H2SO4 coatings with additional humidification (WB) and optional neutralisation by NH3 detectedat vaporiser temperatures of 600◦C and 820◦C. Right: sulphate mass per particle for the 820◦C vaporiser data of the left graph, treatedadditionally by the thermodenuder (TD).
S O
O
O
O Metal
HSO3+ (m/z = 81)
S O
O
O
O HH
S O
O
O
O H N H
H
H
H N H
H
H
H2SO4+ (m/z = 98)
SO3+ (m/z = 80) SO2
+ (m/z = 64)
SO+ (m/z = 48)
Sulphuric acid or ammonium sulphate
Metal sulphate salt S
O
O O
OM
etal
SO
O O
OM
etal
- - ++
Fig. 6. Comparison between the possible fragments attributed tosulphate depending on the compound the sulphate is part of. Forammonium sulphate and sulphuric acid, hydrogen containing frag-ments are produced in the vaporisation and ionisation process whilemetal sulphate salts cannot produced such fragments.
the ATD surface. In the AMS, the heat of the vaporiser de-composed the metal sulphates into metal oxides and sulphuroxides (SOi) (Reaction (R2)). In addition, we expect thatammonia was released from the ammonium metal sulphatesand from ammonium sulphate. In the flash vaporisation pro-cess ammonium sulphate is expected to partially decompose
into sulphuric acid without prior fragmentation into waterand sulphur oxides. All those substances marked with “g”after the vaporisation process could be detected by the AMS.The metal oxides cannot be evaporated on the AMS vaporiserand are thus invisible to the instrument. However, as a majorfraction of the sulphuric acid probably reacted with the parti-cle surface and formed metal sulphates, the fragments HSO+
3and H2SO+
4 were expected to be lower. The reaction of thesulphuric acid can thus be detected by the relative reductionof these hydrogenated fragments. Ammonium could not bequantified.
The next set of reactions shows the effect of sulphuric acidcoating followed by the thermodenuder set to 250◦C:
M2(CO3)3+H2SO4
250◦C→ M2(SO4)3+CO2(g)+H2O(g) (R3)
vaporiser→ M2O3+SOi(g) (R4)
Reaction (R3) is similar to Reaction (R1) with respect tothe chemical reaction of the sulphuric acid with the parti-cle surface. However, no ammonium is expected to be in-volved. Without the water bath, the uptake of ammonia isslowed down and only a minor fraction of the sulphuric acidcould be neutralised. The main substances which formed onthe particle surface were metal sulphates. These decomposedinto metal oxides and sulphur oxides on the AMS vaporiser.Since only the sulphur oxides can be detected, the fragmentsHSO+
3 and H2SO+
4 should again be strongly reduced. Onlysmall amounts of unreacted sulphuric acid and ammoniumsulphate might be left on the surface.
The last set of reactions show the effects of processing theATD by sulphuric acid condensation followed by the waterbath and the thermodenuder set to 250◦C:
www.atmos-chem-phys.net/11/7839/2011/ Atmos. Chem. Phys., 11, 7839–7858, 2011
7848 P. Reitz et al.: Surface modification of mineral dust INs
0.15
0.10
0.05
0.00
arb
itra
ry u
nits
Thermo-denuder
NH3
special
45° 70°
lr
Water bath
HSO 3
+ (m/z = 81)
H 2 SO 4
+ (m/z = 98)
250° 250° 250° 250° 250° 250° 250°
45 °C 70 °C 85 °C H2SO4
Temp.
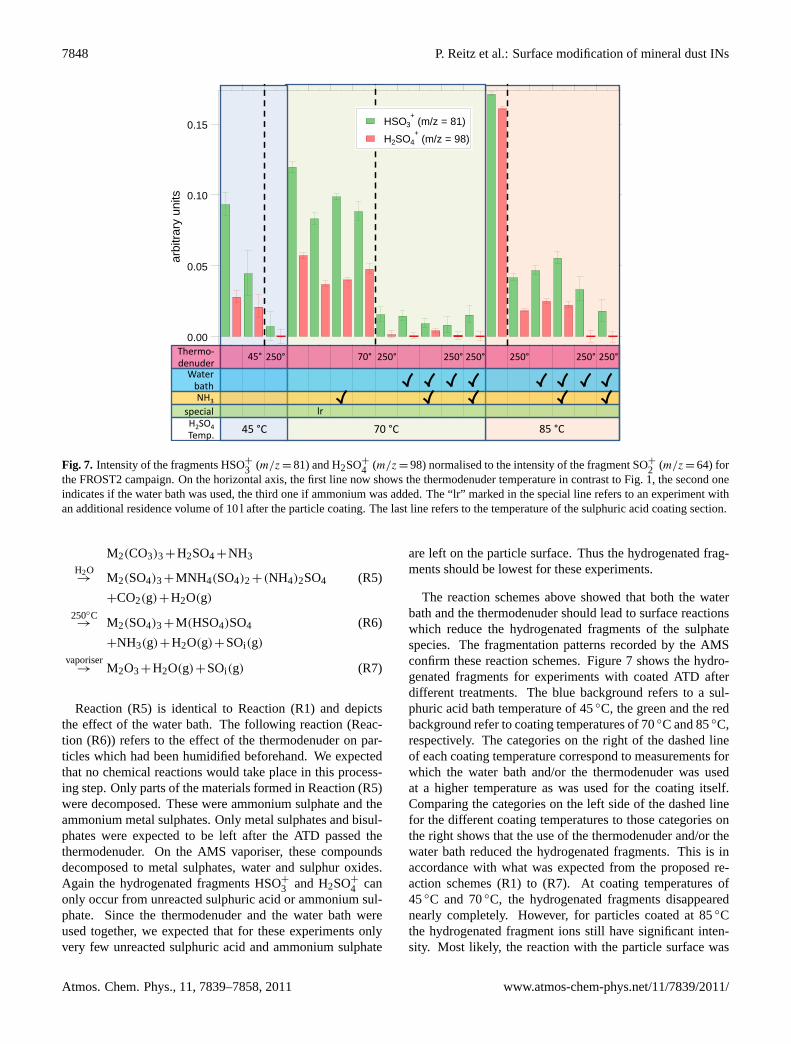
Fig. 7. Intensity of the fragments HSO+3 (m/z = 81) and H2SO+
4 (m/z = 98) normalised to the intensity of the fragment SO+
2 (m/z = 64) forthe FROST2 campaign. On the horizontal axis, the first line now shows the thermodenuder temperature in contrast to Fig. 1, the second oneindicates if the water bath was used, the third one if ammonium was added. The “lr” marked in the special line refers to an experiment withan additional residence volume of 10 l after the particle coating. The last line refers to the temperature of the sulphuric acid coating section.
M2(CO3)3+H2SO4+NH3H2O→ M2(SO4)3+MNH4(SO4)2+(NH4)2SO4 (R5)
+CO2(g)+H2O(g)
250◦C→ M2(SO4)3+M(HSO4)SO4 (R6)
+NH3(g)+H2O(g)+SOi(g)
vaporiser→ M2O3+H2O(g)+SOi(g) (R7)
Reaction (R5) is identical to Reaction (R1) and depictsthe effect of the water bath. The following reaction (Reac-tion (R6)) refers to the effect of the thermodenuder on par-ticles which had been humidified beforehand. We expectedthat no chemical reactions would take place in this process-ing step. Only parts of the materials formed in Reaction (R5)were decomposed. These were ammonium sulphate and theammonium metal sulphates. Only metal sulphates and bisul-phates were expected to be left after the ATD passed thethermodenuder. On the AMS vaporiser, these compoundsdecomposed to metal sulphates, water and sulphur oxides.Again the hydrogenated fragments HSO+
3 and H2SO+
4 canonly occur from unreacted sulphuric acid or ammonium sul-phate. Since the thermodenuder and the water bath wereused together, we expected that for these experiments onlyvery few unreacted sulphuric acid and ammonium sulphate
are left on the particle surface. Thus the hydrogenated frag-ments should be lowest for these experiments.
The reaction schemes above showed that both the waterbath and the thermodenuder should lead to surface reactionswhich reduce the hydrogenated fragments of the sulphatespecies. The fragmentation patterns recorded by the AMSconfirm these reaction schemes. Figure7 shows the hydro-genated fragments for experiments with coated ATD afterdifferent treatments. The blue background refers to a sul-phuric acid bath temperature of 45◦C, the green and the redbackground refer to coating temperatures of 70◦C and 85◦C,respectively. The categories on the right of the dashed lineof each coating temperature correspond to measurements forwhich the water bath and/or the thermodenuder was usedat a higher temperature as was used for the coating itself.Comparing the categories on the left side of the dashed linefor the different coating temperatures to those categories onthe right shows that the use of the thermodenuder and/or thewater bath reduced the hydrogenated fragments. This is inaccordance with what was expected from the proposed re-action schemes (R1) to (R7). At coating temperatures of45◦C and 70◦C, the hydrogenated fragments disappearednearly completely. However, for particles coated at 85◦Cthe hydrogenated fragment ions still have significant inten-sity. Most likely, the reaction with the particle surface was
Atmos. Chem. Phys., 11, 7839–7858, 2011 www.atmos-chem-phys.net/11/7839/2011/
P. Reitz et al.: Surface modification of mineral dust INs 7849
3000
2500
2000
1500
1000
500
0
sulp
huric
aci
d m
ass
from
CC
NC
/ g/
part
icle
x10
-18
300025002000150010005000
sulphate mass from AMS / g/particle x10-18
particle sizes:200 nm300 nm400 nm
fit slope = 0.748 ± 0.066
with water bathnot used in fit
CCNC vs AMS linear fit through zero 1:1 line
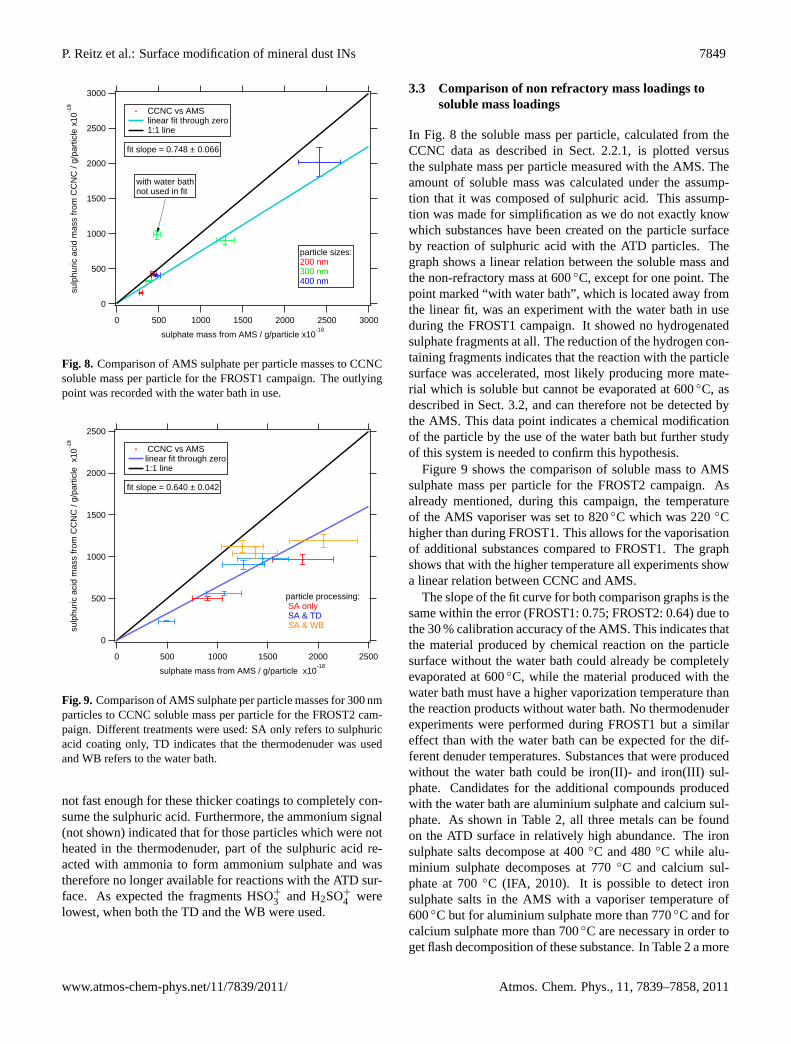
Fig. 8. Comparison of AMS sulphate per particle masses to CCNCsoluble mass per particle for the FROST1 campaign. The outlyingpoint was recorded with the water bath in use.
2500
2000
1500
1000
500
0
sulp
huric
aci
d m
ass
from
CC
NC
/ g/
part
icle
x10
-18
25002000150010005000
sulphate mass from AMS / g/particle x10-18
fit slope = 0.640 ± 0.042
CCNC vs AMSlinear fit through zero1:1 line
particle processing: SA only SA & TD SA & WB
Fig. 9. Comparison of AMS sulphate per particle masses for 300 nmparticles to CCNC soluble mass per particle for the FROST2 cam-paign. Different treatments were used: SA only refers to sulphuricacid coating only, TD indicates that the thermodenuder was usedand WB refers to the water bath.
not fast enough for these thicker coatings to completely con-sume the sulphuric acid. Furthermore, the ammonium signal(not shown) indicated that for those particles which were notheated in the thermodenuder, part of the sulphuric acid re-acted with ammonia to form ammonium sulphate and wastherefore no longer available for reactions with the ATD sur-face. As expected the fragments HSO+
3 and H2SO+
4 werelowest, when both the TD and the WB were used.
3.3 Comparison of non refractory mass loadings tosoluble mass loadings
In Fig. 8 the soluble mass per particle, calculated from theCCNC data as described in Sect.2.2.1, is plotted versusthe sulphate mass per particle measured with the AMS. Theamount of soluble mass was calculated under the assump-tion that it was composed of sulphuric acid. This assump-tion was made for simplification as we do not exactly knowwhich substances have been created on the particle surfaceby reaction of sulphuric acid with the ATD particles. Thegraph shows a linear relation between the soluble mass andthe non-refractory mass at 600◦C, except for one point. Thepoint marked “with water bath”, which is located away fromthe linear fit, was an experiment with the water bath in useduring the FROST1 campaign. It showed no hydrogenatedsulphate fragments at all. The reduction of the hydrogen con-taining fragments indicates that the reaction with the particlesurface was accelerated, most likely producing more mate-rial which is soluble but cannot be evaporated at 600◦C, asdescribed in Sect.3.2, and can therefore not be detected bythe AMS. This data point indicates a chemical modificationof the particle by the use of the water bath but further studyof this system is needed to confirm this hypothesis.
Figure9 shows the comparison of soluble mass to AMSsulphate mass per particle for the FROST2 campaign. Asalready mentioned, during this campaign, the temperatureof the AMS vaporiser was set to 820◦C which was 220◦Chigher than during FROST1. This allows for the vaporisationof additional substances compared to FROST1. The graphshows that with the higher temperature all experiments showa linear relation between CCNC and AMS.
The slope of the fit curve for both comparison graphs is thesame within the error (FROST1: 0.75; FROST2: 0.64) due tothe 30 % calibration accuracy of the AMS. This indicates thatthe material produced by chemical reaction on the particlesurface without the water bath could already be completelyevaporated at 600◦C, while the material produced with thewater bath must have a higher vaporization temperature thanthe reaction products without water bath. No thermodenuderexperiments were performed during FROST1 but a similareffect than with the water bath can be expected for the dif-ferent denuder temperatures. Substances that were producedwithout the water bath could be iron(II)- and iron(III) sul-phate. Candidates for the additional compounds producedwith the water bath are aluminium sulphate and calcium sul-phate. As shown in Table2, all three metals can be foundon the ATD surface in relatively high abundance. The ironsulphate salts decompose at 400◦C and 480◦C while alu-minium sulphate decomposes at 770◦C and calcium sul-phate at 700◦C (IFA, 2010). It is possible to detect ironsulphate salts in the AMS with a vaporiser temperature of600◦C but for aluminium sulphate more than 770◦C and forcalcium sulphate more than 700◦C are necessary in order toget flash decomposition of these substance. In Table2 a more
www.atmos-chem-phys.net/11/7839/2011/ Atmos. Chem. Phys., 11, 7839–7858, 2011

7850 P. Reitz et al.: Surface modification of mineral dust INs
extensive list of possible reaction products is shown togetherwith their respective decomposition temperatures and theirsolubility. For some substances the table contains the meltingtemperature, as this temperature corresponds in good approx-imation to the evaporation temperature under high vacuumconditions prevailing in the AMS. This list of compounds isof course not complete, as a lot of other reaction products arepossible on the ATD surface. The table shows that all com-pounds except CaSO4 have a solubility higher than 100 g l−1
indicating that all of these substances contributed to the ap-parent hygroscopicity determined with the CCNC (Sullivanet al., 2009b; Petters and Kreidenweis, 2008). Consideringthe data point with humidification by the water bath in Fig.8,we cannot explain its behaviour with the formation of CaSO4e.g. from CaCO3 as CaSO4 is not soluble enough to be mea-sured with the CCNC (details inWex et al.(2011).
However this does not exclude that CaSO4 was formedtoo. The additional formation of Al2(SO4)3 from e.g. AlPO4or alumino silicates could explain this behaviour. From theATD analysis byVlasenko et al.(2005) we know that smallamounts of phosphate can be found in ATD. Possible precur-sors of Al2(SO4)3 could also be minerals containing OH−
anions. The proposed reactions are all based on the mate-rial available. Reliable conclusions on the exact chemistry ofthe surface reactions need more investigations, especially todirectly identify the products of the reactions.
3.4 Effect of particle surface modification on IN ability
In this section the number fraction of IN is linked to the re-sults of the AMS data as shown in Figs.10 and11. Moredetails about the evaluation and interpretation of the IN datais presented inSullivan et al.(2010b) (CFDC) andNieder-meier et al.(2010) (LACIS). Both graphs illustrate that thenumber fraction of IN was reduced with increasing amountsof sulphate per particle. In Fig.10 the ice fraction was mea-sured with the CFDC at 105 % relative humidity with respectto water and a freezing temperature of−30◦C. With theseparameters, the analysed freezing mode was condensation orimmersion freezing, meaning that the particles froze duringor shortly after the activation of liquid droplets. The exper-iments with the water bath in use show a lower fraction ofIN than experiments with the same amount of sulphate masson its surface but without the water bath. In Sect.3.2 weshowed that when the particles were humidified by the waterbath, no free, unreacted sulphuric acid was left on the particlesurface. The sulphuric acid either reacted with the surface it-self or was neutralised by the uptake of ammonia. Thereforeit can be concluded that the main reason for the reduction ofthe IN fraction in the immersion/condensation freezing modeis not the coverage of the particle surface with sulphuric acid,but a chemical modification of the surface.
This hypothesis is supported by the comparison of theAMS mass loadings to the IN fractions calculated from theLACIS data shown in Fig.11. All the data from LACIS refer
10-5
10-4
10-3
10-2
10-1
IN-f
ract
ion
3000200010000
particulate sulphate mass from AMS / g/particle x10-18
Immersion/condensation freezingin the CFDC at -30 °C
70 °C85 °C
70 °C
45 °C
pureSA onlyWB
Fig. 10.Comparison of AMS sulphate per particle masses to CFDCice nucleus counter at−30◦C in the immersion-freezing regime(adapted fromSullivan et al., 2010b). Different coating tempera-tures are shown for the different particle classes. The particle classpure includes those experiments with no treatment and no sulphuricacid condensation. The particles class “SA only” includes particleswhich passed the sulphuric acid bath but no further processing wasperformed and WB indicates the use of the water bath. The IN-activity of the ATD is reduced if more sulphuric acid is condensedon the particle surface and the use of the water bath decreases thenumber of IN even further.
10-5
10-4
10-3
10-2
10-1
IN-f
ract
ion
3000200010000
particulate sulphate mass from AMS / g/particle x10-18
pureSA onlyWBWB & TDTD
70 °C
85 °C
45 °C
85 °C
70 °C
70 °C
Immersion freezingin LACIS at -35 °C
45 °C
Fig. 11. Comparison of AMS sulphate per particle masses to theLACIS ice nucleus counts at−35◦C during FROST2. Differentsulphuric acid bath temperatures are shown for every particle class.The particle class pure includes those experiments with no treatmentand no sulphuric acid condensation. The particles class “SA only”includes particles which passed the sulphuric acid bath but no fur-ther processing was performed. WB indicates the use of the waterbath and TD the use of the thermodenuder after the treatment exceptfor the blue point on the upper left which passed the thermodenuderbut was not coated.
to immersion freezing. For the particles with no treatmentafter the condensation of sulphuric acid, the IN fraction wasreduced when the amount of sulphate was increasing. If the
Atmos. Chem. Phys., 11, 7839–7858, 2011 www.atmos-chem-phys.net/11/7839/2011/

P. Reitz et al.: Surface modification of mineral dust INs 7851
Table 2. ATD surface elemental composition from XPS as found byVlasenko et al.(2005) and possible compounds formed with thesesubstances. Mg is expected to be on the particle surface as it is found in the bulk material, but the XPS data was recorded with an Mganticathode, masking the Mg of the sample. The list shown below is only a proposal for possible reaction products based on the availabilityof the respective material. We were not able to directly identify these compounds. The numbers in the two last columns indicate thedecomposition temperatureTd in ◦C and the solubilityS20 at 20◦C in g l−1 (IFA, 2010).
element fraction at ATD surface [%] possible compounds Td S20
Na 2 Na2SO4 890 170NaHSO4 315 1080
Mg - MgSO4 1124 300
Al 24 Al2(SO4)3 770 364AlNH4(SO4)2 1901 150
Si 63 no information - -
K 3 K2SO4 10691 111.1KHSO4 195 490
Fe 3 Fe(II)SO4 400 256Fe(III )2(SO4)3 480 4400
NH4Fe(III )(SO4)2 411,2 12403
Ca 5 CaSO4 700 2
1 Melting temperature,2 source:AlfaAeser(2010), 3 source:Sitzmann(2004) at 25◦C.
water bath is used, the IN fraction is reduced by one order ofmagnitude. This is in accordance with the finding in Sect.3.2where we showed that the use of the water bath reduced theintensity of those sulphate fragments that are typical for thepresence of sulphuric acid. Using the thermodenuder has asimilar but stronger effect. The thermodenuder however notonly favours the surface reactions but it also removed partof the semi-volatile material. This has to be taken into ac-count when interpreting those experiments where the ther-modenuder was used after the water bath. The thermode-nuder has no significant effect on the IN fraction when usedafter the water bath. It only reduces the sulphate mass onthe particle surface to about 70 %, moving the points on thegraph to the left by a factor of approximately 1.5. As all ofthe coating material has already reacted with the surface orwas neutralised due to the improved ammonia uptake on thewet particles, no sulphuric acid is left which could further at-tack active sites due to the heat treatment.Niedermeier et al.(2011) cover more details about the behaviour of the IN frac-tion and show data for different freezing temperatures in theLACIS chamber.
The reduction of the IN-efficiency of ATD through the re-action with sulphuric acid can be explained by the follow-ing hypothesis: the nucleation ability of mineral dust to actas ice nuclei is thought to be linked to surface active sites(Vali, 1985) which may provide a structure similar to that ofice (i.e.: cubic or hexagonal ice), thereby lowering the en-ergy barrier for ice formation to be initialised. Experiments
performed byChoi et al.(2005) indicate that local electricfields present on the particle surface could also act as ac-tive sites. Monte Carlo simulations byCroteau et al.(2010)indicate that trenches in the Kaolinite can order water fer-roelectrically. Such ordered water structures could initialisethe formation of ice. Similar to ATD, Kaolinite is a mineralcomposed of alumino silicates and it could therefore poten-tially be found on the ATD surface. However, this needs fur-ther investigation. Different active site properties not statedhere are also possible as the nature of active sites is still notidentified.
In Sullivan et al.(2010b) we showed that the ATD IN-efficiency is irreversibly altered by the processing with sul-phuric acid. We believe that through reaction with sulphuricacid, active sites were destroyed. Whether this happens viaetching of structures that favour the formation of ice or viachanging the chemical nature of the surface remains unclear.It is also possible that both effects are involved. This hypoth-esis implies that the material forming the active sites can re-act with and/or is etched by sulphuric acid, which reduces thepossible compounds or mixtures of compounds responsiblefor the ATD IN-behaviour. Whether these compounds formstructures, e.g. trenches, which lower the energy barrier toform ice or provide a crystal lattice similar to ice could not beaccessed by these experiments. The substances additionallyformed when the water bath or the thermodenuder was usedwere likely to contain calcium and aluminium. In future lab-oratory studies it would therefore be interesting to analyse
www.atmos-chem-phys.net/11/7839/2011/ Atmos. Chem. Phys., 11, 7839–7858, 2011

7852 P. Reitz et al.: Surface modification of mineral dust INs
pure aluminium and calcium containing minerals which canbe etched by sulphuric acid. As we found that carbonateshave been destroyed by the sulphuric acid, it is possible thatcarbonates are involved in the ice formation as suggested byKlein et al. (2010); Zimmermann et al.(2008); Mason andMaybank(1958), andManson(1957). The comparison ofthe AMS non refractory mass at 600◦C to the soluble massfrom the CCNC, indicates that the destruction of aluminiumand phosphates or hydroxide containing minerals could alsobe involved in the chemical processes on the particle surface.Whether the destruction of such substances is linked to thedestruction of the IN ability of ATD or not cannot be deter-mined from these experiments and other compounds whichwe were unable to identify may also be responsible for theobserved effect.
The humidification of a particle transforms the sulphuricacid on its surface into a highly concentrated sulphuric acidsolution with the particle core immersed. This allows for twopossible explanations for the effect of the water bath. First,the sulphuric acid could have been spread over the whole par-ticle and thus became able to etch all active sites on the ATDsurface. Thus those active sites could also be affected whichwere not in contact with the sulphuric acid if the particle sur-face was not completely covered after the condensation pro-cess. A second possibility is that the particles were alreadycompletely covered after the condensation of the sulphuricacid and the humidification only accelerated the reaction ki-netics and/or changed the reaction equilibrium. When thethermodenuder was applied, the same effects are possible.The second possibility is supported by the following argu-ment:Colina et al.(2002) reported that the alumino silicatekaolin reacts with sulphuric acid when heated. This mightas well happen in the case of ATD and could be the reasonfor the reduction of the ice active fraction. If the thermode-nuder only accelerated the reaction kinetics and/or changedthe reaction equilibrium without further spreading the sul-phuric acid over the particle surface, it is likely that most ofthe particle surface was covered by sulphuric acid. If the par-ticles were only partially covered, the thermodenuder couldnot have efficiently altered the IN ability as only the coveredfraction of the particle’s surface could have been affected.In the situation of particles that were completely coveredwith sulphuric acid, the effect of the humidification must alsohave been linked to reaction kinetics and/or reaction equilib-rium. However, the first explanation can not be ruled out.If the thermodenuder also favoured the spreading of the sul-phuric acid over the particle surface, the effect of both thethermodenuder and the water bath could be an increased sur-face coverage. Thus the sulphuric acid could have reactedwith a higher fraction of the particle surface and could havedestroyed more active sites. In both cases, the sulphuric acidreacted with the ATD surface, as the hydrogenated fragmentsdisappeared in the mass spectrum for both the water bath andthe thermodenduer treatment (Sect.3.2). If the particles werenot further treated after the condensation of the sulphuric
acid, parts of the sulphuric acid remained unreacted on theparticle surface. A possible explanantion could be a passi-vation of the ATD surface after an initial reaction with thesulphuric acid.
4 Summary and conclusions
Mineral dust has been recognized as the most relevant IN inthe atmosphere (Kamphus et al., 2010; Mertes et al., 2007;Richardson et al., 2007; Cziczo et al., 2004; DeMott et al.,2003). However, it is unlikely that mineral dust is found inits pure, untreated form after a few hours or days of residencetime in the atmosphere. Various atmospheric processes willalter the nature of the surface of the dust particles. One ofsuch processing is reaction with sulphuric acid which maybe important especially in polluted areas with high sulphureemissions.
We showed that condensing sulphuric acid on the ATDsurface does not only coat the particles but also leads to sur-face reactions. The compounds produced on the surface weremetal sulphate salts, ammonium metal sulphate salts as wellas ammonium sulphate. The formation of metal sulphatesalts was indirectly detected via the fragmentation pattern ofthe AMS sulphate signal. A direct detection was not possibleas the metal oxides produced during the vaporisation processin the AMS are refractory. In our experiments the source ofthe ammonium was the intrinsic ammonia contained in thecompressed air, a possible contamination of the water bathsection as well as ammonia that was on purpose added to thesystem to get full neutralisation.
Comparing the AMS data to the CCNC data for parti-cles humidified or treated thermally after the coating withsulphuric acid yielded evidence for the formation of an in-creased amount of substances which were evaporated by theAMS vaporiser at 820◦C but not at the lower temperature of600◦C. However, the solubility of the surface material is al-tered only weakly. Possible compounds would be aluminiumsulphate and calcium sulphate. The comparison of the AMSsulphate signal and the sulphate fragmentation to the IN frac-tions measured with the CFDC and LACIS show that the INability is reduced by the coating with sulphuric acid throughreaction with the surface for the condensation/immersionfreezing mode.
Coating the particles with sulphuric acid without furthertreatment slightly lowered the fraction of IN in the immer-sion/condensation freezing mode, while humidification afterthe coating and thermal treatment caused the IN-fraction tofurther decrease. The reduction of the IN fraction was at-tributed to the destruction of surface active sites as alreadyproposed bySullivan et al.(2010b). The condensation of sul-phuric acid on the particle surfaces and the resulting reactiondecreased the IN ability. The substances formed were vapor-ised at 600◦C in the AMS. The use of the water bath furtherdecreased the number fraction of IN and produced substances
Atmos. Chem. Phys., 11, 7839–7858, 2011 www.atmos-chem-phys.net/11/7839/2011/
P. Reitz et al.: Surface modification of mineral dust INs 7853
with lower volatility and lower solubility. The newly formedsubstances could only be evaporated at 820◦C. A similarbut stronger effect was produced by the use of the thermod-enuder if it was not preceded by the water bath. If the waterbath was used before the thermodenuder, the thermodenudereffect was reduced to the removal of the volatile fraction ofthe particle. Aluminium and calcium containing minerals arelikely part of the active sites. We observed that the sulphuricacid reduced the amount of carbonates on the particles, in-dicating that they could be involved in the active site com-pounds (Klein et al., 2010; Zimmermann et al., 2008; Masonand Maybank, 1958; Manson, 1957). However further re-search is needed to clearly identify the chemical nature ofthe active sites.
The goal of these experiments was to retrieve basic infor-mation on the nature of active sites. They were not meantto exactly simulate atmospheric processes. While humidifi-cation in the water bath provokes hygroscopic growth, theheat treatment of the thermodenuder does not correspond toa process commonly found in the atmosphere. Our experi-ments were made only with sulphuric acid, but it is not un-likely that other acids (e.g. nitric acid or organics acids) willhave similar effects to the dust surface, but this still has to beverified by future experiments.
Appendix A
Calculation of AMS correction factors
A1 Relative ionisation efficiency of sulphate andammonium
To get the appropriate values of the RIE of sulphate and am-monium two methods have been applied. For the first methodan internally mixed aerosol of ammonium nitrate and ammo-nium sulphate was generated by atomising a solution with aknown ratio of ammonium sulphate and ammonium nitrate.The ammonium and the sulphate relative ionisation efficien-cies could then be determined directly from the ratio to thenitrate signal. As the instrument was calibrated to nitrate,the nitrate signal is correct. A second method was to mea-sure pure ammonium nitrate and pure ammonium sulphate.The RIE for ammonium can be determined from the ammo-nium nitrate measurement allowing for the correction of theammonium concentration of the second measurement. Thecorrected ammonium concentration of the ammonium sul-phate measurement can be compared to the sulphate signal.The RIE of sulphate is determined via the expected correctstoichiometric ratio.
TableA1 shows the determined relative ionisation efficien-cies. The RIEs determined in this study significantly differfrom the RIE presented in literature.Alfarra et al. (2004)determined RIE of 3.5 and 1.15 for ammonium and sulphaterespectively andDrewnick et al.(2005) found values of 3.78
0.5
0.4
0.3
0.2
0.1
0.0
200
nm 5
0 °C
200
nm 7
0 °C
300
nm 5
0 °C
300
nm 7
0 °C
300
nm 7
0 °C
WB
300
nm 7
0 °C
TD 2
50°C
300
nm 8
5 °C
300
nm 8
5 °C
300
nm 8
5 °C
TD 1
50°C
300
nm 8
5 °C
TD 1
50°C
300
nm 8
5 °C
TD 2
50 °C
400
nm 5
0 °C
400
nm 7
0 °C
ratio AMS to CCNC mean value (=0.357)
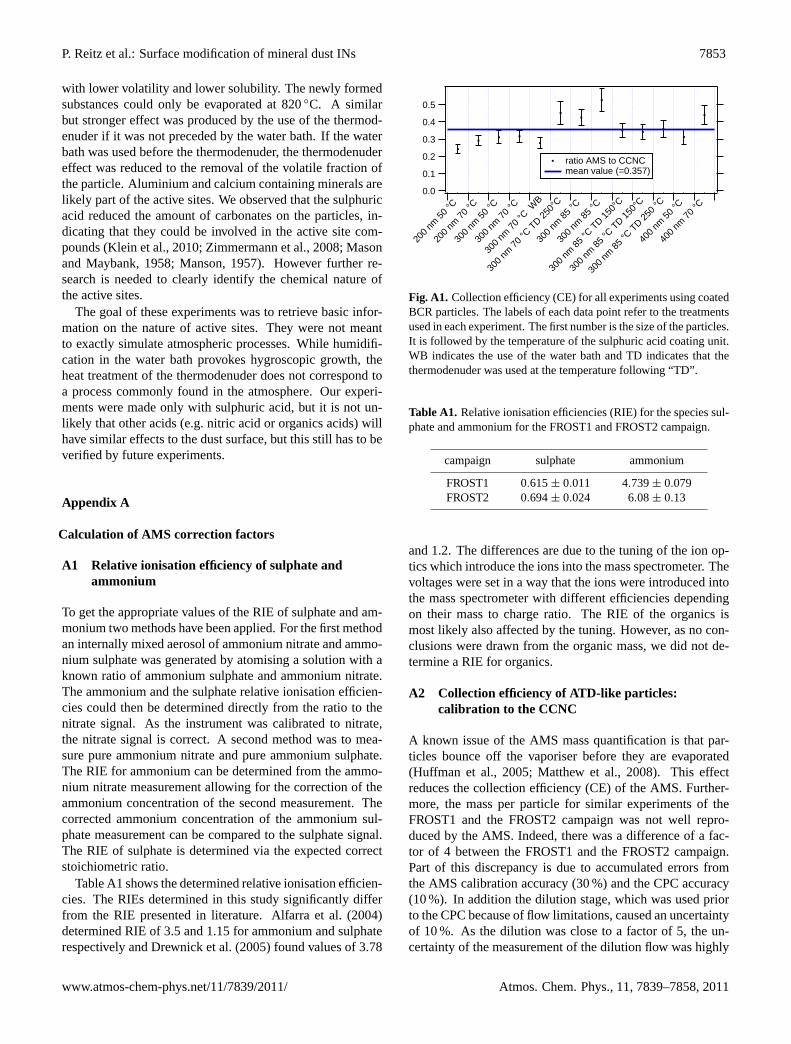
Fig. A1. Collection efficiency (CE) for all experiments using coatedBCR particles. The labels of each data point refer to the treatmentsused in each experiment. The first number is the size of the particles.It is followed by the temperature of the sulphuric acid coating unit.WB indicates the use of the water bath and TD indicates that thethermodenuder was used at the temperature following “TD”.
Table A1. Relative ionisation efficiencies (RIE) for the species sul-phate and ammonium for the FROST1 and FROST2 campaign.
campaign sulphate ammonium
FROST1FROST2
0.615± 0.0110.694± 0.024
4.739± 0.0796.08± 0.13
and 1.2. The differences are due to the tuning of the ion op-tics which introduce the ions into the mass spectrometer. Thevoltages were set in a way that the ions were introduced intothe mass spectrometer with different efficiencies dependingon their mass to charge ratio. The RIE of the organics ismost likely also affected by the tuning. However, as no con-clusions were drawn from the organic mass, we did not de-termine a RIE for organics.
A2 Collection efficiency of ATD-like particles:calibration to the CCNC
A known issue of the AMS mass quantification is that par-ticles bounce off the vaporiser before they are evaporated(Huffman et al., 2005; Matthew et al., 2008). This effectreduces the collection efficiency (CE) of the AMS. Further-more, the mass per particle for similar experiments of theFROST1 and the FROST2 campaign was not well repro-duced by the AMS. Indeed, there was a difference of a fac-tor of 4 between the FROST1 and the FROST2 campaign.Part of this discrepancy is due to accumulated errors fromthe AMS calibration accuracy (30 %) and the CPC accuracy(10 %). In addition the dilution stage, which was used priorto the CPC because of flow limitations, caused an uncertaintyof 10 %. As the dilution was close to a factor of 5, the un-certainty of the measurement of the dilution flow was highly
www.atmos-chem-phys.net/11/7839/2011/ Atmos. Chem. Phys., 11, 7839–7858, 2011
7854 P. Reitz et al.: Surface modification of mineral dust INs
60x10-3
40
20
0
-20
dM/d
log 1
0dva
(µg
m-3
)
2 3 4 5 6 7 8 91000
vacuum aerodynamic diameter (nm)
AMS silicone mass size distribution (ATD) lognormal fit
lognormal fit parameters:dmod = 415 ± 5 nmGSD = 1.23 ± 0.02
20x10-3
15
10
5
0
-5
dM/d
log 1
0dva
(µg
m-3
)
2 3 4 5 6 7 8 91000vacuum aerodynamic diameter (nm)
lognormal fit parameters:dmod = 392 ± 9 nmGSD = 1.40 ± 0.03
AMS silicone mass size distribution (BCR) lognormal fit
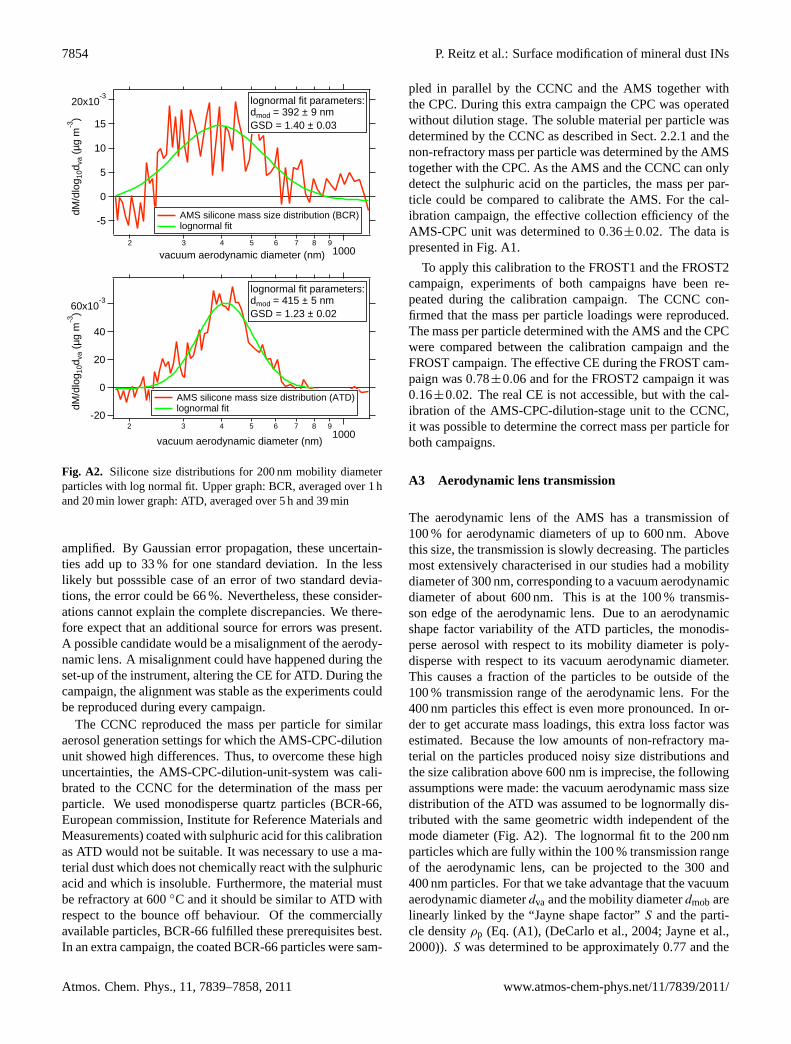
Fig. A2. Silicone size distributions for 200 nm mobility diameterparticles with log normal fit. Upper graph: BCR, averaged over 1 hand 20 min lower graph: ATD, averaged over 5 h and 39 min
amplified. By Gaussian error propagation, these uncertain-ties add up to 33 % for one standard deviation. In the lesslikely but posssible case of an error of two standard devia-tions, the error could be 66 %. Nevertheless, these consider-ations cannot explain the complete discrepancies. We there-fore expect that an additional source for errors was present.A possible candidate would be a misalignment of the aerody-namic lens. A misalignment could have happened during theset-up of the instrument, altering the CE for ATD. During thecampaign, the alignment was stable as the experiments couldbe reproduced during every campaign.
The CCNC reproduced the mass per particle for similaraerosol generation settings for which the AMS-CPC-dilutionunit showed high differences. Thus, to overcome these highuncertainties, the AMS-CPC-dilution-unit-system was cali-brated to the CCNC for the determination of the mass perparticle. We used monodisperse quartz particles (BCR-66,European commission, Institute for Reference Materials andMeasurements) coated with sulphuric acid for this calibrationas ATD would not be suitable. It was necessary to use a ma-terial dust which does not chemically react with the sulphuricacid and which is insoluble. Furthermore, the material mustbe refractory at 600◦C and it should be similar to ATD withrespect to the bounce off behaviour. Of the commerciallyavailable particles, BCR-66 fulfilled these prerequisites best.In an extra campaign, the coated BCR-66 particles were sam-
pled in parallel by the CCNC and the AMS together withthe CPC. During this extra campaign the CPC was operatedwithout dilution stage. The soluble material per particle wasdetermined by the CCNC as described in Sect.2.2.1and thenon-refractory mass per particle was determined by the AMStogether with the CPC. As the AMS and the CCNC can onlydetect the sulphuric acid on the particles, the mass per par-ticle could be compared to calibrate the AMS. For the cal-ibration campaign, the effective collection efficiency of theAMS-CPC unit was determined to 0.36±0.02. The data ispresented in Fig.A1.
To apply this calibration to the FROST1 and the FROST2campaign, experiments of both campaigns have been re-peated during the calibration campaign. The CCNC con-firmed that the mass per particle loadings were reproduced.The mass per particle determined with the AMS and the CPCwere compared between the calibration campaign and theFROST campaign. The effective CE during the FROST cam-paign was 0.78±0.06 and for the FROST2 campaign it was0.16±0.02. The real CE is not accessible, but with the cal-ibration of the AMS-CPC-dilution-stage unit to the CCNC,it was possible to determine the correct mass per particle forboth campaigns.
A3 Aerodynamic lens transmission
The aerodynamic lens of the AMS has a transmission of100 % for aerodynamic diameters of up to 600 nm. Abovethis size, the transmission is slowly decreasing. The particlesmost extensively characterised in our studies had a mobilitydiameter of 300 nm, corresponding to a vacuum aerodynamicdiameter of about 600 nm. This is at the 100 % transmis-son edge of the aerodynamic lens. Due to an aerodynamicshape factor variability of the ATD particles, the monodis-perse aerosol with respect to its mobility diameter is poly-disperse with respect to its vacuum aerodynamic diameter.This causes a fraction of the particles to be outside of the100 % transmission range of the aerodynamic lens. For the400 nm particles this effect is even more pronounced. In or-der to get accurate mass loadings, this extra loss factor wasestimated. Because the low amounts of non-refractory ma-terial on the particles produced noisy size distributions andthe size calibration above 600 nm is imprecise, the followingassumptions were made: the vacuum aerodynamic mass sizedistribution of the ATD was assumed to be lognormally dis-tributed with the same geometric width independent of themode diameter (Fig.A2). The lognormal fit to the 200 nmparticles which are fully within the 100 % transmission rangeof the aerodynamic lens, can be projected to the 300 and400 nm particles. For that we take advantage that the vacuumaerodynamic diameterdva and the mobility diameterdmobarelinearly linked by the “Jayne shape factor”S and the parti-cle densityρp (Eq. (A1), (DeCarlo et al., 2004; Jayne et al.,2000)). S was determined to be approximately 0.77 and the
Atmos. Chem. Phys., 11, 7839–7858, 2011 www.atmos-chem-phys.net/11/7839/2011/
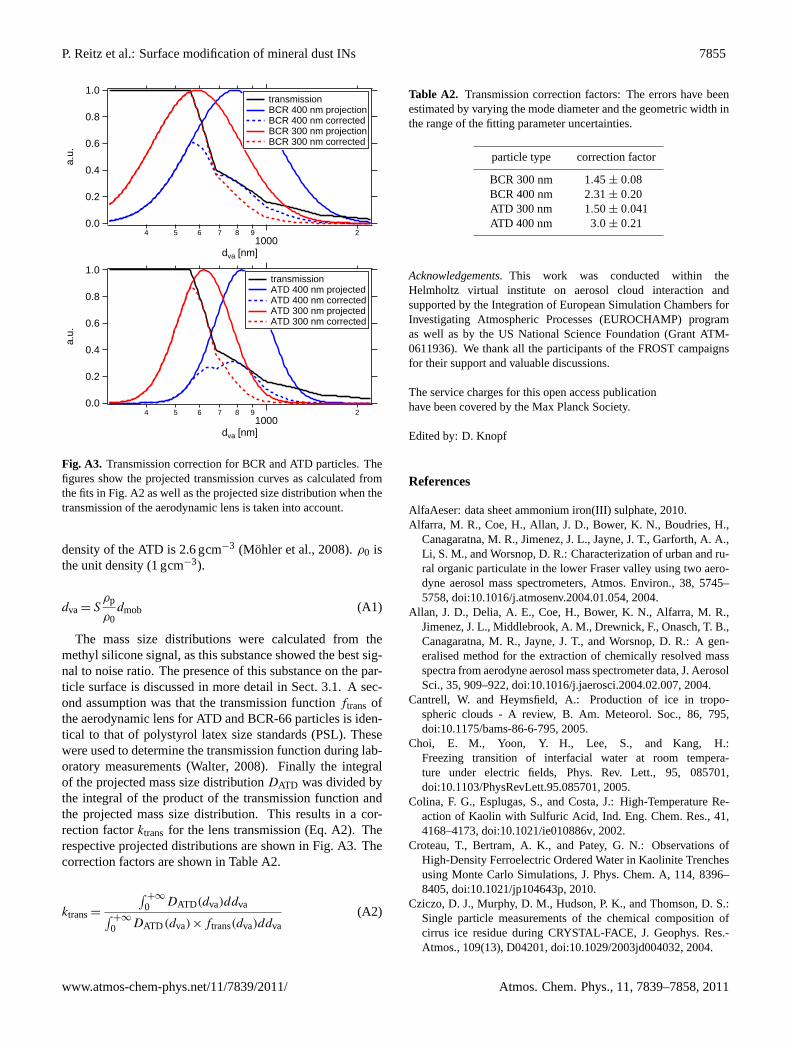
P. Reitz et al.: Surface modification of mineral dust INs 7855
1.0
0.8
0.6
0.4
0.2
0.0
a.u.
4 5 6 7 8 91000
2
dva [nm]
transmission ATD 400 nm projected ATD 400 nm corrected ATD 300 nm projected ATD 300 nm corrected
1.0
0.8
0.6
0.4
0.2
0.0
a.u.
4 5 6 7 8 91000
2
dva [nm]
transmission BCR 400 nm projection BCR 400 nm corrected BCR 300 nm projection BCR 300 nm corrected
Fig. A3. Transmission correction for BCR and ATD particles. Thefigures show the projected transmission curves as calculated fromthe fits in Fig.A2 as well as the projected size distribution when thetransmission of the aerodynamic lens is taken into account.
density of the ATD is 2.6 gcm−3 (Mohler et al., 2008). ρ0 isthe unit density (1 gcm−3).
dva= Sρp
ρ0dmob (A1)
The mass size distributions were calculated from themethyl silicone signal, as this substance showed the best sig-nal to noise ratio. The presence of this substance on the par-ticle surface is discussed in more detail in Sect.3.1. A sec-ond assumption was that the transmission functionftrans ofthe aerodynamic lens for ATD and BCR-66 particles is iden-tical to that of polystyrol latex size standards (PSL). Thesewere used to determine the transmission function during lab-oratory measurements (Walter, 2008). Finally the integralof the projected mass size distributionDATD was divided bythe integral of the product of the transmission function andthe projected mass size distribution. This results in a cor-rection factorktrans for the lens transmission (Eq.A2). Therespective projected distributions are shown in Fig.A3. Thecorrection factors are shown in TableA2.
ktrans=
∫+∞
0 DATD(dva)ddva∫+∞
0 DATD (dva)×ftrans(dva)ddva(A2)
Table A2. Transmission correction factors: The errors have beenestimated by varying the mode diameter and the geometric width inthe range of the fitting parameter uncertainties.
particle type correction factor
BCR 300 nmBCR 400 nmATD 300 nmATD 400 nm
1.45± 0.082.31± 0.201.50± 0.0413.0 ± 0.21
Acknowledgements.This work was conducted within theHelmholtz virtual institute on aerosol cloud interaction andsupported by the Integration of European Simulation Chambers forInvestigating Atmospheric Processes (EUROCHAMP) programas well as by the US National Science Foundation (Grant ATM-0611936). We thank all the participants of the FROST campaignsfor their support and valuable discussions.
The service charges for this open access publicationhave been covered by the Max Planck Society.
Edited by: D. Knopf
References
AlfaAeser: data sheet ammonium iron(III) sulphate, 2010.Alfarra, M. R., Coe, H., Allan, J. D., Bower, K. N., Boudries, H.,
Canagaratna, M. R., Jimenez, J. L., Jayne, J. T., Garforth, A. A.,Li, S. M., and Worsnop, D. R.: Characterization of urban and ru-ral organic particulate in the lower Fraser valley using two aero-dyne aerosol mass spectrometers, Atmos. Environ., 38, 5745–5758,doi:10.1016/j.atmosenv.2004.01.054, 2004.
Allan, J. D., Delia, A. E., Coe, H., Bower, K. N., Alfarra, M. R.,Jimenez, J. L., Middlebrook, A. M., Drewnick, F., Onasch, T. B.,Canagaratna, M. R., Jayne, J. T., and Worsnop, D. R.: A gen-eralised method for the extraction of chemically resolved massspectra from aerodyne aerosol mass spectrometer data, J. AerosolSci., 35, 909–922,doi:10.1016/j.jaerosci.2004.02.007, 2004.
Cantrell, W. and Heymsfield, A.: Production of ice in tropo-spheric clouds - A review, B. Am. Meteorol. Soc., 86, 795,doi:10.1175/bams-86-6-795, 2005.
Choi, E. M., Yoon, Y. H., Lee, S., and Kang, H.:Freezing transition of interfacial water at room tempera-ture under electric fields, Phys. Rev. Lett., 95, 085701,doi:10.1103/PhysRevLett.95.085701, 2005.
Colina, F. G., Esplugas, S., and Costa, J.: High-Temperature Re-action of Kaolin with Sulfuric Acid, Ind. Eng. Chem. Res., 41,4168–4173,doi:10.1021/ie010886v, 2002.
Croteau, T., Bertram, A. K., and Patey, G. N.: Observations ofHigh-Density Ferroelectric Ordered Water in Kaolinite Trenchesusing Monte Carlo Simulations, J. Phys. Chem. A, 114, 8396–8405,doi:10.1021/jp104643p, 2010.
Cziczo, D. J., Murphy, D. M., Hudson, P. K., and Thomson, D. S.:Single particle measurements of the chemical composition ofcirrus ice residue during CRYSTAL-FACE, J. Geophys. Res.-Atmos., 109(13), D04201,doi:10.1029/2003jd004032, 2004.
www.atmos-chem-phys.net/11/7839/2011/ Atmos. Chem. Phys., 11, 7839–7858, 2011

7856 P. Reitz et al.: Surface modification of mineral dust INs
DeCarlo, P. F., Slowik, J. G., Worsnop, D. R., Davidovits, P.,and Jimenez, J. L.: Particle morphology and density character-ization by combined mobility and aerodynamic diameter mea-surements. Part 1: Theory, Aerosol Sci. Tech., 38, 1185–1205,doi:10.1080/027868290903907, 2004.
DeMott, P. J., Sassen, K., Poellot, M. R., Baumgardner, D., Rogers,D. C., Brooks, S. D., Prenni, A. J., and Kreidenweis, S. M.:African dust aerosols as atmospheric ice nuclei, Geophys. Res.Lett., 30, 4, 1732,doi:10.1029/2003gl017410, 2003.
Drewnick, F., Hings, S. S., DeCarlo, P., Jayne, J. T., Gonin,M., Fuhrer, K., Weimer, S., Jimenez, J. L., Demerjian, K. L.,Borrmann, S., and Worsnop, D. R.: A new time-of-flightaerosol mass spectrometer (TOF-AMS) - Instrument descrip-tion and first field deployment, Aerosol Sci. Tech., 39, 637–658,doi:10.1080/02786820500182040, 2005.
Drewnick, F., Hings, S. S., Alfarra, M. R., Prevot, A. S. H., andBorrmann, S.: Aerosol quantification with the Aerodyne AerosolMass Spectrometer: detection limits and ionizer backgroundeffects, Atmos. Meas. Tech., 2, 33–46,doi:10.5194/amt-2-33-2009, 2009.
Falkovich, A. H., Ganor, E., Levin, Z., Formenti, P., andRudich, Y.: Chemical and mineralogical analysis of individ-ual mineral dust particles, J. Geophys. Res., 106, 18029–18036,doi:10.1029/2000jd900430, 2001.
Forster, P., Ramaswamy, V., Artaxo, P., Berntsen, T., Betts, R., Fa-hey, D., Haywood, J., Lean, J., Lowe, D., Myhre, G., Nganga, J.,Prinn, R., Raga, G., Schulz, M., and Van Dorland, R.: Changesin Atmospheric Constituents and in Radiative Forcing, in: Cli-mate Change 2007: The Physical Science Basis. Contribution ofWorking Group I to the Fourth Assessment Report of the Inter-governmental Panel on Climate Change, edited by: Solomon, S.,Qin, D., Manning, M., Chen, Z., Marquis, M., Averyt, K. B., Tig-nor, M., Miller, H. L., Cambridge University Press, Cambridge,United Kingdom and New York, NY, USA, Cambridge, 2007.
Gallavardin, S. J., Froyd, K. D., Lohmann, U., Mohler, O., Mur-phy, D. M., and Cziczo, D. J.: Single Particle Laser Mass Spec-trometry Applied to Differential Ice Nucleation Experimentsat the AIDA Chamber, Aerosol Sci. Technol., 42, 773–791,doi:10.1080/02786820802339538, 2008.
Hartmann, S., Niedermeier, D., Voigtlander, J., Clauss, T., Shaw,R. A., Wex, H., Kiselev, A., and Stratmann, F.: Homogeneousand heterogeneous ice nucleation at LACIS: operating princi-ple and theoretical studies, Atmos. Chem. Phys., 11, 1753–1767,doi:10.5194/acp-11-1753-2011, 2011.
Hinz, K. P., Trimborn, A., Weingartner, E., Henning, S., Bal-tensperger, U., and Spengler, B.: Aerosol single particle com-position at the Jungfraujoch, J. Aerosol Sci., 36, 123–145,doi:10.1016/j.jaerosci.2004.08.001, 2005.
Huffman, J. A., Jayne, J. T., Drewnick, F., Aiken, A. C., Onasch, T.,Worsnop, D. R., and Jimenez, J. L.: Design, modeling, optimiza-tion, and experimental tests of a particle beam width probe forthe aerodyne aerosol mass spectrometer, Aerosol Sci. Technol.,39, 1143–1163,doi:10.1080/02786820500423782, 2005.
IFA: GESTIS-material-database,,http://www.dguv.de/ifa/de/gestis/stoffdb/index.jsp, last access: January 2011, 2010.
Jayne, J. T., Leard, D. C., Zhang, X. F., Davidovits, P., Smith, K. A.,Kolb, C. E., and Worsnop, D. R.: Development of an aerosolmass spectrometer for size and composition analysis of submi-cron particles, Aerosol Sci. Technol., 33, 49–70, 2000.
Kamphus, M., Ettner-Mahl, M., Klimach, T., Drewnick, F., Keller,L., Cziczo, D. J., Mertes, S., Borrmann, S., and Curtius, J.:Chemical composition of ambient aerosol, ice residues andcloud droplet residues in mixed-phase clouds: single particleanalysis during the Cloud and Aerosol Characterization Ex-periment (CLACE 6), Atmos. Chem. Phys., 10, 8077–8095,doi:10.5194/acp-10-8077-2010, 2010.
Kay, J. E., Baker, M., and Hegg, D.: Physical controls on oro-graphic cirrus inhomogeneity, Atmos. Chem. Phys., 7, 3771–3781,doi:10.5194/acp-7-3771-2007, 2007.
Klein, H., Nickovic, S., Haunold, W., Bundke, U., Nillius, B.,Ebert, M., Weinbruch, S., Schuetz, L., Levin, Z., Barrie, L. A.,and Bingemer, H.: Saharan dust and ice nuclei over Central Eu-rope, Atmos. Chem. Phys., 10, 10211–10221,doi:10.5194/acp-10-10211-2010, 2010.
Liu, P. S. K., Deng, R., Smith, K. A., Williams, L. R.,Jayne, J. T., Canagaratna, M. R., Moore, K., Onasch, T. B.,Worsnop, D. R., and Deshler, T.: Transmission efficiency ofan aerodynamic focusing lens system: Comparison of modelcalculations and laboratory measurements for the AerodyneAerosol Mass Spectrometer, Aerosol Sci. Technol., 41, 721–733,doi:10.1080/02786820701422278, 2007.
Lohmann, U. and Feichter, J.: Global indirect aerosol effects: a re-view, Atmos. Chem. Phys., 5, 715–737,doi:10.5194/acp-5-715-2005, 2005.
Manson, J. E.: Calcium carbonate as an ice nucleus, J. Meteorol.,14, 85–86, 1957.
Mason, B. J. and Maybank, J.: Ice-nucleating properties of somenatural mineral dusts, Q. J. Roy. Meteorol. Soc., 84, 235–241,1958.
Matthew, B. M., Middlebrook, A. M., and Onasch, T. B.:Collection efficiencies in an Aerodyne Aerosol Mass Spec-trometer as a function of particle phase for laboratorygenerated aerosols, Aerosol Sci. Technol., 42, 884–898,doi:10.1080/02786820802356797, 2008.
Mertes, S., Verheggen, B., Walter, S., Connolly, P., Ebert, M.,Schneider, J., Bower, K. N., Cozic, J., Weinbruch, S., Bal-tensperger, U., and Weingartner, E.: Counterflow virtual im-pactor based collection of small ice particles in mixed-phaseclouds for the physico-chemical characterization of troposphericice nuclei : Sampler description and first case study, Aerosol Sci.Technol., 41, 848–864,doi:10.1080/02786820701501881, 2007.
Mohler, O., Buttner, S., Linke, C., Schnaiter, M., Saathoff, H., Stet-zer, O., Wagner, R., Kramer, M., Mangold, A., Ebert, V., andSchurath, U.: Effect of sulfuric acid coating on heterogeneousice nucleation by soot aerosol particles, J. Geophys. Res.-Atmos.,110(12), D11210,doi:10.1029/2004jd005169, 2005.
Mohler, O., Benz, S., Saathoff, H., Schnaiter, M., Wagner, R.,Schneider, J., Walter, S., Ebert, V., and Wagner, S.: The effectof organic coating on the heterogeneous ice nucleation efficiencyof mineral dust aerosols, Environ. Res. Lett., 3(8), 025007,doi:10.1088/1748-9326/3/2/025007, 2008.
Niedermeier, D., Hartmann, S., Shaw, R. A., Covert, D., Mentel, T.F., Schneider, J., Poulain, L., Reitz, P., Spindler, C., Clauss, T.,Kiselev, A., Hallbauer, E., Wex, H., Mildenberger, K., and Strat-mann, F.: Heterogeneous freezing of droplets with immersedmineral dust particles - measurements and parameterization, At-mos. Chem. Phys., 10, 3601–3614,doi:10.5194/acp-10-3601-2010, 2010.
Atmos. Chem. Phys., 11, 7839–7858, 2011 www.atmos-chem-phys.net/11/7839/2011/
P. Reitz et al.: Surface modification of mineral dust INs 7857
Niedermeier, D., Hartmann, S., Clauss, T., Wex, H., Kiselev, A.,Sullivan, R. C., DeMott, P. J., Petters, M. D., Reitz, P., Schneider,J., Mikhailov, E., Sierau, B., Stetzer, O., Reimann, B., Bundke,U., Shaw, R. A., Buchholz, A., Mentel, T. F., and Stratmann,F.: Experimental study of the role of physicochemical surfaceprocessing on the IN ability of mineral dust particles, Atmos.Chem. Phys. Discuss., 11, 18557–18588,doi:10.5194/acpd-11-18557-2011, 2011.
Nordmeyer, T. and Prather, K. A.: Real-time measurement ca-pabilities using aerosol time-of-flight mass-spectrometry, Anal.Chem., 66, 3540–3542, 1994.
Petters, M. D. and Kreidenweis, S. M.: A single parameter repre-sentation of hygroscopic growth and cloud condensation nucleusactivity, Atmos. Chem. Phys., 7, 1961–1971,doi:10.5194/acp-7-1961-2007, 2007.
Petters, M. D. and Kreidenweis, S. M.: A single parameter repre-sentation of hygroscopic growth and cloud condensation nucleusactivity - Part 2: Including solubility, Atmos. Chem. Phys., 8,6273–6279,doi:10.5194/acp-8-6273-2008, 2008.
Pruppacher, H. and Klett, J.: Microphysics of clouds and precipi-tation, pp. 296–360, Kluwer Academic Publishers, Netherlands,2nd Edn., 1997.
Reitz, P. and Schneider, J.: Noise level determination by local cubicsignal approximation: Calculation of Aerodyne Aerosol MassSpectrometer Detection Limits, Atmos. Meas. Tech. Discuss., inpreparation, 2011.
Richardson, M. S., DeMott, P. J., Kreidenweis, S. M., Cziczo,D. J., Dunlea, E. J., Jimenez, J. L., Thomson, D. S., Ashbaugh,L. L., Borys, R. D., Westphal, D. L., Casuccio, G. S., and Ler-sch, T. L.: Measurements of heterogeneous ice nuclei in thewestern United States in springtime and their relation to aerosolcharacteristics, Journal of Geophysical Research-Atmospheres,112(16), D02209,doi:10.1029/2006jd007500, 2007.
Roberts, G. C. and Nenes, A.: A continuous-flow streamwisethermal-gradient CCN chamber for atmospheric measurements,Aerosol Sci. Tech., 39, 206–221, 2005.
Roedel, W.: Physik unserer Umwelt: die Atmosphare, Springer-Verlag Berlin Heidelberg New York, 3rd Edn., 2000.
Rogers, D. C., DeMott, P. J., Kreidenweis, S. M., and Chen, Y.:A Continuous-Flow Diffusion Chamber for airborne measure-ments of ice nuclei, J. Atmos. Ocean. Tech., 18, 725–741,doi:10.1175/1520-0426(2001)018¡0725:ACFDCF¿2.0.CO;2,2001.
Sitzmann, H.: Roempp Online – Version 3.5,http://www.roempp.com, last access: January 2011, 2004.
Stratmann, F., Kiselev, A., Wurzler, S., Wendisch, M., Heintzen-berg, J., Charlson, R. J., Diehl, K., Wex, H., and Schmidt, S.:Laboratory studies and numerical simulations of cloud dropletformation under realistic supersaturation conditions, J. Atmos.Ocean. Tech., 21, 876–887, 2004.
Sullivan, R. C. and Prather, K. A.: Investigations of the diurnalcycle and mixing state of oxalic acid in individual particles inAsian aerosol outflow, Environ. Sci. Technol., 41, 8062–8069,doi:10.1021/es071134g, 2007.
Sullivan, R. C., Guazzotti, S. A., Sodeman, D. A., and Prather,K. A.: Direct observations of the atmospheric processingof Asian mineral dust, Atmos. Chem. Phys., 7, 1213–1236,doi:10.5194/acp-7-1213-2007, 2007.
Sullivan, R. C., Moore, M. J. K., Petters, M. D., Kreidenweis, S. M.,
Roberts, G. C., and Prather, K. A.: Timescale for hygroscopicconversion of calcite mineral particles through heterogeneousreaction with nitric acid, Phys. Chem. Chem. Phys., 11, 7826–7837, 2009a.
Sullivan, R. C., Moore, M. J. K., Petters, M. D., Kreidenweis, S. M.,Roberts, G. C., and Prather, K. A.: Effect of chemical mixingstate on the hygroscopicity and cloud nucleation properties ofcalcium mineral dust particles, Atmos. Chem. Phys., 9, 3303–3316,doi:10.5194/acp-9-3303-2009, 2009b.
Sullivan, R. C., Minambres, L., DeMott, P. J., Prenni, A. J., Car-rico, C. M., Levin, E. J. T., and Kreidenweis, S. M.: Chemi-cal processing does not always impair heterogeneous ice nucle-ation of mineral dust particles, Geophys. Res. Lett., 37, L24805,doi:10.1029/2010gl045540, 2010a.
Sullivan, R. C., Petters, M. D., DeMott, P. J., Kreidenweis, S. M.,Wex, H., Niedermeier, D., Hartmann, S., Clauss, T., Stratmann,F., Reitz, P., Schneider, J., and Sierau, B.: Irreversible loss ofice nucleation active sites in mineral dust particles caused bysulphuric acid condensation, Atmos. Chem. Phys., 10, 11471–11487,doi:10.5194/acp-10-11471-2010, 2010b.
Svane, M., Hagstrom, M., and Pettersson, J. B. C.: Chem-ical analysis of individual alkali-containing aerosol parti-cles: Design and performance of a surface ionization particlebeam mass spectrometer, Aerosol Sci. Technol., 38, 655–663,doi:10.1080/02786820490485944, 2004.
Svane, M., Hagstrom, M., and Pettersson, J. B. C.: Online mea-surements of individual alkali-containing particles formed inbiomass and coal combustion: Demonstration of an instrumentbased on surface ionization technique, Energ. Fuel., 19, 411–417,doi:10.1021/ef049925g, 2005.
Vali, G.: Atmospheric Ice Nucleation – A Review, Journal deRecherches Atmospheriques, 19, 105–115, 1985.
Vlasenko, A., Sjogren, S., Weingartner, E., Gaggeler, H. W.,and Ammann, M.: Generation of submicron Arizona test dustaerosol: Chemical and hygroscopic properties, Aerosol Sci.Technol., 39, 452–460,doi:10.1080/027868290959870, 2005.
Walter, S.: Personal communication: AMS lens transmission func-tion, 2008.
Wex, H., Hennig, T., Salma, I., Ocskay, R., Kiselev, A., Hen-ning, S., Massling, A., Wiedensohler, A., and Stratmann, F.:Hygroscopic growth and measured and modeled critical super-saturations of an atmospheric HULIS sample, Geophys. Res.Lett., 34(5), L02818,doi:10.1029/2006gl028260, 2007.
Wex, H., Clauss, T., Covert, D., Hallbauer, E., Hartmann, S.,Kiselev, A., Mentel, T. F., Mildenberger, K., Niedermeier, D.,Poulain, L., Reitz, P., Schneider, J., Shaw, R., Spindler, C., andStratmann, F.: Classifying Coated and Uncoated Arizona TestDust with respect to Hygroscopic Growth and Activation, inpreparation, 2011.
Wiacek, A. and Peter, T.: On the availability of uncoated mineraldust ice nuclei in cold cloud regions, Geophys. Res. Lett., 36(5),L17801,doi:10.1029/2009gl039429, 2009.
Zhao, D. F., Buchholz, A., Mentel, Th. F., Mller, K.-P., Borchardt,J., Kiendler-Scharr, A., Spindler, C., Tillmann, R., Trimborn,A., Zhu, T., and Wahner, A.: Novel method of generation ofCa(HCO3)2 and CaCO3 aerosols and first determination of hy-groscopic and cloud condensation nuclei activation properties,Atmos. Chem. Phys., 10, 8601–8616,doi:10.5194/acp-10-8601-2010, 2010.
www.atmos-chem-phys.net/11/7839/2011/ Atmos. Chem. Phys., 11, 7839–7858, 2011

7858 P. Reitz et al.: Surface modification of mineral dust INs
Zimmermann, F., Weinbruch, S., Schutz, L., Hofmann, H., Ebert,M., Kandler, K., and Worringen, A.: Ice nucleation properties ofthe most abundant mineral dust phases, J. Geophys. Res., 113,D23204,doi:10.1029/2008jd010655, 2008.
Atmos. Chem. Phys., 11, 7839–7858, 2011 www.atmos-chem-phys.net/11/7839/2011/