Surface Hardening and Wear Performance of Ausferritic ...
44
M A S T E R’S THESIS 2007:036 PB Master Thesis, Continuation Courses ADVANCED MATERIAL SCIENCE AND ENGINEERING Department of Applied Physics and Mechanical Engineering Division of Engineering Materials 2007:036 PB • ISSN: 1653 - 0187 • ISRN: LTU - PB - EX - - 07/036 - - SE Surface Hardening and Wear Performance of Ausferritic Silicon Steels David Hernando Pino Melgarejo
Transcript of Surface Hardening and Wear Performance of Ausferritic ...

MASTER’S THESIS
2007:036 PB
Universitetstryckeriet, Luleå
Master Thesis, Continuation Courses AdvAnCed MATeriAl SCienCe And engineering
Department of Applied Physics and Mechanical Engineering Division of Engineering Materials
2007:036 PB • ISSN: 1653 - 0187 • ISRN: LTU - PB - EX - - 07/036 - - SE
Surface Hardening and Wear Performance of Ausferritic Silicon Steels
David Hernando Pino Melgarejo

Master’s Thesis
Surface Hardening and Wear Performance of Ausferritic Silicon Steels
DAVID H PINO MELGAREJO
EUROPEAN MASTER PROGRAMME IN ADVANCED MATERIALS SCIENCE AND ENGINEERING
Luleå University of Technology Department of Applied Physics and Mechanical Engineering
Division of Engineering Materials
1
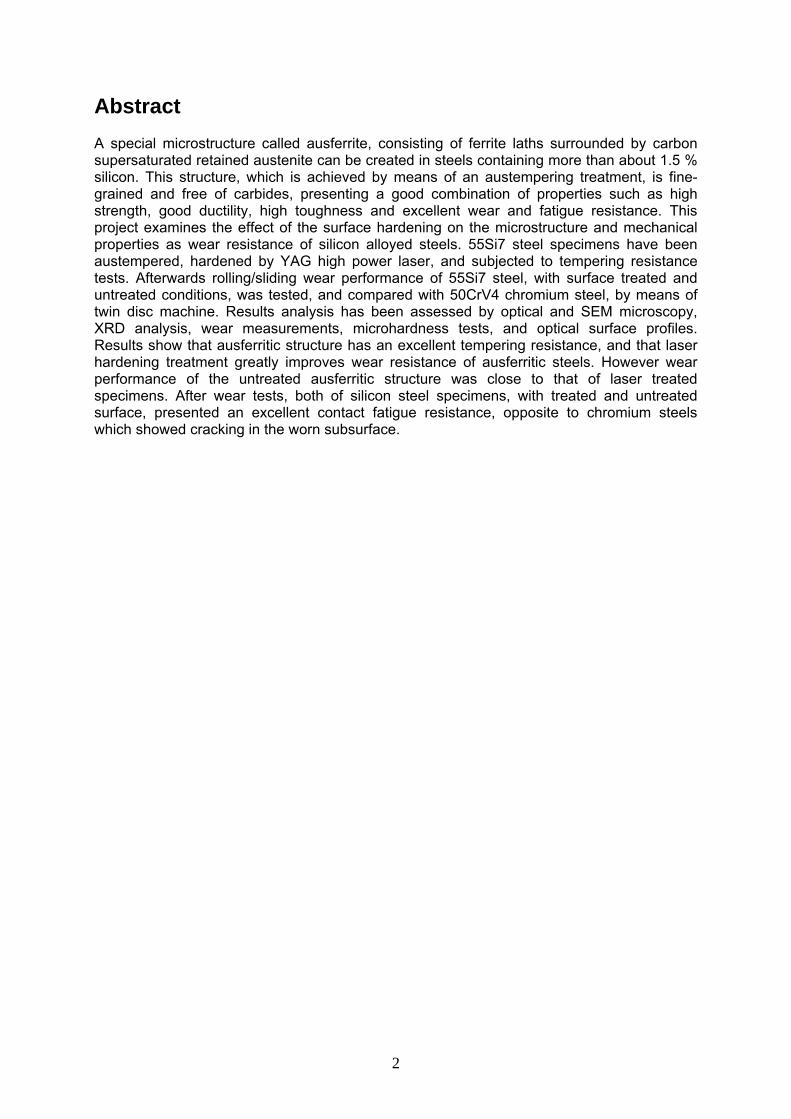
Abstract A special microstructure called ausferrite, consisting of ferrite laths surrounded by carbon supersaturated retained austenite can be created in steels containing more than about 1.5 % silicon. This structure, which is achieved by means of an austempering treatment, is fine-grained and free of carbides, presenting a good combination of properties such as high strength, good ductility, high toughness and excellent wear and fatigue resistance. This project examines the effect of the surface hardening on the microstructure and mechanical properties as wear resistance of silicon alloyed steels. 55Si7 steel specimens have been austempered, hardened by YAG high power laser, and subjected to tempering resistance tests. Afterwards rolling/sliding wear performance of 55Si7 steel, with surface treated and untreated conditions, was tested, and compared with 50CrV4 chromium steel, by means of twin disc machine. Results analysis has been assessed by optical and SEM microscopy, XRD analysis, wear measurements, microhardness tests, and optical surface profiles. Results show that ausferritic structure has an excellent tempering resistance, and that laser hardening treatment greatly improves wear resistance of ausferritic steels. However wear performance of the untreated ausferritic structure was close to that of laser treated specimens. After wear tests, both of silicon steel specimens, with treated and untreated surface, presented an excellent contact fatigue resistance, opposite to chromium steels which showed cracking in the worn subsurface.
2
Acknowledgements I highly appreciate the support and guidance of Esa Vuorinen -who has been working for several years in the field of silicon alloyed steels- throughout this project. I am grateful to Jonas Lundberg and Braham Prakash –LTU tribology laboratory- for their essential assistance and guidance during the wear tests performance and results analysis. I would like to thank to Johnny Grahn for his constant assistance with the SEM analysis and Peter Hedström for his support with XRD Analysis. I greatly appreciate the support of Greger Wiklund during the laser treatment of the samples. I am grateful to the material science departments at Luleå Tekniska Universitet –Sweden- and Universitat Politecnica de Catalunya –Spain- for my education during these two years. Finally I would like to express my deep gratitude to Beatriz, Nando and Mariana -my family-, who always supported and encouraged me to carry out this project.
3

Contents 1. Introduction ............................................................................................................................ 1
1.1 Background ...................................................................................................................... 1 1.2 Aim of the Thesis ............................................................................................................. 2 1.3 Delimitations .................................................................................................................... 2
2. Austempered Silicon Alloyed Steels...................................................................................... 3 2.1 Nature of Bainite .............................................................................................................. 5 2.2 The T0 Theory .................................................................................................................. 6 2.3 Effect of composition and processing parameters on the mechanical properties of silicon alloyed steels............................................................................................................... 8
2.3.1 Effect of silicon ......................................................................................................... 8 2.3.2 Effect of austempering temperature .......................................................................... 9 2.3.3 Effect of time........................................................................................................... 10 2.3.4 Effect of alloy modifiers ......................................................................................... 11
3. Methods and Experiments .................................................................................................... 12 3.1 Material and Austempering Treatment .......................................................................... 12 3.2 Laser Hardening Treatment............................................................................................ 13 3.3 Wear Tests...................................................................................................................... 14 3.4 Material Characterization............................................................................................... 16
4. Results and Discussion......................................................................................................... 18 4.1. Austempering Treatment............................................................................................... 18 4.2 Laser Hardening ............................................................................................................. 18 4.2.1 Tempering resistance of ausferritic specimens ........................................................... 21 4.3 Wear Tests...................................................................................................................... 22
4.3.1 Worn Surfaces ......................................................................................................... 24 4.3.2 Wear effect on deformed zone ................................................................................ 25 4.3.3 Cross section examination....................................................................................... 27 4.3.4 Surfaces Profiles...................................................................................................... 29 4.3.4 Transformation of retained austenite into martensite.............................................. 31
5. Conclusions .......................................................................................................................... 34 References ................................................................................................................................ 35
4
Figures Figure 1. TTT and CCT diagram for a 55Si7 steel ................................................................... 3 Figure 2. Schematic illustration of bainitic and ausferritic microstructures ............................ 4 Figure 3. Schematic illustration of To and To' curves ............................................................. 6 Figure 4. Illustration of the incomplete reaction phenomenon ................................................. 7 Figure 5. Tensile strength as a function of Si content in silicon alloyed steels ........................ 8 Figure 6. Toughness as a function of Si content in silicon alloyed steels ................................. 9 Figure 7. Hardness as a function of austempering temperature in Si alloyed steels ................. 9 Figure 8. Toughness as a function of austempering temperature in Si alloyed steels ............. 10 Figure 9. Hardness and austenite content as a function of austempering time ....................... 10 Figure 10. Microstructure of normalized 55Si7-steel specimen .............................................. 12 Figure 11. Laser hardening of wear test specimens ................................................................. 13 Figure 12. Basic microstructure of Cr steel quenched and tempered....................................... 15 Figure 13. UTM 2000 Twin-disc machine............................................................................... 15 Figure 14. Wyko NT1100 optical surface profiler ................................................................... 17 Figure 15. Optical and SEM micrographs of ausferritic microstructure on 55Si7 steel .......... 18 Figure 16. Depth of harden layer and maximum HV 0.1 as a function of beam laser velocity19 Figure 17. Hardness profiles of laser hardened samples.......................................................... 19 Figure 18. SEM micrograph of harden layers in samples C and G.......................................... 20 Figure 19. Microstructure in the interface between base material and harden layer: a) optical picture b) sem picture............................................................................................................... 20 Figure 20. Hardness profile of the laser hardened 55Si7 sample............................................. 21 Figure 21. Tempering resistance of 55Si7 at 300 and 400 ºC in base material and hardened layer. ......................................................................................................................................... 21 Figure 22. Wear rate as a function of initial hardness.............................................................. 23 Figure 23. Wear coefficient K as a fuction of initial hardness................................................. 23 Figure 24. SEM micrographs showing worn surfaces ............................................................. 24 Figure 25. Hardness increase as a function of initial hardness ................................................ 25 Figure 26. Hardness profiles of the worn subsurfaces ............................................................. 26 Figure 27. Optical micrograph showing the longitudinal section ........................................... 26 Figure 28. Optical and SEM micrographs of the 55Si7 cross section...................................... 27 Figure 29. Optical and SEM micrographs of the 50CrV4 cross section .................................. 28 Figure 30. Optical and SEM micrographs of the SH-55Si7 cross section ............................... 28 Figure 31. Optical and SEM micrographs of the SH-50CrV4 cross section........................... 28 Figure 32. Surface profile of the specimens before wear tests................................................. 30 Figure 33. Surface profile of the specimens after wear tests .................................................. 30 Figure 34. X-ray patterns for 55Si7 steel before and after wear test ....................................... 31
5
Tables Table 1. Mechanical properties of 55Si7 steel ....................................................................... 12 Table 2. Technical Specifications of the Twin-disc machine for wear tests............................ 14 Table 3. Disposition of the Wear Tests .................................................................................... 14 Table 4. Wear Test Parameters ................................................................................................ 14 Table 5. Wear tests results........................................................................................................ 22 Table 6. Phase peaks at XRD patterns for ausferritic silicon steel .......................................... 31
6
1. Introduction
1.1 Background Austempered ductile iron (ADI) has been a material of high interest because of the special austenitic-ferritic (ausferritic) microstructure, which exhibits a good combination of mechanical properties [1, 2]. But due to the intrinsic structure and solidification conditions of austempered ductile iron, its application in certain areas has been considerably limited. In the recent years this ausferritic structure has been also studied in high silicon cast steels. In similar way to ADI, ausferritic microstructure can be created in steels that contain more than about 1.5 % Si. This structure is achieved by an austempering treatment in which the steel is cooled to a temperature above the Ms temperature of the steel and kept at that level for a certain time. During this time ferrite will nucleate from the austenite and the ferrite laths will grow during the diffusion of carbon into the retained supersaturated austenite. No carbides will be formed by the suppression of this by the Si-atoms. The structure is very fine grained and thereby high strength in combination with good ductility and toughness will be achieved. In addition it is possible to get excellent wear resistance [3 – 5.]. The hardness of the ausferritic structure depends on carbon content of the steel and transformation temperature [4, 6]; values between 400 and 500 HV can be reached. This hardness is far below that for martensitic structures but fairly high for a through hardened component. Excellent wear and fatigue resistance have been some of the properties of main interest for this kind of steels; and the main reasons for this are the deformation hardening of the structure and the continuous phase transformation of the retained austenite into martensite in the outermost layer of the material [3, 6, 7.]. During the last years several researches have been oriented in this path. For instance, sliding wear resistance of steel with 0.55%C and 1.9%Si have been compared to that of boron alloyed steels, with similar hardness level, showing excellent results [8]. These facts make also interesting to compare the wear resistance of the ausferritic- with that of a martensitic- structure, and also tests other kinds of wear such as rolling/sliding contact. The main goal with this work is to investigate the possibility to surface harden a steel with an ausferritic structure and by that get a component with a combination of high strength and toughness in the interior and with a surface with high hardness and excellent wear resistance. The method for surface-hardening used in this work is CO2-high-power laser and Nd-YAG laser treatment. Laser surface hardening treatment of conventional austempered bainitic steels has shown good results with regard to a combination of good wear resistance, high strength in the base material and tempering resistance of the interface layer [9, 10.]. One special possibility that is offered by this Si-steel is good tempering resistance. The Si in the steel hinders the formation of carbides and thereby the tempering of the ausferritic and martensitic microstructures are hindered and the hardness is kept up to relatively high temperatures. A comparison can be made with Si-containing cast irons for which it has been shown that the tempering resistance is good [11]. Different products have been made from austempered ductile cast irons (ADI), which have the same ausferritic base-microstructure as the steels studied in this work. Gears is one interesting application of the ADI:s and it is interesting to study if the Si-alloyed steels can be used for this kind of application. This research presents the introductory work made about surface hardening of Si-alloyed steels.
1

1.2 Aim of the Thesis The main goal for this research is to investigate the effect of the surface hardening on the microstructure and mechanical properties as hardness and rolling/sliding wear resistance of silicon alloyed steels with carbide-free microstructure consisting of bainitic ferrite and retained austenite. One of the applications that are of main interest for this kind of steel is gears. In order to reach this goal the following objectives should be reached:
To find the optimal parameters of the surface hardening treatment in order to assure the required properties in the harden layer such as depth and hardness.
To evaluate the effect of the surface hardening on the properties and microstructure of
the material.
To evaluate the tempering resistance of the ausferrite structure in the bulk material and the martensitic structure in the hardened layer.
To determine a suitable type of wear test and operational parameters in order to get
relevant information regarding to the application of interest.
To establish suitable methods to analyse and compare the results of the wear tests and their effect in the microstructure and mechanical response of the material.
To analyse the role and contribution to wear resistance of the retained austenite
present in the ausferritic structure and its transformation to martensite under mechanical deformation during the wear tests.
1.3 Delimitations This research have been limited to one specific steel, 55Si7, with chemical composition of 0,56C-1,90Si-0,84Mn-0,19Cr-0,11Ni (wt%). Austempering parameters, such as time and temperature, have been taken from previous investigations and no further work has been carried out in order to optimise them. Regarding to wear tests, only one set of test parameters was used and only one replica has been done for each test.
2

2. Austempered Silicon Alloyed Steels Bainite is a non equilibrium microconstituent which occurs by decomposition of austenite in a temperature range between the martensitic transformation and the pearlitic transformation; cooling rates are too fast to produce pearlite, but not fast enough to form martensite. The reaction can be achieved by isothermal maintenance or by continuous cooling. The bainitic structure is very close to the structure of tempered martensite [13-15]. The area of bainitic transformation is divided in two parts: upper bainite and lower bainite. Upper bainite is formed at higher temperatures where the diffusion rates are high enough to allow the diffusion of carbon to the lath boundaries and consists of ferrite plates and interlath carbide precipitates. Lower bainite forms at lower temperatures where the carbon is trapped within the growing ferrite lath resulting in carbide precipitation within ferrite [13, 16, 17.]. In plain carbon steels bainitic transformation occurs in two stages [1, 13-19.]. In the first stage, the austenite (γ) decomposes into ferrite (α) and high carbon austenite (γHC): γ → α + γHC eq. 1 If the steel is held at the austempering temperature certain time, a second stage or reaction occurs, during which the high carbon austenite (γHC) can decomposes into ferrite (α) and carbide (ε). γHC → α + ε eq. 2 An important characteristic of the resulting microstructure is the nature and extent of carbide precipitation. Carbide is known to cause embrittlement in the material and is largely responsible for the commercial failure of many or the early bainitic steels.
Figure 1. TTT and CCT diagram for a 55Si7 steel [20]
3

In alloys that contain more than about 1.5% silicon a special carbide-free microstructure consisting of bainitic ferrite and retained austenite (ausferrite) can be created by means of an austempering treatment, which involves austenitization of the steel followed by quenching to a temperature below the perlite nose, but above the martensite start temperature; then the steel must be kept at that level for certain time until the ausferritic transformation is done. In these steels a large amount retained austenite is present because silicon strongly retards the second reaction of the bainitic transformation, where carbides precipitate. During the first stage carbide free bainite is formed rapidly, and the austenite becomes enriched in carbon. The second reaction starts with the formation of carbides but takes place at a very low rate [21 – 23.]. Silicon is insoluble in iron carbide; for this reason it is necessary for silicon to diffuse out of the carbide particles, and this process slower by many orders of magnitude than the diffusion of carbon atoms. Basically, the difference in diffusion coefficients between carbon and silicon atoms is the reason because silicon retards the second reaction of the bainitic transformation [24]. The nature and structure of silicon alloy steels is similar to that of bainite but formation of carbides is suppressed. Since the term bainite implies a structure consisting of ferrite and carbides it is not correct to use the term bainite to describe the structure of silicon alloy steel obtained by means of the austempering treatment; the term ausferrite is employed to name this microstructure. Figure 2 shows a schematic illustration of the basic microstructure in bainite and ausferrite.
Figure 2. Schematic illustration of bainitic and ausferritic microstructures [8]
4

2.1 Nature of Bainite Bainite is considered to be the most complicated microstructure of steel; and even nowadays formation of bainite is not completely understood, basically there are two competitive viewpoints regarding the formation of bainite from austenite. They are commonly called “diffusive” and “displacive” mechanism [14, 21, 24.]. These hypotheses concerning growth and formation of bainite also apply to the formation of ausferrite since the second reaction is not dealt with. According to the displacive mechanism, the α/γ is of a glissile, martensitic type which can move without any random jumps of the lattice atoms. In principle, the movement may be slow, controlled by long-range diffusion of carbon, or very rapid as in a martensitic transformation [14]. According to the diffusive mechanism, some short-range diffusion of the lattice atoms is required. Originally, this was proposed to occur at well developed ledges in the α/γ interface. The modelling of the interface structure has grown more sophisticated and the term “diffusive” includes any structural feature where lattice atoms can cross the interface by random jumps [14]. There are also different hypotheses regarding to the diffusion of carbon; three basic viewpoints have been proposed [14]: Some proponents of the displacive mechanism states that the similarity to the martensitic
transformation is so strong that there are no individual movements of the carbon atoms as in α/γ interfaces passes through a region. This proposes a diffusionless growth, which requires high growth rate; and it may be natural to expect because the displacive mechanism is supposed not to be thermally activated.
On the other side, it is believed that bainitic ferrite grows under local equilibrium between α and γ across the moving α/γ interface. This means that bainitic ferrite would get the carbon content prescribed by the α / α + γ boundary in the phase diagram. It should be pointed out that under mentioned conditions it is also possible that bainitic α inherits the carbon content of the parent γ, but only if its composition falls on the α / α + γ phase boundary. In that case, the growth would be partitionless but not diffusionless.
A third hypothesis is that some driving force is required to make the interface move. That
driving force will apply to the lattice atoms but not to interstitial atoms like carbon. It is thus possible to have local equilibrium for carbon and not for the lattice atoms.
One interesting questions about these thoughts is what kind of equilibrium governs the conditions at the α / α + γ interface. It should be noticed that there are three defined cases: Full local equilibrium for lattice and atoms for interstitials.
Local equilibrium only for interstitials.
Diffusionless not local equilibrium.
However, it should be pointed out that there is a series of cases intermediates between the first and the second one which are without local equilibrium.
5

According to the diffusive mechanism, the growth rate must be at least low enough for the short range diffusion of the lattice atoms and there is then time for the interproponents of this mechanism tend to believe that the growth rate of long-range diffusion of carbon. Then there would be time for carbon to partition between ferrite and austenite and maintain the same carbon activity on both sides of the interface, which implies local equilibrium for carbon but not necessarily for lattice atoms.
2.2 The T0 Theory The T0 curve is the locus of points, on a temperature versus carbon concentration plot, where austenite and ferrite of the same chemical composition have the same free energy [26]. Diffusionless growth requires that transformation occurs at a temperature below T0, when the free energy of bainite becomes less than that of austenite of the same composition. Figure 3 shows an example of that; growth without diffusion can only occur if the carbon concentration of the austenite lies to the left of the T0 curve [13]. Similarly, it is defined the T0’ but taking in account the stored energy of the ferrite due to the displacive mechanism of transformation. This implies that the maximum of bainite that can be obtained at any temperature is limited by the fact the carbon content of residual austenite must not exceed the concentration given by T0’ curve. Experimental results have shown that T0’ curve greatly influences the mechanical properties of carbide-free bainitic steels [26].
Figure 3. Schematic illustration of To and To' curves [13]
6

Bainite nucleation is considered to occur by spontaneous dissociation of specific dislocation defects which are already present in the parent phase. On the other hand, the subunit growth is considered diffusionless, although soon afterwards the excess of carbon is partitioned to the surrounded austenite, and stifled by the strength of the residual austenite. The process continues by successive nucleation of subunits until the carbon concentration of the residual austenite reaches the T0 curve. Then this phenomenon is know as “incomplete reaction”, because the austenite has not reached its equilibrium composition (according to the Ae3 curve) at the point reaction stops. This process is shown graphically in figure 4.
Figure 4. Illustration of the incomplete reaction phenomenon [13]
The maximum amount of carbon that can be stored in the retained austenite is explained by the T0 concept. Therefore ferrite is allowed to form without diffusion, as long as the carbon concentration in the austenite is below T0 curve. It should be pointed out that diffusive and displacive in the context of bainite refers to the mobility of iron and not the interstitial carbon. If growth of ferrite with a carbon concentration equal to the T0 composition would be allowed, the process would proceed until the austenite composition equals that at the Ae3 line. The ferrite can only hold a limited amount of carbon, given by Ae1 line; however, if carbides are formed within the ferrite laths, the mean carbon concentration in the ferrite can be held constant at the T0 concentration, leading to a complete reaction. Nevertheless, the formation of carbide is prevented if more than about 1.5 % silicon is added to the steel, keeping it carbide free and hence the transformation can be expected to stop as the carbon level in austenite reaches T0 [4, 27, 28.]. It has been experimentally found in some cases that the carbon concentration exceeds that predicted by the T0 concentration, even no carbides have been found, which is thermodynamically impossible. One explanation of this incompatibility is that the mechanism in which the bainite grows is without any diffusion, but excess carbon is rejected into the austenite soon after transformation [29].
7

2.3 Effect of composition and processing parameters on the mechanical properties of silicon alloyed steels This section presents some general trends regarding to the effect of the composition and some processing parameters, such as time and temperature, on the microstructure and mechanical properties of silicon alloy steels. Most of the presented graphs in this section are only intended to represent the relationship between the mechanical properties and the regarding parameters, and not to present the precise properties values, because these will depend on the alloy composition.
2.3.1 Effect of silicon It has been shown that the higher the content of silicon, the larger the ferrite zones [4]. Alloys containing around 2% silicon exhibit a fine free carbide structure, while alloys containing around 4% silicon show large ferrite zones. On the other hand alloys with lower silicon content show martensitic regions. While the silicon content increases, the tensile strength decreases and the hardness remains unchanged. On the toughness, the effect of silicon is found to be more complex. Increasing the silicon content to approximately 2% an improvement of toughness is obtained, but a further increase to approximately 4% induces a decrease of toughness. Silicon introduces a three phase region in which ferrite, austenite and carbide coexist in the Fe-C-Si diagram. The increase of silicon content makes the eutectoid point shift left, decreases the carbon solubility in the austenite, and increases the eutectoid transition temperature. Therefore, a higher austenitising temperature than usual is required to allow the rapid homogenization of carbon in austenite and reduction of the proeutectoid ferrite zones, and consequently an increase of impact toughness. However, an excessive austenitising temperature causes the formation of a coarse structure, with a detriment of the mechanical properties.
1000
1200
1400
1600
1 2 3 4
% Si
Tens
ile S
tren
ght
Figure 5. Tensile strength as a function of Si content in silicon alloyed steels [4]
8

10
20
30
1 2 3 4
% Si
Toug
hnes
s
Figure 6. Toughness as a function of Si content in silicon alloyed steels [4]
2.3.2 Effect of austempering temperature It has been found experimentally that the hardness of the material increases with increasing austempering temperature [18]. Additionally, both the yield and the tensile strength of the material increase as the austempering temperature increases. On the other hand, the ductility of the material decreases as the austempering temperature increases. This is due to the formation of the stress-induced martensite, which reduces the ductility and increase the strength. It should be pointed out that the presence of blocky austenite is detrimental to the ductility and toughness, because this makes the austenite unstable and prone to form brittle plate shape martensite [7].
300
400
500
250 300 350 400
Austempering Temperature (ºC)
Har
dnes
s
Figure 7. Hardness as a function of austempering temperature in Si alloyed steels [18]
9

25
35
45
250 300 350 400
Austempering Temperature (ºC)
Toug
hnes
s
Figure 8. Toughness as a function of austempering temperature in Si alloyed steels [18]
2.3.3 Effect of time
300
400
500
600
700
800
1 10 100 1000 10000
Time (min)
Har
dnes
s
0
10
20
30
40
50A
uste
nite
con
tent
Hardness
% Austenite
Figure 9. Hardness and austenite content as a function of austempering time [19]
The progress of the isothermal transformation can be studied by several techniques such as hardness measurements, x-ray diffraction, metallography or resistometry. Figure 9, which was obtained by resistometry and x-ray measurements, shows the general trend of the hardness and the corresponding austenite content as a function of austempering time [19]. The hardness (initial hardness is about 700 HV and final HV is about 400 HV) decrease rapidly over a period of 1 to 30 minutes concurrent with significant increase in the austenite content. It is during this time that the austempering reaction progresses rapidly as bainitic
10

ferrite plates nucleates and grew into the surrounding austenite, which becomes enriched in carbon. The hardness reaches its minimum plateau when the first reaction is complete, while the austenite content reaches a temporary plateau. The sudden decrease in the austenite content indicates the start of the second reaction [19, 30.].
2.3.4 Effect of alloy modifiers In some cases the toughness of silicon alloyed cast steels suffers a noticeable detriment during casting operations because the dendrite structure which could be coarse due to the primary crystallization. In those cases, the content of carbon and other alloy elements between the dendrites is at high level and the dendritic structure and segregation could not be eliminated at the following heat treatments. Therefore, the steel will present a large amount of blocky retained austenite in the ausferritic structure. Blocky retained austenite is less thermal and mechanically stable; this can lead to brittle plate shape martensite, which degrades the toughness of steel. On the other hand, the thin film shaped retained austenite has much higher thermal and mechanical stability, and transformation of austenite to martensite in the plastic zone at the tip of a propagating crack should reduce the energy available for crack propagation and hence improve brittle fracture resistance [7, 26]. It has been found that modifier containing titanium, vanadium, and rare earth metals can effectively reduce segregation of carbon and alloy elements and refine the austenite grains [7]. Results show that using these modifiers austenite grains are refined significantly, the grains are mainly equiaxed and the coarse dendritic structure is reduced. This leads to a noticeable improvement in mechanical properties such as yield and tensile strength, and toughness.
11

3. Methods and Experiments
3.1 Material and Austempering Treatment Studied material at this research is 55Si7 silicon alloyed steel, with determined chemical composition of 0,56C-1,90Si-0,84Mn-0,19Cr-0,11Ni (wt%). The material was delivered as hot-rolled flat bars, 12 mm thick and 65 mm wide. In order to get the ausferritic microstructure austempering was carried out. This treatment consists of two basic steps: austenitization for 30 minutes at 900 ºC; after that the material was cooled to 340 ºC in a salt bath and kept in those conditions for two hours.
Figure 10. Microstructure of normalized 55Si7-steel specimen
Table 1 shows the mechanical properties of 55Si7 steel obtained in a previous research. Figure 10 shows the microstructure of the normalized steel, consisting of a very fine pearlite structure with small amounts of ferrite.
Table 1. Mechanical properties of 55Si7 steel [8] Before Heat Treatment After Heat Treatment R y 0,2 MPa 612 1250 R T MPa 1047 1530 A 5 % 13 12 Z % 40 58,5 Hardness HV 338 485 Impact toughness(20ºC) J 12 20,7
12

3.2 Laser Hardening Treatment Two stages of the laser hardening treatment were carried out at this investigation. At the first stage several velocities of the beam speed were tested in order to determine their influence on the hardness, depth of the hardened layer, and microstructure of the ausferritic silicon steel. The samples were hardened by a high power CO2-laser with a power of 2170 W, beam diameter of 8,3 mm and graphite coating of the surfaces before treatment. The tested beam velocities are between 0,50 and 1,60 m/min. At the second stage of laser hardening treatments, round samples for wear tests and sheet pieces for tempering resistance tests were treated. At this stage a high Nd:YAG laser was used, with a power of 3000 W, beam diameter of 9 mm, a fixed beam velocity of 1,5 m/min and graphite coating at sample surface.
Figure 11. Laser hardening of wear test specimens
Tempering Resistance Tests After austempering and laser hardening of the samples, tempering resistance tests were performed in order to evaluate the microstructure and hardness of the base material and hardened layer after been kept at high temperatures. The samples were kept in a furnace at temperatures of 300 ºC and 400 ºC for 1, 5, 24 and 100 hours. Hardness measurement of the samples was done.
13

3.3 Wear Tests For the purpose of this project, rolling sliding wear tests have been performed in order to simulate gear operation conditions [33, 34.]. UTM 2000 twin-disc machine has been used for this purpose. This machine serves to characterize and simulate friction and wear behaviour. During tests normal force, friction force and linear wear of both specimens is measured continuously. The two servo drives can be separately controlled allowing testing under pure sliding to pure rolling conditions. The samples are mounted on the end of each shaft on the servo drives. A force sensor on the load lever is used to measure the applied load. The friction is calculated by measuring the traction force between the disc specimens. For this purpose a torque sensor, mounted between one of the servo motors and the shafts where the specimen is mounted, is used.
Table 2. Technical Specifications of the Twin-disc machine for wear tests UTM 2000 twin disc machine
Speed 0,1 – 3000 RPM steplessly adjustable Load 0 – 2000 N, dead weight Friction force 0 – 50 N Wear Measurement LVDT displacement sensor Temperature From RT to 100 ºC steplessly adjustable A series of four tests was carried out at this stage. Each test was performed with two identical rotating discs of 45 mm of diameter (42 mm for the chromium steel) with a contact width of 10 mm. The tests were disposed in the following way:
Table 3. Disposition of the Wear Tests Wear Test Material Disc Diameter HV at surface
T1 55Si7 Steel (austempered) 45 mm 451 T2 50CrV4 Steel 42 mm 279 T3 55Si7 Steel Surface Hardened 45 mm 802 T4 50CrV4 Steel Surface Hardened 42 mm 730
The test were run with a contact pressure of approximately 300 MPa, equivalent to a 300 N load, with one disc running at 100 rpm, and the other disc running 5% slower than the first one (5% slip). The time for each test was 5 hours. Tests were performed at room temperature (25 ºC) in dry conditions in order to get a considerable amount of wear and study the response of the materials.
Table 4. Wear Test Parameters Wear Test Parameters
Type of contact Rolling/sliding Load 300 N
Speed 100 rpm Slippery 5 %
Time 5 h Lubrication Not
14

50CrV4 steel was selected to compare the wear performance of the silicon steel. Chemical composition of this steel has been determined to 0,55C-0,20Si-1,0Mn-1,2Cr-0,10V (wt%). This material has the typical composition of through hardening steels for gear applications and presented a tempered martensite structure [35].
Figure 12. Basic microstructure of Cr steel quenched and tempered
Employed parameters for measuring wear were weight loss and the specific wear coefficient [36].
Figure 13. UTM 2000 Twin-disc machine
15
3.4 Material Characterization Metallography Microscopy of specimens was performed both with a scanning electron microscope (SEM) and optical microscope. The SEM equipment used was a Jeol JSM 6460 LV operated at 15 kV and fitted with Oxford Inca EDZ software. Optical microscope used was a Olympus VANOX-T microscope. Specimens were ground with diamond paste and polished with a 1 μm silica solution and finally etched with 2% nital. Microhardness Measurements Microhardness measurements were done using a Matsuzawa MXT-CX tester using indentation loads of 50, 100 and 300 g; however 100 g was used as default load for most of the measurements. A representative hardness value was obtained from the average resulting from at least three properly placed indentations. Hardness measurements were done to characterize the specimens, hardened layers, and check the strain hardening effect after wear tests. X-ray diffraction analysis X-ray diffraction analysis was carried out using a Philips MRD equipment operating at 40kV and 45 mA using CuKα radiation. The 2θ scan angles were ranged from 40º to 100º. X-ray analysis was used to determine the presence of retained austenite in silicon alloyed steels after and before the wear tests in order to check the amount of retained austenite that became into martensite under mechanical deformation. Surfaces profile measurements A Wyko NT1100 2D optical surface profiler was used to measure the surface at disc specimens after and before the wear tests. This profiler uses scanning white light interferometry to produce 3D images of surfaces. By means of Vision32 software advanced calculations of several surface parameters can be obtained. For this report only average roughness is presented. Technical specifications of Wyko profiler are: magnification: 1.25X-100X; vertical resolution (VSI): <1nm; and vertical resolution (PSI): 1 Å.
16
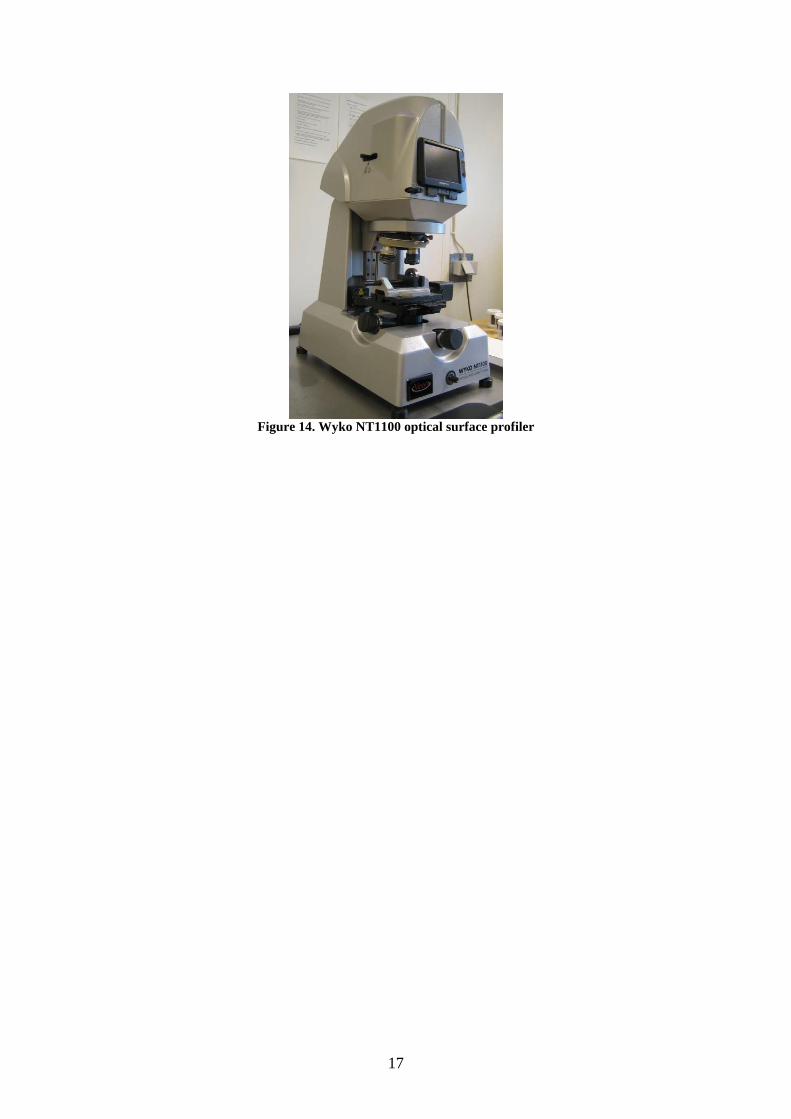
Figure 14. Wyko NT1100 optical surface profiler
17

4. Results and Discussion
4.1. Austempering Treatment After austempering treatments were carried out in several samples, typical ausferrite microstructure was obtained in 55Si7 steel with hardness values between 450 and 480 HV. The surfaces of the specimens were decarburized and presented low hardness values; therefore, in order to perform next tests grinding of sample surfaces was done. Inert protective atmosphere should be used at furnace in order to avoid surface decarburizing.
Figure 15. Optical and SEM micrographs of ausferritic microstructure on 55Si7 steel
In figure 15, optical and SEM micrographs of the obtained ausferritic microstructure, consisting of bainitic ferrite surrounded by films of retained austenite, is shown.
4.2 Laser Hardening After the first stage of laser hardening, several microstructures and hardness profiles were obtained in the hardened layers depending on the beam velocity. Basically for the lower beam velocities a considerable amount of retained austenite was obtained into the outermost surface. This is due to presence of graphite over the surface and the relatively low cooling rate which allowed the diffusion of carbon into the surface. Although the power laser output showed to be good enough to form martensite at hardened layer, presence of retained austenite decreased the hardness of the outermost surface. For the higher beam velocities retained austenite did not form into the surface and the highest hardness values were reached. It should be mentioned that for this samples austempering treatment was done for one hour, and lower hardness value of 350 HV was obtained.
18

0,00
0,20
0,40
0,60
0,80
1,00
1,20
1,40
1,60
1,80
0,4 0,6 0,8 1 1,2 1,4 1,6 1,8
Beam Velocity (m/min)
Dept
h of
Har
den
Laye
r (m
m)
0
100
200
300
400
500
600
700
800
Depth HV
Figure 16. Depth of harden layer and maximum HV 0.1 as a function of beam laser velocity
200
250
300
350
400
450
500
550
600
650
700
750
800
0 20 40 60 80 100 120 140 160 180 200
Distance [µm X 10]
HV
0.1
A (0,5 m/s)B (0,75 m/s)C (0,85 m/s)D (1,1 m/s)E (1,2 m/s)F (1,4 m/s)G (1,6 m/s)
Figure 17. Hardness profiles of laser hardened samples
Figure 17 shows hardness profiles of hardened layers. Sample A, treated with beam velocity of 0,5 m/s, presented a very low hardness value of 550 HV, which indicates that this velocity was too low to reach required cooling rate to produce martensite at surface. Beam velocities higher than 0,75 m/s were fast enough in order to produce martensite at surface and
19

hardness values of about 700 HV. However, most of the samples presented austenite formation in the outermost surface.
Figure 18. SEM micrograph of harden layers in samples C and G
Figure 18 shows two typical SEM micrographs of the obtained hardened layers: microstructure of sample C consists of martensite and retained austenite in the outermost layer; while sample G, which was treated with beam velocity of 1,6 m/s presented microstructure consisting of martensite in the whole harden layer.
Figure 19. Microstructure in the interface between base material and harden layer: a) optical picture b)
sem picture Microstructure in the interface between the hardened layer and the base structure is presented in figure 19. The microstructure in the base material side of this region does not differ considerably from that of the base structure.
After the first run of laser hardening experiments, surface treatment of samples for wear tests and tempering resistance experiments were carried out with Nd:YAG laser, using power of 3000 W and fixed beam velocity of 1,5 m/min. Hardness profile is shown in figure 20, and typical microstructure at hardened layer did not differ from the previously presented specimens.
20

300
350
400
450
500
550
600
650
700
750
800
850
900
0 20 40 60 80 10
Distance (µm X 10)
HV
0.1
0
-
Figure 20. Hardness profile of the laser hardened 55Si7 sample
4.2.1 Tempering resistance of ausferritic specimens
200
300
400
500
600
700
800
900
0 10 20 30 40 50 60 70 80 90 100
Time (h)
HV
0.3
-
Hardened layer - 300C
Hardened layer - 400C
Base material - 300C
Base material - 400C
Figure 21. Tempering resistance of 55Si7 at 300 and 400 ºC in base material and hardened layer.
21

Tempering resistance of ausferritic (base material) and martensitic (hardened layer) structures in 55Si7 silicon alloyed steel was tested at 300ºC and 400ºC during 100 hours. The hardness as function of time in the tempering tests showed that at 300 ºC the hardness hardly decreased, even after 100 h for the ausferritic structure. At 400 ºC the hardness decreased to 430 HV, 420 HV and 410 HV after 5, 24 and 100 h of heating respectively. The hardness of the martensitic structure was lowered to about 650 HV within 5 h when heated at 300 ºC, but this value was kept constant even after 100 h. At 400 ºC the hardness decreased to 630, 600, 540 and 510 HV after 1,5,25 and 100 h of heating. Results are graphically shown in figure 21.
4.3 Wear Tests The wear results data for the performed tests are given in the table 5 and figure 22, which show the wear rate as a function of the hardness at the surface before the tests. In order to measure the wear rate two commons parameters were used; the first one is [mg/m], which is weight loss per unit of sliding distance. The sliding distance is calculated by means of the relative slip linear velocity between the two discs and the duration of the test. The second used parameter is specific wear coefficient K, which is defined as:
SPHVK
××
= eq. 3
Where V is the volume of wear [mm3] produced in a sliding distance S [mm] under load P [Kg]; and H is the hardness value at the surface [36].
Table 5. Wear tests results Test Material Initial
HV Final HV
Wear Rate (mg/m)
K, Wear Coefficient
Friction Coefficient
T1 55Si7 Steel 451
730
0,226
6,9968 X 10⁻⁴
0,53
T2 50CrV4 Steel
279
505
1,835
3,9216 X 10⁻³
0,41
T3 55Si7 Steel Surface Hardened
802
1034
0,047
2,0752 X 10⁻⁴
0,57
T4 50CrV4 Steel Surface Hardened
730
900
0,083
3,1466 X 10⁻⁴
0,55
By means of figure 22 it can be easily noticed that the higher the surface hardness, the lower the wear rate. The specimen with the highest wear rate is the 50CrV4 steel with untreated surface, furthermore it can be seen that the difference in the wear rate for this steel compared to the other specimens is very high. The second highest wear rate was presented by the austempered 55Si7 steel, which is considerably lower than the 50CrV4 wear rate. As it was expected the surface hardened specimens presented the lowest wear rate, being SH-55Si7 steel the one with the lowest value (0,047 mg/m), followed by the SH-50CrV4 (0,087), which is almost two times higher than that of SH-55Si7 steel, with a relatively low difference in hardness and structure in the hardened surface, which consists basically of martensite for both of them.
22

0,0
0,2
0,4
0,6
0,8
1,0
1,2
1,4
1,6
1,8
2,0
200 300 400 500 600 700 800 900
HV 0.3 Hardness
Wea
r rat
e (m
g/m
)
55Si7
50CrV4
SH-55Si7
SH-50CrV4
Figure 22. Wear rate as a function of initial hardness
0,0E+00
5,0E-04
1,0E-03
1,5E-03
2,0E-03
2,5E-03
3,0E-03
3,5E-03
4,0E-03
4,5E-03
200 300 400 500 600 700 800 900
HV 0.3 Hardness
K, S
peci
fic W
ear C
oeffi
cien
t
55Si7
50CrV4
SH-55Si7
SH-50CrV4
Figure 23. Wear coefficient K as a fuction of initial hardness
It is also very interesting to notice that the wear rate difference between the surface treated and untreated specimens is considerably higher for the 50CrV4 specimens than that for the 55Si7 steels. The wear rate difference between the two 50CrV4 specimens is about twenty-two times, while that difference for the 55Si7 steel is only about 5 five times. This fact reveals
23

the very good wear performance of the austempered 55Si7 steel with untreated surface. It can be also pointed out that 55Si7 steel wear rate is eight times lower than that of 50CrV4, both of them with untreated surfaces. These rough calculations show that the wear performance of the austempered silicon steel specimen is closer, and comparable, to that of the surface treated material than that for the untreated surface specimen.
4.3.1 Worn Surfaces
Figure 24. SEM micrographs showing worn surfaces
a. 55Si7, b. 50CrV4, c. SH-Si557, d. SH-50CrV4 Figure 24 shows typical SEM pictures of worn surfaces of the four tested specimens. Appearance of the surfaces reveals that untreated 50CrV4 steel was the most affected by the wear tests, followed by the untreated 55Si7 steel, although this specimen presents a relatively smooth surface and it was not so much worn as the 50CrV4. On the other hand surface treated specimens show a very smooth surface, particularly 55Si7 steel, which was barely affected by wear. These results are coherent with wear rate data. Untreated surface specimens exhibit a typical adhesive wear mode, which is produced by the formation and subsequent shearing of welded junctions between two sliding surfaces [38 - 40.]. Both of the specimens presented the same wear patron although wear was so much severe for 50CrV4 steel
24

It is also common to observe agglomerated wear debris over the specimen surfaces. It should be mentioned that particularly 50CrV4 hardened steel presented evidence of contact fatigue cracking which is a typical damage associated to sliding/rolling contact at high pressures [41].
4.3.2 Wear effect on deformed zone Figure 25 plots hardness increase as a function of initial hardness. All the specimens presented an increase between 180 and 220 HV, except for the austempered silicon steel which presented the highest increase, 279 HV, due to the transformation mechanism of retained austenite into martensite under mechanical deformation, but this fact will be treated with more detail later on in this report. By means of this figure it can be stated that there is no clear relationship between the initial surface hardness and the hardness increase; results show that hardness increase is actually dependent on the specimen microstructure. Specimens with untreated surface presented higher hardness increase than those with treated surface; and it can be also pointed out that silicon alloyed steels presented higher hardness increase than their similar chromium steel specimens, with surface treated and untreated conditions
100
120
140
160
180
200
220
240
260
280
300
200 300 400 500 600 700 800 900
HVN Hardness (300g)
Hard
ness
Incr
ease
HVN
(300
g)
55Si7
50CrV4
SH-55Si7
SH-50CrV4
Figure 25. Hardness increase as a function of initial hardness
25

.
100
200
300
400
500
600
700
800
900
1000
1100
0 10 20 30 40 50 60
Distance from the Surface (μm)
HV
0.0
5 -
SH-55Si7SH-50CrV4l55Si750CrV4
Figure 26. Hardness profiles of the worn subsurfaces
Figure 27. Optical micrograph showing the longitudinal section
a. 55Si7, b. 50CrV4, c. SH-Si557, d. SH-50CrV4
26

By means of figure 27, microstructure of the deformed zone can be estimated; the two specimens with untreated surface presented a thicker deformed layer than that with hardened surface; indeed, for the laser hardened specimens it is quite difficult to estimate the deformed zone, especially for the silicon alloyed steel. The deformed zone presents a microstructure much finer than in the bulk, and has suffered strain elongation in parallel orientation to the wear sliding direction. These observations are complemented by figure 26, which examines the extent of the affected hardened zone by means of microhardness measurements. This plot confirms that the strain affected layer in the surface treated specimens is very thin, depth is about 10 μm for the 50CrV4 steel and 15 μm for the 55Si7. On the other hand untreated specimens presented a thicker strain affected layer, which is about 60 μm for both of them; and, although these two specimens presented a similar depth of the hardened zone, hardness increase is noticeable higher for the silicon alloyed steel, and a similar conclusion can be figured out for the surface hardened specimens. Even, surface hardened silicon steel and untreated chromium steel presented a similar hardness value increase in the surface, while depth of the strain hardened layer is totally different. These results suggest that hardness value increase has a strong dependence on the microstructure, while depth of the strain affected layer is dependent on bulk hardness and microstructure.
4.3.3 Cross section examination Figures 28, 29, 30, and 31, show optical and SEM pictures of the cross section of the specimens after the wear tests; cracking and debris formation, as deformed layer, is revealed by these micrographs.
Figure 28. Optical and SEM micrographs of the 55Si7 cross section
Cross section of the untreated silicon alloyed steel reveals that a low amount of debris was produced during the wear test; and no evidence of cracking was found. On the other hand, untreated chromium steel shows a high presence of debris and cracking at the subsurface. Comparing results for these two specimens, and also considering former shown results, can be figured out that ausferritic silicon alloyed steel has an excellent wear performance.
27
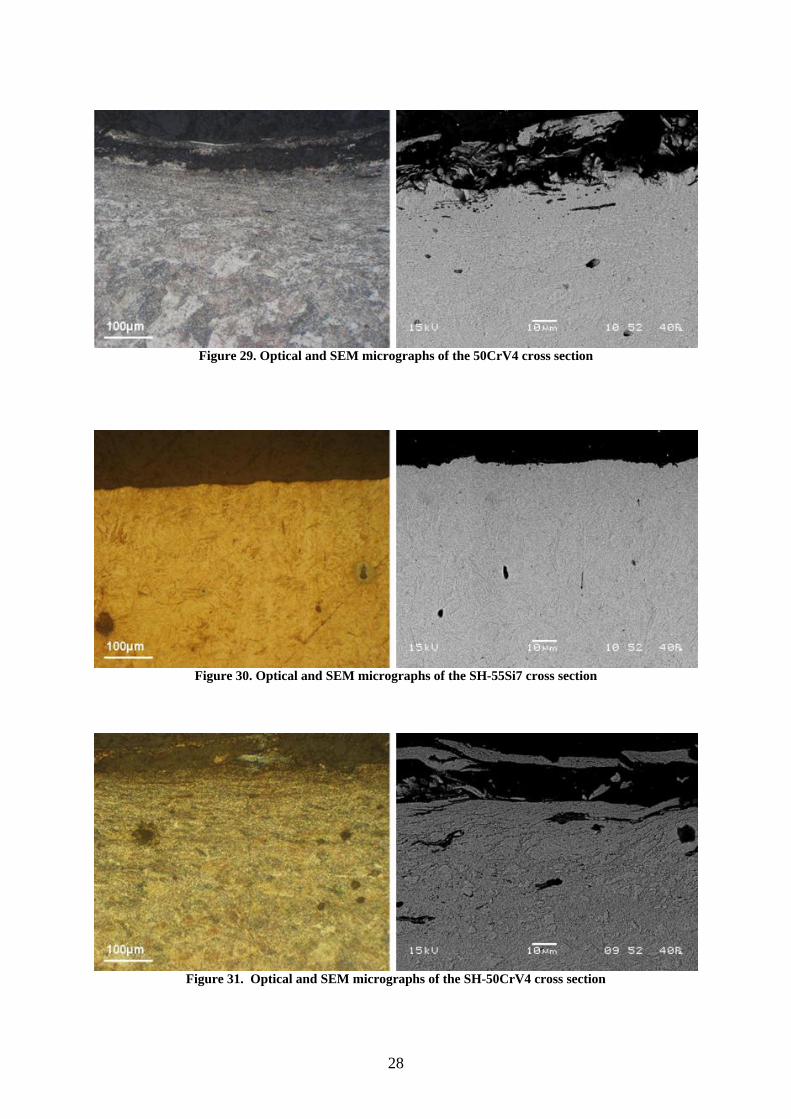
Figure 29. Optical and SEM micrographs of the 50CrV4 cross section
Figure 30. Optical and SEM micrographs of the SH-55Si7 cross section
Figure 31. Optical and SEM micrographs of the SH-50CrV4 cross section
28
Cross section of surface hardened silicon alloyed steel shows debris absence and absence of cracking for this specimen. These pictures along with the micrograph of the worn surface confirm that almost no wear was produced in this steel. Regarding to the surface hardened chromium steel, optical and SEM micrographs reveal a high presence of debris and cracks at the subsurface. It should be noticed that although a low wear rate was produced by this steel, a high quantity of cracks is present at the subsurface, which is a clear evidence of contact fatigue cracking. This phenomenon could be due to embrittlement of the subsurface after the laser hardening process, which could suggest that this steel is not completely suitable for this treatment. This behaviour can represent a serious problem in applications involving rolling contact fatigue; and, if lubricants are used and cracking is still occurring the damage would be worse because of the high local pressure increase due to trapped fluid [42]. Analysing these results it can de pointed out that both of chromium steels specimens presented cracking and a high amount of debris, while silicon alloyed steels did not present crack formation neither high amount of debris.
4.3.4 Surfaces Profiles By means of Wyko NT1100 3D optical profiler, surface profile of the specimens was obtained after the wear tests; average roughness of the surfaces was also obtained by means of this analysis. These figures can be analysed along with the SEM micrographs of the worn surfaces in order to get a better understanding of them. Surface profiles show that the most affected specimen after wear test is chromium steel with untreated surface, presenting a high increase of their average roughness, which is about two times higher than that for silicon alloyed steel. Both of surface treated specimens presented a very low average surface roughness, which is even lower than initial roughness. This phenomenon could be explained by means of the following analysis: a very low wear was produced for this specimens, and, a detailed analysis of surface profiles pictures leads to the conclusion that turning marks produced by manufacturing operations are still present in the specimens after wear tests. This conclusion suggests that the regions of the discs belonging to the surfaces valleys remained without doing contact with the corresponding counter disc during wear tests; therefore, material loss only occurred at peaks regions, decreasing their height, and consequently average roughness of the disc surfaces.
29

Figure 32. Surface profile of the specimens before wear tests
Figure 33. Surface profile of the specimens after wear tests
30

4.3.4 Transformation of retained austenite into martensite X-ray diffraction has been used to measure the amount of retained austenite in the untreated surface silicon alloy steel before and after the wear tests, and by this way the amount of retained austenite that turned into martensite during the wear test was determined; which explains the high hardness increase for this specimen.
Figure 34. X-ray patterns for 55Si7 steel before and after wear test
Table 6. Phase peaks at XRD patterns for ausferritic silicon steel Phase 2θ (h,k,l) d (Å)
Ferrite (α) 45,005 (1,1,0) 2,0133 65,315 (2,0,0) 1,4279 81,605 (2,1,1) 1,1792 98,705 (2,2,0) 1,0155
Austenite( γ) 43,745 (1,1,1) 2,0683 50,245 (2,0,0) 1,8149 73,985 (2,2,0) 1,2806
Martensite (α’) 44,965 (1,1,0) 2,0149 66,965 (2,0,0) 1,3967 79,945 (1,1,2) 1,1994 82,255 (2,1,1) 1,1715
31

Figure 34 presents the x-ray diffraction pattern for the ausferritic 55Si7 specimens before and after the wear tests. In the XRD pattern before wear test austenite and ferrite peaks appears, and the determined amount of retained austenite is 32%. In the XRD pattern after the wear test only ferrite and martensite peaks appears, which means that basically all the retained austenite turned into martensite during wear test explaining the high hardness increase of 279 HV. The amount of retained austenite was determined by means of the carbon concentrations in the retained austenite and the ferrite; and the carbon concentration at each phase was estimated using equations relating the lattice parameters with the phase composition, XRD results and Bragg’s law. 2θ angles and miller index planes received from XRD are shown in table 6; and by means of Bragg’s law, interplanar d distances and lattice parameters of retained austenite and ferrite in the steel specimen were determined.
222 lkh
ad++
= eq. 4
θλ dSinn 2= eq. 5 Where Cu Kα λ = 1,54106 Å Equation 4 defines the austenite lattice parameter aFCC as a function of the composition of the phase at room temperature [44]:
AlVCrMo
NiMnCFCC
XXXXXXXa
0056,00018,00006,00031,00002,000095,0033,05780,3++++
+++= eq. 6
Where Xi is the weight percent of the “i” element in the austenite. By using the obtained lattice parameter, equation 6, and solving this system the XC carbon content can be obtained. A carbon content of 1,542 wt% best fits for the obtained data. Similarly, the carbon content in the bainitic ferrite can be calculated by using the equation 7, which defines the ferrite lattice parameter as a function of the phase composition [44]:
( ) ( )
VCrMoNiMn
SiFe
FeFeCFeBCC
XXXXX
Xa
aaXaa
096,005,031,007,0006,0
03,03
496,2279,08664,2 2
32
+++++
−−+−
+= eq.7
Solving this system in a similar way as retained austenite equations a carbon content of 0,09 wt% was obtained in the ferrite. The carbon content in the 55Si7 specimen can be expressed as function of the relative carbon content in each phase:
32

ααγγ VXVXX CCC // += eq. 8 And
αγ
αγ
//
/
CC
C
XXXX
V−
−= eq. 9
Where
=CX mean carbon wt%
=γ/CX carbon wt% in the retained austenite
=α/CX carbon wt% in the ferrite
=γV volume fraction of austenite
=αV volume fraction of ferrite Solving equation 9 for 0,56 wt % mean carbon, 1,542 wt % carbon in the austenite, and 0,09 wt % carbon in the ferrite, the volume fraction of retained austenite in the silicon steel specimen was 32%. Previous investigations showed that results obtained by this procedure hardly differ from results obtained by graphic integration of the peaks at XRD pattern [8].
33

5. Conclusions An ausferritic structure consisting of fine bainitic ferrite laths surrounded by films of carbon enriched retained austenite can be obtained by austempering a silicon alloyed steel, containing 0,56 wt% carbon and 1,9 wt% silicon, for two hours at 340ºC. No carbides are present in the microstructure and hardness of about 500 HV can be obtained. The structure presents a good combination of properties such as high strength, excellent wear resistance and high fracture toughness. Surface hardening of the ausferritic silicon alloyed steel increases its surface hardness from about 500 HV to 800 HV, and a thickness of 500 μm of the hardened layer can be obtained. Laser hardening experiments showed that the faster the velocity of the laser beam, the higher the maximum hardness value and the lower the thickness of the hardened layer. Performing this treatment with a high beam velocity, a noticeable improvement in the wear performance of the silicon alloyed steel is reached. Experiments also revealed that when graphite is used as a sample coating during the laser hardening process with low beam velocities, a high content of retained austenite is obtained in the outermost surface and consequently a decrease of the surface hardness value occurs. Tempering resistance of the silicon alloyed steel, for both ausferritic and martensitic structure, is excellent at temperatures between 300ºC and 400ºC. At the temperature of 400ºC a small hardness decrease is obtained in the ausferritic structure, while at 300ºC hardness hardly decreases. For the martensitic structure an acceptable decrease is obtained. Rolling/sliding wear test were performed for ausferritic silicon alloyed steel specimens with treated and untreated surface. A chromium steel specimen with quenched and tempered structure was used for comparison; also in both conditions, untreated and treated surface. Wear tests results showed that the performance of surface hardened specimens is better than that of untreated specimens. However, wear performance of ausferritic steel was pretty close to that of hardened specimens and considerably better than that of quenched and austempered chromium steel specimen; which reveals the excellent wear resistance of the ausferritic structure in silicon alloyed steels. Excellent wear resistance of ausferritic silicon alloyed steel can be explained by the strain hardening transformation of retained austenite into martensite under mechanical deformation. Results showed that a retained austenite content of about 30% can be obtained in the ausferritic structure and this phase can totally turn into martensite under mechanical deformation, getting a hardness increase of about 280 HV. The wear resistance of the ausferritic silicon steel was considerably better than that of the quenched and tempered structure of the chromium steel, for both cases, untreated and treated surfaces. Chromium steel specimens presented high amount of debris and contact fatigue cracking while no evidence of cracking was found for the silicon alloyed specimens. Excellent cracking resistance of the ausferritic structure can be related to the strain hardening transformation of retained austenite into martensite
34
References [1] D.C Wen, T.S Lei. Influence of tempering on the mechanical properties of austempered ductile irons. Materials transaction, JIM, Vol. 40, No 9, 1999. [2] M.J Perez, M.M Cisneros, E. Valdes. Experimental study of the thermal stability of austempered ductile irons. Journal of materials engineering and perfonmance. ASM International. Volume 11 (5) October 2002. [3] E. Vuorinen. Materials for saw mill dust cutter blades.2nd World Conference on Pellets, 30 May - 1 June 2006, Jönköping, Sweden. [4] X. Chen, Y. Li, Microstructure and mechanical properties of austempered high silicon cast steel. Elsevier, Material Science and Engineering A 308, 2001. [5] Garcia-Mateo, F G Caballero. Ultra-high-strength Bainitic Steels. ISIJ International, Vol. 45 (2005) No11 pp1736-1740. [6] B. P. Sandvik, H. P. Nevainen. Structure-property relationships in commercial low-alloy bainitic-austenitic steel with high strenght, ductility and toughness. Metals Technology, The Metals Society, 1981. [7] X. Chen, Y. Li, Effects of Ti, V and rare earth on the mechanical properties of austempered high silicon cast steel. Metallurgical and Materials Transactions, Academic research library, Nov 2006, 37A. [8] A. Lindstöm, Austempered high silicon steel: Investigation of wear resistance in a carbide free microstructure. Master thesis. Luleå University of Technology, Luleå, 2006. [9] A. Basu, J. Chakraborty, S. M Shariff. Laser surface hardening of austempered (bainitic) ball bearing steel. Scripta Materialia 56 (2007) 887-890 [10] Guang-Xi Lu, H. Zhang. Sliding wear characteristics of austempered ductile iron with and with out laser hardening. Wear, 139, 1990 [11] E. Vuorinen, T. Pedersen, C. Magnusson, G. Wiklund, H. Engström, Creating tailor-made surfaces with high power C02 Lasers, Luleå University of Technology, FORCE Instutes,1992. [12] E. Vuorinen, B. Sorensen, T Pedersen, Laser surface treated materials, Final report: Nordisk industrifond project NR. P86051, 1992. [13] R W K Honeycomb, H K D Bhadeshia. Steels: microstructure and properties, Edward Arnold, London, 1995. [14] M. Hillert. The Nature of bainite. ISIJ International, Vol. 35, 1995. [15] M. Hillert. Diffusion in growth of bainite. Metallurgical and materials transactions A. Volume 25A, September 1994. [16] H K D Bhadeshia. Bainite in Steels 2nd Edition, London. IOM Communications Ltd. 2001 [17] B: Sandvik. The bainite reaction in Fe-Si-C alloys: the primary stage. Metallurgical transactions A. Volume 13A, May 1982.
35

[18] S. Putatunda. Influence of austempering temperature on microstructure and fracture toughness of a hig-carbon, high silicon and high-manganese cast steel. Elsevier, Materials and design 24, 2003. [19] Y. J Park, R.B Gundlach, J.F Janowak. Monitoring the bainite reaction during austempering of ductile iron and high silicon cast steel by resistivity measurement. Industrial Heating, October, 1987. [20] EWI virtual joining portal, online calculations; developed by Oak Ridge National Laboratory (ORNL). http://calculations.ewi.org/2006/TTTCCTPlots.HTML [21] H K D Bhadeshia, V. Edmonds. The bainite transformation in a silicon steel. Metallurgical. Volume 10A, July 1979. [22] H K D Bhadeshia, V. Edmonds. Bainite in silicon steels: new composition-property approach, part 1. Metal Science Vol. 17, September 1983. [23] H K D Bhadeshia, V. Edmonds. Bainite in silicon steels: new composition-property approach, part 2. Metal Science Vol. 17, September 1983. [24] E. Navarra, N. Mudzanapabwe, D. Manjonjo. Ausferrite – A structure in high strength steels. Proceedings of the international conference – 9th symposium on metallography. Technical University of Kòsice, Slovakia, 1995. [25] H. Bayati, R. Elliot. Thermal and mechanical stability of austenite in high Mn ADI. 20th ASM Heat treating society conference proceedings, 9-12 October 2000, St Louis, ASM International, 2000. [26] F. Caballero, M Santofimia, C. Capdevilla, C. García-Mateo. Design of Advanced bainitic steels by optimization of TTT diagrams and To curves. ISIJ International, Vol 46, 2006 [27] E. Vuorinen, A. Lindström, P. Rubin, E. Navarra, M. Oden. Materials selection for saw mill dust cutter blades. Luleå University of Technology. [28] L. C. Chang. The rolling sliding wear performance of high silicon carbide-free bainitic steels. Elsevier, Wear 2580, 2005 [29] F.G Caballero, H K D Bhadeshia, K.J Mawella, D.G Jones, P. Brown. Very strong low temperature bainite. Material science and technology, vol. 18, 2002. [30] L. Ping, S. Bahadur, J. D. Verhoeven. Friction and wear behaviour of high silicon bainitic structures in austempered cast iron and steel. Wear of Materials, 9281.930000, 1989. [31] J. Yang, S. Putatunda. Improvement in strength and toughness of austempered ductile cast iron by a novel two-step austempering process. Elsevier. Materials and design 25, 2004. [32] J. Yang, S. Putatunda. Effect of microstructure on abrasion wear behaviour of austempered ductile iron (ADI) processed by anovel two-step austempering process. Elsevier. Materials science and engineering A 406, 2005. [33] L. Xiao, Gear tribology: friction and surface topography. Thesis for the degree of doctor of philosophy. Chalmers University of Technology, Göteborg, 2005. [34] R. Drago, Fundamentals of gear design. Butterworths, Stoneham, 1988.
36

[35] J.R Davis. Carbon and alloy steels. ASM speciality handbook. ASM International, 1996. [36] ASTM Standards and ASM Handbooks. Friction and wear testing, West Conshohocken, 1997. [37] A. Duarte, J. Seabra, H. Santos. ADI Behaviour under twin-disc contact fatigue tests. Key Engineering Materials Vols. 230-232, 2002. [38] B. Bhushan. Principles and applications of tribology. Wiley, New York, 1996. [39] G. Stachowiak, Wear: materials, mechanisms and practice. Wiley, West Sussex, 2005. [40] I.M Hutchings. Tribology: friction and wear of engineering materials. Butterworth Heinemanh, Oxford, 1992. [41] N. Gao, R S Dwyer-Joyce, D G Grieve. Disc machine testing to assess the life of surface-damaged railway track. ProQuest science journals. Proceedings of the institution of mechanical engineers. 2001. [42] A. F. Bower. The influence of crack face friction and trapped fluid on surface initiated rolling contact fatigue cracks. Transactions of the ASME. Vol. 110, October 1988. [43] J. Yang, S. Putatunda. Influence of a novel two-step austempering process on the strain-hardening behaviour of austempered ductile cast iron (ADI). Elsevier. Materials science and engineering A 383, 2004. [44] S.S. Babu. In-situ observations of lattice parameter fluctuations in austenite transformation to bainite. Metallurgical & materials transactions A Vol. 36 A, 2005.
37