![A review: role of interfacial adhesion between carbon ...01-10]-01.pdf · 1 A review: role of interfacial adhesion between carbon blacks and elastomeric materials Min-Joo Kang 1,](https://static.fdocuments.in/doc/165x107/5abdc2687f8b9ab02d8c07a1/a-review-role-of-interfacial-adhesion-between-carbon-01-10-01pdf1-a-review.jpg)
SURFACE AND INTERFACIAL PROPERTIES OF CARBON FIBERS · PDF fileSURFACE AND INTERFACIAL...
75
SURFACE AND INTERFACIAL PROPERTIES OF CARBON FIBERS _,, ,,, NAG 1-1049 FINAL REPORT -) TO NATIONAL AERONAUTICS AND SPACE ADMINISTRATION LANGLEY RESEARCH CENTER HAMPTON, VA 23665 Willard D. Bascom Materials Science and Engineering Department University of Utah, Salt Lake City, UT 84112 W. D. Bascom Principal Investigator (t_AClA-(, .-]_;cfC.]o) ]II_,FAf _ A_'.L., [',Tr_FACI/_,L ....... " .... , , :-, _: i rl, i +_,. ;,o r t. ({JL:;il Oni V. ) 1':; P' '._';CI ¢i? l- i. 4,.+; _ j uric I •_E https://ntrs.nasa.gov/search.jsp?R=19910005116 2018-05-19T10:39:58+00:00Z
Transcript of SURFACE AND INTERFACIAL PROPERTIES OF CARBON FIBERS · PDF fileSURFACE AND INTERFACIAL...
SURFACE AND INTERFACIAL PROPERTIES OF CARBON
FIBERS _,, ,,,
NAG 1-1049
FINAL REPORT
-)
TO
NATIONAL AERONAUTICS AND SPACE ADMINISTRATION
LANGLEY RESEARCH CENTER
HAMPTON, VA 23665
Willard D. Bascom
Materials Science and Engineering DepartmentUniversity of Utah, Salt Lake City, UT 84112
W. D. Bascom
Principal Investigator
(t_AClA-(, .-]_;cfC.]o) ]II_,FAf _ A_'.L., [',Tr_FACI/_,L
......." .... , , :-, _: i rl, i +_,. ;,o r t.({JL:;il Oni V. ) 1':; P' '._';CI
¢i? l- i. 4,.+; _ j
uric I • _E
https://ntrs.nasa.gov/search.jsp?R=19910005116 2018-05-19T10:39:58+00:00Z
TABLE OF CONTENTS
INTRODUCTION .......................................................................................................... 3
OBJECTIVE .................................................................................................................... 5
APPROACH ................................................................................................................... 6
EXPERIMENTAL ......................................................................................................... 11
Specimen Preparation ................................................................................ 11Fiber Surface Modification ....................................................................... 16
Sizings .................................................................................................... 16Surface Treatment ........................................................................... 18
Radio Frequency Plasma ............................................................... 18
Surface Analysis ........................................................................................... 19
Thermal Desorption ..................................................................................... 21
Retention Time Chromatography ........................................................... 21RESULTS and DISCUSSION ..................................................................................... 23
Embedded Single Filament Tests ........................................................... 23
Polymer Blends ............................................................................................. 29Surface Treatment ....................................................................................... 31
Weak Boundary Layer ............................................................................... 31
Scanning Electron Microscopy ................................................................. 34
X-ray Photoelectron Spectroscopy ........................................................ 34
Wettability Measurements ....................................................................... 36
Photo-Acoustic F'I'IR Analysis ................................................................. 38
Thermal Desorption/Mass Spectroscopy ............................................ 38
Retention Time Chromatography ........................................................... 39
Sizings ................................................................................................................ 41
Radio Frequency Plasma Treatment .................................................... 41
CONCLUSIONS ............................................................................................................. 62
APPENDIX Effect of Residual Thermal Compressive Stresses .............. 64
Theory ............................................................................................................... 64
Experimental .................................................................................................. 68
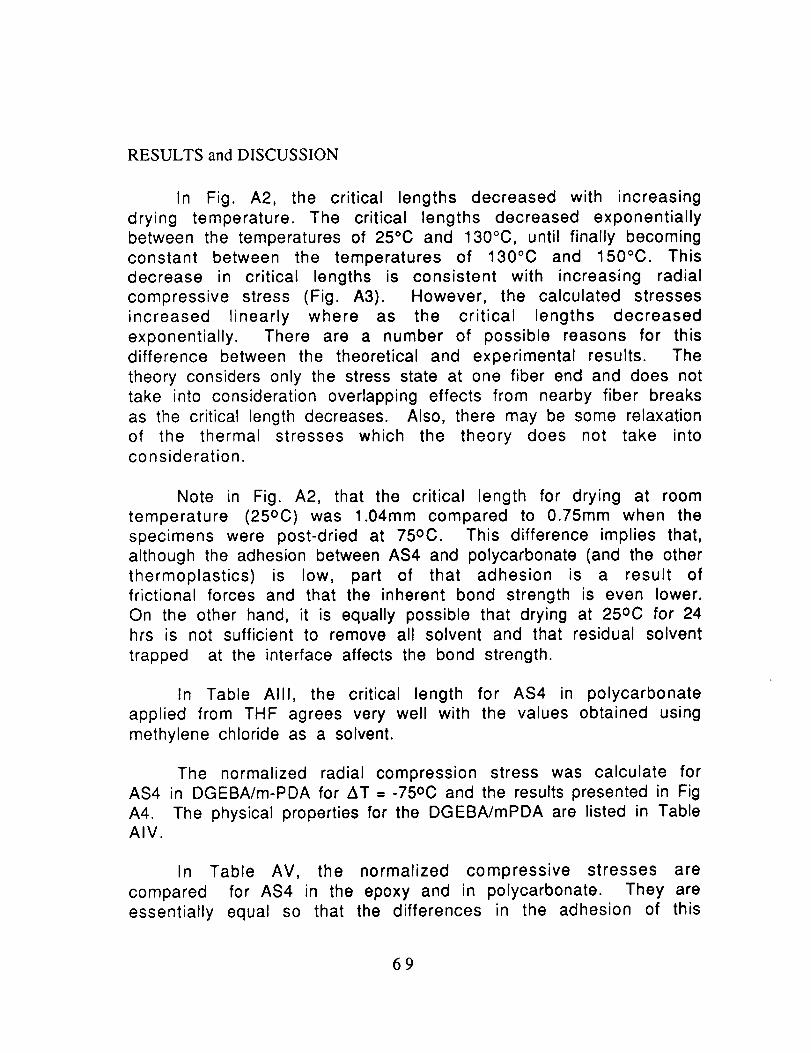
Results ............................................................................................................... 68
Results and Discussion ................................................................................ 70
ACKNOWLEDGMENTS ............................................................................................... 74
_CES ................................................................................................................. 75
2
PRECEDING PAGE BLANK NOT FILMED

INTERFACIAL ADHESION OF CARBON FIBERS
INTRODUCTION
The work reported here was initiated as a result of studies at
NASA Langley (NASA Project Code 505-63-01) that indicated lowadhesion of carbon fibers to thermoplastic matrix polymers. This
problem become apparent in the investigation at the LangleyResearch Center on the effect of matrix deformation on interlaminar
fracture of carbon fiber-polymer matrix composites. Experiments
had been planned to fabricate composites with thermoplastic
polymers having known failure mechanisms, e.g., crazing, shear
banding, etc. The candidate resins included polycarbonate (PC),
polyphenylene oxide (PPO), polystyrene, (PS), polyetherimide (PEI),
and blends of PPO with PS and PC with a polycarbonate-polysiloxane
copolymer.
Scanning electron microscopy (SEM) of delaminated composite
specimens of PC reinforced with carbon fiber (Hercules AS4)
suggested poor bonding between fiber and matrix compared to the
same fiber in an epoxy matrix. SEM evidence for low adhesion to PC
is illustrated in the photomicrographs in Fig. I.
Figure 1 - SEM photomicrographs of polycarbonate/AS4 composite fracturesurfaces. The matrix appears to have been cleanly stripped from the fibersleaving smooth fibers and curls of deformed polymer.
3
OF ;-'©0_ ¢!!_._ ;'T,'
OF F O0_ QUALITY
16.8_
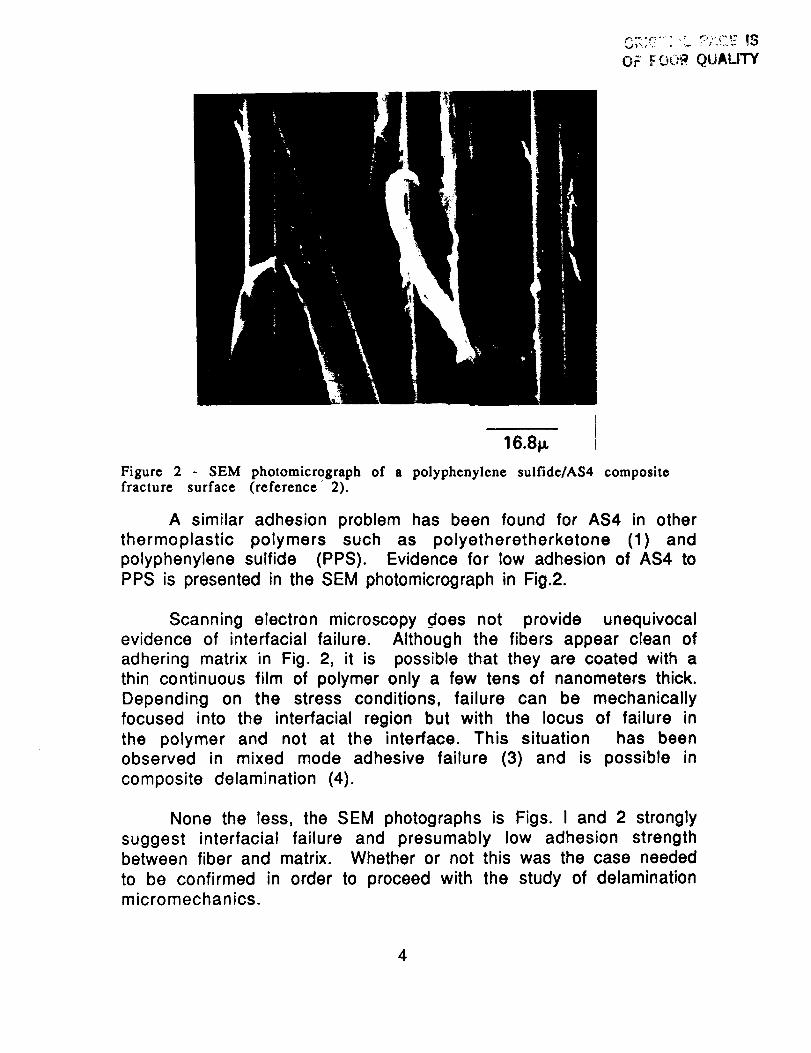
Figure 2 - SEM photomlcrograph of a polypheny]ene sulfide/AS4 compositefracture surface (reference 2).
A similar adhesion problem has been found for AS4 in other
thermoplastic polymers such as polyetheretherketone (1) and
polyphenylene sulfide (PPS). Evidence for low adhesion of AS4 to
PPS is presented in the SEM photomicrograph in Fig.2.
Scanning electron microscopy does not provide unequivocal
evidence of interfacial failure. Although the fibers appear clean of
adhering matrix in Fig. 2, it is possible that they are coated with a
thin continuous film of polymer only a few tens of nanometers thick.
Depending on the stress conditions, failure can be mechanically
focused into the interfacial region but with the locus of failure in
the polymer and not at the interface. This situation has beenobserved in mixed mode adhesive failure (3) and is possible in
composite delamination (4).
None the less, the SEM photographs is Figs. I and 2 strongly
suggest interfacial failure and presumably low adhesion strengthbetween fiber and matrix. Whether or not this was the case needed
to be confirmed in order to proceed with the study of delaminationmicromechanics.
4
The importance of the bond strength between reinforcementand matrix in composite materials goes beyond the specific problem
being addressed in the NASA Langley investigation. Professor M.
Piggott ( University of Toronto) has put it very succinctly, "theinterface is the heart of a composite" (5). The effectiveness of a
reinforcement depends in a very fundamental sense on stresstransfer between fiber and matrix and stress transfer is limited by
the strength of the "interphase" region which includes the interface,the matrix near the interface, and the outer surface layer of thereinforcement. The effect of the interphase strength on
unidirectional tensile strength has been analyzed by Hedgepeth (6,7)
and others (8). It has been long suspected and recently demonstrated
(9) that low bond strength can seriously reduce unidirectional
compression strength. The effect of interphase strength ondelamination is not entirely clear although recent experimentsindicate that weak bonding can significantly reduce unidirectional
interlaminar fracture energy (10).
OBJECTIVE
The purpose of the work reported here was to determine the
adhesion strength of AS4 fibers to thermoplastic polymers;
specifically to polycarbonate, polyphenylene oxide, polyetherimide,
polyphenylene oxide blends with polystyrene, and polycarbonateblends with a polycarbonate-polysiloxane copolymer. Data are also
included for polysulfone. It was recognized at the outset, as
explained in the next section, that an absolute measure of the fibermatrix adhesion would be difficult. However, it is feasible to
determine the fiber bond strengths to the thermoplastics relative
to the bond strengths of the same fibers to epoxy polymers.
It was anticipated, and in fact realized, that the adhesion of
AS4 to the thermoplastic polymers was relatively low. Therefore,
further objectives of the study were to identify means of increasingfiber/matrix adhesion and to try to determine why the adhesion of
AS4 to thermoplastics is significantly less than to epoxy polymers.
5
APPROACH
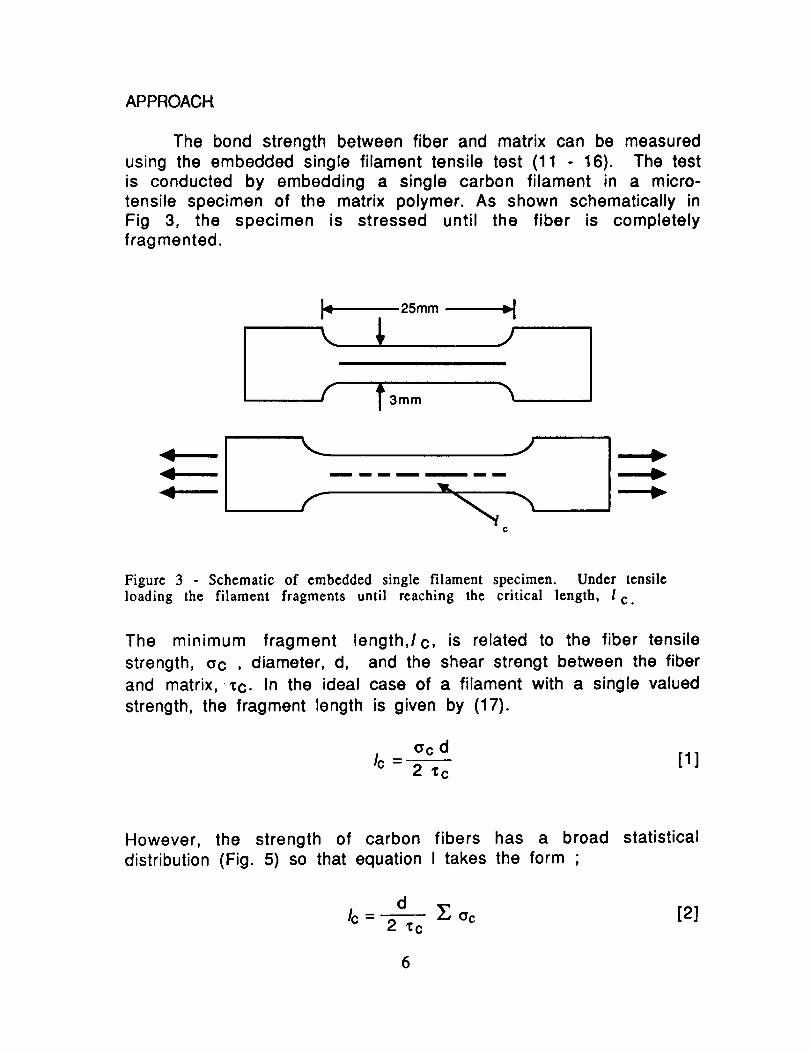
The bond strength between fiber and matrix can be measuredusing the embedded single filament tensile test (11 - 16). The testis conducted by embedding a single carbon filament in a micro-tensile specimen of the matrix polymer. As shown schematically inFig 3, the specimen is stressed until the fiber is completelyfragmented.
I,i 25mm .._1v I
( 1'
J
Figure 3 Schematic of embedded single filament specimen. Under tensile
loading the filament fragments until reaching the critical length, l c.
The minimum fragment length,lc, is related to the fiber tensile
strength, ac , diameter, d, and the shear strengt between the fiber
and matrix, _c. In the ideal case of a filament with a single valued
strength, the fragment length is given by (17).
_cd [1]Ic-2,¢c
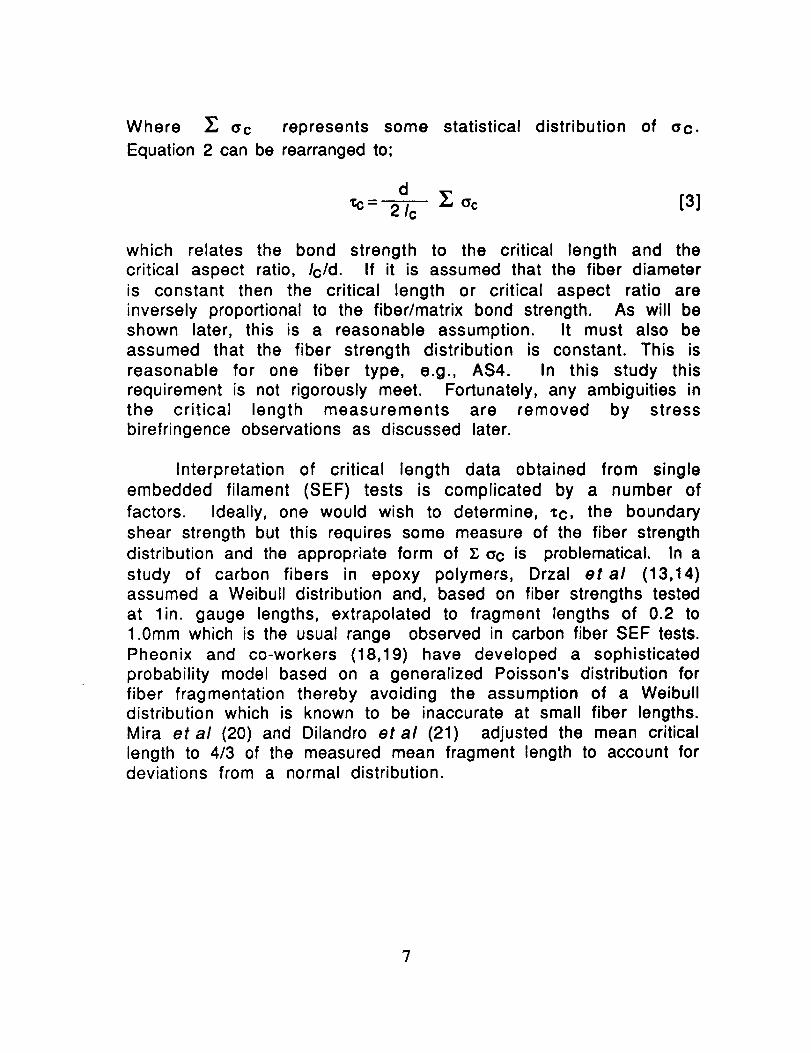
However, the strength of carbon fibers has a broad statistical
distribution (Fig. 5) so that equation I takes the form ,
d Z Oc [2]Ic = -2 _:c
6
Where _, ac represents some statistical distribution of ac.
Equation 2 can be rearranged to;
d _ ac [3]_- 21c
which relates the bond strength to the critical length and thecritical aspect ratio, Ic/d. If it is assumed that the fiber diameter
is constant then the critical length or critical aspect ratio are
inversely proportional to the fiber/matrix bond strength. As will be
shown later, this is a reasonable assumption. It must also be
assumed that the fiber strength distribution is constant. This is
reasonable for one fiber type, e.g., AS4. In this study this
requirement is not rigorously meet. Fortunately, any ambiguities in
the critical length measurements are removed by stressbirefringence observations as discussed later.
Interpretation of critical length data obtained from single
embedded filament (SEF) tests is complicated by a number of
factors. Ideally, one would wish to determine, _c, the boundary
shear strength but this requires some measure of the fiber strength
distribution and the appropriate form of _; cc is problematical. In a
study of carbon fibers in epoxy polymers, Drzal etal (13,14)
assumed a Weibull distribution and, based on fiber strengths tested
at l in. gauge lengths, extrapolated to fragment lengths of 0.2 to
1.0mm which is the usual range observed in carbon fiber SEF tests.
Pheonix and co-workers (18,19) have developed a sophisticatedprobability model based on a generalized Poisson's distribution for
fiber fragmentation thereby avoiding the assumption of a Weibulldistribution which is known to be inaccurate at small fiber lengths.
Mira et al (20) and Dilandro etal (21) adjusted the mean critical
length to 4/3 of the measured mean fragment length to account fordeviations from a normal distribution.
?
Ld
W0.
99.9
99
95SO8(];'0605840
3(]
2(]
10
5
!
.5
.2
.!
4"
4-
4-+
+
+
4.
t
! I ! ; ; - I ! ; ;
,=-,,
TENSILE STRENGTH (kSl)
Figure 4 Weibull probability plot of AS4 single filament tensile strength data.Note that data points tend to cluster into groups which suggests discrete flawstrengths.
The embedded single filament test yields further information
about fiber/matrix adhesion if the matrix polymer is transparent
and stress birefringent.
8

C,:' i-'._::;R QtiAL:Ty
i
A 5op
B50p
Figure 5 - Stress birefringence patterns at fiber breaks characteristic of strongadhesion (AS4 in epoxy). Note the development of a sheath in the birefringence patternon both sides of the break when the stress on the specimen is increased (photo B).
Viewing the specimen between crossed polarizing filters, thehigh shear stress at fiber breaks produces a bright birefringence
pattern (Fig. 5). The photographs in Fig. 5 show the development of a
sheath in the birefringence pattern with increasing tensile stress
that corresponds to shear yielding of the matrix near the fiber-
matrix boundary. The development of this bright sheath is observedwhen there is strong bonding between fiber and matrix (13,15).
A different sequence of patterns occur when the bond betweenfiber and matrix is weak. As shown in Fig. 6A, symmetrical
birefringence nodes develop at the initial fiber breaks as in the case
of strong bonding. However, with increasing tension, these nodesrecede from the fiber ends leaving a relatively indistinct sheath of
birefringence as shown in Fig 6B and 6C. The intensity of thissheath seems to be proportional to the bond strength and when the
bond strength is low the movement of the nodes is very rapid and
suggests an "unzipping" of the matrix from the fiber. Theseobservations are further illustrated and discussed in the RESULTS
section.
9
&
¢
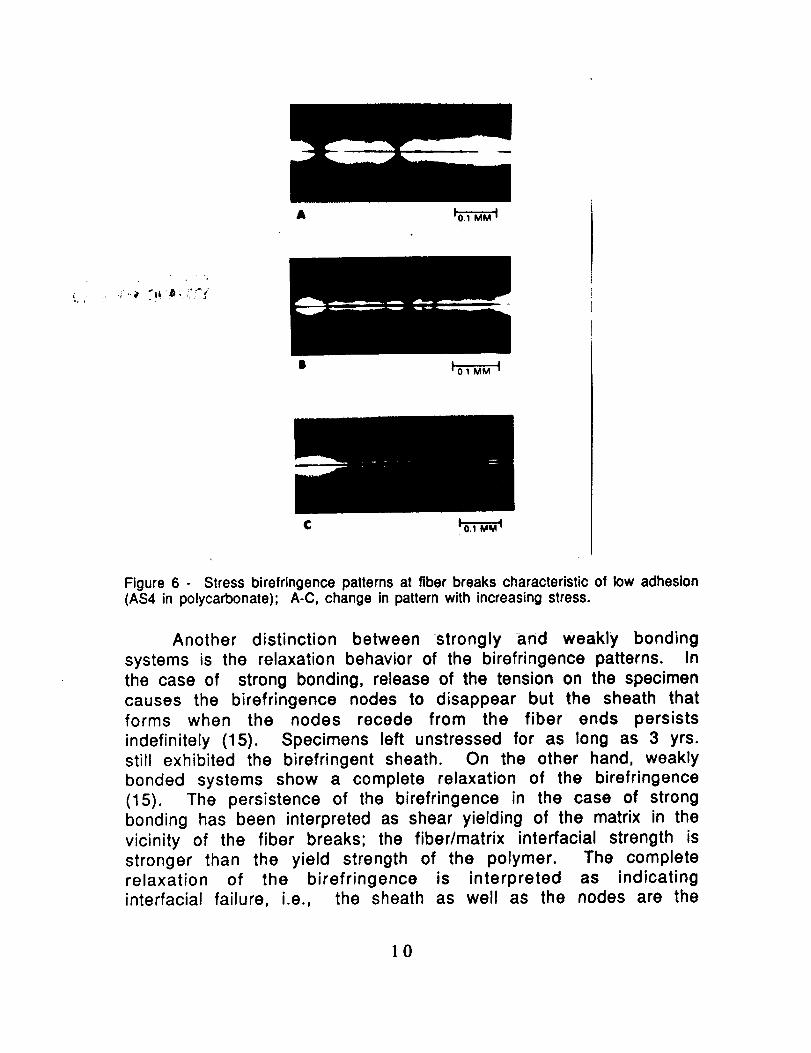
Figure 6 - Stress birefringence patterns at fiber breaks characteristic of low adhesion(AS4 in polycarbonate); A-C, change in pattern with increasing stress.
Another distinction between strongly and weakly bondingsystems is the relaxation behavior of the birefringence patterns. Inthe case of strong bonding, release of the tension on the specimencauses the birefringence nodes to disappear but the sheath thatforms when the nodes recede from the fiber ends persists
indefinitely (15). Specimens left unstressed for as long as 3 yrs.still exhibited the birefringent sheath. On the other hand, weakly
bonded systems show a complete relaxation of the birefringence(15). The persistence of the birefringence in the case of strongbonding has been interpreted as shear yielding of the matrix in thevicinity of the fiber breaks; the fiber/matrix interfacial strength isstronger than the yield strength of the polymer. The completerelaxation of the birefringence is interpreted as indicatinginterfacial failure, i.e., the sheath as well as the nodes are the
10
result of elastic shear stresses that relax when the tension on the
specimen is removed.
It should be noted that in these single fiber tests, a
significant thermally induced compressive strength normal to theinterface can develop which measurably increases the bond strength
above the inherent adhesion strength between fiber and matrix (16).This effect is discussed in the APPENDIX. Comparable compressive
stresses do not develop in a composite with a realistic fiber volumeof 60-65%.
EXPERIMENTAL
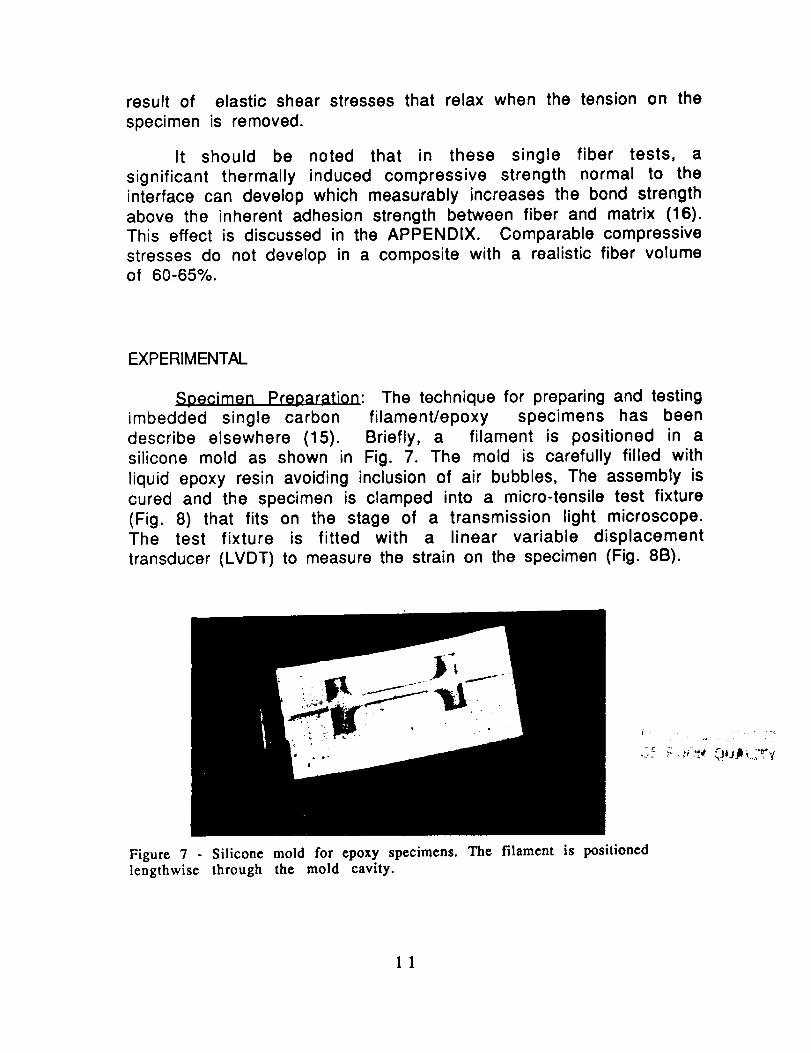
S oecimen Preoaration: The technique for preparing and testingimbedded single carbon filament/epoxy specimens has been
describe elsewhere (15). Briefly, a filament is positioned in a
silicone mold as shown in Fig. 7. The mold is carefully filled with
liquid epoxy resin avoiding inclusion of air bubbles, The assembly is
cured and the specimen is clamped into a micro-tensile test fixture
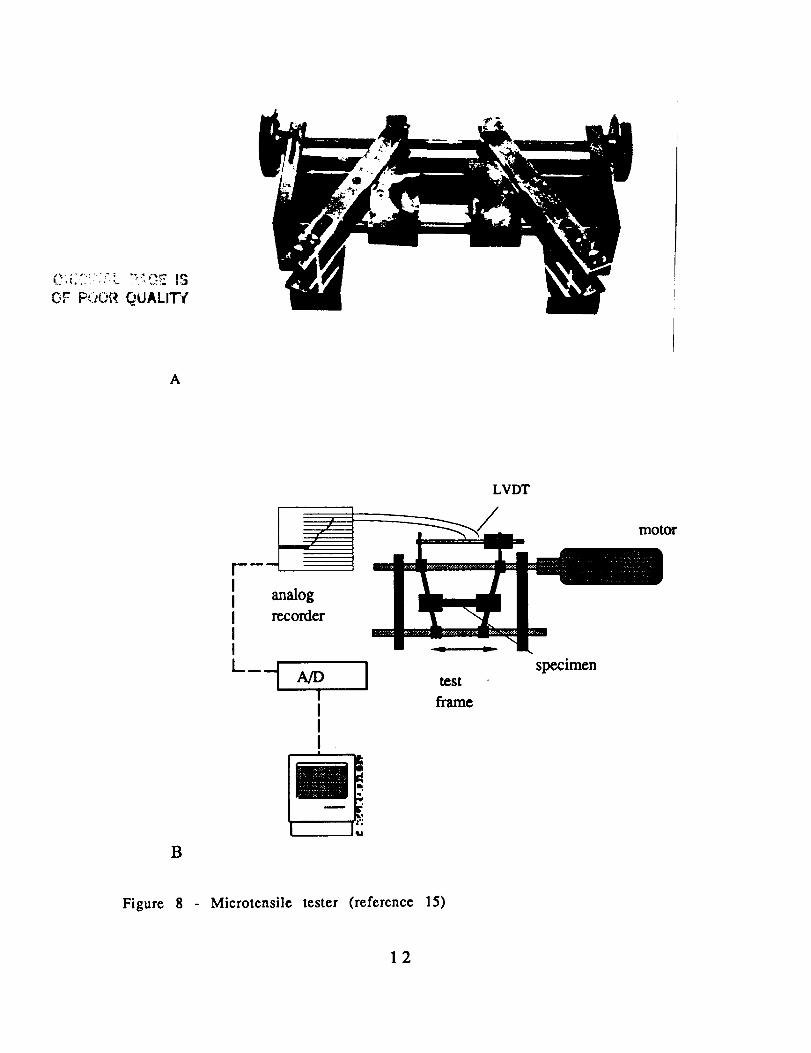
(Fig. 8) that fits on the stage of a transmission light microscope.The test fixture is fitted with a linear variable displacement
transducer (LVDT) to measure the strain on the specimen (Fig. 8B).
,o .
Figure 7 - Silicone mold for epoxy specimens. The filament is positionedlengthwise through the mold cavity.
11
OF PO0{_ QUALIT{
A
LVDT
/motor
B
analog
recorder
---1 _ Ii
test
frame
specimen
Figure 8 Microtensile tester (reference 15)
12

A different technique was used to prepare specimens of carbon
filaments in the thermoplastic polymers since it would involve
injection molding in order make specimens similar to the epoxy
specimens. Instead, a single filament was placed lengthwise on athin plate of the polymer, Fig 9. The filament was then coated witha film of the same polymer dissolved in a volatile solvent.
fiber
support
polymerfilm
Figure 9 - Schematic of specimen used to test single carbon filaments in
thermoplastic polymers. The support plate is 12.5mm wide, 37.5 mm long and6.25 mm thick.
A series of experiments were conducted to determine the
drying conditions for complete removal of the solvent from the
coating. The coatings are thin, (25 _m) and the solvents, methylene
chloride (MeCI) and dichloroethane (DCE), are highly volatile so that
evaporation was essentially complete within 24hrs. at 25oc. To
insure complete removal of the solvent, the films applied from MeCI
were dried at 75oc for 8hrs. and films applied from MeCI/DCE
mixtures were dried at 81oc for 16hrs. The criterion used for
complete removal of the solvent was that the fragment length, I c,
was not reduced by further drying at these conditions. Drying athigher temperatures caused the development of residual
compressive stresses as discussed later. Drying at 75oc and 81oc
were compromise conditions to insure complete solvent removalwithout the development of large compressive stresses. As shown
in the APPENDIX, the compressive stress developed around the
carbon fibers in the thermoplastics dried at 75oc and 81oc was
about the same as the stress on the carbon fiber in the epoxypolymers.
13

The test procedure was modified for the PPO-PS and the
PC/PC-polysiloxane copolymer experiments since these materials
could not be readily obtained in the form of 6mm sheets from which
to cut the support plate (Fig. 9). Instead, a PC support plate was
used which was first coated with a film of the test polymer. Thefiber was then positioned on the dried film and coated. Critical
length measurements were made for AS4 fiber embedded in PPO onboth PPO support plates and PC plates prefilmed with PPO. There
were no significant differences in the critical length.
It was found that the procedure used to clean the support
plate had a significant effect on the critical length. At first the
plates were simply washed in an aqueous detergent solution. Lateris was found that the critical length was reduced by following the
detergent wash with a light polishing on a metallographic wheel in a
dilute slurry of alumina powder. The alumina powder is a powerful
adsorbing agent so it is assumed (although not proven) that it
adsorbed detergent or other surface active materials on the support
plate that otherwise migrated to the fiber/ polymer interface.
The effect of the film coating thickness on the critical length
was also investigated because of possible effects of the upper
surface of the film on filament fragmentation. It was found that a
film coating of two fiber diameters, 71_m, was sufficient. However,
in practice the fiber was always embedded at least four fiber
diameters below the surface of the coating film.
The critical length was determined by tensile stressing a
specimen until the filament was completely fragmented. The stress
interval over which fiber breakage was complete was usually narrow
so that there was little difficulty in determining when
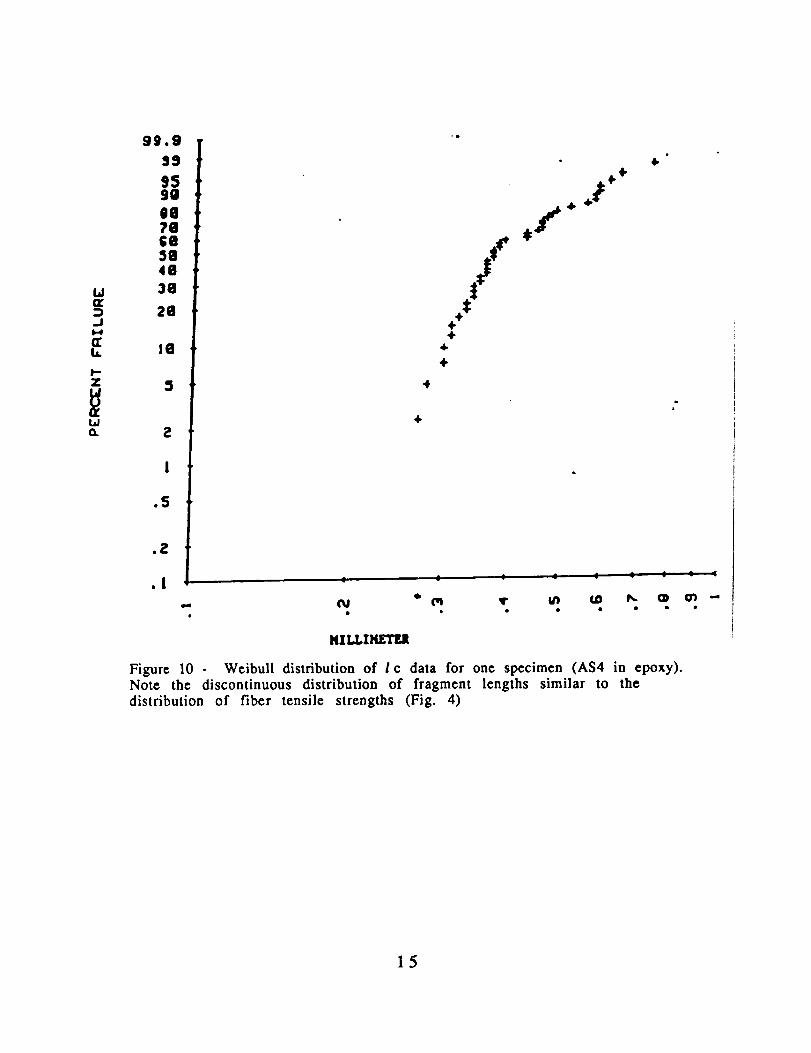
fragmentation was complete. The critical lengths exhibited a broadstatistical distribution as shown in Fig. 10 for a single specimen.
This wide distribution in Ic reflects the statistical distribution in
the fiber strength (Eq. 2 and Fig. 4). In order to obtain a
statistically significant measure of the critical length, 10-12
specimens were tested for each test condition and the data
combined as shown in Fig 11. The data were analyzed using normal,
log-normal and Weibull statistics. All of these distributions gaveessentially the same mean values and variances. The data reported
here were obtained using the normal distribution function.
14
9599
087OGO
4g
2e
i. J@
i 'W
.5
4
4-
4.4"6
| 4 e o 0 41 | : "-
,b OI T It) (D I_ O O1 -.... OJ
HILLIH[TYJ
Figure 10 - Weibull distribution of I c data for one specimen (AS4 in epoxy).Note the discontinuous distribution of fragment lengths similar to thedistribution of fiber tensile strengths (Fig. 4)
15
td
.J
(Ze.
I'-"zL,JU
Ld0,.
+
(_ 0'1 ,,-,,
MILLIMETER
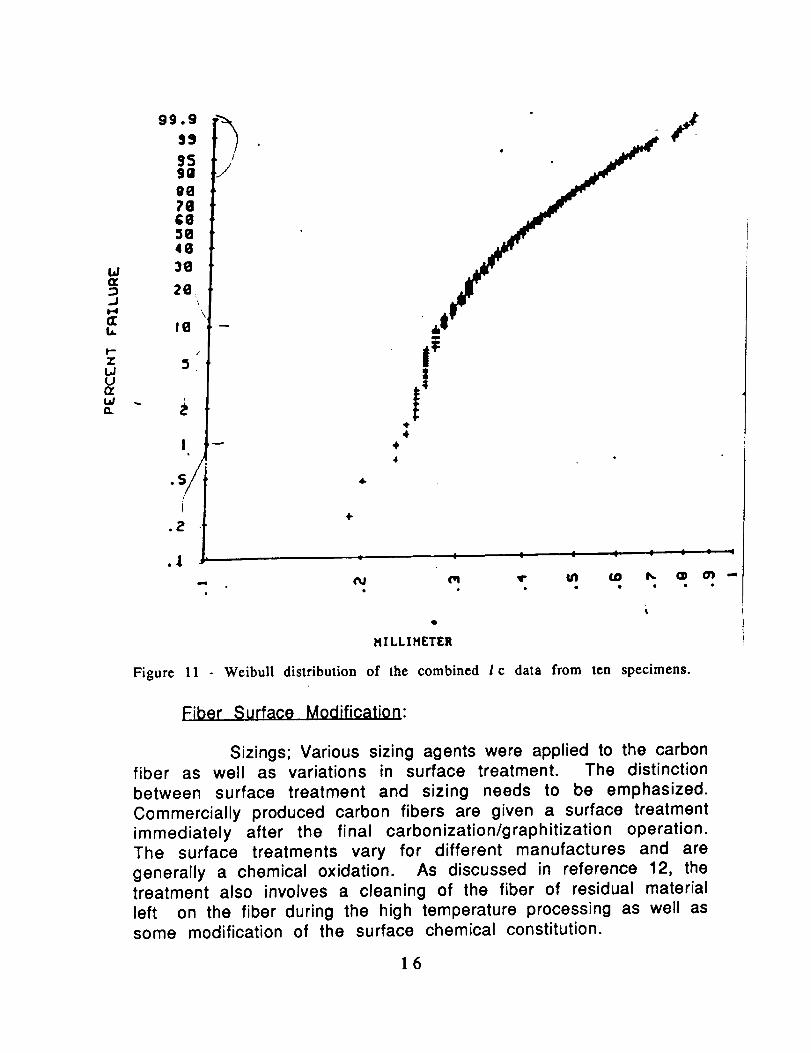
Figure 11 - Weibull distribution of the combined I c data from ten specimens.
Fiber Surface Modification:
Sizings; Various sizing agents were applied to the carbonfiber as well as variations in surface treatment. The distinction
between surface treatment and sizing needs to be emphasized.Commercially produced carbon fibers are given a surface treatment
immediately after the final carbonization/graphitization operation.The surface treatments vary for different manufactures and are
generally a chemical oxidation. As discussed in reference 12, the
treatment also involves a cleaning of the fiber of residual material
left on the fiber during the high temperature processing as well assome modification of the surface chemical constitution.
16

Sizing, on the other hand, is a deliberate coating of the fiber,
usually with a film forming polymer composition, to aid processingand sometimes to enhance mechanical properties. Commercial
coatings are usually applied in an attempt to reduce fiber damage
during prepreging and filament winding. In this study sizings were
applied in an attempt to improve adhesion. The apparatus used is
shown schematically in Fig 12.
Figure 12 - Apparatus used to size carbon fiber tows. A, fiber spool;bath; C, drying tower; D, take-up drive
B,sizing
The amount of sizing applied to the fiber was controlled by the bath
concentration, the speed of the fiber tow, and the temperature in the
drying tower. The percent weight of sizing on the fiber was
measured by solvent extraction of a known weight of tow with
methylene chloride, evaporation of the solvent and weighing theresidue•
17
Surface Treatment; The effect of varying the intensityof the fiber surface treatment on adhesion was studied. The
treatment level was set above and below the level used by Hercules
for commercial carbon fiber products; nominally 100%. Levels of
0% (unsurface treated fiber designate as AU4), 50%, 100% (normal
condition), and 400% were tested. The actual treatment conditions
are Hercules proprietary information. The fiber was treated in a
pilot plant facility using AU4 from production
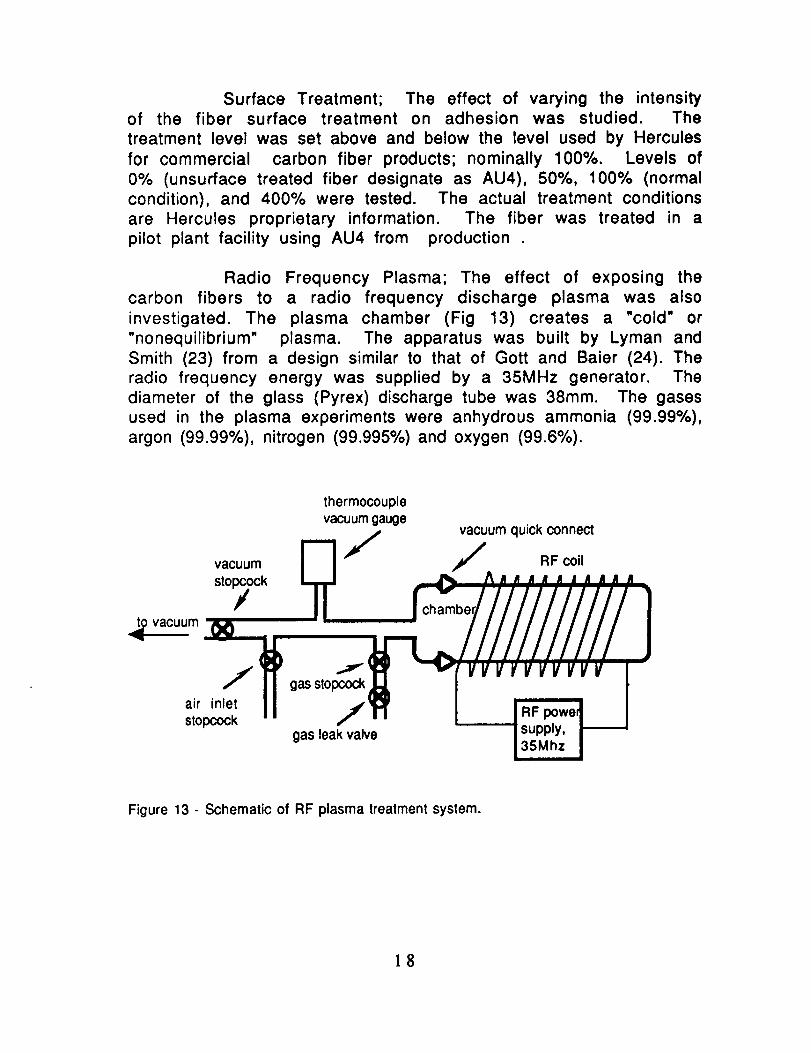
Radio Frequency Plasma; The effect of exposing the
carbon fibers to a radio frequency discharge plasma was also
investigated. The plasma chamber (Fig 13) creates a "cold" or
"nonequilibrium" plasma. The apparatus was built by Lyman and
Smith (23) from a design similar to that of Gott and Baier (24). Theradio frequency energy was supplied by a 35MHz generator. The
diameter of the glass (Pyrex) discharge tube was 38mm. The gases
used in the plasma experiments were anhydrous ammonia (99.99%),
argon (99.99%), nitrogen (99.995%) and oxygen (99.6%).
thermocouplevacuumgauge
vacuum quick connect
_ vacuum _ j
air inlet I I ti:=1' I Istopcock "" /' " [ I _.::._;,:'-!1
gas leak valve
Figure 13 - Schematic of RF plasma Ireatment system.
18
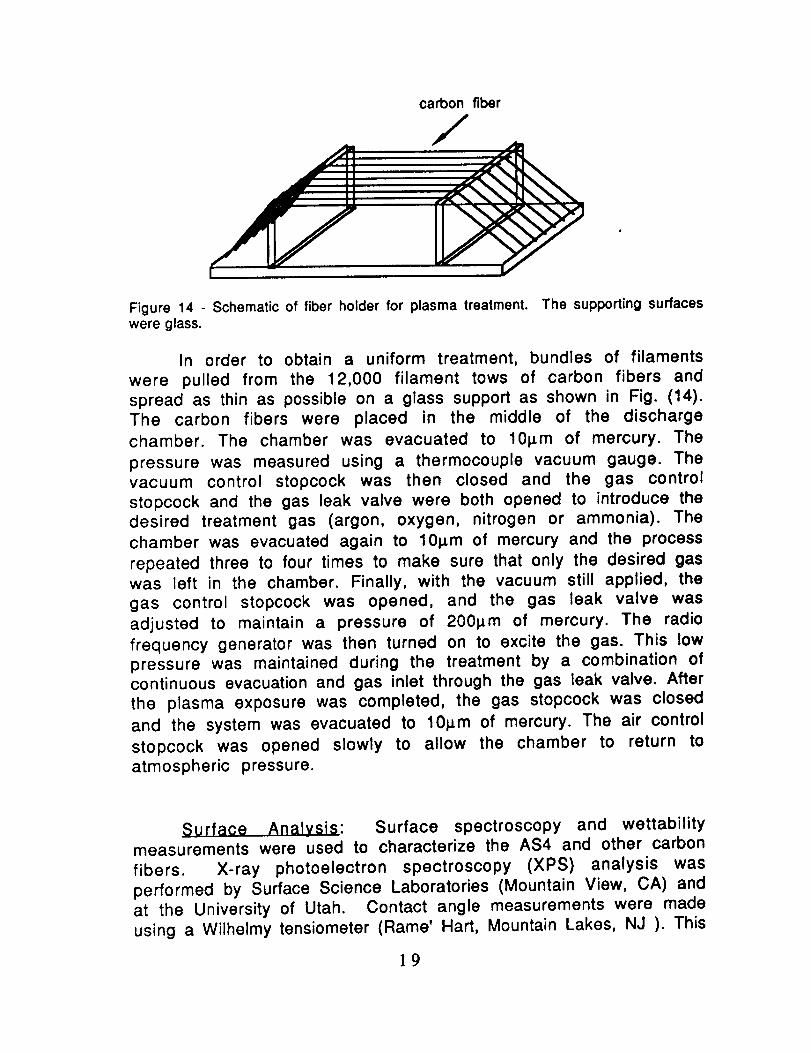
carbon fiber
Figure 14 - Schematic of fiber holder for plasma treatment. The supporting surfaceswere glass.
In order to obtain a uniform treatment, bundles of filaments
were pulled from the 12,000 filament tows of carbon fibers and
spread as thin as possible on a glass support as shown in Fig. (14).The carbon fibers were placed in the middle of the discharge
chamber. The chamber was evacuated to 101_m of mercury. The
pressure was measured using a thermocouple vacuum gauge. Thevacuum control stopcock was then closed and the gas control
stopcock and the gas leak valve were both opened to introduce thedesired treatment gas (argon, oxygen, nitrogen or ammonia). The
chamber was evacuated again to 10_m of mercury and the process
repeated three to four times to make sure that only the desired gaswas left in the chamber. Finally, with the vacuum still applied, the
gas control stopcock was opened, and the gas leak valve was
adjusted to maintain a pressure of 2001_m of mercury. The radio
frequency generator was then turned on to excite the gas. This low
pressure was maintained during the treatment by a combination ofcontinuous evacuation and gas inlet through the gas leak valve. After
the plasma exposure was completed, the gas stopcock was closed
and the system was evacuated to 101_m of mercury. The air control
stopcock was opened slowly to allow the chamber to return to
atmospheric pressure.
Surface Analysis: Surface spectroscopy and wettability
measurements were used to characterize the AS4 and other carbon
fibers. X-ray photoelectron spectroscopy (XPS) analysis was
performed by Surface Science Laboratories (Mountain View, CA) andat the University of Utah. Contact angle measurements were made
using a Wilhelmy tensiometer (Rame' Hart, Mountain Lakes, NJ ). This
19
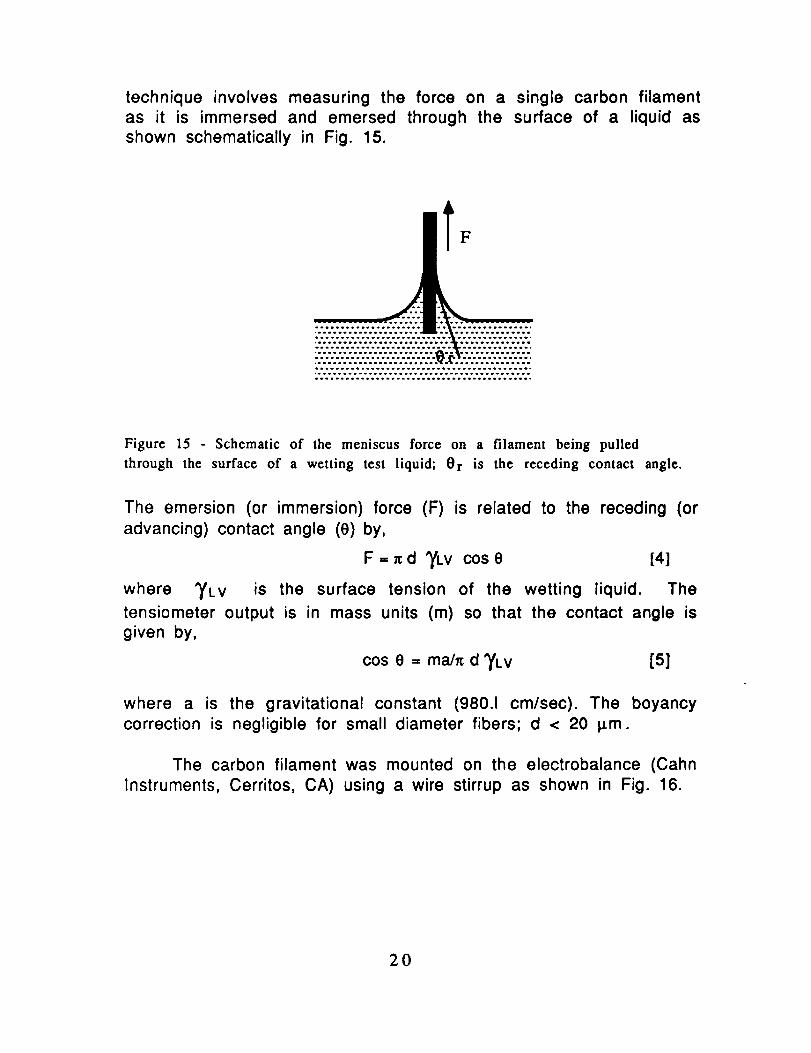
technique involves measuring the force on a single carbon filament
as it is immersed and emersed through the surface of a liquid as
shown schematically in Fig. 15.
IF
Figure 15 - Schematic of the meniscus force on a filament being pulled
through the surface of a wetting test liquid; Or is the receding contact angle.
The emersion (or immersion) force (F) is related to the receding (or
advancing) contact angle (e) by,
F = _ d 'yLV COS 0 [4]
where "_LV is the surface tension of the wetting liquid. The
tensiometer output is in mass units (m) so that the contact angle is
given by,
cos e = ma/= d _LV [5]
where a is the gravitational constant (980.1 cm/sec). The boyancy
correction is negligible for small diameter fibers; d < 20 l_m.
The carbon filament was mounted on the electrobalance (Cahn
Instruments, Cerritos, CA) using a wire stirrup as shown in Fig. 16.
2O

carbon
fiber
Figure 16 - Single filament mounted on a wire stirrup
It was found that some adhesive tapes are sufficiently hygroscopic
that when the specimen and holder were held just above the water
surface there was a measurable increase in weight. Through trial
and error, a tape was found that did not absorb any detectableamount of water over the duration of the test which in some
instances was as long as ten minutes.
The specimen weight was electronically counter balanced so
that the measured weight was due only to the immersion or
emersion forces which could be measured to 0.5 _tg
Thermal Desor.otion: The gaseous products that evolve fromheated carbon fiber samples were analyzed using mass spectroscopy
(MS). The heating rate was 25oC/min up to 310oc followed by a hold
at 310oc for 5 min. The total organic materials evolved over theheating range was recorded along with the output at mass 44 (CO2),
mass 57 (straight chain hydrocarbon) and mass 149 (carbonyl
fragments).
Tows of carbon fiber were heat treated to remove thermally
desorbable specie by passing the tows through a tube furnace at
750oc. The furnace was flushed with nitrogen gas and the residencetime was 90sec.
Retention Time Chromatogra0hy: A study was made of the
retention time of polycarbonate on the three fiber types using
liquid-solid chromatography (LSC). A schematic of the
chromatograph is shown in Fig. 17. Filament tows of AS4 and XAS
21
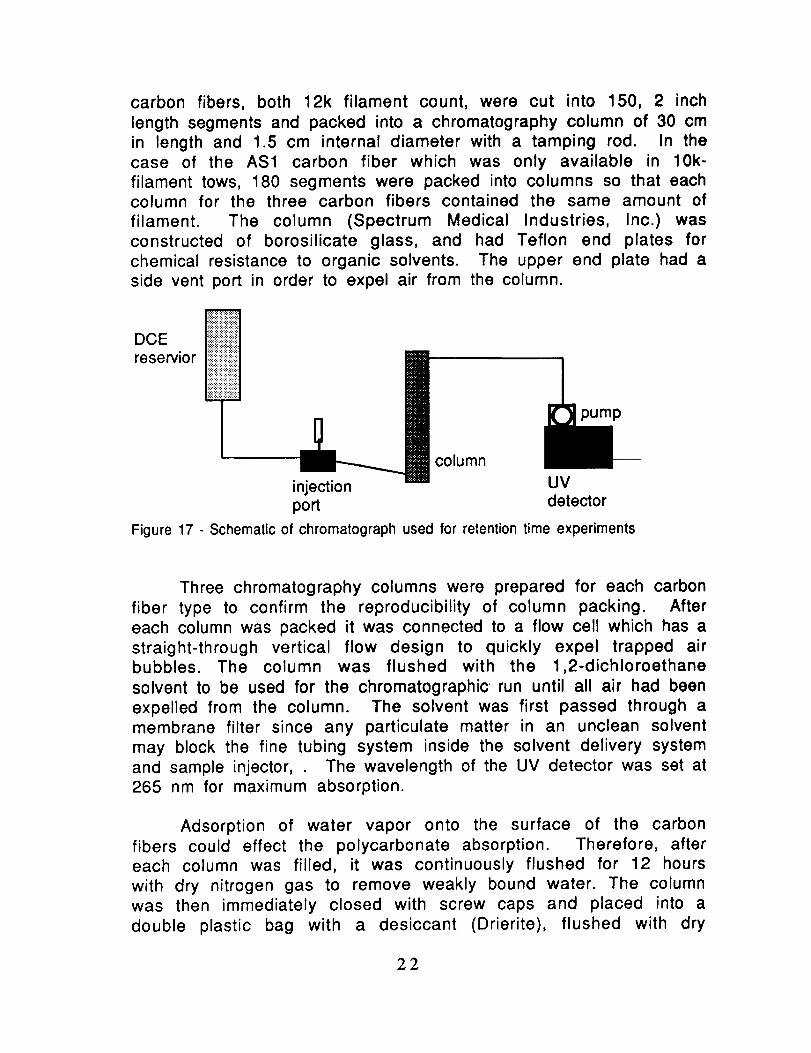
carbon fibers, both 12k filament count, were cut into 150, 2 inchlength segments and packed into a chromatography column of 30 cmin length and 1.5 cm internal diameter with a tamping rod. In thecase of the AS1 carbon fiber which was only available in 10k-filament tows, 180 segments were packed into columns so that eachcolumn for the three carbon fibers contained the same amount offilament. The column (Spectrum Medical Industries, Inc.)wasconstructed of borosilicate glass, and had Teflon end plates forchemical resistance to organic solvents. The upper end plate had aside vent port in order to expel air from the column.
DCEreservior
column
pump
UVdetector
injectionport
Figure17 - Schematicof chromatographused forretentiontimeexperiments
Three chromatography columns were prepared for each carbon
fiber type to confirm the reproducibility of column packing. After
each column was packed it was connected to a flow cell which has a
straight-through vertical flow design to quickly expel trapped airbubbles. The column was flushed with the 1,2-dichloroethane
solvent to be used for the chromatographic run until all air had been
expelled from the column. The solvent was first passed through a
membrane filter since any particulate matter in an unclean solvent
may block the fine tubing system inside the solvent delivery system
and sample injector, The wavelength of the UV detector was set at265 nm for maximum absorption.
Adsorption of water vapor onto the surface of the carbon
fibers could effect the polycarbonate absorption. Therefore, aftereach column was filled, it was continuously flushed for 12 hours
with dry nitrogen gas to remove weakly bound water. The column
was then immediately closed with screw caps and placed into a
double plastic bag with a desiccant (Drierite), flushed with dry
22
nitrogen gas and sealed until the column was connected to the HPLCsystem.
With the solvent flowing at a constant rate of 2 ml/min, 0.2
ml of a 1 mg/ml polycarbonate solution was injected using a sample
injector that enables one to load and inject samples without
interruption of the solvent flow. When an injection is made, a chart
recorder automatically marks the injection point on the
chromatogram. The retention time was taken at the maximum pointof the peak in the UV absorption curve. For each fiber type, five to
nine injections were made for each of the three columns which gave15 to 27 data points.
The chromatographic system used for the retention time
measurements was comprised of a model U6K sample injector
(Waters Associates), model 590 solvent delivery system (Waters
Associates) and a V4 variable wavelength detector (Isco, Inc.) withflow cell.
RESULTS and DISCUSSION
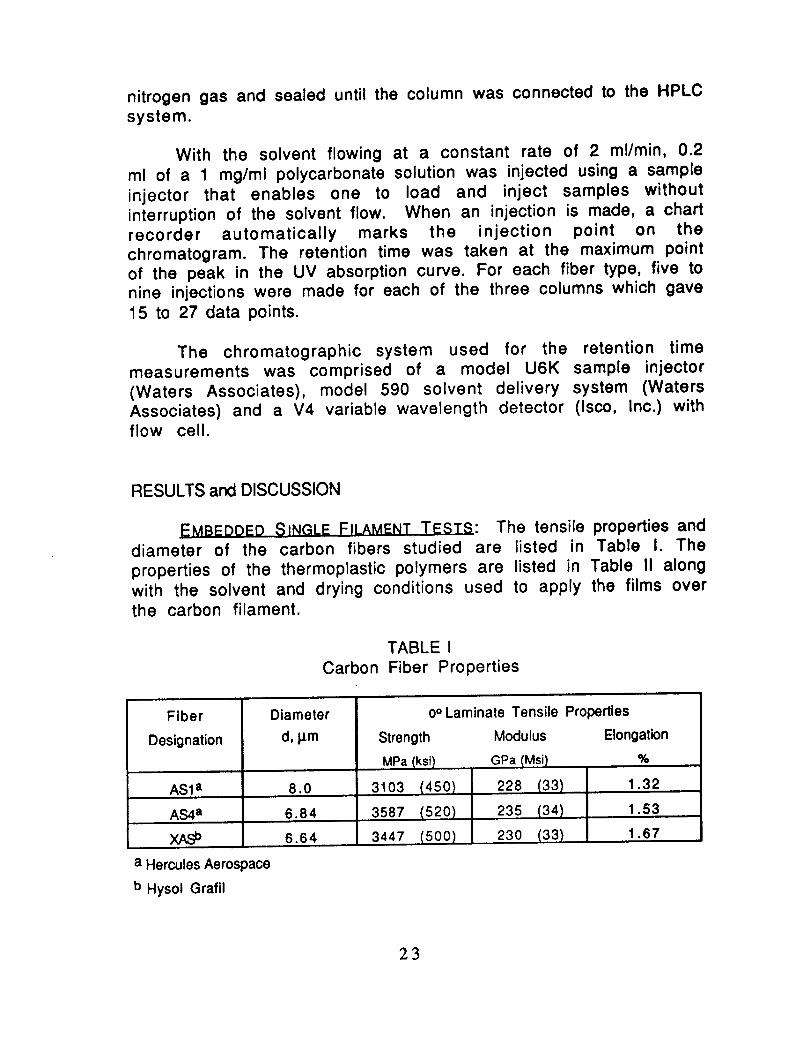
EMBEDDED _;INGLE,FILAMENT TESTS: The tensile properties anddiameter of the carbon fibers studied are listed in Table I. The
properties of the thermoplastic polymers are listed in Table II along
with the solvent and drying conditions used to apply the films overthe carbon filament.
TABLE I
Carbon Fiber Properties
Fiber
Designation
Diameter
d, _m
AS1 a 8.0
AS4 a 6.84
XASb 6.64
a Hercules Aerospace
b Hysol Grafil
0o Laminate Tensile Properties
Strength
MPa (ksi)
3103 (450)
3587 (520)
3447 (500)
Modulus
GPa (Msi)
228 (33)
235 (34)
230 (33)
Elongation
%
1.32
1.53
1.67
23
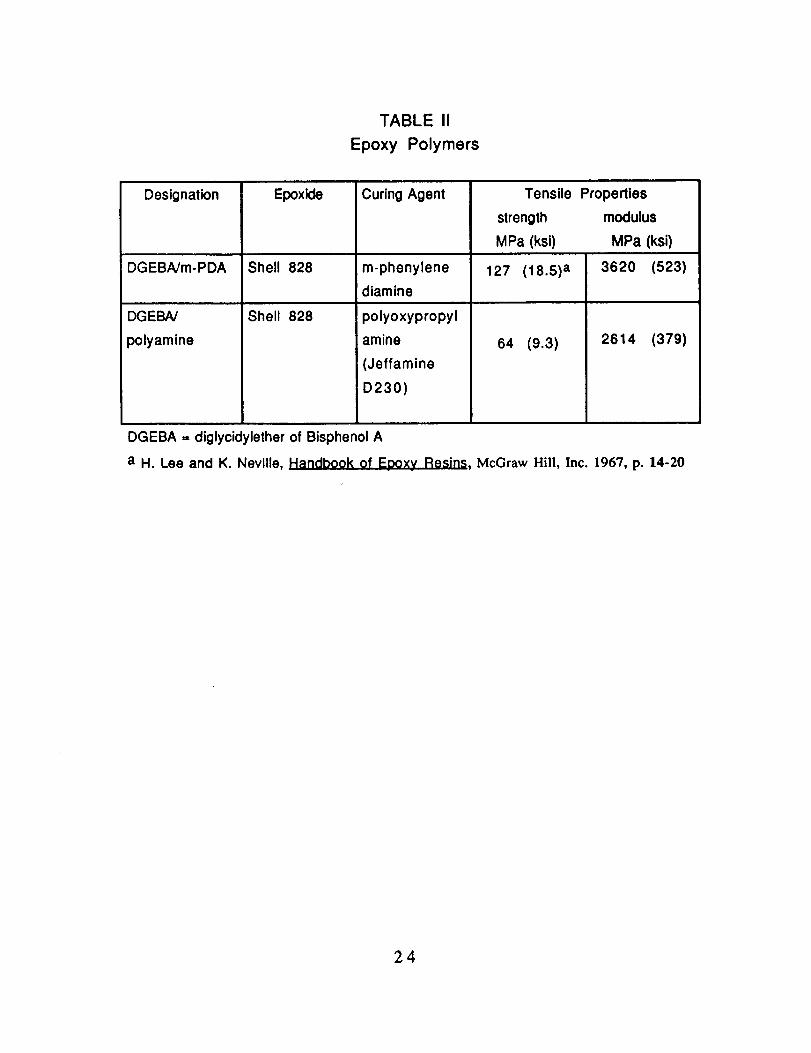
TABLE II
Epoxy Polymers
Designation
DGEBNm-PDA
DGEBA/
polyamine
Epoxide
Shell 828
Curing Agent
m-phenylene
diamine
127 (18.5) a
Tensile Properties
strength modulus
MPa (ksi) MPa (ksi)
3620 (523)
Shell 828
64 (9.3) 2614 (379)
polyoxypropyl
amine
(Jeffamine
D230)
DGEBA = diglycidylether of Bisphenol A
a H. Lee and K. Neville, Handbook of Epoxy Resins, McGraw Hill, Inc. 1967, p. 14-20
24
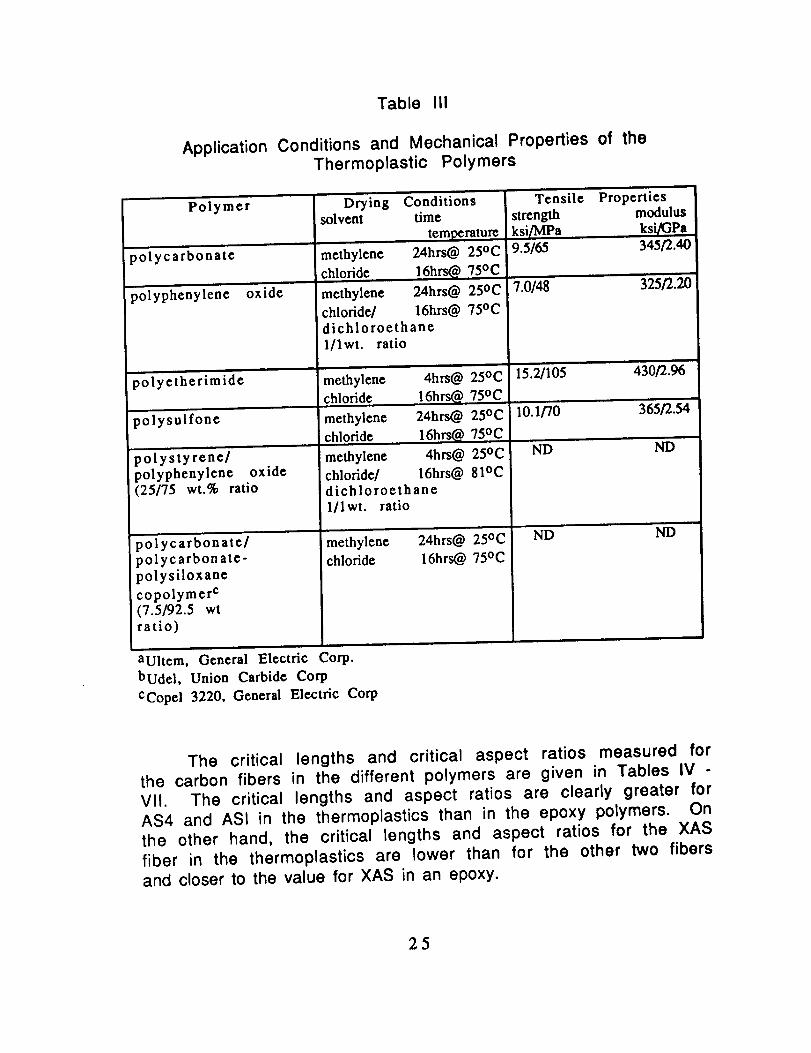
Table III
Application Conditions and Mechanical Properties of theThermoplastic Polymers
Polymer
polycarbonat¢
polyphenylene oxide
Drying Conditionssolvent time
temperature
methylene 24hrs@ 25°C
chloride . 1.6hrs@ 75°C
methylene 24hrs@ 250C
chloride/ 16hrs@ 75°C
Tensile Propertiesstrength modulus
ksi/MPa ksi/GPa9.5/65 345/2.40
7.0/as 325/2.2o
polyetherimide
polysuifone
polystyrene/polyphenylene oxide(25/75 wt.% ratio
polycarbonate/polycarbonate-polysiloxane
copolymer c(7.5/92.5 wtratio)
L
aUltem, General Electric Corp.
dichloroethane1/1 wt. ratio
methylenechloride
methylenechloride
methylene
chloride/
4hrs@ 25oc
16h.rs@ 75oc
24hrs@ 25oc
16hrs@ 75oc
4hrs@ 250C
16hrs@ 81ocdichloroethanel/lwt, ratio
methylene 24hrs@ 25°C
chloride 16hrs@ 75oc
bUdel, Union Carbide Corp
CCopel 3220, General Electric Corp
15.2/105 430/2.96
10.1/70 365/2.54
ND ND
ND ND
The critical lengths and critical aspect ratios measured forthe carbon fibers in the different polymers are given in Tables IV -
VII. The critical lengths and aspect ratios are clearly greater for
AS4 and ASI in the thermoplastics than in the epoxy polymers. Onthe other hand, the critical lengths and aspect ratios for the XAS
fiber in the thermoplastics are lower than for the other two fibersand closer to the value for XAS in an epoxy.
25
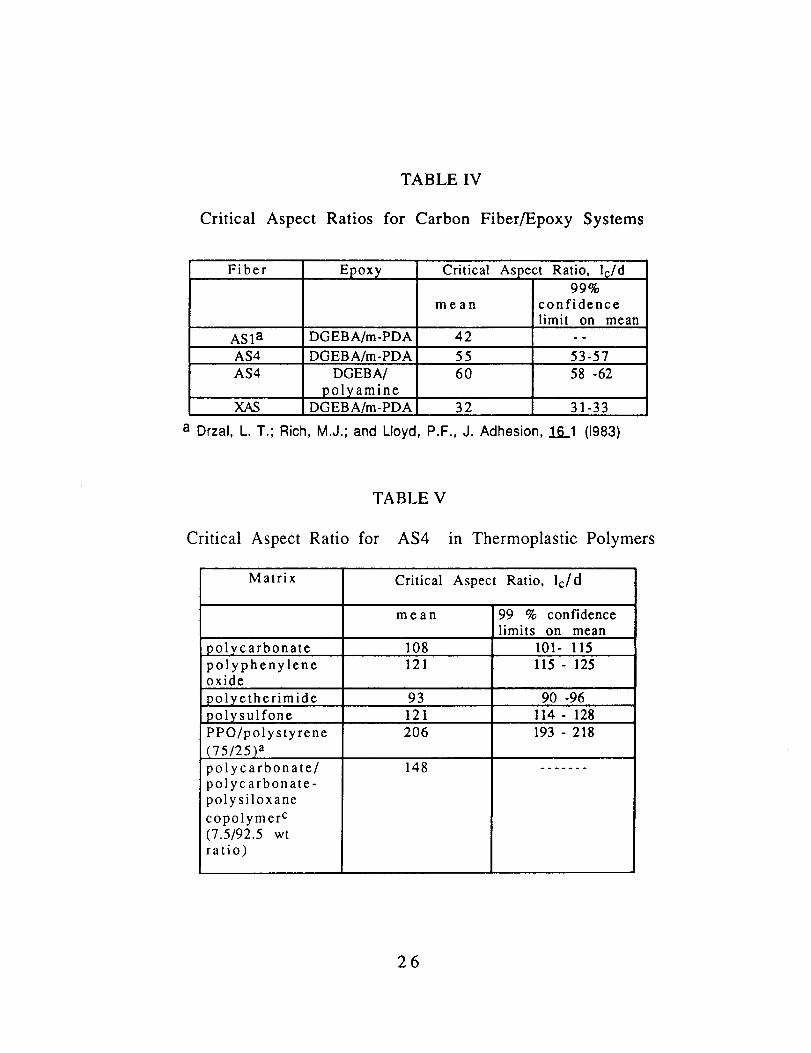
Critical Aspect Ratios
TABLE IV
for Carbon Fiber/Epoxy Systems
Fiber Epoxy Critical Aspect Ratio, l_/d99%
mean confidencelimit on mean
AS1 a DGEBA/m-PDA 42 - -
AS4 DGEBA/m-PDA 55 53-57AS4 DGEBA/
polyamineDGEBA/m-PDA
60
32
58 -62
XAS 31-33
a Drzal, L. T.; Rich, M.J.; and Lloyd, P.F., J. Adhesion, 161 (1983)
TABLE V
Critical Aspect Ratio for AS4 in Thermoplastic Polymers
Matrix Critical Aspect Ratio, lc/d
mean 99 % confidencelimits on mean
polycarbonate 108 101- 115polyphenylene 121 115- 125oxide
93 90 -96
121 114- 128polyetherimide
polysulfone
PPO/polystyrene
(75/25) a
polycarbonate/polycarbonate-
polysiloxane
copolymer c(7.5/92.5 wtratio)
206
148
193 - 218
26
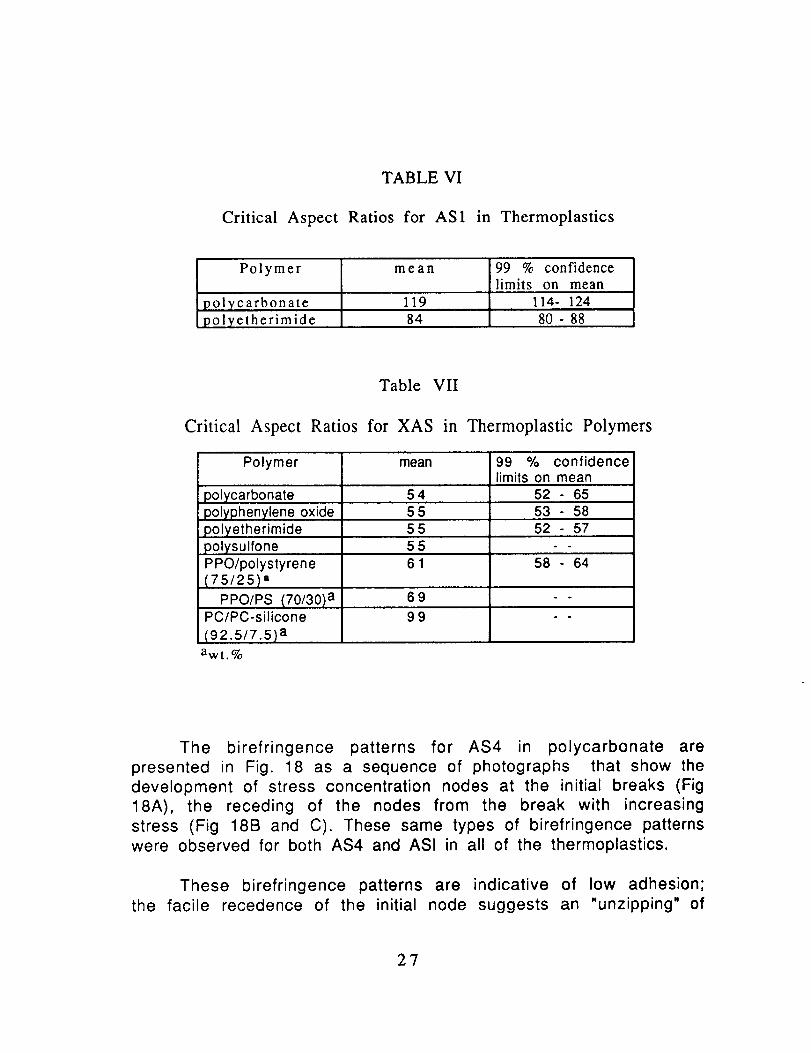
TABLE VI
Critical Aspect Ratios for AS1 in Thermoplastics
Polymer mean 99 % confidencelimits on mean
119 114- 124polycarbonatepolyetherimide 84 80 - 88
Table VII
Critical Aspect Ratios for XAS in Thermoplastic Polymers
Polymer mean 99 % confidencelimits on mean
polycarbonate 54 52 - 6555 53 - 58polyphenylene oxide
polyetherimide
polysulfonePPO/polystyrene{75/25) a
PPO/PS (70/30) aPC/PC-silicone
(92.5/7.5) a
555561
52 - 57
58 - 64
69 " °
99 - -
awt.%
The birefringence patterns for AS4 in polycarbonate are
presented in Fig. 18 as a sequence of photographs that show the
development of stress concentration nodes at the initial breaks (Fig18A), the receding of the nodes from the break with increasing
stress (Fig 18B and C). These same types of birefringence patterns
were observed for both AS4 and ASI in all of the thermoplastics.
These birefringence patterns are indicative of low adhesion;the facile recedence of the initial node suggests an "unzipping" of
2?
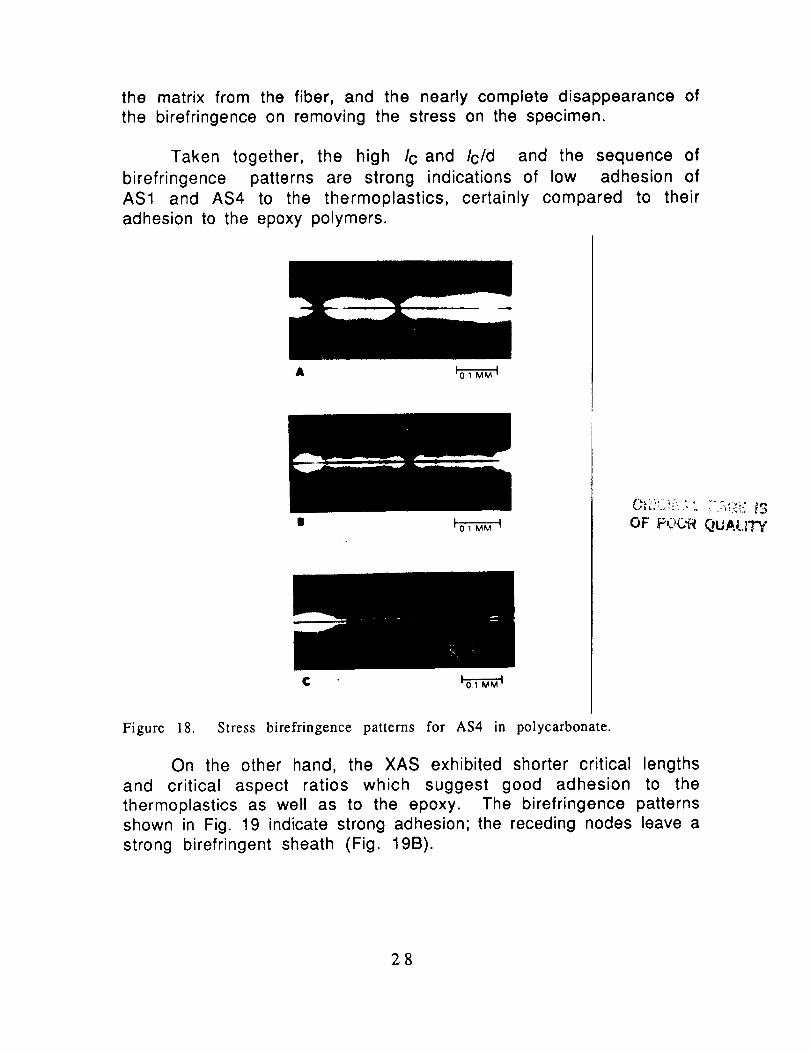
the matrix from the fiber, and the nearly complete disappearance ofthe birefringence on removing the stress on the specimen.
Taken together, the high Ic and Ic/d and the sequence of
birefringence patterns are strong indications of low adhesion of
AS1 and AS4 to the thermoplastics, certainly compared to their
adhesion to the epoxy polymers.
A
c
OF POC_ QUAL._TY
Figure 18. Stress birefringence patterns for AS4 in polycarbonate.
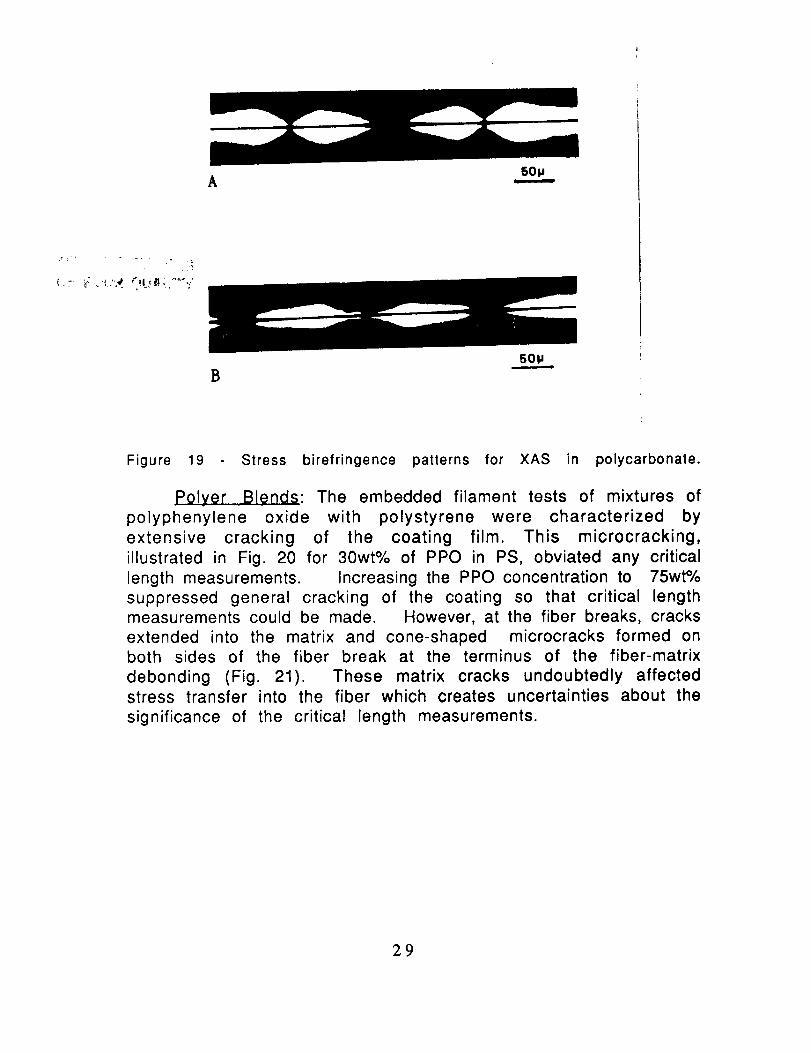
On the other hand, the XAS exhibited shorter critical lengths
and critical aspect ratios which suggest good adhesion to the
thermoplastics as well as to the epoxy. The birefringence patternsshown in Fig. 19 indicate strong adhesion; the receding nodes leave a
strong birefringent sheath (Fig. 19B).
28
50pA
B50P
Figure 19 Stress birefringence patterns for XAS in polycarbonate.
Polyer Blends: The embedded filament tests of mixtures of
polyphenylene oxide with polystyrene were characterized by
extensive cracking of the coating film. This microcracking,
illustrated in Fig. 20 for 30wt% of PPO in PS, obviated any critical
length measurements. Increasing the PPO concentration to 75wt%
suppressed general cracking of the coating so that critical lengthmeasurements could be made. However, at the fiber breaks, cracks
extended into the matrix and cone-shaped microcracks formed onboth sides of the fiber break at the terminus of the fiber-matrix
debonding (Fig. 21). These matrix cracks undoubtedly affectedstress transfer into the fiber which creates uncertainties about the
significance of the critical length measurements.
29

f- r _ rJ '_
50_
Figure 20 General microcracking of awt% polyphenylene oxide.
polystyrene coating containing 30
0.035 mm
Figure 21 - Microcracking at a break in an AS4 fiber in PPO/PS (75/25). Thecentral crack is located at the fiber break. The cracks left and right of centerare at the terminal points of the debonding between fiber and matrix.
30
The critical lengths of both AS4 and XAS in blends of
polycarbonate with the polycarbonate-polysiloxane copolymer(PC/PC-silicone) were relatively high; Table V and Table VII. Quite
possibly the PC-silicone copolymer is adsorbed or deposited on both
fiber types and acts to reduce fiber-matrix interfacial energy or to
form a weak boundary layer.
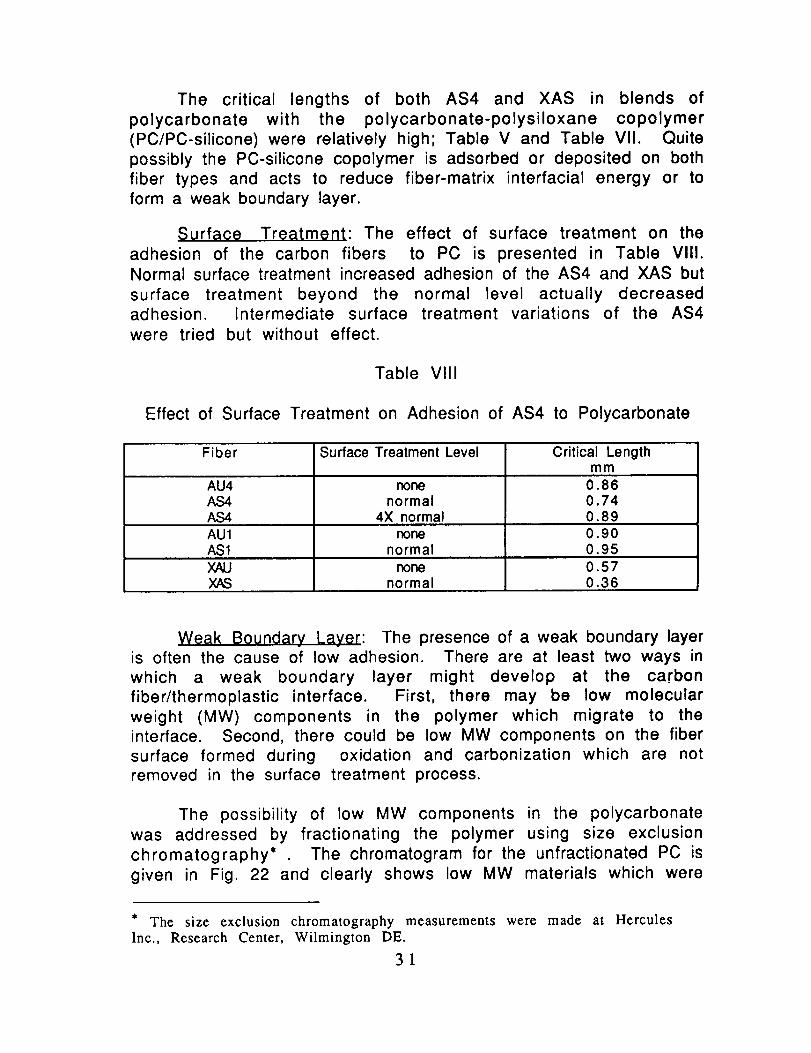
Surface Treatment: The effect of surface treatment on the
adhesion of the carbon fibers to PC is presented in Table VIII.Normal surface treatment increased adhesion of the AS4 and XAS but
surface treatment beyond the normal level actually decreasedadhesion. Intermediate surface treatment variations of the AS4
were tried but without effect.
Table VIII
Effect of Surface Treatment on Adhesion of AS4 to Polycarbonate
Fiber Surface Treatment Level Critical Lengthmm
AU4 none 0.86AS4 normal 0.74AS4 4X normal 0.89AU 1 none 0.90AS1 normal 0.95
XAU none 0.57X,_ normal 0.36
Weak Boundary Layer: The presence of a weak boundary layeris often the cause of low adhesion. There are at least two ways in
which a weak boundary layer might develop at the carbon
fiber/thermoplastic interface. First, there may be low molecular
weight (MW) components in the polymer which migrate to theinterface. Second, there could be low MW components on the fiber
surface formed during oxidation and carbonization which are not
removed in the surface treatment process.
The possibility of low MW components in the polycarbonate
was addressed by fractionating the polymer using size exclusion
chromatography* The chromatogram for the unfractionated PC is
given in Fig. 22 and clearly shows low MW materials which were
* The size exclusion chromatography measurements were made at Hercules
Inc., Research Center, Wilmington DE.
31

removed by fractionation (Fig. 23). However, the critical lengths forAS4 in the fractionated polycarbonate were not significantlydifferent than for the unfractionated PC (Table IX).
TABLE IX
Effect of Polycarbonate Fractionation on AS4 Critical Length
Polycarbonate Critical Length (mm) Critical Aspect Ratiomean 99% COM a
as received 0.74 108 101 - 115fractionated 0.81 133 110 - 124
a confidence limits on the mean
Figure 22 Size exclusion chromatogram of unfractionated polycarbonate.
32
I
l.. I_
t
/\ .
2_1 2S 3_ 75
5 4 3
_ .| .... m
41,.1-
_J , ,.Jj..,
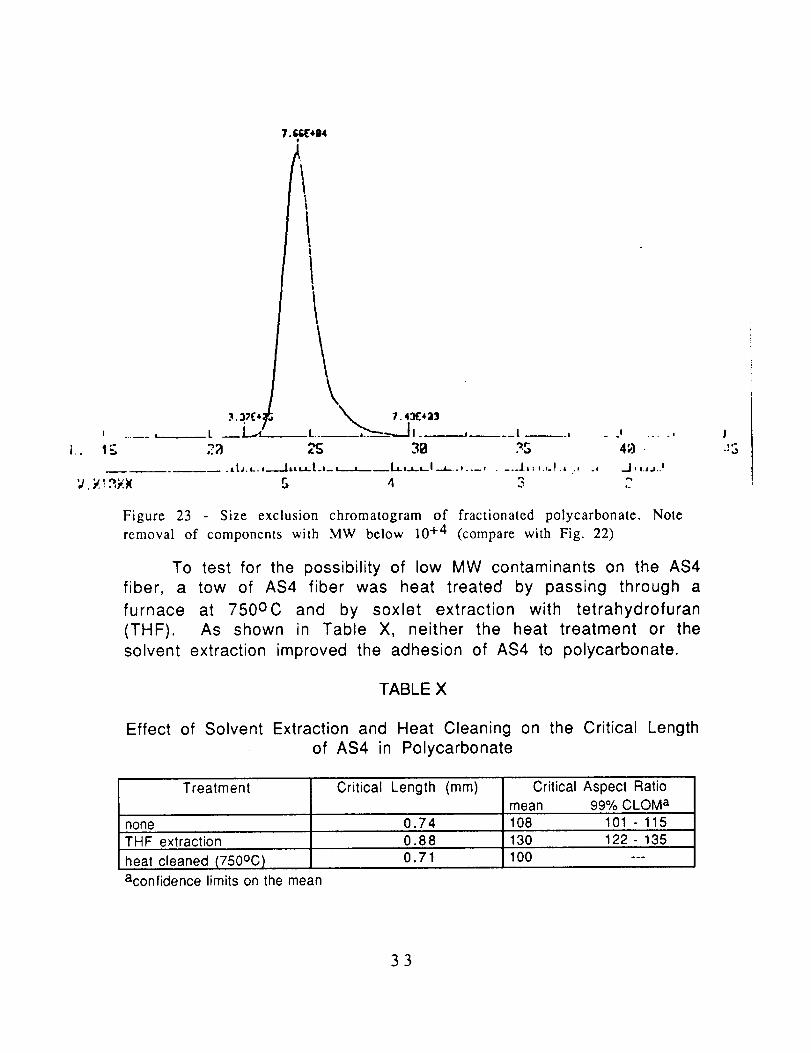
Figure 23 - Size exclusion chromatogram of fractionated polycarbonate. Note
removal of components with MW below 10 +4 (compare with Fig. 22)
To test for the possibility of low MW contaminants on the AS4
fiber, a tow of AS4 fiber was heat treated by passing through a
furnace at 750oc and by soxlet extraction with tetrahydrofuran
(THF). As shown in Table X, neither the heat treatment or the
solvent extraction improved the adhesion of AS4 to polycarbonate.
TABLE X
J
-:.3
Effect of Solvent Extraction and Heat Cleaning on the Critical Length
of AS4 in Polycarbonate
Treatment
noneTHF extraction
heat cleaned (750°C)
aconfidence limits on the mean
Critical Length (mm) Critical Aspect Ratiomean 99% CLOM a
0.74 108 101 - 115
0.88 130 122- 1350.71 100 ---
33
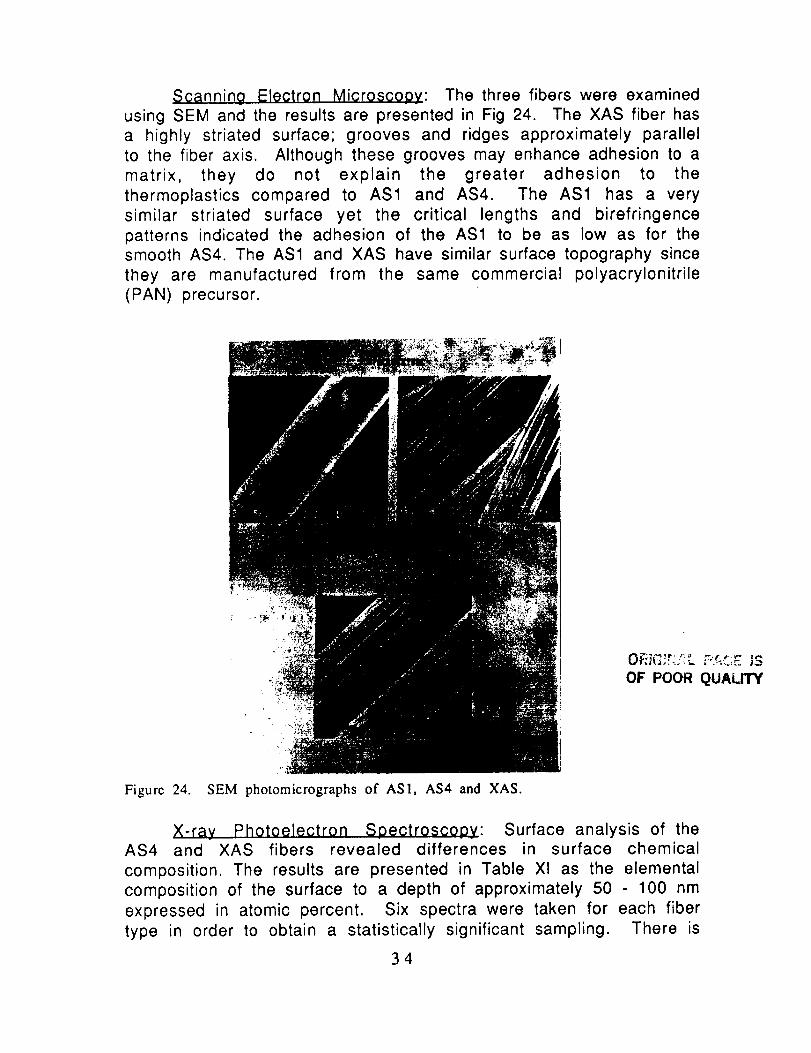
Scanning Electron Microscooy: The three fibers were examinedusing SEM and the results are presented in Fig 24. The XAS fiber has
a highly striated surface; grooves and ridges approximately parallel
to the fiber axis. Although these grooves may enhance adhesion to a
matrix, they do not explain the greater adhesion to the
thermoplastics compared to AS1 and AS4. The AS1 has a very
similar striated surface yet the critical lengths and birefringence
patterns indicated the adhesion of the AS1 to be as low as for thesmooth AS4. The AS1 and XAS have similar surface topography since
they are manufactured from the same commercial polyacrylonitrile
(PAN) precursor.
OEJG;...'_:;'.:L ,-,r,_,,-
OF POOR QUALITY
Figure 24. SEM photomicrographs of AS1, AS4 and XAS.
X-ray Photoelectron SDectrosco0y: Surface analysis of theAS4 and XAS fibers revealed differences in surface chemical
composition. The results are presented in Table Xl as the elemental
composition of the surface to a depth of approximately 50 100 nm
expressed in atomic percent. Six spectra were taken for each fiber
type in order to obtain a statistically significant sampling. There is
34
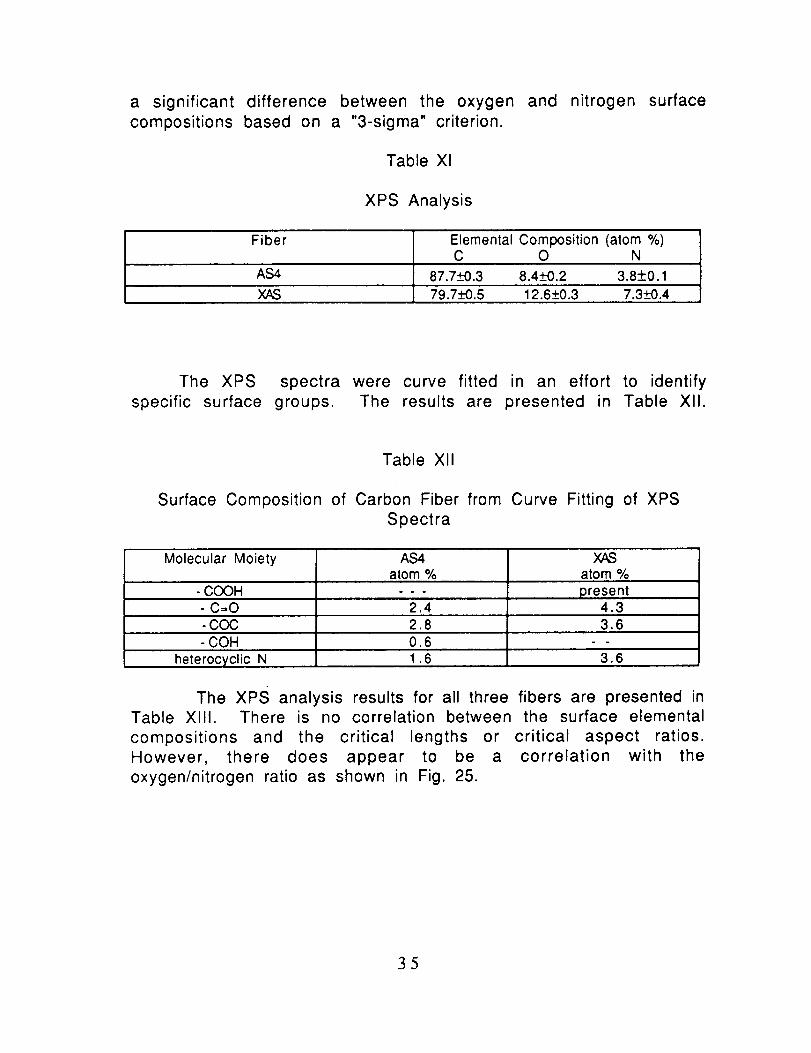
a significant difference between the oxygen and nitrogen surfacecompositions based on a "3-sigma" criterion.
Table Xl
XPS Analysis
Fiber ElementalComposition(atom%)C O N
AS4 87.7_-+0.3 8.4+0.2 3.8+0.1
XAS 79.7_--K).5 12.6_+0.3 7.3_+0.4
The XPS spectra were curve fitted in an effort to identify
specific surface groups. The results are presented in Table XlI.
Table Xll
Surface Composition of Carbon Fiber from Curve Fitting of XPS
Spectra
Molecular Moiety
- COOH- C=O-COC- COH
heterocyclic N
AS4atom %
2.42.80.61.6
atom %
present4.33.6
3.6
The xPS analysis results for all three fibers are presented inTable XlII. There is no correlation between the surface elemental
compositions and the critical lengths or critical aspect ratios.However, there does appear to be a correlation with the
oxygen/nitrogen ratio as shown in Fig. 25.
35
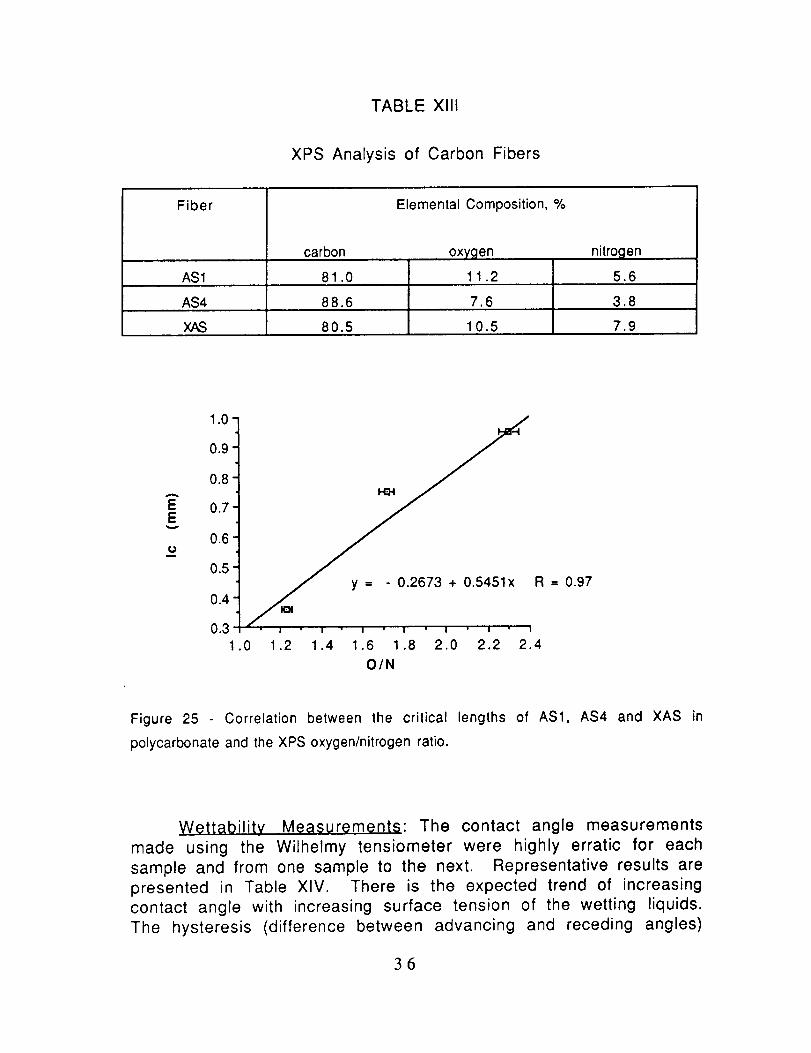
TABLE Xlll
XPS Analysis of Carbon Fibers
Fiber
carbon
Elemental Composition, %
oxygen
11.2AS1 81.0
AS4 88.6 7.6 3.8
80.5 10.5 7.9
nitrogen
5.6
A
EE
v
U
1.0
0.9
0.8
0.7
0.6
0.5
0.4
0.3
y -- - 0.2673 + 0.5451x R -- 0.97
I
•0 1.2 1.4 1.6 1.8 2.0 2.2 2.4
O/N
Figure 25 Correlation between the critical lengths of AS1, AS4 and XAS in
polycarbonate and the XPS oxygen/nitrogen ratio.
Wettability Measurements: The contact angle measurements
made using the Wilhelmy tensiometer were highly erratic for each
sample and from one sample to the next. Representative results are
presented in Table XIV. There is the expected trend of increasingcontact angle with increasing surface tension of the wetting liquids.
The hysteresis (difference between advancing and receding angles)
36

is very large especially for XAS. This hysteresis is undoubtedly dueto chemical heterogeneity for both fiber types and to surfaceroughness especially in the case of the XAS fiber.
TABLE XlVContact Angle Data
Test Liquid Surface Tension
AS4
Contact Angle
Advancin 9, ea Receding, er
hexadecane 27.6 0 0
(z- bromonapthalene 44.6 29 26e- bromonapthalene 44.6 12 0diidomethane 50.8 36 0water 72.8 57 31water 72.8 70 25
XAS
hexadecane 2 7.6 0 044.6 42 0or- bromonaplhalene
oc- bromonapthalenediidomethane
44.6 22 0
50.8 28 0water 72.8 55-59 24
The fiber diameter can be determined when the contact angle
is zero and the surface tension of the wetting liquid is known. Under
these circumstances, Eq. 5 can be rewritten to,
d = ma/YL v
Fiber diameters for AS4 and XAS determined using hexadecane (e ..
0 o) are listed in Table XV. The data are for fibers taken from the
same fiber spool and so do not reflect possible variations between
spools in the same lot or between different production lots. Note
that there is not a large difference between the diameters of the
two fibers despite the roughness of the XAS surface.
37
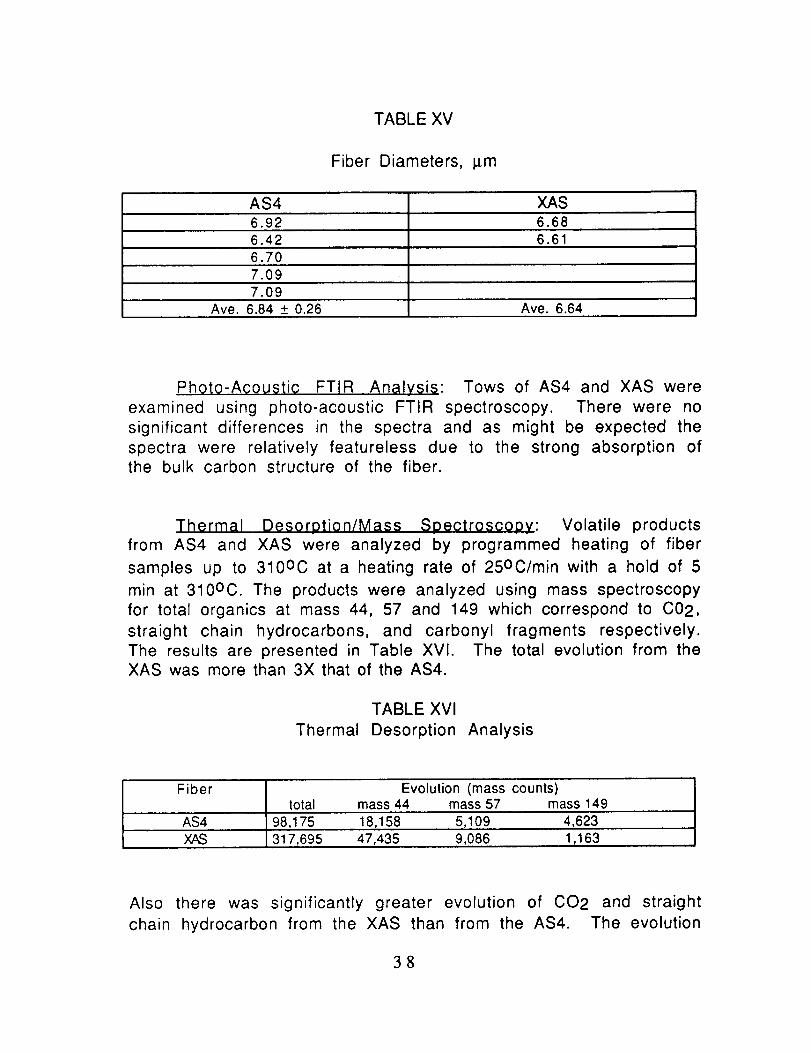
TABLE XV
Fiber Diameters, I_m
AS4 XAS6.92 6.686.42 6.616.707.097.09
Ave. 6.84 _+0.26 Ave. 6.64
Photo-Acoustic FTIR Analysis: Tows of AS4 and XAS were
examined using photo-acoustic FTIR spectroscopy. There were no
significant differences in the spectra and as might be expected the
spectra were relatively featureless due to the strong absorption ofthe bulk carbon structure of the fiber.
Thermal DesorDtion/Mass SDectroscoDy: Volatile products
from AS4 and XAS were analyzed by programmed heating of fiber
samples up to 310oc at a heating rate of 25oC/min with a hold of 5
min at 310oc. The products were analyzed using mass spectroscopy
for total organics at mass 44, 57 and 149 which correspond to C02,
straight chain hydrocarbons, and carbonyl fragments respectively.The results are presented in Table XVI. The total evolution from theXAS was more than 3X that of the AS4.
TABLE XVI
Thermal Desorption Analysis
Fiber Evolution (mass counts)total mass 44 mass 57 mass 149
AS4 98,175 18,158 5,109 4,623XAS 317,695 47,435 9,086 1,163
Also there was significantly greater evolution of CO2 and straight
chain hydrocarbon from the XAS than from the AS4. The evolution
38
from AS4 at mass number 149 (presumably carbonyl fragments) wasgreater than for XAS. It is very likely that much of the evolvedmaterial came from the interior and not just from the surface. As isevident from the data in Table XVI, the fragments analyzed at thethree mass numbers represent only a fraction of the materialevolved. The release of material was essentially continuous duringthe heat up and hold step except for mass number 149 from the AS4which peaked at about 210oc and then declined to essentially zeroas the sample reached 310oc.
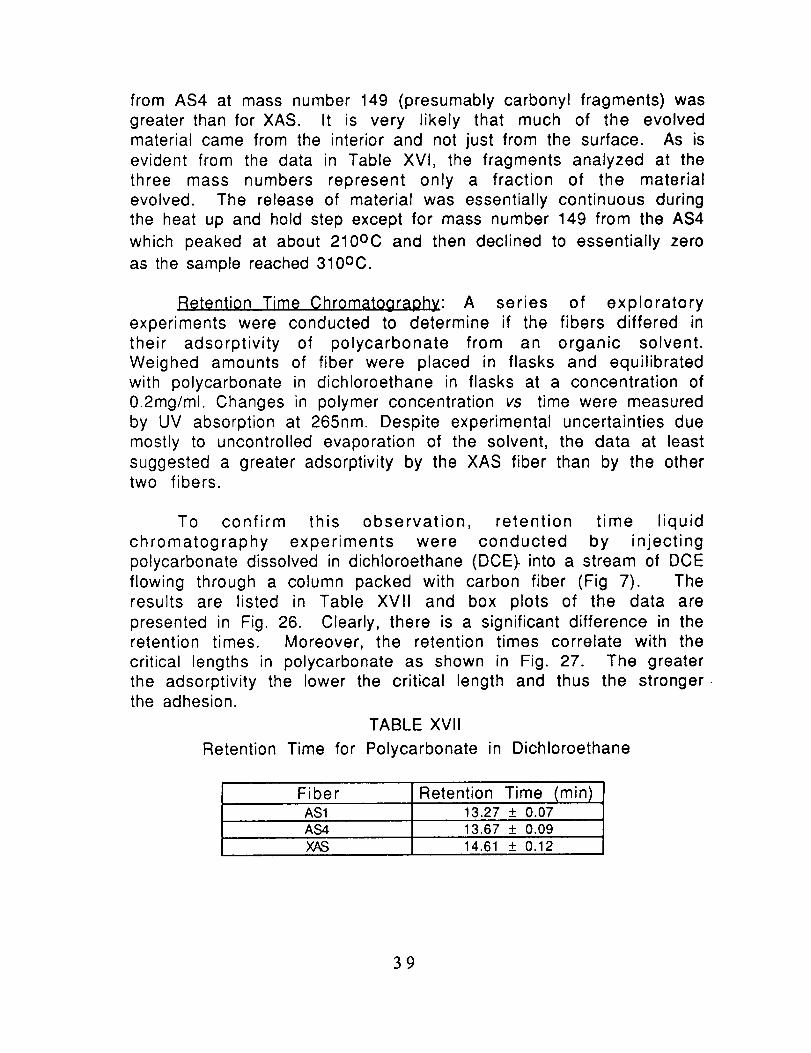
R_#tention Time Chromatography: A series of exploratory
experiments were conducted to determine if the fibers differed in
their adsorptivity of polycarbonate from an organic solvent.Weighed amounts of fiber were placed in flasks and equilibrated
with polycarbonate in dichloroethane in flasks at a concentration of
0.2mg/ml. Changes in polymer concentration vs time were measured
by UV absorption at 265nm. Despite experimental uncertainties due
mostly to uncontrolled evaporation of the solvent, the data at least
suggested a greater adsorptivity by the XAS fiber than by the othertwo fibers.
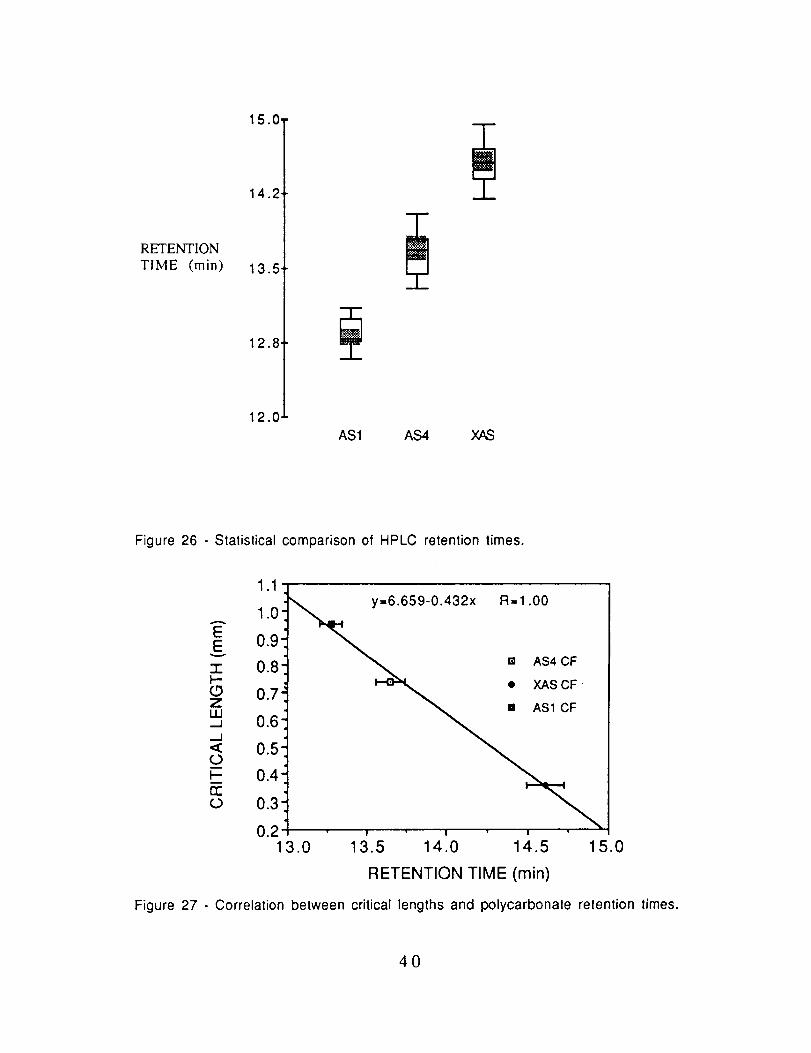
To confirm this observation, retention time liquid
chromatography experiments were conducted by injecting
polycarbonate dissolved in dichloroethane (DCE)-into a stream of DCE
flowing through a column packed with carbon fiber (Fig 7). The
results are listed in Table XVll and box plots of the data are
presented in Fig. 26. Clearly, there is a significant difference in theretention times. Moreover, the retention times correlate with the
critical lengths in polycarbonate as shown in Fig. 27. The greater
the adsorptivity the lower the critical length and thus the stronger.the adhesion.
TABLE XVll
Retention Time for Polycarbonate in Dichloroethane
Fiber Retention Time (min)AS1 13.27 + 0.07AS4 13.67 ___0.09X/kS 14.61 + 0.12
39
15.0.
14.2.
RETENTION
TIME (rain) 13.5.
12.8 •
12.0
AS1 AS4 XAS
Figure 26 - Statistical comparison of HPLC retention times.
1.1
1.0EE 0.9
•1" 0.8I--
0.7 •Zu..I._ 0.6
< 0.5O
0.4-rco 0.3-
0.21
6.659-0.432x R--1.00
m AS4 CF
• XAS CF
• 1 • I " I '
3.0 13.5 14.0 14.5 15.0
RETENTION TIME (min)
Figure 27 - Correlation between critical lengths and polycarbonate retention times.
4O

_; Various sizings were applied to AS4 in an attempt toimprove adhesion to polycarbonate. The results of these tests arepresented in Table XVIII. All of the sizings were applied frommethylene chloride except the aminopropyl silane which was appliedfrom aqueous solution. Each sizing was applied at various Ioadingsranging from 0.05-1.0%. The data presented in Table XVIII representthe lowest /c (best adhesion) measured which in some cases was
greater than the control, e.g., the sizing reduced the adhesion.
Only the phenoxy** sizing significantly increased the
AS4/polycarbonate adhesion. The best results were obtained for
sizing levels less than 0.1wt.%. The birefringence pattern generally
indicated good adhesion although this varied along the filament in a
given specimen and between specimens. It is quite possible that the
sizing was not evenly distributed on the fiber (or through the tow)and that better control of the sizing operation might improve
adhesion still further.
Radio FreQuency Plasma Treatment; The fibers were exposedto the various plasmas for times ranging from 1 - 10 min.
Specimens were prepared within less than 3 min after exposure, thesolvent allowed to evaporate and then tested for critical lengths.
The results, expressed as critical aspect ratios are presented inTable XIX. The average critical aspect ratios are plotted as a
function of plasma treatment times in Figs. 28-30.
** The phenoxy sizing was suggested by Prof. L.T. Drzal, Michigan StateUniversity
41

TABLE XVIII
Effect of Sizings on the Adhesion of AS4 to Polycarbonate
Sizing Agent wt % on fiber Critical Length
none ---
W- size b 1.0
epoxy anhydride c
polyimide d
aminopropyl
silane e
0.45
0.25
0.12
polycarbonate 0.1
phenoxy f 0.08
a 99% confidence limits on the mean
b Hercules proprietary epoxy-based size
mm
Critical Aspect
Ratio
mean 99% CLOM a
0.74 108 101-115
0.64 94 91-98
0.78 114 110-118
1.07 156 145-167
0.68 99 95-103
0.78 115 110-119
0.54 79 79-81
c diglycidylether Bisphenol A/hexahydrophthalic
d proprietary sizing supplied by NASA
e A-1100, Union Carbide Corp
f. PKHC, Union Carbide Corp
anhydride
42
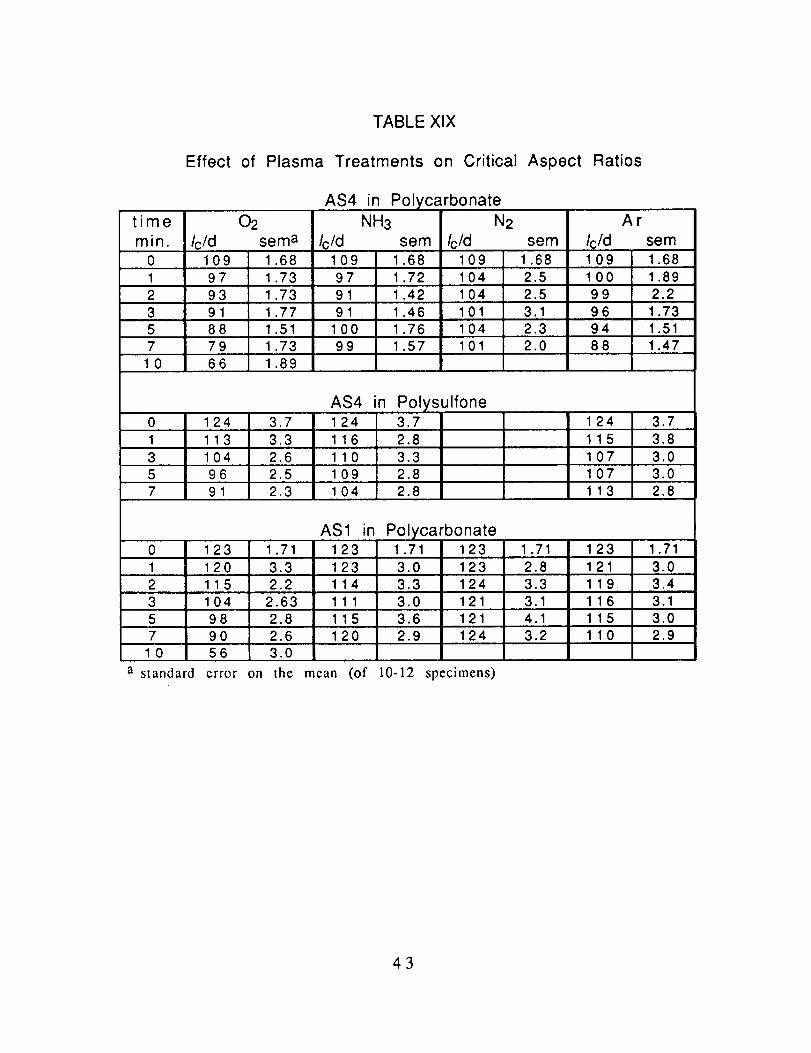
TABLE XlX
Effect of Plasma Treatments on Critical Aspect Ratios
time
min.02
Ic/d sema
AS4 in Polycarbonate
NH3
Ic/d sem
N2
Icld sem
AF
Ic/d sem0 1 09 1.68 1 09 1.68 109 1.68 1 09 1.681 97 1.73 97 1.72 104 2.5 100 1.892 93 1.73 91 1.42 104 2.5 99 2.23 91 1.77 91 1.46 101 3.1 96 1.735 88 1.51 100 1.76 104 2.3 94 1.517 79 1.73 99 1.57 101 2.0 88 1.47
10 66 1.89
AS4 in Polysulfone0 124 3.7 124 3.71 113 3.3 116 2.8 115 3.83 104 2.6 110 3.3 107 3.05 96 2.5 109 2.8 107 3.07 91 2.3 104 2.8 113 2.8
124 3,7
AS1 in
115
0 123 1.71 1 23 1.71 1 23 1.711 120 3.3 123 2.8 121 3.02 2.2 114 3.3 11 9 3.4
116
Polycarbonate1.71 1233.0 1233.3 1243.0 1213.6 1212.9 124
3.13 1 04 2.63 111 3.15 98 2.8 115 4.1 115 3.07 90 2.6 1 20 3.2 11 0 2.9
10 56 3.0
a standard error on the mean (of 10-12 specimens)
43

110
A
"ou 100
0
_" gO
0uJQ.
80
..J
0
700
6O
[] oxygen
• ammonia
• nitrogen
A argon
0 2 4 6 8 10
TREATMENT TIME (min)
12
Figure 28 - Effect of plasma treatment on the critical aspect ratio of AS4 inpolycarbonate.
44

130
_ 120
0
_ 110
G
_ 100
D oxygen
90A argon
0 | I I
0 2 4 6 8
TREATMENT TIME (min)
Figure 29 - Effect of plasma treatment on the critical aspect ratio of AS4 in polysulfone.
45
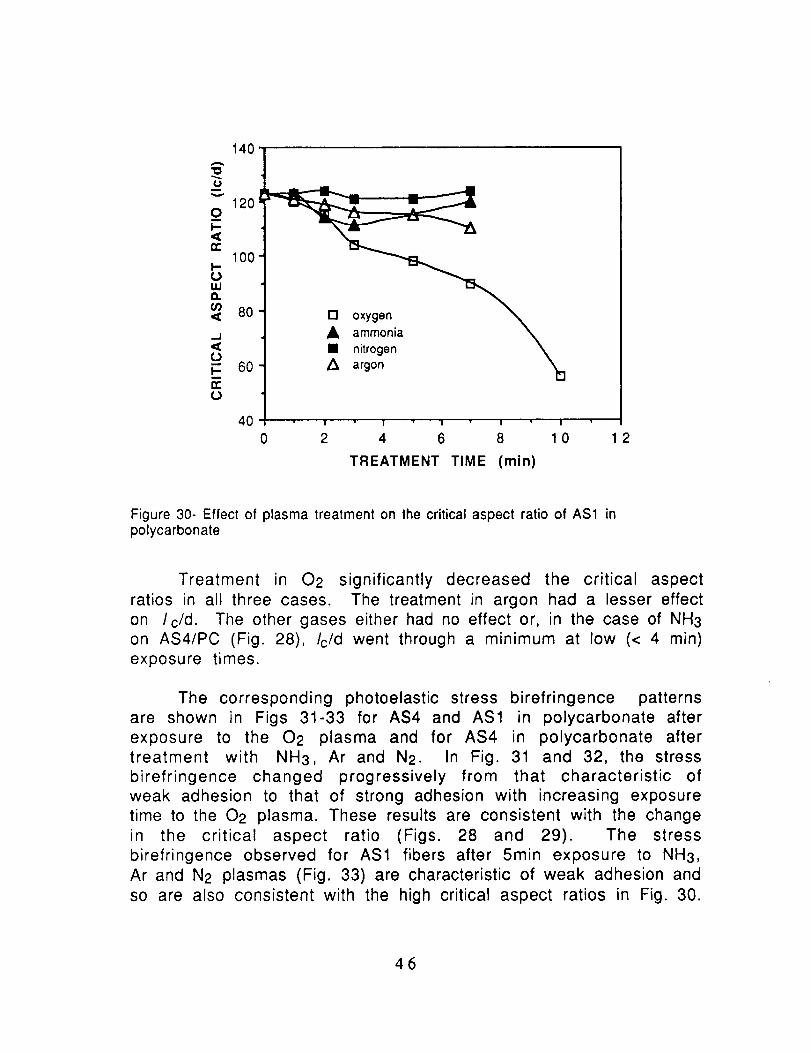
140
O 120
n- 100
80
oC--. 60
400 2 4 6 8 10 12
TREATMENT TIME (min)
Figure 30- Effect of plasma treatment on the critical aspect ratio of AS1 inpolycarbonate
Treatment in 02 significantly decreased the critical aspect
ratios in all three cases. The treatment in argon had a lesser effecton I c/d. The other gases either had no effect or, in the case of NH3
on AS4/PC (Fig. 28), Ic/d went through a minimum at low (< 4 min)
exposure times.
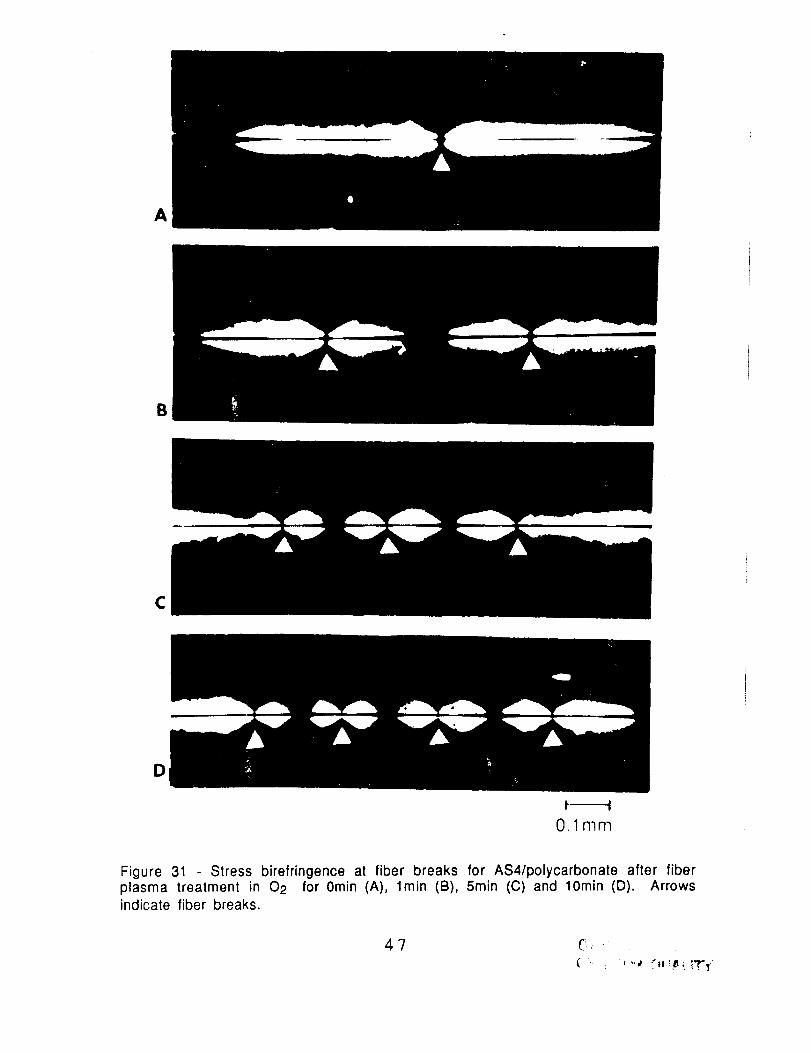
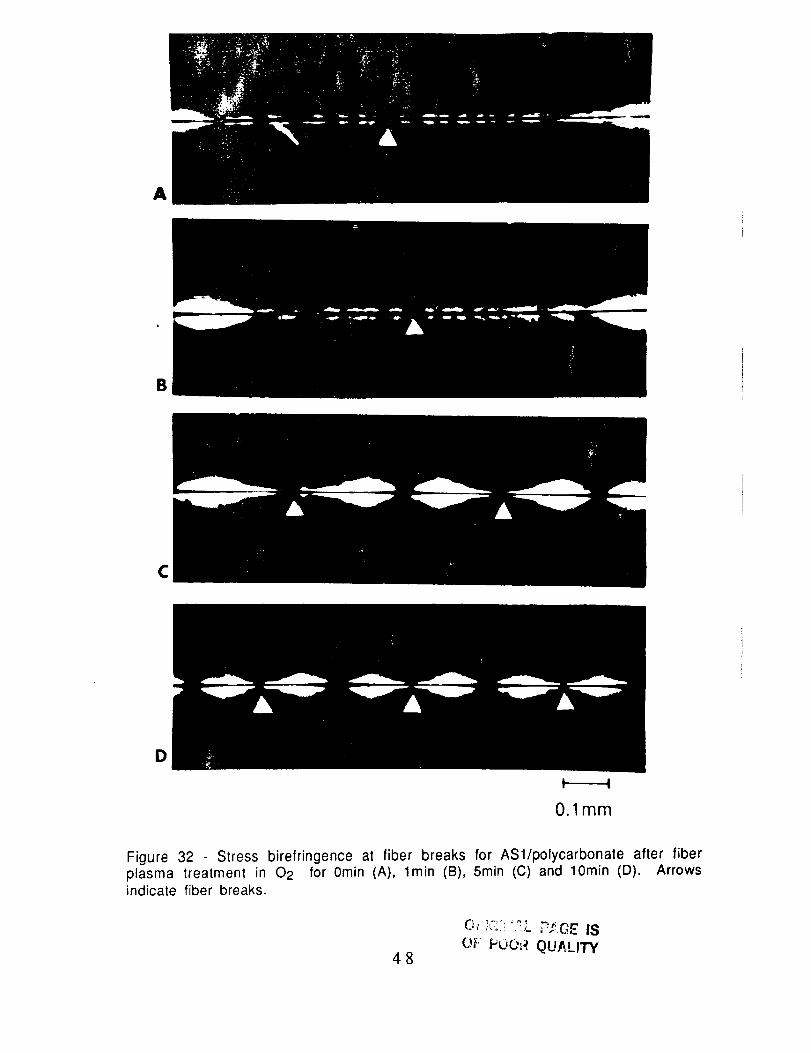
The corresponding photoelastic stress birefringence patterns
are shown in Figs 31-33 for AS4 and AS1 in polycarbonate after
exposure to the 02 plasma and for AS4 in polycarbonate after
treatment with NH3, Ar and N2. In Fig. 31 and 32, the stressbirefringence changed progressively from that characteristic of
weak adhesion to that of strong adhesion with increasing exposure
time to the 02 plasma. These results are consistent with the change
in the critical aspect ratio (Figs. 28 and 29). The stress
birefringence observed for AS1 fibers after 5min exposure to NH3,Ar and N2 plasmas (Fig. 33) are characteristic of weak adhesion and
so are also consistent with the high critical aspect ratios in Fig. 30.
46
A
B
C
D
Figure 31 Stress birefringence at fiber breaks for AS4/polycarbonate after fiberplasma treatment in 02 for 0min (A), lmin (B), 5rain (C) and 10min (D). Arrowsindicate fiber breaks.
47 C_
A
B
¢
D
0.1mm
Figure 32 - Stress birefringence at fiber breaks for ASl/polycarbonate after fiberplasma treatment in 02 for 0min (A), l min (B), 5min (C) and 10rain (D). Arrowsindicate fiber breaks.
48OF POO;_ QUALITY

A
B
C
Figure 33 - Stress birefringence at fiber breaks for ASl/polycarbonate after fiber wastreated for 5min in ammonia (A), argon (B) and nitrogen (C) plasmas.
49OF pOUR QUAL;_I_

The possible loss in the effectiveness of the plasma
treatments on the critical length was examined by storing treatedfibers in a closed, clean glass container for 7 days before preparing
and testing tensile specimens. The results of these experiments are
presented in Table XX and Figs. 34 and 35 for fibers treated in 02 and
then tested in polycarbonate. Quite clearly, there is a significantloss in the effect of the plasma treatment on the AS4 fiber (Fig.34)
and a nearly complete loss in the case of the AS1 fiber (Fig. 35).
TABLE XX
Critical Lengths Measured 7 days after Treatment
treatment time(min)
critical aspectratio, Ic/ d
standard error onthe mean
123
1.71
AS1 in Polycarbonate
123
4.0
3 5
123 119
4.3 3.0
7
116
2.5
10
113
2.8
treatment time(min)
critical aspectratio, Ic/ d
standard error onthe mean
109
1.68
AS4 in Polycarbonate
107
2.8
3
101
2.6
100
1.77
7
93
2.0
10
90
1.69
5O

110
100
0
I1:90
_ 80
0 70V--.
6O I I I I l
0 2 4 6 8 10 12
TREATMENT TIME (min)
Figure 34 - Critical aspect ratios of AS4 in polycarbonate after plasma treatment in 02tested within a few hours (A) and after storage of the treated fiber for 7 days (B).
5]
140
0 120
rr 100
80
cOF-- 60
_0
40
B
I I I I I
0 2 4 6 8 10 12
TREATMENT TIME (min)
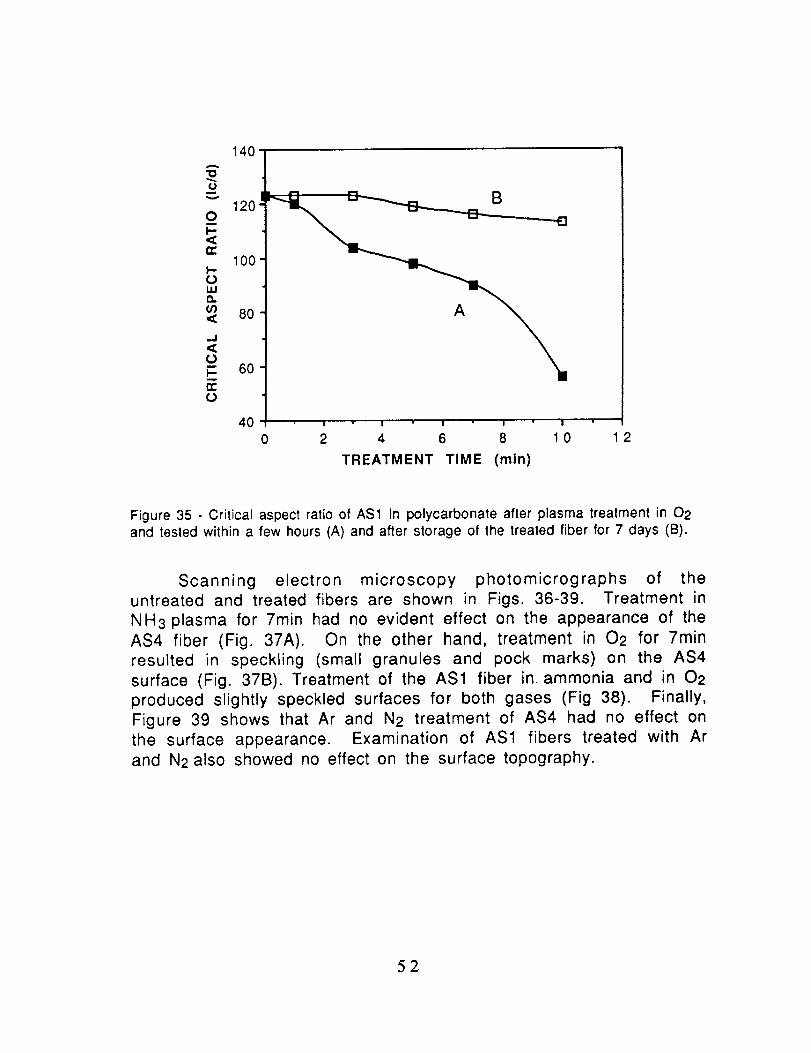
Figure 35 - Critical aspect ratio of AS1 in polycarbonate after plasma treatment in 02and tested within a few hours (A) and after storage of the treated fiber for 7 days (B).
Scanning electron microscopy photomicrographs of theuntreated and treated fibers are shown in Figs. 36-39. Treatment in
NH3 plasma for 7min had no evident effect on the appearance of the
AS4 fiber (Fig. 37A). On the other hand, treatment in 02 for 7minresulted in speckling (small granules and pock marks) on the AS4
surface (Fig. 37B). Treatment of the AS1 fiber in. ammonia and in 02
produced slightly speckled surfaces for both gases (Fig 38). Finally,
Figure 39 shows that Ar and N2 treatment of AS4 had no effect onthe surface appearance. Examination of AS1 fibers treated with Ar
and N2 also showed no effect on the surface topography.
52

A
B
Figure 36 - SEM photomicrographs of untreated AS1 (A) and AS4 (B) fibers.
53

A
Figure 37 - SEM photomicrographs of AS4 fibers after 7mins. of treatment in ammonia(A) and oxygen (B) plasmas
.54
OF POOR Q,JALI'Ff
A
B
Figure 38 - SEM photomicrographs of AS1 fibers after 7mins of treatment in ammonia(A) and oxygen (B) plasmas
55
A
B
Figure 39 - SEM photomicrographs of AS4 fibers after 7mins of treatment in argon (A)and nitrogen (B) plasmas.
5 6 ORs_,_._'_L"'""_'_ PAGE IS
OF POOR QUALITY
The effect of plasma treatment on the surface chemistry of
the fibers was examined using XPS. The results are presented in
Tables XXI and XXII. Plasma treatment in 02 resulted in a significant
increase in the surface oxygen, especially in the case of the AS1
fiber. Plasma treatment in N2 and Ar had no significant effect on the
XPS analyses of either fiber. Ammonia plasma treatment resulted in
an increase in the nitrogen surface composition on both fibers.
In Table XXIII, the XPS analyses are compared for untreated
AS4, AS4 treated in 02 plasma and analyzed within a few minutes
and after 7 days storage. Note that storage of the treated fiberresulted in no measurable change in the atomic percent composition.
The XPS CIs spectra for untreated AS4, 02 plasma treated AS4
fiber immediately after treatment and 02 plasma treated AS4 fiber
after 7 days of storage were obtained by computer least squares
curve fitting in an effort to determine differences in the detailedchemical compositions. The results are presented in Table XXlV. The
02 treatment affected all of the spectral components. However, the
only difference between the fibers tested immediately aftertreatment and those tested 7 days after plasma treatment was a
small decrease in the peak at 286.9 eV.
5?

TABLE XXl
XPS Analysis
AS4 Fibers after O_ Plasma TreatmentTreatment Time
(min)0
Composition (atom %)C N O
91.0 3.7 5.3
3 84.8 2.5 12.7
7 83.5 3.2 13.3
AS4 Fibers after N2 Plasma TreatmentComposition (atom %)Treatment Time
(min)0
7
C N
91.0
85.2
90.1
3.7O5.3
7.2
4.7
AS4 Fibers after NH_ Plasma TreatmentTreatment Time Composition (atom %)
(min)0
3
7
C N91.0
90.3
83.4
3.7
3.8
11.6
O5.3
5.9
5.0
AS4 Fibers after Ar Plasma Treatment
Treatment Time(min)
0
Composition (atom %)C N
3.791.0
3 85.4 4.6
7 83.4 7.8
O5.3
10.0
8.8
58

TABLE XXll
XPS Analysis
AS1 Fibers after 02 Plasma Treatment
Treatment Time(min)
0
3
Composition (atom %)C N O
83.7
80.8
76.9
4.6 10.3
1.6 14.6
0.9 16.4
Na1.2
2.4
4.7
AS1 Fibers after N2 Plasma Treatment
Treatment Time
(min)0
Composition (atom %)C N O
83.7
83.1
85.4
4.6
5.7
4.9
10.3
9.7
Na1.2
1.2
8.0 1.2
AS1 Fibers after NH_ Plasma TreatmentComposition (atom %)
C N O Na10.3
Treatment Time
(min)0 83.7 4.6 1.2
3 83.8 5.8 8.8 1.3
7 78.0 14.0 7.3 0.4
AS1 Fibers after Ar Plasma Treatment
Treatment Time
{min)0
Composition ( atom %)C N O Na
83.7 1.2
83.4 1.0
7 82.3 1.2
4.6 10.3
4.7 10.5
5.8 10.6
59

TABLE XXlII
Effect of Storage Time after 3min of Plasma Treatment in 02
Storage Time Composition (%)C N O
Untreated Fiber 91.0 3.7 5.3
>10 min 84.10 3.6 12.3
7 days 84.4 3.5 12.1
Table XlV
Cis Spectra] Peaks
peak energy (eV) atom composition (%)
untreated immediate
85.43 76.12283.9285.6 10.76 14.72 14.76286.9 1.71 3.64 2.70287.8 2.10 5.52 5.56
7 days storage76.99
It is clear that 02 plasma treatment reduces the critical
aspect ratio for AS4 and AS1 in polycarbonate and for AS4 in
polysulfone. That this decrease in /c/d corresponds to an increase in
fiber matrix adhesion is supported by the systematic change in the
stress birefringence from patterns indicative of low adhesion topatterns indicating strong adhesion.
The decrease in the critical aspect ratio could, of course, be
simply the result of a decrease in the fiber tensile strength (Eq. 1)due to the surface damage observed on the fibers treated in the 02
plasma (Fig. 37 and 38). However, this argument is dismissed based
on the fact that after seven days storage the critical aspect ratiosincreased to values close to that for the untreated fibers.
As expected, XPS analysis of the 02 plasma treated fibers
indicated a significant increase in the surface oxygen content.However, the increase in %0 did not decrease on the fibers stored for
? days even though the adhesion of the stored fibers had diminished
significantly. Curve fitting of the Cls spectra peak revealed no
significant difference between the fibers tested immediately after
treatment and those tested after storage.
6O

There have been claims that active specie (free radicals) areproduced on surfaces subjected to RF plasmas (25). If highlyreactive specie are formed on the carbon fiber surfaces in 02 plasmait is possible that they promote chemical reactions between the
fiber anD the polymers. Donnet et al (26) have suggested that the
treatment in argon plasmas produce active specie on carbon fibersurfaces based on surface energy measurements. In the work
reported here argon plasma treatment did produce some
improvement in adhesion (Fig. 28). The nature of these radicals and
how the promote adhesion is problematical.
Studies of the effect of plasma treatment of carbon fibers
have revealed major changes in the surface composition. Wesson and
AIIred (27) for example have investigated IM-6 fibers treated in 02
plasma and reported an increase in the surface oxygen from 7.9 atom% to 13.8 atom %. They also report an increase in the Cls peak at288.7 eV from 2.6 to 6.5, a 60% increase in acid sites and a 134%
increase in surface polarity. They conclude that the treatment
produces significant increases in surface carbonyl groups. In thework reported here, comparable increases in the %0 were observed
including a slight change in one of the component peaks. Su et al(28) also report a significant increase in surface oxygen (from 8.3atom % to 14.6 atom % after 15min treatment). However, they
conclude that the major chemical change is an increase in the = C - O
moiety.
The increase in adhesion after 02 plasma treatment is
undoubtedly the result of producing oxygen functionality on the fibersurface. Unfortunately, it is not clear as to the chemical
constitution of this functionality. The loss in adhesion after
storage of the fibers is very likely the result of the loss of these
surface groups. Driven by the reduction in surface energy, these
active sites dissipate by various mechanisms; e.g., reorientation,surface reactions between adjacent specie and reaction with
components in the vapor phase such as water or CO2. The reason that
these changes in surface composition were not detected by XPS
analysis is that the outer surface region represent only a small
fraction of the sampling depth of 50 - 100 nm.
61
CONCLUSIONS
The results presented here indicate low adhesion of the AS1and AS4 to the thermoplastic polymers compared to the adhesion ofthese fibers to epoxy polymers. The primary evidence for thisconclusion is the higher critical lengths for the fibers in thethermoplastics compared to the epoxys and the differences in thestress birefringence at fiber breaks. The birefringence patterns ofthe AS1 and AS4 in the thermoplastics were characteristic of lowadhesion and in fact suggested an easy, "unzipping" of the interface.
The results for the XAS fibers indicated strong adhesion inboth epoxys and thermoplastics. This conclusion is based on theshort critical lengths and the birefringence patterns at fiber breaks.
The evidence for strong adhesion of the XAS to thethermoplastics actually supports the conclusion of low adhesion ofAS1 and AS4 in that it removes the possibility that the results forthe AS fibers were in some way related to the different methods ofpreparing the epoxy specimens compared to the thermoplasticspecimens.
Considerable evidence was presented that the differences infiber adhesion cannot be attributed to a weak boundary layer at theinterface or to differences in surface roughness. The adhesion ofAS4 could not be significantly improved by sizings but RF plasmatreatments improved adhesion of both AS4 and AS1 to polycarbonate.
Abundant evidence was presented that the differences inadhesion are related to the fibers surface chemistries. The strongcorrelation between the critical aspect ratio and the HPLC retentiontimes for polycarbonate on the three fiber types indicates theadhesion is related to the fiber surface energy. X-ray photoelectronspectroscopy indicated differences in the surface chemicalcomposition but these differences did not correlate with theadhesion except for the oxygen/nitrogen ratio.
The effectiveness of the 02 plasma treatment was associated
with a major increase in the surface oxygen functionality. From thework of Wesson and AIIred (27), this functionality is primarily in
the form of carbonyl groups and that the 02 plasma increases the
surface acidity significantly.
62

It seems reasonable to conclude that the differences in theadhesion of the three fiber types to thermoplastics is related todifferences in their surface acid character. From the correlationbetween adhesion and the surface O/N ratio, it would appear thatsurface acidity involves not only oxygen functionality but alsonitrogen functionality as well.
63
APPENDIX
EFFECT OF RESIDUAL THERMAL COMPRESSIVE STRESSES
ON CARBON FIBER ADHESION TO POLYCARBONATE
Definition of Terms:
Gr - radial stress.
Go represents the far field fiber stress in the absence of
expansional strains.Em matrix modulus.
Elf - axial fiber modulus.
E2f - radial fiber modulus.Gm matrix shear modulus.
G2f - shear modulus relative in the plane of fiber cross section.
K f - plane strain bulk modulus of the fiber.
Otm linear coefficient of thermal expansion of the matrix.
Otlf - linear coefficient of thermal expansion in the fiber
direction.
ot2f - linear coefficient of thermal expansion in the fiber radialdirection.
Cm thermal expansion of the matrix.
I_o represents the onset of observed fiber breakage in a single
filament test.
Elf thermal expansion in the fiber axial direction.
E2f thermal expansion in the fiber radial direction.
Vm - matrix Poisson ratio.
Vl2f longitudinal Poisson ratio of the fiber.
AT - is the difference between room temperature (25°C) and
the drying temperature.
Z- is equal to x/lc where x is equal to the distance away from
the break and lc is the critical length (lc is defined such that the axialstress recovers 95% of its far field value, _x(lc) = 0.95Aleo or
lc = 2.375R/It).
THEORY
The purpose of work reported here was to determine the effect
of residual thermal compressive stresses on fiber/matrix adhesion
resulting from drying at an elevated temperature and then cooling to
test temperature of 25oc.
64

An analytical model has been developed by Whitney and Drzal
(29) for predicting the axisymmetric radial stress distribution on anisolated broken fiber which is embedded in an unbounded matrix.
This model takes into account thermally induced stresses that arise
when a specimen is heated to elevated temperatures and then cooled
to 25°C. Taking a specimen to elevated temperatures and then
cooling increases the radial compressive stresses resulting in africtional adhesive force between the fiber and the matrix, _r. From
their analysis, the equations of interest are:
(_r (X, R) = [A 2 + g2Al(4.75 X - I) e-4.75X ] go
X
where X = _ [A2]
[All
A 1 = Elf(1
I_ If 4_Grn v 12f
--) +
e o (Kf + Gm)
{Vl2f - Vm +
[(1 + Vm)£ m - £2f " Vl2fl_lf] / F-o} [A31
K%A2=2
(Kf + Gm)
{v12 f - vm + [(1 + Vrn)em - g2f - v12fglf] / I_o}[A4]
gm = °tmAT' elf = °tlfAT' e2f = °_2fAT [A5]
E1 f 4Vl 2fGm
65
[A6]
Em
2(2Kf = [A7]
E 2f / 2G 2f - 2v2fE2f / E lf)
The radial stress or , is normalized with respect to the far field
stress %,
where,
(Yr [A8]15o
c o = A3e ° [A9]
£.o=1%
A 3 = Elf + 4I_Vl2fGm(Vl2f - Vm) / (Iqf + C/n )
[AIO]
[All]
Material constants for polycarbonate and AS4 are listed in
Tables AI and All
The normalized radial compressive stresses for AS4 carbon
fiber embedded in polycarbonate were calculated using Eq. 1 and are
plotted, in Figure 1 from the fiber end, X = 0, to the far field value
of, X > 1. The radial compressive stresses were calculated at the
following drying temperatures, AT = 0°C, -50°C, -75°C, -105°C and-125°C. It can be seen that the radial stresses increased with an
increase in drying temperature. The radial pressure starts at a lowvalue at the fragment break where the shear stress is high,
increases sharply reaching a maximum in the vicinity of :Z --- 0.4 and
decreases slightly to the far field value of _ = 1.5. The radial
pressure for the higher post-drying temperature is quite sensitiveto the induced thermal strains, whereas both the fiber axial and
interfacial shear stresses are relatively insensitive to thermal
strains induced by cooling from the post-drying temperatures (29).
66

0
XlO
0
-2
-4
-6-3
-8
-10
-12
0.0 0.5 1.0 1.5 2.0
Z
[] 0
• -50n -75
• -105
• -125
Figure A1 The effect of drying temperatures (AT) on the interfacial radial
compressive stress for AS4/polycarbonate.
EXPERIMENTAL
Specimen preparation and testing were the same as described
earlier in this report except that the polycarbonate was dissolved in
tetrahydrofuran (THF). Three days at room temperature was ample
time for drying at 75°C for 16hrs and then post-drying up to 100°C,
130°C, and 150°C. A thin film of the PC/THF solution was applied
because a thicker film usually bubbles above temperatures of 125°C.
Heating to 125°C caused the specimens to bow due to stressrelaxation of the polycarbonate support which at 125°C is near its
glass transition temperature (Tg = 150°C). To counter this bowing,1/4 x 1/4 inch steel bars were placed on the sample parallel to the
fiber direction, but not on the fiber itself.
RESULTS
The measured critical lengths versus drying temperatures are
plotted in Figure A2. Each data point represents the average of
eleven specimens.
6?
I c (mm)
1.1
1.0
0.9'
0.8'
0.7'
0,6 ' I " I " I " I ' I " I I '
0 25 50 75 100 125 150 175 200
Temperature (°C)
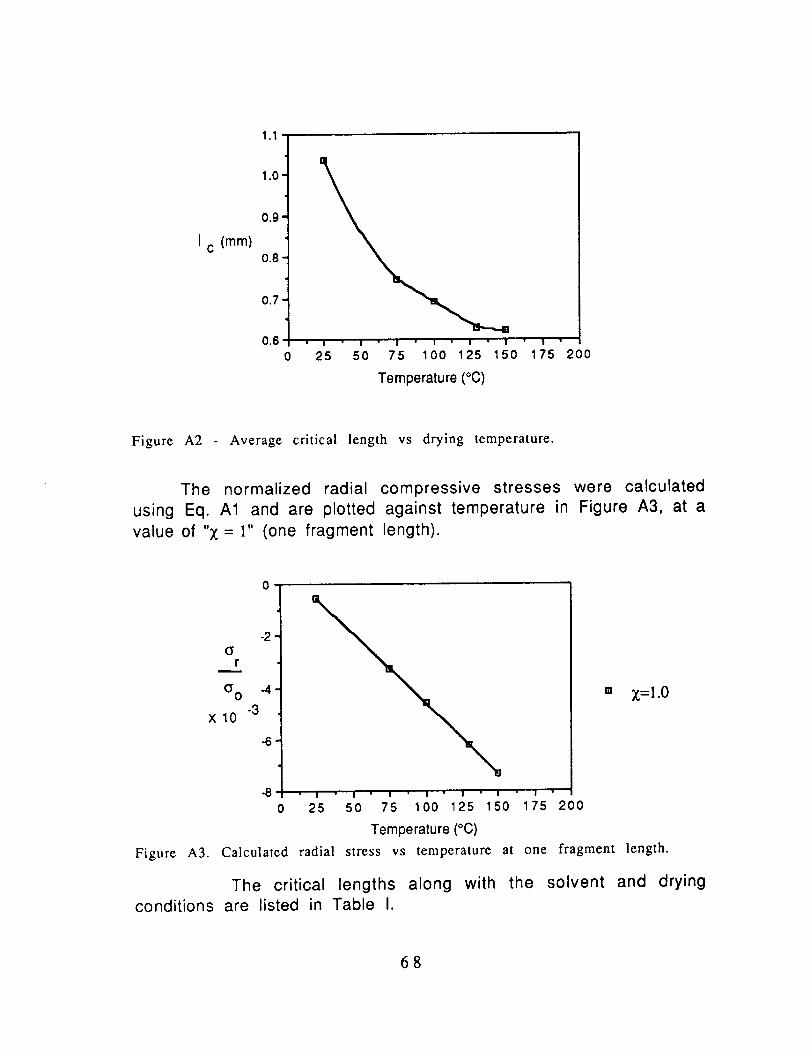
Figure A2 Average critical length vs drying temperature.
The normalized radial compressive stresses were calculated
using Eq. A1 and are plotted against temperature in Figure A3, at a
value of "Z = 1" (one fragment length).
-2
r
_0 -4
-3XIO
-6
-8
"' x=l.O
• I I " I ' I I " I " I
0 25 50 75 100 125 150 175 200
Temperature (°C)
Figure A3. Calculated radial stress vs temperature at one fragment length.
The critical lengths along with the solvent and drying
conditions are listed in Table I.
68
RESULTS and DISCUSSION
In Fig. A2, the critical lengths decreased with increasingdrying temperature. The critical lengths decreased exponentially
between the temperatures of 25°C and 130°C, until finally becoming
constant between the temperatures of 130°C and 150°C. Thisdecrease in critical lengths is consistent with increasing radial
compressive stress (Fig. A3). However, the calculated stressesincreased linearly where as the critical lengths decreased
exponentially. There are a number of possible reasons for thisdifference between the theoretical and experimental results. The
theory considers only the stress state at one fiber end and does nottake into consideration overlapping effects from nearby fiber breaks
as the critical length decreases. Also, there may be some relaxationof the thermal stresses which the theory does not take intoconsideration.
Note in Fig. A2, that the critical length for drying at roomtemperature (25oc) was 1.04mm compared to 0.75mm when the
specimens were post-dried at 75oc. This difference implies that,although the adhesion between AS4 and polycarbonate (and the other
thermoplastics) is low, part of that adhesion is a result of
frictional forces and that the inherent bond strength is even lower.
On the other hand, it is equally possible that drying at 25oc for 24hrs is not sufficient to remove all solvent and that residual solvent
trapped at the interface affects the bond strength.
In Table AIII, the critical length for AS4 in polycarbonate
applied from THF agrees very well with the values obtained using
methylene chloride as a solvent.
The normalized radial compression stress was calculate forAS4 in DGEBA/m-PDA for AT-- -75oC and the results presented in Fig
A4. The physical properties for the DGEBA/mPDA are listed in TableAIV.
In Table AV, the normalized compressive stresses are
compared for AS4 in the epoxy and in polycarbonate. They are
essentially equal so that the differences in the adhesion of this
69
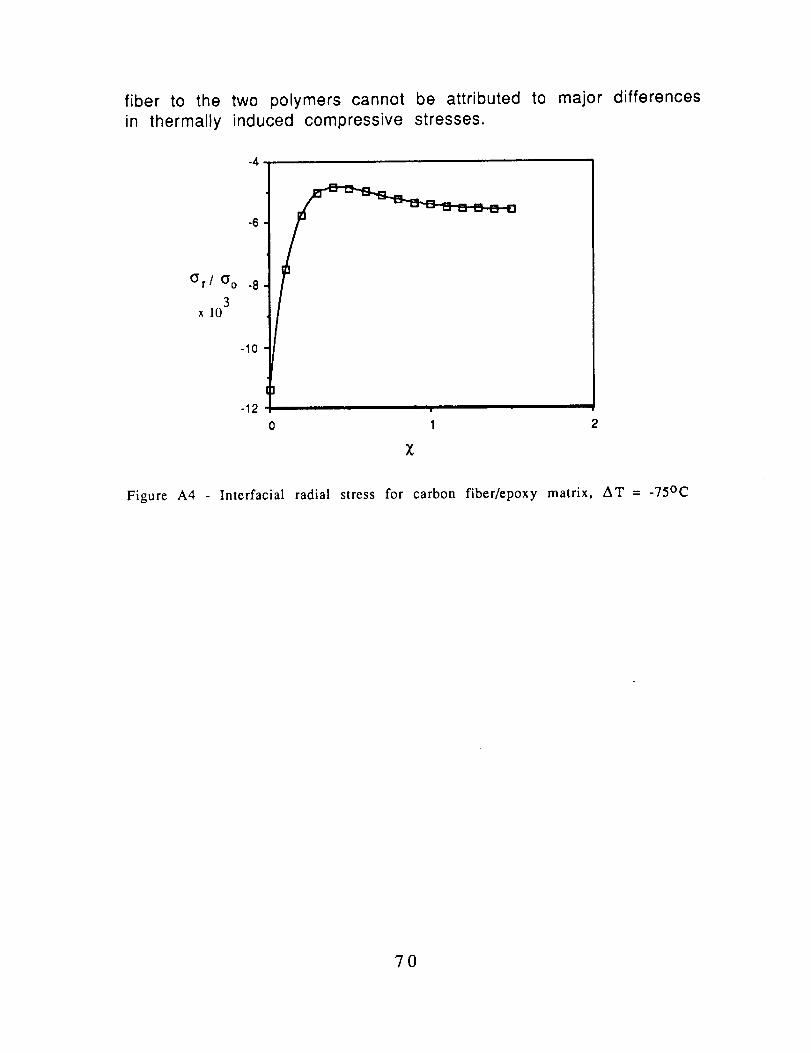
fiber to the two polymers cannot be attributed to major differencesin thermally induced compressive stresses.
-4
-6
Or / (_o -8
x 103
-10
-12
1 2
Figure A4 - Interracial radial stress for carbon fiber/epoxy matrix, AT =-75oc
70
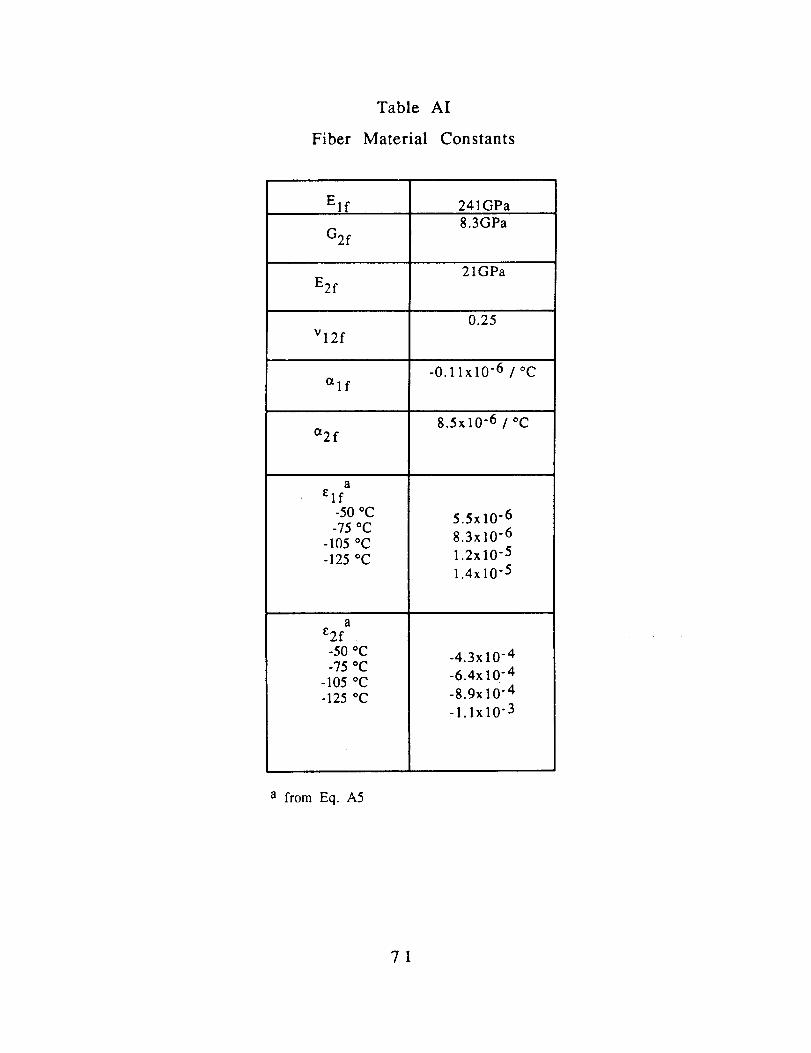
Table AI
Fiber Material Constants
Elf
G2f
E2f
Vl2f
alf
ot2f
a
elf-50 °C-75 oC
-105 °C-125 °C
ae2f-50 °C-75 *C
-105 °C-125 °C
241GPa
8.3GPa
21GPa
0.25
-0.1 lxlO -6 / °C
8.5x10 "6 / °C
5.5x10 "6
8.3x10 -6
1.2x10⁻⁵
1.4x10⁻⁵
-4.3x 10⁻⁴
-6.4x10 -4
-8.9x10 -4
-1.1x10"3
a from Eq. A5
71
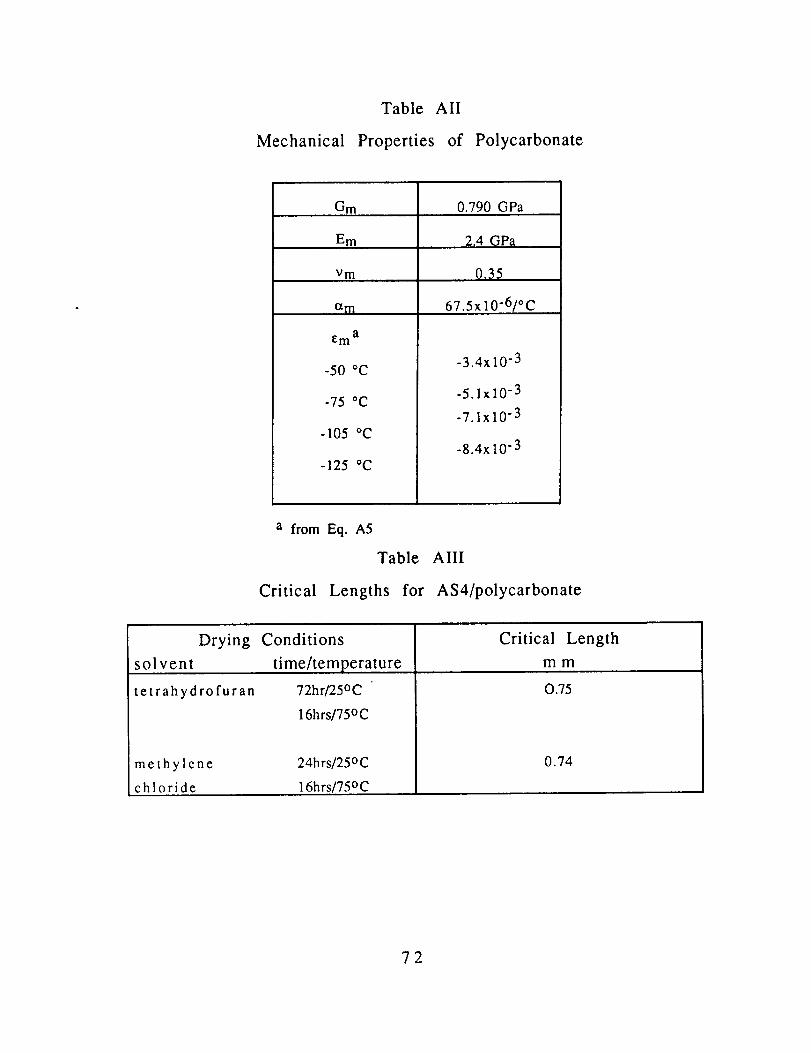
Table AII
Mechanical Properties of Polycarbonate
Gm
Em
Vm
etm
0.790 GPa
2,4 QPa
0._5
67.5x10"6/°C
_m a
-50 °C
-75 °C
-105 °C
-125 °C
-3.4x10 -3
-5.1x10⁻³
-7.1x10 "3
-8.4x10⁻³
a from Eq. A5
Table
Critical Lengths for
AIII
AS4/polycarbonate
Drying Conditions
solvent time/temperature
tetrahydrofuran 72hr/25oc
16hrs/75oc
m e t h y 1e n e 24hrs/25°C
c h 1o r i d e 16hrs/75°C
Critical Length
mm
O.75
0.74
72
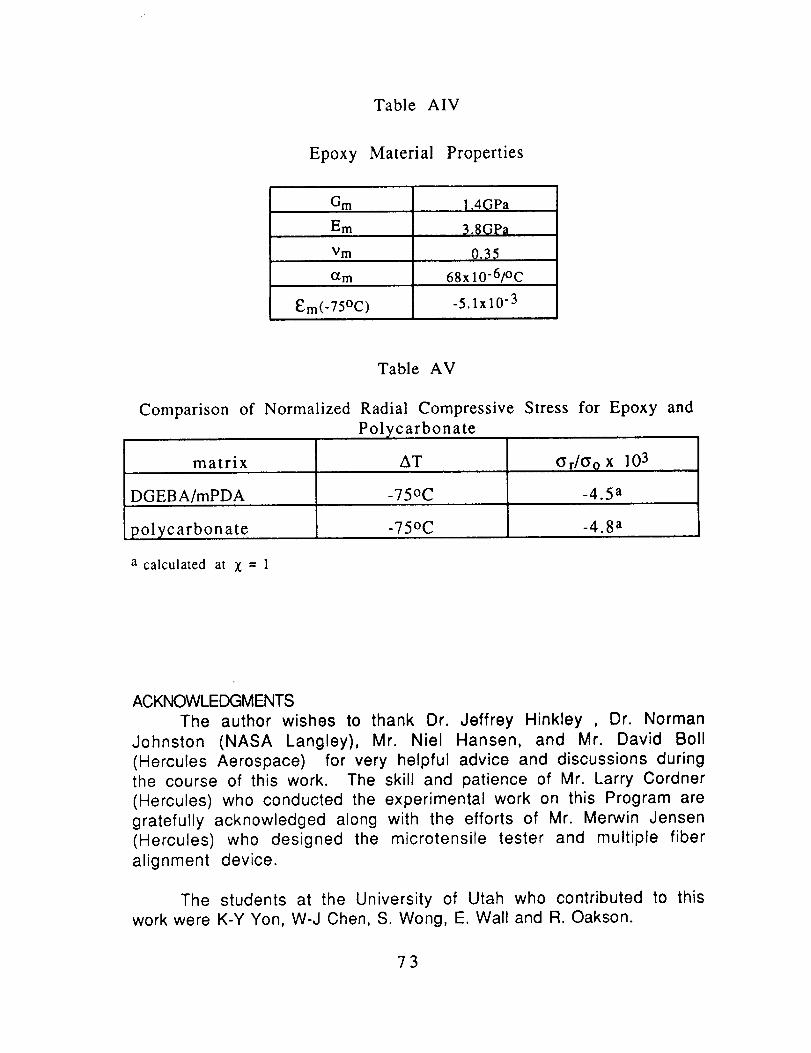
Table AIV
Epoxy Material Properties
G m
Em
Vm
O_ITI
Em (-75°C) -5.1 x 1O"3
1.4GPa
3.8GPa
0._5
68x 10"6/°C
Table AV
Comparison of Normalized Radial Compressive Stress for Epoxy and
Polycarbonate
matrix AT
DGEBA/mPDA -75°C
polycarbon ate -75°C -4.8 a
a calculated at _ = 1
ACKNOWLEDGMENTS
The author wishes to thank Dr. Jeffrey Hinkley , Dr. Norman
Johnston (NASA Langley), Mr. Niel Hansen, and Mr. David Boll
(Hercules Aerospace) for very helpful advice and discussions during
the course of this work. The skill and patience of Mr. Larry Cordner
(Hercules) who conducted the experimental work on this Program are
gratefully acknowledged along with the efforts of Mr. Merwin Jensen
(Hercules) who designed the microtensile tester and multiple fiber
alignment device.
The students at the University of Utah who contributed to this
work were K-Y Yon, W-J Chen, S. Wong, E. Wall and R. Oakson.
?3
REFERENCES
1. Leach, D.C.; Curtis, D. C.; and Tamblin, D. R.; "Delamination Behavior ofAromatic Polymer Composite, APC 2, "ASTM Symposium on ToughenedComposites, Houston, March 13-15, 1985
2. Bascom, W. D.; "Fractographic Analysis of Interlaminar Fracture," ASTMSymposium on Toughened Composites, Houston, March 13-15, 1985
3. Bascom, W.D.; Timmons, C.O.; and Jones, R. L.; "Apparent Interfacial Failure inMixed-Mode Adhesive Fracture," J. Mat. Sci., 10 1037 (1975)
4. Bascom, W. D.; Boll, D. J.; Fuller, B.; and Phillips, P. J.; "Fractography of theInterlaminar Fracture of Carbon-Fiber Epoxy Composites," J. Mat. Sci., 20 3184
(1985)
5. Piggott, M.R.; Sanadi, A.; Chua, P.S.; and Andison, D.; "MechanicalInteractions in the Interphasial Region of Fibre Reinforced Thermosets," inComposite Interfaces, H. Ishida and J.L.Koenig, Eds., North-Holland, New York,
1986, p.109
6. Hedgepeth, J. M., "Stress Concentrations in Filamenlary Structures," NASA TR D-882, Langley Research Center, 1961
7. Hedgepeth, J. M., and Van Dyke, P., "Local Stress Concentrations in ImperfectFilamentary Composite Materials", J. Comp. Mat., .1. 294 (1967)
8. Lockett, F. J., in Proc. of the Nat. Phys. Lab. Conf. on Properties of Fiber Composites,Sci. and Tech. Press, Guildford, UK, 1971, p. 75
9. Bascom, W. D., Quarterly Technical Progress Narrative, NASA Contract NAS1-18883, October 1990
10. Hinkley, J. A., Bascom,W. D., and AIIred,R. E., "lnterlaminar Fracture inCarbon/Fiber Thermoplastic Composites", Proc. of the 1989 Sym. on Tailored Interfacesin Composite Materials, Materials Research Soc., Boston, MA, 1990
11. Fraser, W. A.; Ancker, F. H.; and DiBenedetto, A. T.; "A Computer Modeled
Single Filament Technique for Measuring Coupling and Sizing Agent Effects inFiber Reinforced Composites," Proc. Conf. on Reinforced Plastics, Soc. Plastics
Ind., 1975, Section 22A, p.1
12. Fraser, W. A. ; Ancker, F. H.; DiBenedetto, A. T.; and Elbirli, B.; "Evaluation ofSurface Treatments for Fibers in Composite Materials," Polym. Comp., 4 238
(1983)
13. Drzal, L. T.; Rich, M.J.; and Lloyd, P.F.; "Adhesion of Graphite Fibers to EpoxyMatrices; I, The Role of Fiber Surface Treatment, "J. Adhesion, 16,1 (1983)
14. Drzal, L. T.; Rich, M.J.; Koenig, M. F. and Lloyd, P.F.; "Adhesion of GraphiteFibers to Epoxy Matrices; II, Effect of Fiber Finish," J. Adhesion, 16,133 (1983)
74
15. Bascom, W. D.; and Jensen, R. M.; "Stress Transfer in Single Fiber/ResinTensile Tests," J. Adhesion, 19 219 (1986)
16. Dibenedetto, A. T.; Nicolais, L.; Ambrosio, L.; and Groeger, J.; "Stress Transfer andFracture in Single Fiber/Epoxy Composites", in D..g.Et.EO..,,_.Jg._, H. Ishida and
J.L.Koenig, Eds., North-Holland, New York, 1986, p.109
17. Kelly, A.; _.EQ._, 2nd. Ed., 1973. p.172
18. Netravali, A. N., Henstenburg, R. B., Phoenix, S. L. and Schwartz, P., "InterracialShear Strength Studies Using the Single-Filament Composite Test I: Experiments onGraphite Fibers in Epoxy," Polymer Composites, 10 226 (1989)
19. Henslenburg, R. B. and Phoenix, S. L., "lnterfacial Shear Strength Studies Using theSingle-Filament Composite Test I1: A Probability Model and Monte Carlo Simulation,"Polymer Composites, 10 389 (1989)
20. Mira, M., Ohsawa, T. and Tahara, K., "Effects of Fiber Length on the Tensile Strengthof Epoxy/Glass Fiber and Polyester/Glass Fiber Composites," J. Appl. Polym. Sci. 25795 (1980)
21. Dilandro, L. DiBenedetto, A. T. and Groeger, J., "The Effect of Fiber-Matrix StressTransfer on the Strength of Fiber-Reinforced Composite Materials," PolymerComposites 9 209 (1988)
22. Bascom, W. D.; and Drzal, L.T.; "The Surface Properties of Carbon Fibers",Progress Report 6, NAS1-17918, 1985
23. Smith, L. M., Measurement of Cellular Adhesion on Glass and Polymer Substrat@s , MSThesis, University of Utah, 1973.
24. Gott, V. L. and Baier, R. E., Evaluation of Materials by Vena Cava Rings in Dogs,Government Document, Medical Device Application Program, PB-213-110, Report no.PH-43-68-84-3-2, John Hopkins University, Medical School of Medicine, 1972.
25. Mujin, S., Baorong, H., Yisheng, W., Ying, T., Weiqiu, H., and Youxian, Da.,Composites Science and Technology, 34 353 (1989)
26. Donnet, J. B., Dhami, T. L., Dong, S and Brendle, M., J. of Physics, D: AppliedPhysics, 20 269 (1987)
27. Wesson, S. P. and AIIred, R. E., Inverse Gas Chromatography, ACS SymposiumSeries 391, American Chemical Society, Washington, D.C. (1989), Chapter 15.
28. Su, J., Tao, X., Zhang, Z. , and Liu, L., Interfaces in Polymer. Ceramic. and MetalMatrix Composites, Ed., H. Ishida, Elsevier Science, New York ,1988,269
29. Whitney, J. M.; and Drzal, L.T.; "Three Dimensional Stress Distribution
Around an Isolated Fiber Fragment." ASTM Symposium on ToughenedComposites, Houston, March 13-15, 1985
75