Supreme industries initiating coverage
26
COMPANY RESEARCH REPORT INITIATING COVERAGE SUPREME INDUSTRIES LIMITED RECOMMENDATION: BUY CMP: Rs. 144 1st TARGET: Rs. 230 2nd TARGET: Rs. 244 HOLDING PERIOD: 1 – 2 Years RISK PROFILE: AGGRESSIVE 2010
description
Equity Research report by Hedge Equities Limited.
Transcript of Supreme industries initiating coverage

COMPANY RESEARCH REPORT October 28, 2010
COMPANY RESEARCH REPORT INITIATING COVERAGE
SUPREME INDUSTRIES LIMITED
RECOMMENDATION: BUY
CMP: Rs. 144
1st TARGET: Rs. 230
2nd TARGET: Rs. 244
HOLDING PERIOD: 1 – 2 Years
RISK PROFILE: AGGRESSIVE
2010

BUSINESS SUMMARY
Supreme Industries Limited (SIL) is one of the largest plastic processing companies in India, processing over two lakh metric tonnes of plastic per annum. The company’s core operations involve processing polymers and resins into plastic products which are quote diversified and spread over four broad product categories namely: - Piping products, Industrial products, Consumer products and Packaging products.
INVESTMENT RATIONALE/RISKS
SIL is involved in an industry that is extremely under-penetrated, fragmented and dominated by the unorganized sector and thereby offering tremendous scope for a large and organized player the potential to stake a claim and scale up their operations. The company has put in place a well thought out and rigorous strategy that is due to play out all the way until 2015.
SIL has a fantastic distribution network, diversified and vast product offerings, a superior brand image and is very well positioned across India (SIL possesses 19 manufacturing units that are spread out across the four key zones across India).
The next two years (most notably the current year) will see SIL generate revenue through its non-core construction business which is likely to be a crucial EPS booster.
Both the historical financials and the forecasted financials of SIL over the next two years paint a very healthy picture of the firm, be it earnings growth rates, ever-increasing margins, best-in-class ROE and ROCE, cash flow position, debt levels, strength of the balance sheet and dividend payouts.
Risks include the possible volatility in PVC resin prices (crucial component in the manufacture of piping products) and rising crude oil prices (the prices of polymers such as polyethylene, polypropylene are closely tied to crude oil prices. The other major risk is the valuation (exemplified by the trailing PE ratio) which is just a tad lower than the industry average. Institutional participation in the stock too is relatively lower and significant outperformance may depend on renewed institutional appetite.
(In crores) JUN-09 JUN-10 JUN-11E JUN-12E
SALES 1654.94 2007.02 2616.74 2928.77
PAT 94.34 142.08 259.50 335.46
EPS 7.42 11.18 20.42 26.40
PE 19.38 12.87 7.04 5.45
Source: Multiple Sources
0.0050.00100.00150.00200.00
0.005000.00
10000.0015000.0020000.0025000.00
29
-Dec
-09
29
-Ja
n-1
0
28
-Feb
-10
31
-Ma
r-1
0
30
-Ap
r-1
0
31
-Ma
y-1
0
30
-Ju
n-1
0
31
-Ju
l-1
0
31
-Au
g-1
0
30
-Sep
-10
31
-Oct
-10
30
-No
v-1
0
Sensex vs SIL
SENSEX SIL
50%
0%4%
46%
SIL's SHAREHOLDING PATTERN AS AT SEP 2010
PROMOTER DII FII OTHERS
Sector: Plastic EPS (TTM): Rs.13.01 PE (TTM): 11.17 Industry PE: 12.29 Mkt. Cap: 1829.19 52 Wk high: Rs. 169.90 52 Wk low: Rs. 71.00 P/BV: 4.84 Beta: 0.45 Yield (%): 2.50 Face Value: 2.00 Debt/Equity: 0.78 Institutional: 4.56 %
NSE Code: SUPREMEIND
BSE Code: 509930
ISIN Code: INE195A01028
Reuters Code: SUPI.BO
Bloomberg Code: SI IN
Website:
www.supreme.co.in

COMPANY RESEARCH REPORT December 30, 2010
Contents
BRIEF PROFILE .............................................................................................................................................................................. 2
COMPANY ADDRESS................................................................................................................................................................. 2
TOP MANAGEMENT ................................................................................................................................................................. 2
BUSINESS ...................................................................................................................................................................................... 3
SECTOR ......................................................................................................................................................................................... 7
OUTLOOK AND SCOPE .................................................................................................................................................................. 9
FINANCIALS AND VALUATIONS .................................................................................................................................................. 13
HISTORICAL FINANCIALS ........................................................................................................................................................ 13
FINANCIAL OUTLOOK ............................................................................................................................................................. 14
RISKS ........................................................................................................................................................................................... 16
INVESTMENT RATIONALE ........................................................................................................................................................... 17
FINANCIAL HIGHLIGHTS -CONSOLIDATED.................................................................................................................................. 20
FINANCIAL RATIOS -CONSOLIDATED .......................................................................................................................................... 21
FINANCIALS GRAPH AND PEER GROUP COMPARISON .............................................................................................................. 22
ANALYST NOTES AND COMPANY NEWS .................................................................................................................................... 23

COMPANY RESEARCH REPORT December 30, 2010
2
BRIEF PROFILE
Supreme Industries Limited (SIL) is one of the most
prominent plastic manufacturing companies in India,
having been set up in 1942, and having over 44 years
of experience under the current management. The
company is today one of the largest plastic processing
companies in India, processing over 2 lakh metric
tonnes of plastic per annum. The company’s core
operations involve processing polymers and resins
into plastic products, which are quite diversified and
spread over four broad product categories namely:-
Industrial Products, Consumer Products, Piping
Products and Packaging Products. SIL is credited with
pioneering various products in the industry which
include Cross- Laminated Films, HMHD Films,
Multilayer Films, SWR Piping Systems, PP Mats and
more. SIL has two subsidiaries. The company has a
29.88% stake in Supreme Petrochem Limited (SPL)
which is involved in the manufacture of polystyrene,
expanded polystyrene, extruded polystyrene boards
and compounds of polystyrene and polyolefins. SPL is
the largest exporter of polystyrene (PS) from India
exporting to over 80 countries across the globe. SIL
also enjoys a 100% stake in Supreme Industries
Overseas (FZE) which is located in the United Arab
Emirates (UAE). Another element of strength
associated with SIL is the fact that it is extremely well
spread out across the country. This subsidiary has
enabled SIL to have a product presence in 21
countries. The company has 19 manufacturing
locations across all the key zones of India (North,
South, West, East and Central India).
COMPANY ADDRESS
Supreme Industries Limited,
E-2, Ansa Industrial Estate,
Saki Vihar Road,
Saki Naka,
Andheri (E),
Mumbai- 400072
TOP MANAGEMENT
1. Chairman – B L Taparia
2. Managing Director – M P Taparia
3. Director – B V Bhargava
4. Director – H S Parikh
5. Director – N N Khandwala
6. Director – S R Taparia
7. Director – Y P Trivedi
8. Executive Director – S J Taparia
9. Executive Director – V K Taparia

COMPANY RESEARCH REPORT December 30, 2010
3
BUSINESS
Supreme Industries
Limited (SIL) is involved
in the business of
processing polymers and
resins into finished
plastic products which
are broadly spread across
four product categories
namely Industrial
Products, Piping
Products, Consumer
Products and Packaging
Products. Of the four
product segments, piping
products are the largest
contributor to the top-
line having contributed
around 43.5% in both
2009 and 2010. It is
followed by the Packaging Product segment, the
Industrial Product segment and the Consumer
Product segment that have contributed on average
24%, 20% and 12% to the top line in the last two
years. SIL also has a marginal exposure to the
construction sector, a story which is expected to play
out until December 2011.
Piping Products
SIL is considered to be the leader in the plastic piping
segment with its products being using in 19 different
applications. The company enjoys an 18% market
share in the organized domestic plastic piping
segment in India and in the broader piping segment
market in India valued at Rs.1000 crore, the
company was able to secure a 7.3% market share in
2009-10. In fact the popularity of SIL’s piping
products are not just limited to India alone and have
garnered a good response
in territories such as the
UK, Australia and New
Zealand. Some of the key
applications where the
company’s piping
products are used include
the field of irrigation,
water transportation,
industrial usage,
infrastructure
requirements, borewell
applications, the building
industry, sewerage
industry and rain water
harvesting. The key piping
product of Supreme
includes UPVC Pipes,
Injection Moulded
Fittings, Polypropylene
Copolymer Pipes and Fittings, HDPE Pipe Systems,
CPVC Pipe Systems, LLDPE Tube and Inspection
Chambers. SIL has introduced various pioneering
productas in this segment which include SWR
Drainage System, Acqu Gold High Pressure Plumbing
System, Indo- Green PP-R-hot and cold water
system, Eco-Drain structured wall hi-tech pipes and
Nu-drain underground drainage system. The
company recently introduced the sprinkler system in
several states (which is essentially devised using
polyethylene pipes) and this is one item that is
expected to be a key driver in the coming years as
the volume of polyethylene pipes had grown by
close to 100% volume on a y-o-y basis. Another
product that stands out in the piping product
segment of SIL is the company’s lead free “Aqua
Business Vertical Product Portfolio
Targeted Customer Segment
Plasic Piping System
uPVC Pipes, Injection Moulded fittings, Handmade fittings, Polypropylene Random, Co-polymer Pipes & Fittings, HDPE Pipe Systems, CPVC Pipes Systems, LLDPE Tube and Inspection Chambers
Portable Water Supply, Irrigation, Drainage & Sanitation Housing
Consumer Products Furniture and Mats
Retail Stores and Exports
Industrial Products
Industrial Component, Material Handling Products (Crates, Pallets and Dustbins)
Auto Sector, Electronic Appliances, Water Purification, Soft Drink Companies, Agriculture & Fisheries
Packaging Products
Specialty Films, Protective Packaging products, Cross Laminated Films
Electronics, Food Industry, Sports Goods, Insulation, Construction, Agriculture, Floriculture, Horticulture, Grain Storage Tarpaulin
COMPANY RESEARCH REPORT December 30, 2010
4
gold” plumbing system that carries cold water. This
product has been successful in replacing the GI pipes
(Galvanized Iron) in the housing industry as the cost
of production is 50% less and enjoys far superior
durability. The company is also a very prominent
manufacture of PVC pipes that are fast becoming the
preferred mode of piping over the traditional forms.
The advantages that PVC pipes has over the other
pipes include a greater life span without any loss of
strength, being lightweight and hence reduction in
transportation costs, as well as ease of installation.
Source: Company
Consumer Products
SIL’s consumer products include furniture and mats.
The company is considered to be the second largest
player in the plastic moulded furntiture with a
manufacturing capacity of 21700MT. Of the Rs.1100
crore valued market, SIL was able to garner a market
share of 13% in 2009-2010. The company’s vast
range of plastic furniture can be divided into eight
sub categories, namely Upholsters, Premium
monoblock chairs, monoblock chairs, Armless chairs,
Centre tables & trolley, Dining tables, Baby chairs
and Stools. Another distinct feature of SIL’s furniture
manufacturing expertise lies in the fact that it is
made using 100% virgin polymers, using computer
designed moulds at their various ISO certified plants.
SIL also enjoys the distinction of pioneering
lacquered and upholstered moulded plastic furniture
in India and also being the first to utilize high end
injection moulding technology in their
manufacturing process. The company’s strategy in
the future includes focusing on the lacquered
segment and premium furniture products. Recently
the company introduced a designer chair called
“DIVA” that has been very well accepted by the
market due to its inbuilt metal legs that provides
stability, gas moulded plastic seats that provides
strength and transparent back that provides
aesthetic beauty.
In order to sell its furniture items SIL has set up 209
exlusive franchise show rooms all across India and
will be ramping up their showroom strength to 300
units in the current year.
SIL’s mats segment hasn’t been doing particularly
well as a considerable proportion of the final
products are exported to countries abroad and that
segment was badly hit during the recession era. The
mats segment of SIL is still in a process of
convalescence. However the management is
confident of turning things around in this segment
and believes that the future bodes well for this
segment as most of the economies are beginning to
come out of the woods.
Industrial Products
Under this broad product segment SIL manufactures
industrial components and material handling
products. The estimated market size of the material
handling segment is Rs.560 crores and SIL enjoys an
18% market share. The company’s material
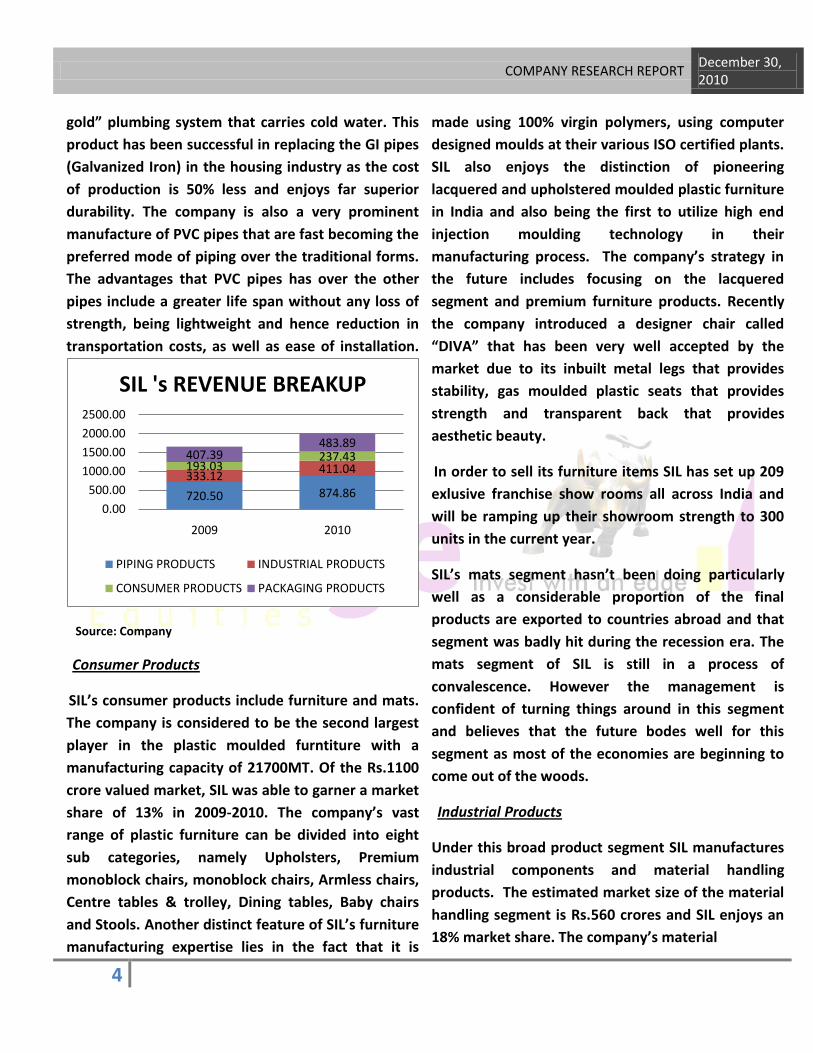
720.50 874.86
333.12411.04193.03237.43407.39483.89
0.00
500.00
1000.00
1500.00
2000.00
2500.00
2009 2010
SIL 's REVENUE BREAKUP
PIPING PRODUCTS INDUSTRIAL PRODUCTS
CONSUMER PRODUCTS PACKAGING PRODUCTS

COMPANY RESEARCH REPORT December 30, 2010
5
handling and storage product range is extremely
comprehensive, from small Bins to Super Jumbo
Crates, Injection
Moulded and Roto
Moulded Pallets,
Injection moulded and
Roto moulded Garbage
bins. The company’s
material handling
equipment are used in a
whole host of industries
ranging from the
electronic industry,
engineering industry,
automotive industry,
textile industry, fisheries,
fruits and vegetable
handling, soft drinks
handling, dairy products
handling and more. Of all
these industries, SIL’s
material handling
equipment are perhaps
most popular in the soft
drinks industry where
the company is
considered to be the
largest supplier of crate
equipment and related
matter in the country.
Recently SIL has been manufacturing value additive,
tailor made crates that are fast replacing the
conventional and standard crates. Another industry
in which SIL’s industrial products enjoy a degree of
popularity is the auto industry. The company
supplies various body parts for illustrious auto
makers such as Tata Motors and Maruti Suzuki. SIL
has been striving to become a tier 1 supplier in the
auto industry by associating itself with suppliers
right from the
conceptualization stage.
Body parts are also
provided for various
electrical appliance
manufacturers in the
country and Whirlpool is
one of SIL key clients.
Earlier in the year SIL was
able to secure a rather
prestigious project from
Tata Chemicals for the
manufacture of water
purifiers called Tata
Swach and the reasoning
for Tata selecting SIL was
due to the latter’s
admirable geographical
spread across India.
Packaging Products
SIL’s packaging
products are categorized
as Specialty Films,
Protective Packaging
Products and Cross
Laminated Films. The
products manufactured in
this division are most often
utilized for packaging purposes, construction
purposes and insulation purposes. As is the case in
the most of its other product segments, SIL has
introduced various path-breaking technologies in the
country such as Instant Polyurethane Foams,
Reticulated foam for air filtration, Sound absorbing
SIL’S MANUFACTURING UNITS
Sr. No. Unit Location Piping
Products Industrial products
Consumer Products
Packaging Products
1 Jalgaon
(Maharashtra) YES
2 Noida (Uttar
Pradesh) YES
3 Pune
(Maharashtra) YES
4 Halol
(Gujarat) YES
5 Malanpur (Madhya Pradesh)
YES
6 Raigad
(Maharashtra) YES
7 Hosur
(Karnataka) YES
8 Pondicherry
(Union Territory)
YES YES
9 Silvassa (Union
Territory) YES
10 Khushkhera (Rajasthan)
YES
11 Derabassi (Punjab)
YES YES
12 Durgapur
(West Bengal) YES YES
13 Kanpur (Uttar
Pradesh) YES
14 Guwahati (Assam)
YES
15 Jalgaon I
(Maharashtra) YES YES YES YES
16 Urse
(Maharashtra) YES
17 Jalgaon II
(Maharashtra) YES
18 Malanpur (Madhya Pradesh)
YES
19 Sriperumbdur (Tamil Nadu)
YES
Source: Company

COMPANY RESEARCH REPORT December 30, 2010
6
open cell foam, High temperature and File Resistant
Melamine Foam. SIL also has the distinction of being
the only Indian company to have the technology to
manufacture XF films under the brand name of
Silpaulin. Silpaulin is used in agricultural
applications, civil engineering applications,
packaging application, export marketing and general
application purposes.
In the previous fiscal the company’s collaborators
had developed the Cross Line Bonded Films which is
essentially a next generation XF film with superior
properties. SIL has been granted Indian patents uptil
2023 and also enjoys the exclusive right to produce
the same, in India & SAARC
Countries, as well as the right to
export the product to all the
countries in the world, except
Portugal, Spain and
Switzerland. In the last fiscal
there was another interesting
development for the packaging
product segment as the
company’s Khopoli
manufacturing unit was able to
procure the BRC (British Retail Consortium)
Certificate, thereby making in the First Multilayer
Packaging company in India to receive this
certification. An admirable facet of this product is
that since it is a flat product it is not freight
intensive. This first mover advantage will enable the
company to tap the European Marketand the
company has already been in touch with various
companies that have been scouting for materials
that have the BRC certification.
Construction Business
SIL has established a 11 storied state-of-the-art
commercial complex in Andheri, Mumbai called
Supreme Chambers. The complex was designed by
Sanjay Puri who is considered to be one of India’s
leading architects. SIL is now looking to sell 2,75,000
square feet of the project and in fact has already
been successful in selling about 40,000 square feet
and raising Rs.60.20 crore through that sale. The
management is now looking to sell the entire
complex except one floor and is looking to achieve
sale closure by December 2011, with a sales target of
Rs.375 crore. There has been no clarity on whether
this construction activity of
Supreme is just a one-off, or
something that the company will
continue to look at in the future
as well.
Research & Development
For a company that is involved in
the business of churning out
pioneering products on a
consistent basis, one would
expect SIL to have a strong R&D culture and the
company doesn’t disappoint on that front. The
company’s R&D centre is located in Mumbai and
undertakes CAD (Computer Aided Design), CAM
(Computer Aided Manufacture) and CAE (Computer
Aided Engineering) related projects, particularly for
engineering and fabricating intricate moulds and
dies. Before the product is sent out for commercial
manufacture, an evaluation of the product is done
by simulating the prospective performance of the
product. Product development teams at all Supreme
Divisions work in synergy with the Centre, to
effectively turn specific customer requirements into
SUPREME CHAMBERS- A LUCRATIVE AVENUE
FOR SIL
2,75,000 sq.feet to be sold for
Rs.375 crore.
Project cost- Rs. 155 crore.
40,000 sq.feet already been sold
for Rs.60.20 crore.
Sale to fructify by December
2011.

COMPANY RESEARCH REPORT December 30, 2010
7
precisely tailored products. In addition to the in-
house R&D Centre, SIL has also collaborated with
global partners in places such as Switzerland,
Belgium, Japan and Korea to develop a whole host of
products, most notably in its packaging products
segment.
SIL’S R&D COLLABORATIONS
COMPANY PRODUCT LINE
Rasmussen Polymer
Development,
Switzerland
Cross Laminated Films
Sapac Packaging
Solution, Belgium
Instant Packaging Solution
Foam Partner,
Switzerland
Reticulated PU Foam
Sanwa Kako, Japan 2 Stage Foam
PE Tech, Korea Cross Linked Foam
Source: Company
SECTOR
The origins of the Indian plastic industry extend all
the way back to 1957 which was the year which saw
the modest and promising beginning of the
production of Polystyrene, which is essentially a
polymer (Polymers are further processed and refined
to produce plastic). In the initial phases, the plastic
was manufactured using natural and synthetic
materials of different forms, attributes and
appearances. However with time, organic
compounds (materials containing carbon, hydrogen
and other elements) were preferred as ingredients
over natural and synthetic materials. Economic
liberalization from 1991 stimulated the Indian plastic
industry even further, as joint ventures, foreign
investments and easier access to technology from
developed countries began to unfold.
India plastic manufacturers today are proving to be
quite popular on
the global front.
While the
qualities of
finished goods
are quite
superior, what
actually swings it
in the Indian
plastic
manufacturers’
favour is the cost
of production.
Production costs
in India are
estimated to be
20-25% lower
than in the US.
Some of the
characteristics
that are utilized
to describe the
Indian plastic
industry today is
that it is highly
fragmented,
under penetrated
and possesses a
highly dominant
unorganized
sector. Per capita
consumption of
plastic and
polymers in India
leaves much to
be desired in comparison with the world levels. Even
INDIAN PLASTIC
SECTOR HIGHLIGHTS The Indian plastic industry
is characterized by
fragmentation, under-
penetration and the
domination of the
unorganized sector.
Indian plastic
manufacturers are noted
for their low cost expertise.
Plastic consumption in
India in terms of volume
grew by 16% last year.
However India’s plastic
consumption is just 1/5th of
the world average.
Polymer production is
expected to rise in the
current year thereby
allaying fears of raw
material shortage for
domestic players.
Going forward, government
initiatives such as the
Jawaharlal Nehru National
Urban Renewal Mission
and the Housing and Urban
Poverty Alleviation
programe are expected to
boost the fortunes of plastic
piping manufacturers in
India.

COMPANY RESEARCH REPORT December 30, 2010
8
though plastic consumption in India, in volume terms
grew by 16% (yoy) in the last fiscal, to reach 8 million
tonnes, the quantum of consumption in relative
terms is extremely low. To put things into
perspective, India’s consumption of plastic is just
1/5th of the world average. The per capita polymer
consumption stood at a lowly 5.66 kgs. In the US that
figure stood at 71.46 Kgs., while China and Brazil
posted figures of 30.74kgs and 22.71 kgs. However
there is tremendous scope for growth, as the current
consumption level of 8 million tonnes is expected to
double to 16 million tonnes by 2018 and reach 20
million tonnes by 2020.
The cost of raw materials too are not expected to be
a huge impediment in the near term as the
domestic supplies of polymer are expected to
increase and hence serve as a boon for the polymer
processors such as SIL. The expanded capacity of
the PP (Polypropylene) plant of Reliance Industries
Limited at Jamnagar began production earlier in the
year. Another major manufacture of polymers-
Haldia Chemicals too increased the capacities of its
PP (Polypropylene) and PE (Polyethylene) units in
West Bengal. If there is a risk however it is the rising
crude oil prices as it is a key ingredient in the
manufacture of polymers.
While the under-penetration of plastics in India is
quite evident there also exists a number of key
growth drivers that are likely to help bridge the
level of under-penetration in the country and
provide a fillip to the plastic manufacturers in India.
And these growth factors extend across all four of
SIL’s broad product segments. SIL ‘s piping product
segment is likely to see significant traction due to
the government’s thrust on irrigation facilities and
urban sanitation. Under the Jawaharlal Nehru
National
Urban
Renewal
Mission
(JNNURM),
the Central
Government
has given a
special focus
to improve
the
infrastructur
e of 91 cities
from 63
citiers and
towns as
announced
earlier in the country. Under this scheme the
government has budgeted Rs. 11619 crore in FY11
to improve drinking water supply and solid waste
management. In addition to that the government
has budgeted another Rs.1000 crore for Housing
and Urban Poverty Alleviation in FY11.This will
increase the market for plastic piping systems as
real estate developers go about their business. PVC
plastic pipes are fast turning out to the preferred
piping system across the world with China being
one of the biggest propagators of this product. PVC
pipes
Increasing urbanization, improving lifestyles in
semi-urban and rural segments and a pickup in
consumer sentiment in the export markets are
likely to aid the consumer product segments in the
near term. The industrial products division will be
looking to strong growth drivers in the auto
industry and the soft drink industry which are the
biggest users of SIL’s industrial products and
LESS-PUBLICIZED MERITS OF PLASTIC
Plastic has a strong utilitarian value in road construction activities saving 5-10% of bitumen costs per kilometer.
Contrary to the general perception, plastic can actually be recycled into non-critical items of daily use.
Usage of plastic over metals in automobiles reduces CO2 emissions by 50 mmt per year for the automobile sector globally.

COMPANY RESEARCH REPORT December 30, 2010
9
material handling equipment. The packaging
segment as well is bound to prosper due to
increased urbanization and a greater thrust on
packaged foods by the government. The increasing
sale of white goods is expected to be another
stimulant.
There is also great scope in the export market as
currently India only has a miniscule share of 1.5% of
the export volume of plastic. According to CRISIL
world trade in plastics is expected to be 140 MMT
by 2012 and there lies a
very lucrative opportunity
for Indian based plastic
manufacturers. The rating
agency goes on to stress
that however, India would
need to realign its trade
basket to focus more on
high value plastic products
rather the polymers as is
the case currently. India’s
trade basket is skewed
towards polymers with
polymers accounting for
68% and processed plastic
accounting for 32%.
According to CRISIL, in the future, plastic growth
will best be seen in Packaging usages(processed
foods, agricultural produce), plasticulture usages
(irrigation, mulch films, green houses) and
infrastructure usages (pipes, power and telecom
cables and geo-synthetics).
A well-publicized drawback of plastic products or
perhaps a big misconception is that it is not
environmentally friendly and this could perhaps be
one of the reasons why plastic consumption in India
is still below world levels. In fact contrary to
general perception plastic can be recycled into non-
critical items of daily use and waste plastic can also
be used to generate fuel. According to CRISIL,
plastic waste has tremendous utilitarian value in
road construction as it can be blended with Bitumen
to improve binding properties and increase savings
of 5-10% per kilometer in the cost of bitumen. Also
what most people aren’t aware of is the fact that
plastic has energy saving properties. Its energy
savings properties are best
exemplified in the auto and the
electrical appliances industries.
According to the Automotive
Research Association of India,
the replacement of metals by
plastics improves the mileage of
vehicles and reduces CO2
emissions by 50 mmt per year
for the automobile sector
globally.
OUTLOOK AND
SCOPE
SIL has done remarkably well up
until now, with its compelling
growth story. In a hypothetical sense most
companies that may have followed SIL’s growth
chart may be tempted to consolidate for a while
before embarking on further growth initiatives but
when one is involved in an extremely under
penetrated and fragmented market such as the
Indian plastics market that would represent an
opportunity lost. Keeping this is mind SIL has put in
place some very interesting targets that it hopes to
achieve by 2014-2015. It is already widely
acknowledged to be the leader in the Indian plastics
5 YEAR STRATEGY OF SIL
Reach the Rs.4500 landmark on the
topline.
Increase share of value added
products (Products with OPM>17%).
Diversify product portfolio.
Expand capacity to 595000MT by
2014-15.
Increase the number of manufacturing
units from 19 to 31.
Capital expenditure of Rs.1000 crore
over the next 5 years.

COMPANY RESEARCH REPORT December 30, 2010
10
segment and has such a vast spread in terms of
distribution network and strategically positioned
manufacturing units, but the management now
wants to take the company to the next level.
If the “Management Discussion and Analysis”
segment in an annual report is anything to go by,
then one can certainly expect a very eventful future
for SIL. Some of the targets that the management
has set until 2014-2015
include increasing the
number of manufacturing
units from the existing 19
units to 31 units, enhancing
the manufacturing capacity to
595000MT augmented by
Rs.1000 crores of capital
expenditure, diversifying
their product portfolio even
further by focusing on
technological innovation and
increasing the component of
value added products and
specialty products across all
its four product segments
(The value added products
are essentially high margin
products or OPM>17%, that contribute additional
value without adding to the cost. The company
wants to increase the contribution of value added
products of SIL to 30% by 2014 and 20% in the
current year. Last year the contribution of value
added products to total sales was 17.78%). As part
of the company’s initiative to develop and
introduce innovative products for new applications,
the company sees great scope in the micro
irrigation and composite segment and the
infrastructure and gas distribution segment where it
will be looking to develop electrofusion and
compression moulded fittings. The company also
wants to widen and deepen its distribution network
and increase the number of its channel partners.
The management feels that there are still several
towns where dealer net works have to be created
and over the next two years the target will be to
cover the unrepresented towns with growth
potential.
However while all those plans
are going to transpire in the
long-term, things are looking
fairly encouraging in the near-
term as well and the next two
years particularly the current
year, one could see a huge
surge in the company’s top line
and bottom line as it goes
about disposing blocks of its 12
storied commercial complex-
The Supreme Chambers. SIL is
looking to sell 275000 square
feet of the state-of-the art
property that is estimated to
fetch them revenues to the
tune of Rs.375 crores. The
management has stated their
desire to see the fructification of the entire sale of
the commercial complex bar one floor by December
2011. There are obviously certain question marks
over SIL’s corporate focus as it is not clear if the
construction business is something that the
company will be looking to continue with, in the
future, but it is certainly going to be earnings
accretive in the current year and that is something
shareholders or prospective shareholders of SIL
should welcome.
SIL’S LIST OF NEW MANUFACTURING UNITS TO BE SET UP BY 2015
Division No. of New Locations
Proposed Locations
Industrial Moulded Products
3 Ahmedabad,
Jamshedpur & Pondicherry
Plastic Piping System
1 West Bengal
Cross Laminated Film
1 Halol
Protective Packaging Products
4 Hosur,Gujarat, West Bangal &
Rajasthan
Furniture 3 Andhra,East Zone
& North Zone
Source: Company
COMPANY RESEARCH REPORT December 30, 2010
11
Interestingly enough SIL is also
looking to strengthen its strong
brand equity position and has
set up a training centre to train
people about the right method
of the installation of its wide
range of piping products. It has
also set up a Display Centre
showing various systems made
by the company. Both the
training and display centres
have started operations since
September 2010. The
management is quite
optimistic about this initiative
and is encouraging its channel
partners to bring their
dealers/sub-dealers and end
customers to visit the training
and display centre.
The company’s core activities of
converting polymers and resins
into finished plastic products
across four broad categories,
too looks fairly encouraging.
The management took the
decision of shutting down its
Nandesari unit which was not
contributing to the business
growth due to pollution issues
and other factors. Since then
the company has reconditioned
and shifted all the major
equipment to other plans and
those equipments are now
running to their original design
capacity. The company was also
able to secure crucial cash flow
from the sale of the land and
building as well.
In the last fiscal the company’s
material handling equipment
division (crates) was adversely
affected by the disappointing
monsoon conditions as retail
chains tend to use the
company’s material handling
equipment for the
transportation of crops such as
Tomatoes and Grapes during
post harvest transportation (SIL
is the preferred supplier of
crates in this segment). In the
current year due to the
spectacular monsoon, this
segment is likely to post better
results. SIL has also developed
several new moulds to cater to
its ever increasing applications
and the supplies of these
products have just started.
With regard to its consumer
product segment, the company
is continuing to ramp up the
production of its value added
products and recently launched
its Designer Chair “DIVA” which
is already proving to be quite
popular. The company currently
has 209 exclusive showrooms
that showcase SIL’s superior
range of furniture and intends to
increase the number of
TWO YEAR OUTLOOK OF SIL
Sale of SIL’s Supreme Chambers to
fructify by December 2011.
Strengthening of brand equity,
particularly through the new
training and display centres that
were set up in September 2010.
Retail marketing initiatives will be
stepped up on a pan India basis.
Demand for SIL’s food handling
crates (particularly Tomatoes and
Grapes) to increase in the current
fiscal.
The number of consumer product
showrooms to be increased from
209 to 300 in the current year.
Besides the West Zone consume
product market to flourish due to
logistical advantages provided by
the Gadgeaon plant that
commenced manufacture of
furniture in September 2010.
The furniture manufacturing
capacities of SIL’s Durgapur,
Pondicherry and Guwahati plants to
be enhanced.
Production generating capacity of
the Kanpur plant to be increased
from 8000 tonnes p.a. to 15000
tonnes p.a.
Demand for SIL’s piping products to
get stimulated from the
replacement market.

COMPANY RESEARCH REPORT December 30, 2010
12
showrooms to 300 by the end of the year. To
augment the increase in showrooms the company
will also be increasing the furniture manufacturing
capacity of its Durgapur, Pondicherry and Guwahati
plants. Besides, in September 2010, the company
started the manufacture of furniture from its
Gadegaon plant in order to cater to the West Zone
market. Previously it was catering to this market
from its Pondicherry unit and this was nurturing
logistical disadvantages for the company. Andhra
Pradesh is another territory where the company is
looking to set up a furniture manufacturing plant in
order to nullify the logistics cost disadvantage and it
has also initiated actions to acquire land in the state
as well as look for channel partners in this region.
The mats’ sales of the company as well are expected
to pick up as most of the economies across the
world, are slowly coming out of the woods and
exports account for a bulk of the mats’ sales of SIL.
As far as its piping products division is concerned the
company is looking to enhance the production
generating capacity of its Kanpur plant from 8000
tonnes p.a to 15000 tonnes p.a. To facilitate the
expansion, the company had acquired a further 7
acres of adjoining land. At its Piping manufacture
plant at Gadegaon the company had not only
completed the expansion of its UPVC and CPVC
production lines but had also increased the level of
automation in the production capacity. In the last
fiscal due to severe drought conditions a lot of state
governments had enforced a ban on the digging of
new borewells and this had affected the business of
this division. Due to the fantastic monsoon in the
current year, the situation is expected to be
reversed. This has thrown up a number of benefits
for the firm such as increase in output, reduction in
man power requirements, improvement in the
environment of the mixing division and consistency
in quality. PVC resin is one of the crucial components
used for making SIL’s pipes and the prices of that
material are something that could affect margins of
this division. The company will also be launching
sprinkler systems in several states for the first time
and that should contribute decently to SIL’s
financials. The management also sees significant
scope in the replacement market as more and more
buildings are undergoing renovation. To meet the
additional requirement of this market the
management has stated that they will be focusing on
retail marketing on a PAN India basis.
There have also been recent reports suggesting that
SIL is in the process of manufacturing plastic gas
cylinders which, if true, could prove to be a path
breaking product. It would also give the company a
first mover advantage. However the management
has stated that one of their thrust areas in the future
will be electro fusion and compression moulded
fittings for infrastructure and gas distribution.
While the management is going to be investing
around Rs.180-270 crores of capex in the current
year, most of it is going to be devoted to the
Industrial products division, Consumer products
division and Piping products division. The
management will not be devoting much to the
performance packaging films segment and the cross
laminated film segment as committed capacities in
these two segments still have to go into production
due to low capacity utilization and a shortage of
labour.

COMPANY RESEARCH REPORT December 30, 2010
13
FINANCIALS AND VALUATIONS
HISTORICAL FINANCIALS
The historical financials of the company provide a
relevant picture of the degree of prosperity that SIL has
enjoyed up until now. Before dissecting the financials, it
must be noted that SIL’s annual results are published
every June (SIL follows a July-June time period for
accounting).
From June 2007 - June 2010, SIL‘s revenue has grown
from Rs. 1116.22 crore to Rs. 2007 crores, growing at a
CAGR of 19.7%. Taking into consideration a two year
average, the plastic piping product segment has been
the biggest contributor to SIL’s annual revenue
contributing around 44 % to the topline, the next big
contributor is the packaging product segment
contributing around 24 % to the top line. The industrial
products segment and the consumer products segment
contribute around 20% and 12% respectively to the
overall top line.
The operating profit for the same time period has grown
from Rs. 121 crores to Rs. 289 crores, growing at a rather
impressive CAGR of 33%. Operating margins (OPM) have
climbed up the ladder quite impressively. OPM which
stood at 10.4% moved up year on year to end at 14.79%
at the end of June 2010.
SIL’s debt levels have always hovered around a
manageable level and consequently interest payments
haven’t been a major impediment in transferring the
buoyancy at the operating level down the bottom line.
The debt equity ratio which stood at 1.03 at the end of
June 2007 rose up marginally for the next two years to
reach 1.13 before petering down to 0.78 at the end of
June 2010. Consequently interest as a % of sales has
been quite negligent. Interest as a % of sales was 2.9% at
the end of June 2007 and even though it rose to 3.3% the
double impact of expanding top line growth and
decrease in interest payment sent that figure to a lowly
1.7% at the end of June 2010.
Depreciation too has been another item that hasn’t
caused a lot of strain on the profits. Depreciation as a %
of Net sales which stood at 3.4% at the end of June 2007
dropped to 2.63% at the end of June 2010. All in all the
profits of the
company have
grown at a
notable CAGR of
44% from Rs. 47
crores at the end
of June 2007 to
Rs.142 crores at
the end of June
2010. PAT
margins as well
have moved up
in the last three
years (there was
a decline in 2008
however on a
yoy basis due to
increase in the
interest
component. The
company had
increased its
secured loan
component
significantly by
Rs.72 crore in
that year) from
4% at the end of
June 2007 to 7%
at the end of
June 2010.
SIL also has a decent set of cash levels. It has been able
to maintain a strong set of cash at both the operating
levels and net levels in every year. At the end of June
2010, SIL has generated cash worth Rs.146 crores from its
operating activities and Rs.19 crores of net cash.
HISTORICAL FINANCIALS
3 year historical sales has grown at a CAGR of 19.7% from Rs.1116.22 crore to Rs.2007 crores.
Piping products are the biggest contributor to the topline contributing around 44%, followed by packaging products, industrial products and consumer products that contributed 24%, 20% and 12% respectively.
Debt equity ratio has ranged from 1.03 to 0.78 in the last three years.
3 year operating profits have grown at a CAGR of 33% from Rs.121 crore to Rs.289 crore.
3 year net profits have grown ata CAGR of 44% from Rs.47 crores to Rs.142 crores.
Operating profit margins in the last three years have increased from 10.4% to 14.7%.
Net profit margins in the last three years have increased from 4% to 7%.
Last year’s ROE and ROCE were 39.8% and 38.7% respectively.

COMPANY RESEARCH REPORT December 30, 2010
14
FINANCIAL OUTLOOK
SIL’s management has put in place a set of targets
which it hopes to achieve by 2014-2015 and has
given a decent guidance on some of the initiatives it
will be taking up until then. The management has set
a target of achieving Rs.4500 crore on the top line by
2014-2015 which would represent a CAGR of around
17%+. This top line growth will be augmented by
increasing the number of manufacturing units from
the current 19 to 31 by the end of 2014-2015 and a
grand capital expenditure plan of Rs.1000 crores (an
average of
around Rs.200
crore per year).
What’s also
quite
impressive is
that the
management is
looking to
generate this
figure through
superior sales
and internal
accruals rather
than debt. SIL
has also set
dual objectives
of seeking
greater top line
growth and
increasing the
component of
value added
products or
specialty
products as a %
of total products. Value added products are products
that have an OPM >17%.
However since we are only forecasting for a two year
time horizon we have only considered information
that is relevant within that stipulated time frame for
arriving at our share price targets. All things
considered the next two years look very encouraging
for SIL both from a top line and bottom line
perspective. In addition to the management’s
initiatives to spur top line growth, there also exists
some strong tailwinds (macro-economic, industry-
oriented and government oriented factors) that are
likely to stimulate SIL’s fortunes.
Despite putting up a decent set of financials in the
last fiscal, the sales of some of SIL’s key products
came under pressure due to the drought like
scenario. However this year’s superior monsoons are
likely to rectify that scenario. Of particular relevance
was SIL’s piping product segment, where the
government had to ban borewell digging due to the
drought situation. Besides PVC pipes are fast
becoming poular around the world, with China
placing special emphasis on PVC pipes over the
traditional pipes. This year will also see SIL introduce
the sprinkler system for the first time in various
states. In addition to the likely buoyancy in the
piping segment, the industrial product division
(material handling equipemt) too is likely to benefit
this year after having faced some difficulties in the
last year. SIL’s crates are used by retail chains for the
transportation of crops such as Tomatoes and
Grapes during the post harvest season and last year
there was some pressure seen due to the poor
monsoon. The thrust of the government in various
issues tied directly or indirectly to the plastic
industry, too, are likely to boost top line growth.
2 YEAR FINANCIAL OUTLOOK
Top line to grow by 30% in the first year and 12% in the second year.
The contribution of value added products (products with OPM>17%) to total sales to increase from 17.78% to 20% in the current year.
Operating profits to grow at a 2 year CAGR of 37%.
OPMs to increase from 14.3% to 16.6% and 18.6% for the next two years.
Rs.180 crore to Rs.270 crore of CAPEX to be spent in the current year.
Interest as a % of net sales to be brought down to less than 1%. It was 1.7% in the previous year.
Depreciation to grow at a 2 year CAGR of 20% as rapid plant expansion comes into play.
Net profits to grow at a 2 year CAGR of 54% and NPMs to reach 10% and 11.4% over the next two years.

COMPANY RESEARCH REPORT December 30, 2010
15
Under the FY11 Union Budget, the government has
allocated Rs.11619 crore for the Jawaharlal Nehru
National Urban Renewal Mission (JNNURM), to
improve the infrastructure of 91 cities and improve
the drinking water supply and solid waste
management. Besides the government has also
allocated a further Rs.1000 crore under the Housing
and Urban Poverty Alleviation in FY11 which will lift
real estate development and demand for piping
products. SIL is also resorting to significant brand
building exercises and strengthening its presence in
untapped towns and the unorganized sector of India.
However perhaps the most attractive features of SIL
over the near term is going to be the revenue they
will secure through their construction business. The
company in collaboration with one of India’s leading
architects (Sanjay Puri) has completed the
construction of Supreme Chambers, a 2, 75,000
square feet commercial complex for which the
company has already sold 40,000 square feet, raising
Rs.60.20 crore ( but only Rs.36 crore accounted for in
the previous quarter which means the remaining
Rs.24 crore will be accounted for in the December
quaryer. The management has stated their desire to
fructify the entire sale by the end of December 2011
and is looking to accrue a total of Rs.375 crore
(inclusive of the Rs.60.20 crore). The cost of the
project is estimated to be Rs.155 crore so taking a
net figure of Rs.220 crore and providing for the sum
already received, one is expecting at least Rs.184
crore to be collected at an average of around Rs.37
per quarter for the next five quarters.
Keeping all these factors in mind and including the
construction income, we are forecasting the sales of
SIL to grow by 30% from the June 2010 figure of
Rs.2007 crore to Rs. 2470 crores and grow by a lower
12% (high base effect, marginal income from
construction business).
As previously mentioned the SIL management has
already stressed their desire to gradually increase
the contributions of value added products or
specialty products across all its product segments
and this is likely to throw up much superior
operating margins. The contribution of value added
products to total sales was 17.78% at the end of June
2010 and SIL intends to increase that figure to 20% in
the current year and 30% by 2014. The management
is also looking to maintain cost competitiveness
through continuously enhancing operational
efficiencies, leveraging on economies of scale and
effective working capital management. Assuming a
degree of stability in commodity prices, the rationale
of high value added products and superior top line
growth operating profits for the next two years are
expected to grow at a CAGR of 37% while operating
margins are expected to rise from 14.3% to the
16.6% in June 2011 and 18.6% in June 2012 (SIL’s
management wants to maintin OPMs of >15% till
2015 at least).
From different sources of data it is determined that
SIL will be spending anything between Rs.180 crores
to Rs.270 crores in the current fiscal and perhaps the
most impressive facet of that figure is that the
management is looking to procure that sum mainly
through sales revenue and internal accruals which
means it is all but certain that the debt component
or interest component isn’t likely to go down. In fact
the management has stated that they will be looking
to bring down the interest as a % of net sales figure
to less than 1 in the current year. Interest as a % of
net sales stood at 1.7% at the end of June 2010. SIL
will also be increasing the number of manufacturing

COMPANY RESEARCH REPORT December 30, 2010
16
units from 19 to 31 in the next 5 years and the
depreciation component is most certain to go up.
Even though it is not likely to increase in terms of
sales (due to the greater sales effect), depreciation in
isolation, is likely to go up in absolute terms. This
non cash expense which grew at a miserly 6.3% from
FY06-FY10 is expected to grow by a far superior 20%
over the next two years.
Bringing all these factors into the equation, we are
forecasting the net profits to grow at a 2 year CAGR
of 53.6% with an June 2011 EPS of 20.4 and a June
2012 EPS of 26.4. At a CMP of Rs.148, the stock is
trading at 7.3 times its June 2011 EPS and 5.7 times
its June 2012 EPS.
RISKS
PVC resin prices are a crucial component in the
manufacture of SIL’s PVC pipes, and in the last fiscal
these prices were fairly stable with less volatility. In
fact last year there was a supply shortage in the
domestic shores, and about 0.6 million tonnes had
to be imported to make up for the demand. No
major large capacity additions of PVC resins are
expected in the world markets and there is a
likelihood that SIL will continue to depend on these
huge imports that could see significant price rises if
demand moves up. Crude Oil is another commodity
that plays a key role in SIL’s manufacturing process
(the prices of PVC resin, polyethylene and
polypropylene are linked to crude oil prices) and if
crude oil prices continue their northward journey
that could as well hurt SIL’s cost of production.
The valuations of the SIL stock when viewed from a
price to earnings multiple are quite close to the
industry average of around 12, and may not wholly
appeal to the consummate value investor, but we
feel that SIL’s spectacular bottomline growth over
the last three years (35%) and the prospect of an
even better bottom line growth metric (53%) over
the next two years more than justifies entry at this
point. Besides, in comparison to the valuation of
India’s benchmark index, a PE multiple of 11.3
doesn’t appear too daunting, particularly while
considering the fact that the company is one of the
biggest players or perhaps the biggest player in an
extremely under penetrated, all pervasive and
growth oriented industry such as the plastic
industry.
Pedantic business theorists, who attach
considerable attention to corporate focus, may not
be particularly buoyed by SIL’s significant, one-off
(unconfirmed) construction venture, despite it
being earnings accretive in the near term.
RISKS
PVC resin prices were fairly stable last year. However
in the current fiscal, no major capacity additions are
forecasted in the world market and this might result
in price rise if demand goes up in the current year.
Rising crude oil prices are another concern as it
shares a very close correlation to plastic oriented
polymers.
The trailing PE multiple of the SIL stock is very close
to the average industry PE and value investors may
question the prospect of outperformance at these
levels.
SIL’s one-off construction business may not wholly
appeal to pedantic or traditional business theorists.

COMPANY RESEARCH REPORT December 30, 2010
17
INVESTMENT RATIONALE
The SIL stock has pretty much all the ingredients
that make for a fundamentally robust stock. SIL is
involved in the business of manufacturing a product
that is ubiquitous and has tremendous utilitarian
value in a whole host of applications. In fact, if one
were to just pause and look around one’s
surroundings, it would be hard to disregard the
prevalence of plastic in one’s life. Being such an
omnipresent product one would expect the plastic
market to be dominated by a whole host of players
with little scope for growth but that is not the case
in the Indian plastic market. Firstly compared to the
global rates, consumption of plastic in India leaves
much to be desired. The country’s consumption of
plastic is just one-fifth of the global consumption
average. Under penetration, fragmentation,
domination by the unorganized sector and very few
publicly listed players all suggest that the Indian
plastic market is crying out for a strong plastic
manufacturer to grab it by the scruff of the neck
and stake a claim. The Indian plastic market is a
fantastic market to build a strong market share and
scale up, and SIL with its impressive branding
initiatives, geographical diversification and spread
in both its manufacturing and distribution network
and superior resources, diversification in the
product portfolio and leadership (SIL’S leadership
theory is far from irrefragable as Sintex Industries, a
listed peer, posted marginally better sales in the
previous year on a standalone basis and has a far
superior market capitalization to SIL. However
“leadership” is not an absolute term in the Indian
plastic industry as it is such a wide industry with
innumerable products and dominated by the
unorganized sector). There exists a wonderful
opportunity for SIL to stake a claim and dominate
the plastic industry and the management has set in
place a whole host of initiatives in order to
capitalize, all the way uptil 2015 atleast.
SIL is hoping to reach the Rs.4500 crore sales figure
landmark by 2015 and that is to be augmented by
increasing the number of manufacturing units from
19 to 31 for the same time period. Product wise as
well, they have a nice diversified mix across four
broad segments, and the company’s R&D unit (and
in some cases), in collaboration with global
technology majors (Schoeller Wavin Systems
International Services Germany, Rasmussen
Polymer Development AG Switzerland is constantly
looking to add more innovative and value added
products across its entire product basket. The
company is also looking to strengthen its dealer
network, its channel partners and try and capture
various untapped towns and regions that have good
growth potential. With regard to its consumer
product segment which it displays through 209
showrooms, SIL has set a target of increasing the
number of showrooms to 300 by the end of this
year.
A number of government policies such as the
JNNURM and the Housing and Urban Poverty
Alleviation programme coupled with strong
industry and other macroeconomic tailwinds
(monsoon, better harvest season, pickup in global
economies that will benefit SIL’s consumer
products, strong prospects in various plastic
dependent economies such as infrastructure,
irrigation oriented, real estate, soft drinks, autos,
electrical appliances) too are quite conducive for
SIL’s fortunes, atleast over the next two years.

COMPANY RESEARCH REPORT December 30, 2010
18
Another impressive facet of
SIL’s strategy is to increase the
component of value added
products in terms of total sales
which will lead to better
margins for the company. In
fact the management of SIL
has set a strong base target of
maintaining a 15% OPM
(Operating Profit Margin) for
the next five years and that
certainly gives out an air of
reassurance. Overall its
historical financials have been
very good and over the next
two years as well, that trend is
expected to continue. Solid
growth rates, ever-increasing
margins, best-in-class ROE and
ROCE, moderate or low levels
of debt and strong cash flows
are some of the strong points
of SIL.
Traditionally SIL has been
extremely generous with
rewarding its shareholders
with divided largesse. The
dividend payout ratios have
hovered between 29-41% for
the last four years. In the
previous year, the dividend
payout ratio stood at 29.32%.
However the big positive
kicker for SIL over the next
two years, particularly in the
current year is the fact that it
is going to be generating a
construction income over the
next two years. While the
debate over corporate focus
may be stimulated, we see this
avenue being a one-off, shot in
the arm for the company’ two
year EPS.
While fundamentally, SIL has
ticked pretty much all the boxes,
the current valuation of the
stock may worry some of the
core value investors as the stock
is currently trading at 11.3 times
its trailing earnings in
comparison to the industry
average of 12 and this would
perhaps suggest limited upside
at current levels. We would
however like to argue that SIL’s
strong earnings growth more
than justifies a PE of 11.3.
Historically earnings have grown
at a four year CAGR of 35% and
thus employing a PEG ratio one
gets a figure of 0.32 which is
extremely encouraging. If one
were to consider future eps
growth rates the PEG drops even
further to 0.21.
Investors may note that our
share price targets are quite
steep from current levels and
our justification for the same, in
addition to the strong
investment rationale thesis, is
INVESTMENT RATIONALE
SIL is functioning in an industry that is
under-penetrated, fragmented and
lacks leadership in the real sense of the
word. SIL has all the ingredients to
become a dominant force in this
industry in years to come.
Macro-economic factors, government
policies and industry opportunities are
all very conducive for SIL to flourish.
SIL has put in place a very lucid and
impressive growth strategy up until
2015.
Key facets of the strategy include
expanding manufacturing units,
showrooms and distribution network,
funding a bulk of the expansion plans
through internal accruals and sales
rather than debt, increasing the
prevalence of value added products in
the product structure, diversifying the
product basket even more, maintaining
a base level for OPMs and achieving
Rs.4500 crore on the top line.
SIL’s construction income is expected
to be a pivotal EPS booster for the next
two years.
Dividend payout ratios of SIL have
varied between 29-41% for the last four
years.
Best-in-class ROE and ROCE (close to
40%).
Current trailing PE valuations may
suggest that it is not an ideal entry
point, particularly for value investors,
but a trailing PEG ratio of 0.32 and a
forward PEG ratio of 0.21 provides
ideal support for an entry into the SIL
stock.

COMPANY RESEARCH REPORT December 30, 2010
19
that our share price targets are based on annual eps
targets. Considering that SIL’s annual results will
only be announced at the end of June of every year
as opposed to the popular and standard trend of
announcing annual results at the end of every
March, expectations have been built in for a longer
period (nine months as opposed to other companies
which have only about six months left to run,
before annual results are announced).
Investors with a one-two year time horizon and
those with an aggressive risk appetite (because of
the high valuation feature) are advised to consider
investing in the SIL stock at current levels with a 1-2
year time horizon with share price targets of Rs.230
and Rs.244.

COMPANY RESEARCH REPORT December 30, 2010
20
FINANCIAL HIGHLIGHTS -CONSOLIDATED
Description Jun-10 Jun-09 Jun-08 Jun-07 Jun-06
Inc / Exp Performance
Gross Sales 2007.02 1654.94 1310.40 1162.22 1130.67
Total Income 2023.20 1662.34 1317.80 1175.05 987.46
Total Expenditure 1718.41 1417.12 1166.61 1040.86 885.02
PBIDT 304.79 245.22 151.20 134.19 102.44
PBIT 251.85 198.91 111.71 104.37 78.03
PBT 216.98 143.08 71.37 70.62 50.34
PAT 142.09 94.34 48.22 47.28 39.97
Cash Profit 195.03 146.88 87.75 87.53 81.31
Sources of Funds
Equity Paid Up 25.41 25.41 27.62 27.62 13.81
Reserves and Surplus 388.67 278.72 242.85 215.92 202.41
Net Worth 412.65 301.36 267.53 240.52 213.13
Total Debt 229.06 324.98 317.60 228.32 237.49
Capital Employed 641.71 626.34 585.12 468.84 450.61
Application of Funds
Gross Block 968.88 903.55 827.87 694.73 670.61
Investments 69.29 49.60 53.59 51.12 49.56
Cash and Bank balance 18.67 10.74 46.02 14.39 7.77
Net Current Assets 65.06 87.22 29.32 13.96 87.72
Total Current Liabilities 473.12 432.66 399.79 291.43 172.54
Total Assets 643.13 629.10 588.07 471.86 453.71
Cash Flow
Cash Flow from Operations 145.66 188.55 105.94 159.21 92.70
Cash Flow from Investing activities -67.52 -140.42 -136.13 -119.80 -77.21
Cash Flow from Finance activities -70.21 -66.12 44.53 -32.79 -15.23
Free Cash flow 166.60 -37.47 -80.88 -142.92 -46.23
Market Cues
Close Price (Unit Curr.) 112.78 50.59 35.00 46.63 31.61
High Price (Unit Curr.) 117.98 51.50 84.00 49.04 48.25
Low Price (Unit Curr.) 46.00 18.51 34.40 26.30 24.31
Market Capitalization 1432.61 642.63 483.38 644.00 436.49
EPS 12.28 7.15 3.89 3.73 3.40
Price / Book Value(x) 0.69 0.43 0.36 0.54 0.20
Equity Dividend % 180.00 120.00 80.00 75.00 100.00
Enterprise Value 1643.00 956.87 754.96 857.92 666.20
Dividend Yield % 3.19 4.74 4.57 3.22 3.16 Source: Ace Equity

COMPANY RESEARCH REPORT December 30, 2010
21
FINANCIAL RATIOS -CONSOLIDATED
Description Jun-10 Jun-09 Jun-08 Jun-07 Jun-06
Operational & Financial Ratios
Adjusted EPS (Rs.) 12.28 7.15 3.89 3.73 3.4
CEPS(Rs) 76.77 57.82 31.77 31.69 58.87
DPS(Rs) 18 12 8 7.5 10
Adj DPS(Rs) 3.6 2.4 1.6 1.5 2
Book Value (Rs) 162.43 118.62 96.85 87.08 154.32
Adjusted Book Value (Rs) 32.49 23.72 19.37 17.42 15.43
Tax Rate(%) 34.52 34.06 32.44 33.05 20.6
Dividend Pay Out Ratio(%) 29.32 33.56 41.1 40.21 29.44
Margin Ratios
PBIDTM (%) 15.19 14.82 11.54 11.55 9.06
EBITM (%) 12.55 12.02 8.52 8.98 6.9
Pre Tax Margin(%) 10.81 8.65 5.45 6.08 4.45
PATM (%) 7.08 5.7 3.68 4.07 3.53
CPM(%) 9.72 8.88 6.7 7.53 7.19
Performance Ratios
ROA (%) 22.34 15.5 9.1 10.22 8.81
ROE (%) 39.8 33.17 18.98 20.84 18.75
ROCE (%) 39.72 32.84 21.2 22.7 17.32
Asset Turnover(x) 3.16 2.72 2.47 2.51 2.49
Inventory Turnover(x) 7.49 8.23 9.82 11.15 11.51
Debtors Turnover(x) 16.3 13.11 9.98 9.8 10.11
Sales/Fixed Asset(x) 2.14 1.91 1.72 1.7 1.69
Working Capital/Sales(x) 30.85 18.97 44.69 83.26 12.89
Efficiency Ratios
Fixed Capital/Sales(x) 0.47 0.52 0.58 0.59 0.59
Receivable days 22.4 27.85 36.59 37.26 36.1
Inventory Days 48.75 44.35 37.17 32.74 31.72
Payable days 23.31 22.65 25.45 30.84 39.05
Financial Stability Ratios
Total Debt/Equity(x) 0.78 1.13 1.07 1.03 1.11
Current Ratio(x) 1.31 1.38 1.13 1.12 1.72
Quick Ratio(x) 0.6 0.73 0.72 0.71 1.07
Interest Cover(x) 7.22 3.56 2.77 3.09 2.82
Total Debt/Mcap(x) 0.8 2.53 3.29 1.77 5.44 Source: Ace Equity

COMPANY RESEARCH REPORT December 30, 2010
22
FINANCIALS GRAPH AND PEER GROUP COMPARISON
Peer Group Comparison (Consolidated) (INR in CRORE)
Company Name Year End
Net Sales PBIDT PAT EPS PBIDTM% PATM% ROCE% ROE%
Hitech Plast 201003 261.92 41.62 15.73 11.34 15.89 6.01 23.09 25.84
Supreme Ind. 201006 2007.02 304.79 142.09 12.28 15.19 7.08 39.72 39.8
Kemrock Industries
201006 716.7 164.03 55.73 33.01 22.22 7.55 8.62 9.85
Time Technoplast
201003 1011.35 196.64 98.26 4.34 18.29 9.14 17.67 19.45
Sintex Industries
201003 3281.64 625.87 31.12 12.14 18.3 9.68 11.16 18.31
Source: Ace Equity

COMPANY RESEARCH REPORT December 30, 2010
23
29/12/2010
Investors can consider buying the stock at current levels (Rs.142- Rs.148) as it has been trading within that range for a while and it seems unlikely to fall below those levels in the near term. Technical Analysts suggest that the delivery support is at Rs.140.
ANALYST NOTES AND COMPANY NEWS

COMPANY RESEARCH REPORT December 30, 2010
24
Researched and prepared by: Amar Chandramohan Sr. Fundamental Analyst Email: [email protected]
Ph: (0484) 3040400, 3040419 Krishnan Thampi K
Head of Research and Strategies
Email: [email protected]
Muhammed Aslam E
Jr. Fundamental Analyst
Email: [email protected]
HEDGE RESEARCH & STRATEGIES GROUP
Head of Research: Krishnan Thampi K
Sr. Fundamental Analyst: Amar Chandramohan
Jr. Fundamental Analyst: Muhammed Aslam E
Sr. Equity Technical Analyst: Anish Chandran C V
Sr. Commodity & Equity Technical Analyst: Kesavamoorthy B
Jr. Technical Analyst: James George
Futures & Options Analyst: Yunus Ismail
Access all our research reports online at www.HedgeEquities.com
DIRECT ALL RESEARCH QUERIES TO: Research & Strategies Group
Hedge Equities Ltd
12 Floor, -Mini Muthoot Tech Towers
Kaloor, Kochi– 682017, Kerala, India
Phone: (0484) 3040400
Email: [email protected]
Disclaimer
The information contained in our report does not constitute an offer to sell securities or the solicitation of an offer to buy, any security. This report is prepared for
private circulation only. The information in our report is not intended as financial advice. Hedge Equities Ltd does not undertake the responsibility for any
investment decision taken by the readers based on this report. Moreover, none of the information in the research report is intended as a prospectus within the
meaning of the applicable laws of any jurisdiction. The information and opinions contained in our research reports have been compiled or arrived at from
sources believed to be reliable in good faith, but no representation or warranty, express or implied, is made by Hedge Equities Ltd, to their accuracy. Moreover,
you should be aware of the fact that investments in securities or other financial instruments involve risks. Past results do not guarantee future performance.