SUPPORTING THE IMPROVEMENT OF MARINE FISHERIES GOVERNANCE ... · Indian Ocean Commission Blue Tower...
31
SUPPORTING THE IMPROVEMENT OF MARINE FISHERIES GOVERNANCE AND MANAGEMENT IN SEYCHELLES Economic study on major trends in the tuna industry and its impact on the seychelles economy over the 5 year period, 2009-2013 SF/ 2015/ 50 Co-implemented by Funded by the European Union
Transcript of SUPPORTING THE IMPROVEMENT OF MARINE FISHERIES GOVERNANCE ... · Indian Ocean Commission Blue Tower...

SUPPORTING THE IMPROVEMENT OF MARINE FISHERIES GOVERNANCE AND
MANAGEMENT IN SEYCHELLESEconomic study on major trends in the tuna industry
and its impact on the seychelles economy over the 5 year period, 2009-2013
SF/ 2015/ 50
Co-implemented by
Funded by the European Union

The designations employed and the presentation of material in this information product do not imply the expression of any opinion whatsoever on the part of Indian Ocean Commission concerning the legal or development status of any country, territory, city or area or of its authorities, or concerning the delimitation of its frontiers or boundaries. The mention of specific companies or products of manufacturers, whether or not these have been patented, does not imply that these have been endorsed or recommended by Indian Ocean Commission in preference to others of a similar nature that are not mentioned.
The views expressed in this information product are those of the author(s) and do not necessarily reflect the views or policies of Indian Ocean Commission.
© 2015 Indian Ocean Commission
Authors: Philippe Lallemand, SmartFish Consultant
Coordinator: Dominique Greboval, SmartFish
Indian Ocean Commission Blue Tower5th floor, rue de l’InstitutEbene, MauritiusTel : +230 402 6100Fax: +230 466 [email protected] www.smartfish-coi.org
“ This publication has been produced with the assistance of the European Union. The contents
of this publication are the sole responsibility of the author and can no way be taken to the
reflect the views of the European Union.”
Supporting the improvement of marine fisheries governance and management in seychelles
Economic study on major trends in the tuna industry and its impact on the seychelles economy
over the 5 year period, 2009-2013
Programme for the implementation of a Regional Fisheries Strategy for the
Eastern and Southern Africa – Indian Ocean Region
SF/ 2015/ 50
This document has been prepared in good faith on the basis of information available at the date of publication without any independent verification. Ocean and Land Resources Assessment Consultants (OLRAC-SPS) makes no warranties express or otherwise or warrant the accuracy, reliability, completeness or currency of the information in this report nor its usefulness in achieving any purpose. Readers are responsible for assessing the relevance and accuracy of the content of this report. Under no circumstance will OLRAC-SPS be liable for any loss, damage, cost or expense incurred or arising by reason of any person using or relying on information in this report.
Terms of use Your access to and use of the data provided in this Report is conditional on your acceptance and compliance with the terms, conditions, and disclaimers contained in this document.This disclaimer applies unless revoked (by a statement to the contrary).

TABLE OF CONTENTS PAGE
1 Executive Summary 82 Background 9 2.1 The Establishment of the SFA FEIU unit 9 2.2 Past and present initiatives aimed to boost the FEIU 103 The Mission 11 3.1 Objective 11 3.2 Methodology used 11 3.2.1 Primary Added Values calculation 11 3.2.2 Key Indicators and trends relevant to the Tuna industry 12 3.3 Mission Results 13 3.3.1 The 2011 World Bank Model update 13 3.3.2 Technical and environmental indicators
on tuna fishing activity 13 3.3.3 Technical and commercial indicators in Port Victoria 18 3.3.4 Economic indicators 304 Conclusion and Recommendations 355 References 36 6 Appendix 36 6.1 Mission Terms of Reference 36 6.2 Schedule of the Mission and Persons Met 36 6.3 Tuna Industry’s Primary Added Values Calculation
(2009-2013) 39 6.4 Technical Appendix regarding the “FEIU Tool” 45 6.4.1 Overview 45 6.4.2 The FEIU tool’s dynamic pivot tables and pivot charts 46 6.4.3 The FEIU tool’s Dashboards 48 6.4.4 Example of FEIU tool’s Pivot Tables and Pivot Charts 50 6.5 Issues identified in the FEIU Repository Database 56

6 Supporting the improvement of marine fisheries governance and management in seychelles 7
LIST OF FIGURES
Figure 1 Interactive Pivot chart generated by the FEIU tool showing Purse Seiners’ annual expenditures
by country and type while in the Port of Victoria, Seychelles between 2009 and 2013 ........................52
Figure 2 IOT Containers movement (in versus out) in Port Victoria between 2009 and 2013 ...........................53
Figure 3 Licence fees comparison (Industrial Longliners versus Purse Seiners) by country
between 2009 and 2013 ............................................................................................................54
Figure 4 2013 estimates of the Tuna industry’s Direct and Indirect Added value by category of
contribution, activity type and country .........................................................................................55
LIST OF TABLES
Table 1 Tuna caught (Mt) in the IOTC area by vessel type and country between 2009 and 2013 .....................13
Table 2 Tuna caught (Mt) in the IOTC area by species, vessel type and country between 2009 and 2013 .........14
Table 3 Tuna caught (Mt) in the Seychelles EEZ by vessel type and country between 2009 and 2013 ..............15
Table 4 Tuna caught (Mt) in the Seychelles EEZ by species, vessel type and country between 2009 and 2013 ..16
Table 5 Fishing effort of tuna fleet in Seychelles EEZ in number of fishing days and number of hooks .............17
Table 6 Status of the tuna fish stocks (Mt) on tuna main species (yellowfin, skipjack, big-eye, albacore). ........17
Table 7 Quantity/composition of tuna landed and transhipped in Port Victoria (SFA)
between 2009 and 2013 (Mt) .....................................................................................................18
Table 8 Number of port calls of tuna boats (Port Authority) ........................................................................19
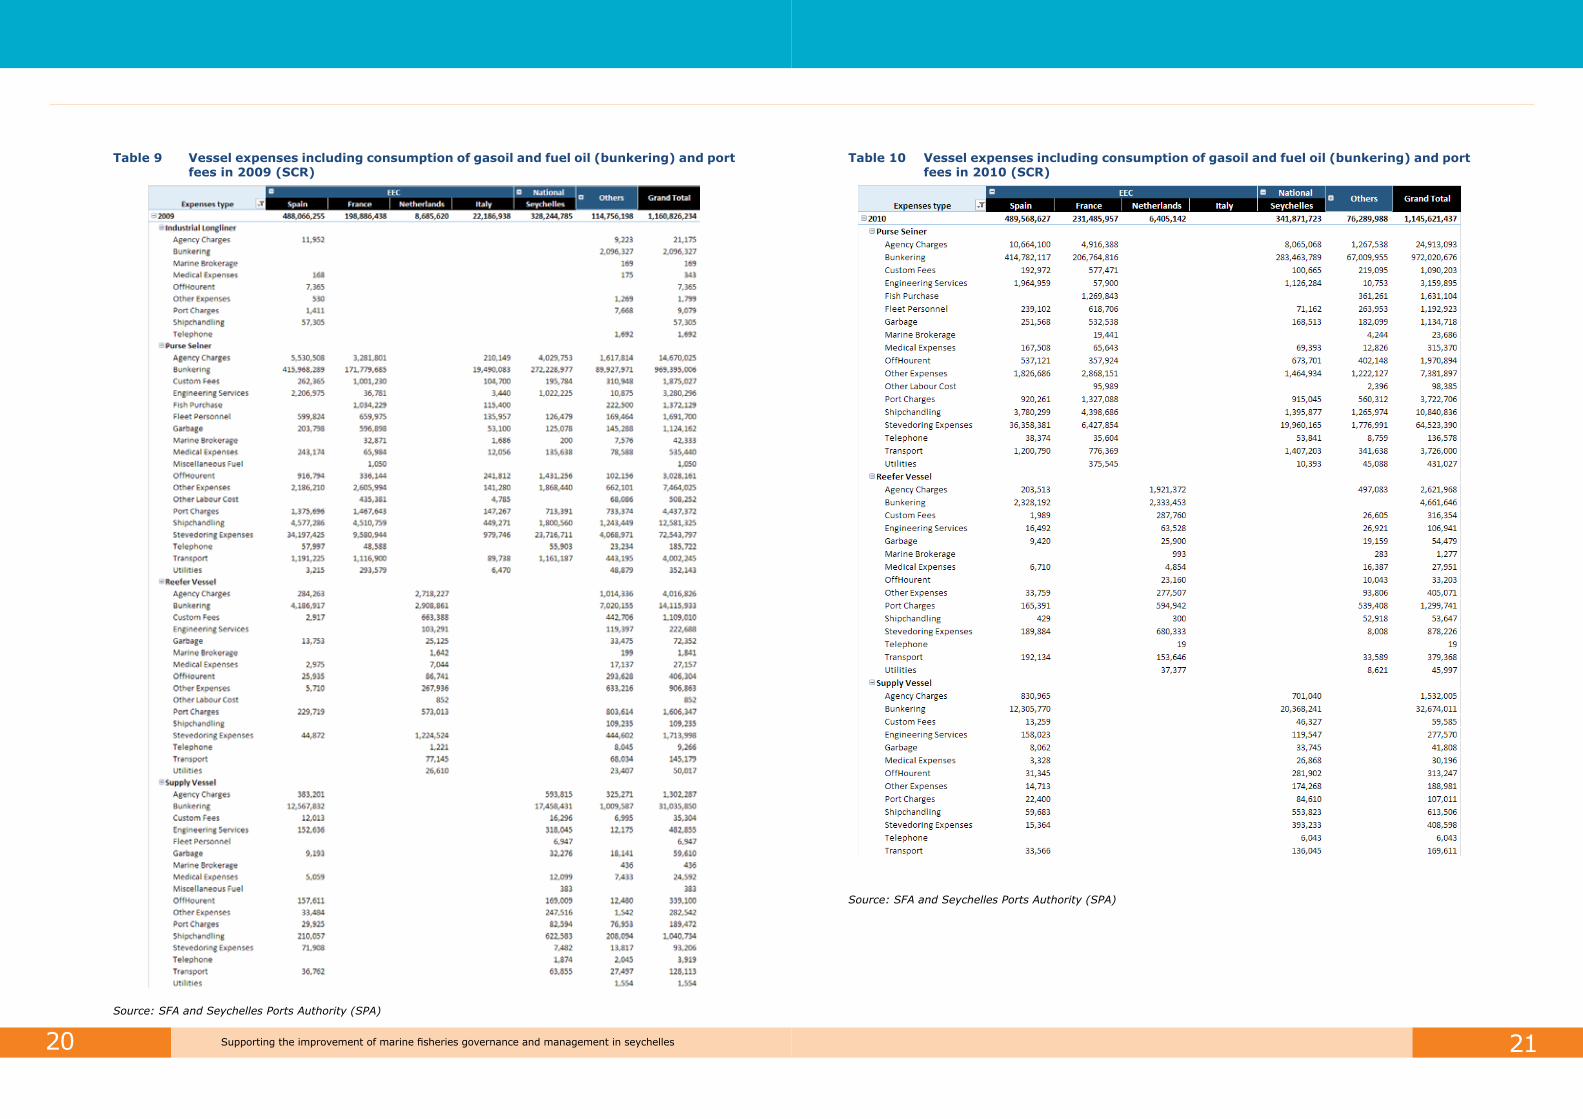
Table 9 Vessel expenses including consumption of gasoil and fuel oil (bunkering) and port fees in 2009 (SCR) 20
Table 10 Vessel expenses including consumption of gasoil and fuel oil (bunkering) and port fees in 2010 (SCR) 21
Table 11 Vessel expenses including consumption of gasoil and fuel oil (bunkering) and port fees in 2011 (SCR) 22
Table 12 Vessel expenses including consumption of gasoil and fuel oil (bunkering) and port fees in 2012 (SCR) 23
Table 13 Vessel expenses including consumption of gasoil and fuel oil (bunkering) and port fees in 2013 (SCR) 24
Table 14 Quantity (corresponded volume) of containers imported and exported
by IOT (Numbers of 20ft equivalent containers) ............................................................................25
Table 15 Quantity/ composition/ value of raw material contracted with PS and imported .................................26
Table 16 Quantity of canned tuna, fishmeal, fish oil, tuna loin (frozen) produced (Mt) .....................................27
Table 17 Export market (share of EU) in SCR ............................................................................................28
Table 18 Seychelles tuna cans exports volume (Mt), value (000 €) and price (€/kg)
to the European Economic Community (EEC) and the Rest of the World (Others) ..............................28
Table 19 Budget revenue and expenditures (SCR and Euros) .......................................................................30
Table 20 Contribution to Gross Domestic Product (GDP) in SCR ...................................................................31
Table 21 European Union Financial Contribution (million SCR). ....................................................................32
Table 22 Licence fees receipts (SCR) ........................................................................................................32
Table 23 Summary tables showing trends in the Tuna fishing sector’s direct (DVA), indirect (IVA)
and primary (PVA) added value between 2009 and 2013 (SCR) ......................................................33
Table 24 Share of tuna fishing and related activities in port’s activity (turnover, taxes) in SCR. ........................34
Table 25 Schedule of the mission .............................................................................................................38
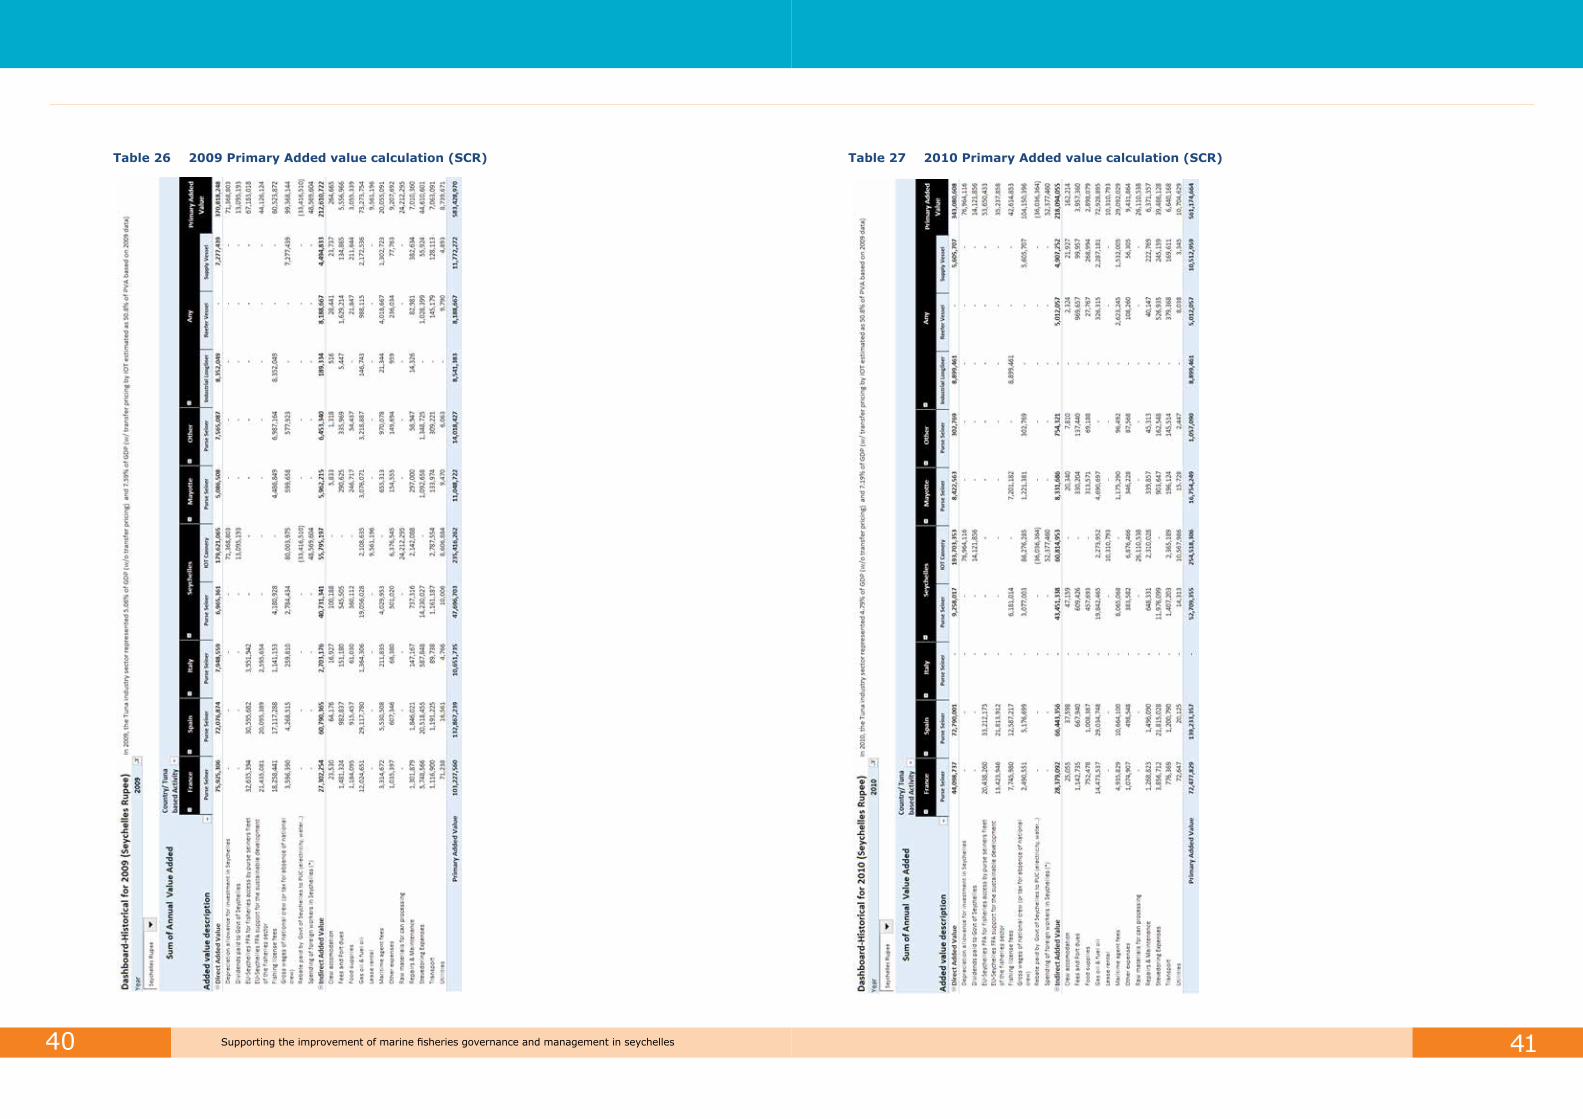
Table 26 2009 Primary Added value calculation (SCR) ................................................................................40
Table 27 2010 Primary Added value calculation (SCR) ................................................................................41
Table 28 2011 Primary Added value calculation (SCR) ................................................................................42
Table 29 2012 Primary Added value calculation (SCR) ................................................................................43
Table 30 2013 Primary Added value calculation (SCR) ................................................................................44
Table 31 Interactive Pivot table generated by the FEIU tool showing the number of active vessels
by year, fishery, gear type, and country of origin ...........................................................................51

8 Supporting the improvement of marine fisheries governance and management in seychelles 9
1 EXECUTIVE SUMMARYAs part of the implementation of a regional fisheries strategy for the Eastern and Southern Africa and Indian Ocean region (ESA-IO region), SmartFish is currently supporting initiatives designed to improve fisheries governance in Seychelles. SmartFish’s involvement consists in providing technical support to promote the establishment of a Fisheries Economic Intelligence Unit (FEIU) within the Seychelles Fisheries Authority (SFA).
This report describes the mission of the consultant sent by SmartFish between the 5th and 11th of May 2015 to foster the FEIU initiative and the subsequent tool that was developed to “kick start” the intelligence unit.
The objectives of this mission were twofold:
§ First, to conduct an economic study on major trends in the tuna industry and their impacts on the Seychelles economy over the period 2009-2013. This was based on data from the repository database recently created by SFA’s Statistic Division to support, among others, such analysis. The SFA’ repository database was initiated by SmartFish and developed over a period of several months during the previous phase of the programme.
§ Second, to provide the yet-to-be formally established FEIU with an economic intelligence tool to monitor and conduct economic analysis in the future, thus contributing to the capacity-building of the unit.
The mission also included a 2-day briefing at the SmartFish Programme Headquarters in Ebène, Mauritius.
Following the mission in Seychelles, an economic intelligence tool was developed, the “FEIU tool”, organised around two main components:
§ An economic simulation model used to identify the source, distribution and extent of the direct, indirect and primary value added in each segment of the tuna industry (both fishing and processing sectors) – The methodology used in the “FEIU tool’s dashboards” is similar to the one the World Bank (2011) used in their model when they provided technical assistance to SFA to improve the management of the tuna industry. The dashboards estimates also draw on up-to-date information linked to the FEIU repository database.
§ A series of key indicators to monitor business intelligence in the tuna industry – the “FEIU pivot tables and charts” dynamically linked to the FEIU repository database.
During his visit to SFA in Seychelles and later while developing the FEIU tool, the consultant had the opportunity to test the robustness and completeness of the FEIU repository database; a key element for a successful establishment of the intelligence unit.
One of the expectations of the FEIU unit is that it will contribute not only to a better understanding and assessment of the contribution of the fishery sector to the national economy as a whole but will also report on the performance and contribution of the fishery sector vis-à-vis the Blue Economy.
It is believed this will contribute to a better understanding and acceptance that the fishery sector is a driving force in the national economy capable of attracting potential investors and skilled workers.
The tool previously developed by the World Bank in 2011 in close consultation with the Ministry of Finance and SFA included:
§ an economic model of the tuna value chains with key indicators (Excel Spreadsheet model)
§ a dashboard summarizing the principal indicators, including data from the economic model, for monitoring the sector.
With the 2015 SmartFish mission, the consultant was able to revisit the 2011 World Bank model and update the 2009 estimates based on the newly-created FEIU repository database. The new estimates reflect a notable shift between industrial tuna fishing methods from purse seiners to industrial longliners (the same tendency seems to hold with the semi-industrial longliners becoming prevalent in the domestic fleet). The number of purse seiners decreased from 55 (32 from the EU) in 2009 to 42 (22 from the
EU) in 2013 while at the same time, the number of Industrial longliners increased from 86 (61 foreign flags outside EU) to 134 (103 foreign flags outside EU) for the same period. This shift in the Industrial tuna fleet composition translates in decreased contribution of direct added value (DAV) from 62.1% of the Primary added value (PVA) in 2009 to 58.8% of PVA in 2013 in favour of indirect added value (IAV) which increased from 37.9% of PVA in 2009 to 41.2% of PVA in 2013.
The contribution of the Tuna fishing industry (including transfer pricing from IOT) to the national economy was estimated at 7.7% of the current GDP in 2009 compared to 6.7% in 2013. The World Bank and the Seychelles National Bureau of Statistics (NBS) estimated in 2009 that the contribution of the Tuna fishing industry could be between 8% and 9 % of the GDP. We note here that the validity of the GDP estimate from the FEIU repository database is a concern, since it does not match the estimates from alternative sources commonly referred to as reputable. The same goes for the exchange rates.
2 BACKGROUNDIn 2011, financed by the European Union under the 10th European Development Fund, IOC-SmartFish started the IFRS program to implement a new strategy for the Eastern and Southern Africa and Indian Ocean region (ESA-IO region) with the aim of contributing to an increased level of social, economic and environmental development and deeper regional integration in the ESA-IO region through the sustainable exploitation of fisheries resources.
In Seychelles, the Statement of Intent to support national priorities for the fishing policy (elaborated with technical assistance from the SmartFish Programme) recommended the creation of a Fisheries Economic Intelligence Unit (FEIU) within the Seychelles Fishing Authority (SFA) with the aim to monitor the fishery sector and formulate precise macro-economic objectives.
It was expected that the FEIU should also carry out several economic evaluation studies to be utilized for implementing the strategic policy of the country, starting with a first evaluation of the rent from marine resources targeted by all major national fisheries. As such, the FEIU should focus on the following:
§ Calculate an estimated value of the wealth of marine resources by improving the quality of catch data and improving the methodology for data collection and analysis;
§ Undertake bio-economic modelling, covering the main types of natural resources available, in support of the elaboration and implementation of fisheries management plans, including co-management arrangements;
§ Define and monitor key macro-economic indicators (turnover, employment, contribution to the GDP, market contribution, and contribution to food security)
§ Provide advice (technical economic analysis and recommendations) to a Special Strategic Economic Group (SSEG) responsible for taking strategic decisions and communication with government and stakeholders (national and international groups).
While Seychelles is facing institutional changes to support, among others, the Blue Economy, SFA has identified the establishment of an operational Fisheries Economic Intelligence as a top priority.
2.1 The Establishment of the SFA FEIU unitIn the past few years, the Seychelles Fishing Authority (SFA) which is responsible for the management of the fishery, has been endorsing the setting-up of a Fisheries Economic Intelligence Unit within the SFA specifically dedicated to the monitoring of the economic performance of the fisheries sector and the provision of specific assistances to support fisheries management decision-making in the context of the Blue Economy.
The FEIU is primarily a strategic support group which can contribute toward the preparation of public and sectorial decisions for the fishing and aquaculture industries, whilst taking into account the broader national, regional and international dimensions of the matters being considered.

10 Supporting the improvement of marine fisheries governance and management in seychelles 11
management Section of the Fisheries Economics and information Division) could be potentially involved in the day-to-day operation of the FEIU as long as this does not interfere with his/ hers existing duties.
The repository database is being finalised to support, among others, the economic analysis of the FEIU. The database, which is almost fully operational, has been designed to run under Microsoft Access. Note that the database is currently managed by the consultant who designed it and who is attached to the Statistical Management Section of the Fisheries Economics and Information Division.
Finally, a monitoring and economic analysis tool has been designed in Microsoft Excel, referred in this document as the “FEIU tool”, which analyses data dynamically linked to the FEIU MS Access database. The FEIU tool is still under development but is already functional and able to conduct some of the economic analysis expected from the unit such as monitoring the trends in the tuna industry, and estimating the tuna industry contribution to the national economy.
3 THE MISSION
3.1 ObjectiveThe objective of this mission was to update work done by the World Bank in 2011 on estimating value addition in the Seychelles tuna fisheries sector and its impact on the Seychelles Economy. This work was to be conducted alongside the establishment of a Fisheries Economic Intelligence Unit (FEIU) within the Seychelles Fishing Authority (SFA) specifically dedicated to the monitoring of the economic performance of the fisheries sector in general. The FEIU was to be set up to provide specific advice to support the management of the fishery sector and to improve governance in the context of the Blue Economy.
To do so, an economic tool, the “FEIU tool”, was to be introduced to the FEIU exhibiting two main components:
§ An economic simulation model used to identify the source, distribution and extent of the direct, indirect and primary value added in each segment of the tuna industry (both fishing and processing sectors) – The “FEIU tool-dashboards”
§ A series of key indicators to monitor business intelligence in the tuna industry – the dynamic “FEIU pivot tables and charts” linked to the FEIU repository database.
3.2 Methodology usedThe FEIU tool “FEIU.xlsm” was developed in Microsoft Excel 2013 and require VBA1 Macros to be enabled. The VBA macros generate the custom menus and submenus, some features of the dashboards and ensure that the FEIU tool is correctly linked to the FEIU database.
3.2.1 Primary Added Values calculationThe FEIU tool’s dashboards (see Table 26 to Table 30 in the Appendix under section 6.4.3) uses the same economic model that was developed by the World Bank (2011) which is based on the ‘effects method’. This method allows for a valuation of the impact of the tuna industry on the entire economy in terms of the direct economic effects (Direct Value-Added – DVA) and indirect economic effects (Indirect Value-Added – IVA) of the tuna fisheries and related activities.
Value-added was mostly calculated by the difference between sales (turnover) and the intermediary consumption. The value-added generated by the tuna fleet licenced to fish in the Seychelles EEZ was also appraised in terms of the access rights that is, licence fees, plus fishing agreement revenues for the European Union (EU) fleet operating under the Fisheries Partnership Agreements (FPA).
DVA refers to value-added generated by all tuna fishing and processing activities taking place in Seychelles.
IVA refers to value-added generated by all the ancillary activities related to fishing and processing activities taking place in Seychelles. The IVA generated by the local suppliers and captured by the model is the IVA of first iteration.
1 Visual Basic for Application (VBA)
The FEIU’s Mandate is therefore articulated around 6 primary functions:
§ Data repository: Efficiently gather the necessary data and information held by the relevant stakeholder groups to assist in resolving any issue affecting the fishery sector particularly in the context of the Blue Economy.
§ Monitoring: Monitor and analyse any events and trends which might have an impact on the fishing industry and the broader national economy.
§ Collaborative: Collaborate with the relevant public and private sectors to strengthen fisheries management policies and planning towards a sustainable use and development of the Seychelles marine resource especially in the context of the Blue Economy.
§ Advisory: Understand policy, trade and industry issues faced today by the fishing sector and be able to present them in a clear and concise manner.
§ Mediatory: Promote and facilitate dialogue between fishing industry stakeholder groups to discuss and help resolve issues pertaining to the fisheries and/or aquaculture sectors.
§ Inform and educate: Contribute to the improvement of the knowledge base surrounding issues and strategic decisions faced by the fishery sector in Seychelles especially in the context of the Blue Economy, thus reinforcing FEIU‘s informative and pedagogic function.
2.2 Past and present initiatives aimed to boost the FEIUIn 2011, the World Bank (WB) provided technical assistance for tuna industry management. The assistance included the development of an economic intelligence tool to measure direct and indirect benefits generated by the Seychelles tuna industry and to identify potential sources of national growth led by the tuna fisheries. The tool was also developed to provide some ‘benchmarking’ data that could be used to help the local cannery, the Indian Ocean Tuna Company (IOT) improve their competitiveness, a concern shared by both the public and private sectors.
The tool developed by the WB in close consultation with the Ministry of Finance and SFA included:
§ an economic model of the tuna value chains with key indicators (Excel Spreadsheet model)
§ a dashboard summarizing the principal indicators, including data from the economic model, for monitoring the sector.
Between July 2013 and August 2014, the SFA recruited a national economist consultant to support the development of the FEIU within the already well established Fisheries Economic and Information Division.
In November 2013, IOC-SmartFish contracted an international consultant to assist SFA with a proof of concept to identify areas needing attention to further develop and strengthen the FEIU in response to the pressing need for such unit.
Since July 2014, IOC- SmartFish supports the Implementation of a small institutional project under the provision of temporary international and national expertise targeting 3 primary initiatives:
§ the development of a repository SFA-FEIU database through the statistic division to support economic analysis,
§ the development of an economic model for the tuna industry drawing information from the SFA-FEIU database with the capability to report on major trends relevant to the tuna industry in Seychelles
§ Drawing information from the SFA-FEIU database, carrying out a global valuation of the fisheries sector’s contribution to the national economy.
Currently, FEIU is still considered an SFA initiative placed under the coordination/supervision of the Head of the Fisheries Economic and Information Division. However, the future of a fully operational FEIU within the existing SFA structure is still unclear. Unfortunately, there is a shortage of staff to support the FEIU initiative. In reality, only one person (either the senior economist or the Chief of the Fisheries economic

12 Supporting the improvement of marine fisheries governance and management in seychelles 13
3. Economic indicators, a. Estimated PVA (see Table 23)b. Budget revenue (see Table 19, Table 20, Table 21, Table 22)c. Employment5
d. International fish trade6
e. Share of tuna fishing and related activities in port’s activity (turnover, taxes) (see Table 24)
3.3 Mission Results
3.3.1 The 2011 World Bank Model updateThe economic model ran in 2011 by the World Band (using data from 2009) gave an estimate for the PVA of SCR 557.4 million (USD 40.8 million); our estimates for the same year shows a PVA of SCR 585.63 (USD 43.07) (see Table 23).
We note, however, that the WB model of 2011 did not first integrate the effects of what might be considered as a form of “transfer pricing” by IOT cannery. The 2011 WB report states that:
“Using the 2009 average exchange rate, the transfer pricing is estimated at approximately SCR 283.4 million (USD 20.9 million). Inclusion of this value in the contribution of the fisheries industry to the national economy would increase the contribution by 51% from SCR 557.4 million to SCR 840.8 million (USD 40.8 million to USD 61.7 million). The contribution of the tuna industry sector to the economy (primary value added) could consequently be estimated to a minimum of 8.2%.”
We applied the same rule for the data generated by the FEIU tool and estimated the PVA (including transfer pricing) to be SCR 883.13 (USD 64.95) corresponding to a contribution to the Seychelles GDP of 7.7% in 2009, that contribution has since been decreasing to reach 6.7% in 2013 (see Table 23). During the same period, the FEIU tool’s model estimates an increased contribution of IVA between 2009 and 2013 while correspondingly, the contribution of DVA decreased over the same period (Table 23).
We also note that the decrease in the DVA contribution to the GDP can be explained by the reduction in the number of European Union’s purse seiners from 32 in 2009 to just 22 in 2013 reducing de-facto the direct revenue generated by the EU-Seychelles FPA for fisheries access by EU purse seiners fleet from SCR 104.76 million in 2009 to SCR 89.24 million, or a loss of revenue of about 15% (see Table 26 to Table 30 in the Appendix under section 6.4.3 for detailed DVA, IVA and PVA calculation).
Also between 2009 and 2013 the industrial longliners’ fleet increased by 56% (from 86 to 134 vessels) while the purse seiners’ fleet, all flags combined, decreased by 21% (from 48 to 38 vessels)
3.3.2 Technical and environmental indicators on tuna fishing activity
Table 1 Tuna caught (Mt) in the IOTC area by vessel type and country between 2009 and 2013
Catch (Mt) Country
Fishery type France Spain Seychelles Taiwan China Australia Korea, South Japan Thailand Reunion PortugalNot
Elsewhere included
South Africa Oman Maldives Mauritius IndiaGrand Total
2009 139,020 115,252 76,574 58,512 4,506 7,600 5,562 11,084 2,170 1,131 6,068 843 1,874 108 8 430,313 Industrial Longliner 3,306 8,234 58,512 4,506 443 2,170 1,131 843 1,874 108 8 81,136 Purse Seiner 139,020 111,946 68,339 7,158 5,562 11,084 6,068 349,177
2010 130,910 133,631 82,155 60,463 8,068 5,088 1,331 2,055 2,253 2,098 336 9 428,397 Industrial Longliner 3,116 6,368 60,463 8,068 456 1,331 2,253 2,098 336 9 84,499 Purse Seiner 130,910 130,514 75,787 4,632 2,055 343,898
2011 139,008 133,538 70,974 60,545 2,207 4,569 1,512 3,157 372 2,515 1,989 1,501 89 8 421,985 Industrial Longliner 3,191 7,762 60,545 2,207 260 1,512 372 2,515 1,989 1,501 89 8 81,953 Purse Seiner 139,008 130,347 63,211 4,309 3,157 340,032
2012 132,313 113,001 63,317 72,428 5,321 4,907 2,710 2,205 468 1,892 1,531 1,246 33 36 8 401,416 Industrial Longliner 4,396 12,379 72,428 5,321 415 468 1,892 1,531 1,246 33 36 8 100,153 Purse Seiner 132,313 108,605 50,938 4,492 2,710 2,205 301,263
2013 131,479 146,982 68,097 59,737 7,538 4,562 12,246 1,153 342 1,822 2,349 1,081 1,199 68 438,654 Industrial Longliner 10,773 59,737 7,538 352 342 1,822 2,349 1,081 1,199 68 85,260 Purse Seiner 131,479 146,982 57,324 4,211 12,246 1,153 353,394
Source: IOTC
5 There is no data available on employment in the Seychelles tuna fishing industry in the current version of the FEIU database (at the time of writing), although the table exists, it is empty.
6 There is no table referring to international trade in the current version of the FEIU database
By summing the DVA and the IVA of first iteration, the model can provide an estimate of the Primary Value-Added (PVA) generated by the tuna fisheries sector, and hence a contribution of the entire sector to the Seychelles economy.
The economic model also allows for an estimate of the sharing of PVA between Employees (workers), Companies and State.
The newly-developed FEIU tool used the same approach as the one used by the World Bank in 2011 to derived DVA, IVA and PVA (see section 6.4.3. in the Appendix for a full description of the FEIU tool’s dashboards)
3.2.2 Key Indicators and trends relevant to the Tuna industryPivot tables and pivot charts were used to produce summaries of the various indicators and trends relevant to the Tuna fishing industry as suggested by the World Bank (2011) and Breuil (2014). The pivot tables and charts are dynamically link to the FEIU database reflecting the latest information available. For most pivot tables there is a corresponding pivot chart.
Following Breuil (2014), the following categories of indicators relevant to the tuna fishing activity were produced in the FEIU tool:
1. Technical and environmental indicators on tuna fishing activity, a. Quantity/composition of tuna caught in the IO area (see Table 1 and Table 2)b. Quantity/composition of tuna caught in the Seychelles EEZ (see Table 3 and Table 4)c. Fishing effort of tuna fleet in Seychelles EEZ in number of fishing days and number of
hooks (see Table 5)d. Status of the tuna fish stocks for the tuna main species (yellowfin, skipjack, big-eye,
albacore) (see Table 6)e. Catch and catch’s representativeness for each big pelagic species’ group (Indian Ocean
catches / global catches (FAO), Seychelles EEZ catches/ Indian Ocean catches) (see Table 2 and Table 4)
2. Technical and commercial indicators in Port Victoria, a. Tuna port activity indicators
i. Quantity/composition of tuna landed and transhipped in Port Victoria (see Table 7)ii. Number of port calls of tuna boats (see Table 8)iii. Tuna flow by port call (see Table 8)iv. Vessel expenses including consumption of gasoil and fuel oil and port fees (Table 9
to Table 13)v. Quantity (corresponded volume) of containers imported and exported by IOT see
Table 14)b. Tuna processing activity indicators
i. Quantity/composition/value of raw material contracted with PS and imported (see Table 15)
ii. Quantity/value of canned tuna (see Table 16)iii. Quantity/value of fishmeal (see Table 16)iv. Quantity/value of fish oil (see Table 16)v. Quantity/value of tuna loin (see Table 16)
vi. Export market (share of EU) (see Table 17)c. Indicators to measure the local cannery competitiveness
i. Seychelles tuna cans exports volume (tons), value (000 €) and price (€/ kg) (see Table 18)
ii. EU tuna cans imports volume (tons), value (000 €) and price (€/ kg)2
iii. EU tuna cans imports from Seychelles, volume (tons), value (000 €) and price (€/ kg) )3
iv. Seychelles volume representativeness4
2 There is no data available on EU Tuna cans global imports in the current version of the FEIU database (at the time of writing)
3 There is no data available on EU Tuna cans imports from Seychelles in the current version of the FEIU database (at the time of writing)
4 There is no data available on Seychelles volume representativeness (share of Tuna cans imported from Seychelles) in the current version of the FEIU database (at the time of writing)

14 Supporting the improvement of marine fisheries governance and management in seychelles 15
Table 3 Tuna caught (Mt) in the Seychelles EEZ by vessel type and country between 2009 and 2013
Catch (Mt) Country
Fishery type Seychelles Spain France Mayotte Taiwan Korea, South Thailand Italy China Japan Philippines Oman MauritiusTanzania,
United Republic of
Belize Grand Total
2009 339,531 12,482 10,466 2,567 841 13 967 943 144 688 3 24 368,667 Industrial Longliner 794 841 13 144 688 3 24 2,506 Purse Seiner 9,722 12,482 10,466 2,567 967 943 37,146 Semi Industrial Longliner 329,015 329,015
2010 306,071 28,227 13,442 5,205 1,642 - 66 29 354,683 Industrial Longliner 629 1,642 66 29 2,367 Purse Seiner 10,592 28,227 13,442 5,205 - 57,465 Semi Industrial Longliner 294,850 294,850
2011 251,540 26,804 13,274 6,086 550 8 32 298,295 Industrial Longliner 748 550 8 32 1,338 Purse Seiner 13,103 26,804 13,274 6,086 59,268 Semi Industrial Longliner 237,689 237,689
2012 282,936 22,635 12,621 11,578 6,542 396 180 134 479 80 52 337,633 Industrial Longliner 1,821 6,542 180 134 479 80 52 9,287 Purse Seiner 10,301 22,635 12,621 11,578 396 57,531 Semi Industrial Longliner 270,814 270,814
2013 271,533 14,554 8,119 5,994 3,559 580 556 21 118 23 207 57 305,320 Industrial Longliner 2,725 3,559 556 21 118 23 57 7,059 Purse Seiner 6,647 14,554 8,119 5,994 580 207 36,101 Semi Industrial Longliner 262,160 262,160
Source: IOTC, SFA
Table 2 Tuna caught (Mt) in the IOTC area by species, vessel type and country between 2009 and 2013
Source: IOTC

16 Supporting the improvement of marine fisheries governance and management in seychelles 17
Table 5 Fishing effort of tuna fleet in Seychelles EEZ in number of fishing days and number of hooks
Source: SFA
Table 6 Status of the tuna fish stocks (Mt) on tuna main species (yellowfin, skipjack, big-eye, albacore).
Source: IOTC
Table 4 Tuna caught (Mt) in the Seychelles EEZ by species, vessel type and country between 2009 and 2013
Source IOTC, SFA

18 Supporting the improvement of marine fisheries governance and management in seychelles 19
Table 8 Number of port calls of tuna boats (Port Authority)
Source: Seychelles Ports Authority (SPA)
3.3.3 Technical and commercial indicators in Port Victoria
3.3.3.1 Tuna port activity indicators
Table 7 Quantity/composition of tuna landed and transhipped in Port Victoria (SFA) between 2009 and 2013 (Mt)
Source: SFA
20 Supporting the improvement of marine fisheries governance and management in seychelles 21
Table 10 Vessel expenses including consumption of gasoil and fuel oil (bunkering) and port fees in 2010 (SCR)
Source: SFA and Seychelles Ports Authority (SPA)
Table 9 Vessel expenses including consumption of gasoil and fuel oil (bunkering) and port fees in 2009 (SCR)
Source: SFA and Seychelles Ports Authority (SPA)

22 Supporting the improvement of marine fisheries governance and management in seychelles 23
Table 12 Vessel expenses including consumption of gasoil and fuel oil (bunkering) and port fees in 2012 (SCR)
Source: SFA and Seychelles Ports Authority (SPA)
Table 11 Vessel expenses including consumption of gasoil and fuel oil (bunkering) and port fees in 2011 (SCR)
Source: SFA and Seychelles Ports Authority (SPA)

24 Supporting the improvement of marine fisheries governance and management in seychelles 25
Table 14 Quantity (corresponded volume) of containers imported and exported by IOT (Numbers of 20ft equivalent containers)
Source: Seychelles Ports Authority (SPA)
Table 13 Vessel expenses including consumption of gasoil and fuel oil (bunkering) and port fees in 2013 (SCR)
Source: SFA and Seychelles Ports Authority (SPA)

26 Supporting the improvement of marine fisheries governance and management in seychelles 27
Table 16 Quantity of canned tuna, fishmeal, fish oil, tuna loin (frozen) produced (Mt)
Source: SFA
3.3.3.2 Tuna processing activity indicators
Table 15 Quantity/ composition/ value of raw material contracted with PS and imported
Source: SFA

28 Supporting the improvement of marine fisheries governance and management in seychelles 29
NB: No information was found in the FEIU database related to the following:
§ EU tuna cans imports volume (tons) and value (000 €) and price €/kg
§ EU tuna cans imports from Seychelles volume (tons) and value (000 €) and price €/kg
§ Seychelles volume representativeness
Table 17 Export market (share of EU) in SCR
Source: SFA
3.3.3.3 Indicators to measure the local cannery competitiveness
Table 18 Seychelles tuna cans exports volume (Mt), value (000 €) and price (€/kg) to the European Economic Community (EEC) and the Rest of the World (Others)
Source: SFA, IOT

30 Supporting the improvement of marine fisheries governance and management in seychelles 31
Table 20 Contribution to Gross Domestic Product (GDP) in SCR
Source: SFA, NBS
3.3.4 Economic indicators
Table 19 Budget revenue and expenditures (SCR and Euros)
Source: SFA, NBS

32 Supporting the improvement of marine fisheries governance and management in seychelles 33
Table 23 Summary tables showing trends in the Tuna fishing sector’s direct (DVA), indirect (IVA) and primary (PVA) added value between 2009 and 2013 (SCR)
2009 2010 2011 2012 2013DVATotal 363.87 334.07 393.55 465.34 453.13
% chge -8.2% +17.8% +18.2% -2.6%DVATotal 26.76 27.83 32.09 34.36 37.61
% chge +4.0% +15.3% +7.1% +9.5%
% of PVA 62.1% 59.8% 61.6% 66.3% 58.8%
% chge -3.7% +3.0% +7.7% -11.4%IVATotal 221.77 224.53 245.60 236.36 317.78
% chge +1.2% +9.4% -3.8% +34.4%IVATotal 16.31 18.71 20.03 17.45 26.38
% chge +14.7% +7.0% -12.9% +51.2%
% of PVA 37.9% 40.2% 38.4% 33.7% 41.2%
% chge +6.1% -4.4% -12.3% +22.4%PVATotal
585.63 558.60 639.15 701.70 770.90
% chge -4.6% +14.4% +9.8% +9.9%PVATotal
43.07 46.54 52.11 51.81 63.99
% chge +8.1% +12.0% -0.6% +23.5%
million SCR
11,533.40 11,705.40 13,304.50 15,468.50 17,387.24
% chge +1.5% +13.7% +16.3% +12.4%w/o
transfer pricing
5.1% 4.8% 4.8% 4.5% 4.4%
w/ transfer pricing
7.7% 7.2% 7.2% 6.8% 6.7%
% chge -6.0% +0.7% -5.6% -2.3%SCR per
US$13.60 12.00 12.26 13.54 12.05
% chge -11.8% +2.2% +10.4% -11.0%
Index 185.76 181.30 185.94 199.16 207.80
% chge -2.4% +2.6% +7.1% +4.3%
Index 135.66 172.42 195.90 213.27 257.81
% chge +27.1% +13.6% +8.9% +20.9%
million SCR
million SCR
million US$
¹ calculation based on both the SFA-FEIU database and data extrapolated from the 2011 World Bank Model² calculation solely based on the SFA-FEIU database
Trends
Cons
umer
Pr
ice
Inde
x (C
PI)²
Fish
Allitems
as a % of
annual PVA
as a % of
annual PVA
Exchange rate²SCR/ US$
Dire
ct a
dded
valu
es (D
VA)¹
Indi
rect
add
ed v
alue
s (IV
A)¹
Prim
ary
adde
d va
lues
(PVA
)¹
million SCR
million US$
million US$
Seychelles²GDP at current
prices
PVAas a % of
SeychellesGDP¹
Source: SFA, World Bank (2011)
Table 21 European Union Financial Contribution (million SCR).
Source: SFA
Table 22 Licence fees receipts (SCR)
Source: SFA

34 Supporting the improvement of marine fisheries governance and management in seychelles 35
4 CONCLUSION AND RECOMMENDATIONSOne of the key aspects of SmartFish’s effort to develop a fisheries economics intelligence unit in Seychelles, is the expectation that such a unit will contribute not only to a better understanding and assessment of the contribution of the tuna fishery sector in the national economy as a whole, but will also report on the performance and contribution of the tuna fishery sector vis-à-vis the Blue Economy.
There is also an expectation that the FEIU will contribute to a better understanding and acceptance that the fishery sector is a driving force in the national economy, capable of attracting potential investors and skilled workers.
Although the mission in Seychelles was too short7 to fully develop in situ a tool capable of supporting any FEIU’s endeavour to deliver sound economic intelligence immediately, it was an opportunity to make initial contacts with the key personnel potentially involved in the future operation of the yet-to-be formally established FEIU. The mission in Seychelles was also an opportunity to meet the contractor who developed the FEIU repository database.
Overall, the FEIU repository database is a good start, although a few adjustments are necessary to be fully functional; the majority of issues we found are minor and certainly not unsolvable. Moreover, I believe that the issues reported in this report (see section 6.5 in the Appendix) can easily be addressed by the consultant who developed the database. As is, the FEIU database can be used to provide useful insights about the economic benefits brought by the tuna industry to the Seychelles economy. Several tables have been presented although the FEIU tool can produce many more yet (including charts).
In order to improve the FEIU repository database, I would recommend the following:
1. Update the tables with incomplete information such as ex-vessel prices, GDP,..
2. Adding the following tables:
a. Additional economic indices such as PPI, unemployment rates
b. Data from IOT (production by product type, prices, operating expenses, investment,…)
c. Disaggregated Employment data from NBS (Tuna harvesting vs. processing if available).
d. Trade data to measure Seychelles’ tuna export competitiveness.
3. Double check the data on
a. exchange rates
b. GDP (adding the ones for 2013 and later, if available)
4. Convert any data expressed in monetary terms into Seychelles rupees (SCR) applying the relevant exchange rate. The SCR value equivalent could be calculated in a new field labelled “equivalent value in SCR”
5. Use a consistent unit of measure within the same table (Mt or kg, Millions or thousands)
6. Correct inconsistent data (errors identified) such as the catch by Seychelles flag semi-industrial longliners within the Seychelles EEZ currently showing catch varying between 250,000 Metric tons and 340,000 Metric tons depending on the year, while the production for the entire Seychelles’ EEZ should be around 70,000 Mt.
7. Show the FEIU tool to someone familiar with the Seychelles tuna industry to help identify other inconsistent data.
Once those issues have been addressed, the FEIU tool’s dashboards should be better calibrated and therefore able to reflect any variations in activities, expenses and contributions of the tuna fishery sector between years, without having to rely on extrapolating estimates from the 2011 World Bank model. It will also be possible to generate more economic indicators currently unavailable due to the lack of data.
7 The visit to Seychelles lasted 11 days from which only 8 days were actually working days.
Table 24 Share of tuna fishing and related activities in port’s activity (turnover, taxes) in SCR.
Source: SFA, SPA
NB: No information was found in the FEIU database related to the following:
§ Employment
§ International fish trade
36 Supporting the improvement of marine fisheries governance and management in seychelles 37
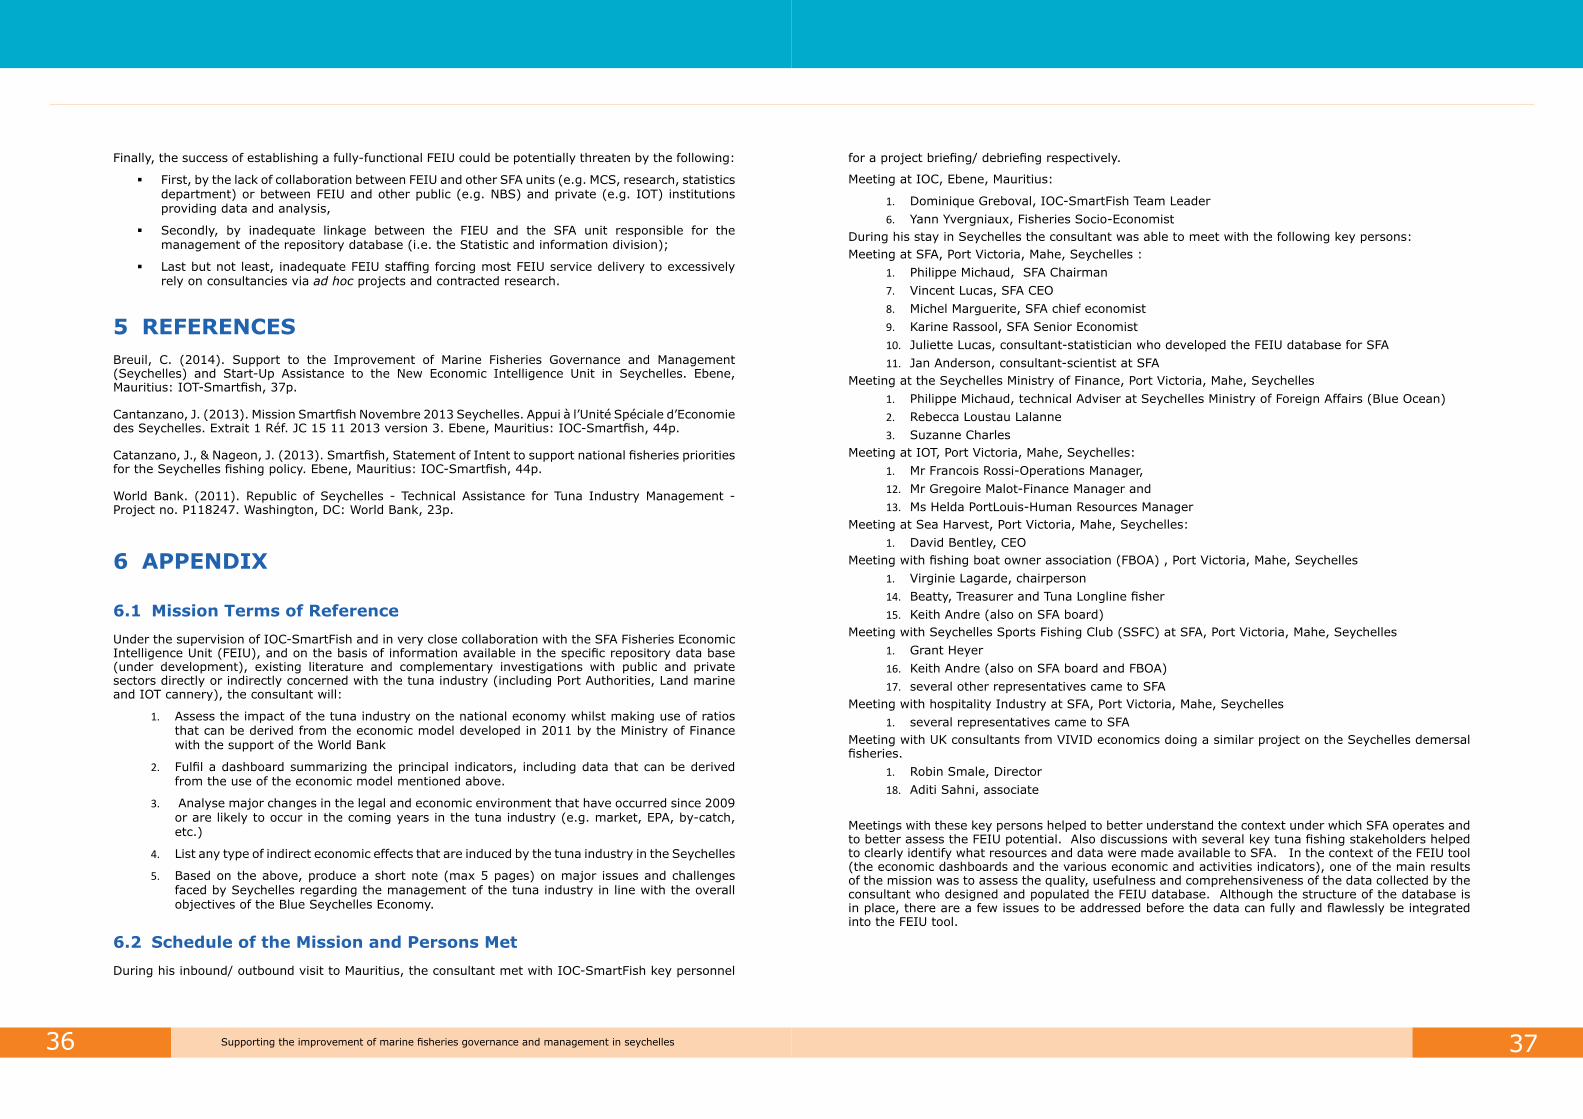
for a project briefing/ debriefing respectively.
Meeting at IOC, Ebene, Mauritius:
1. Dominique Greboval, IOC-SmartFish Team Leader6. Yann Yvergniaux, Fisheries Socio-Economist
During his stay in Seychelles the consultant was able to meet with the following key persons:Meeting at SFA, Port Victoria, Mahe, Seychelles :
1. Philippe Michaud, SFA Chairman7. Vincent Lucas, SFA CEO8. Michel Marguerite, SFA chief economist9. Karine Rassool, SFA Senior Economist10. Juliette Lucas, consultant-statistician who developed the FEIU database for SFA11. Jan Anderson, consultant-scientist at SFA
Meeting at the Seychelles Ministry of Finance, Port Victoria, Mahe, Seychelles1. Philippe Michaud, technical Adviser at Seychelles Ministry of Foreign Affairs (Blue Ocean)2. Rebecca Loustau Lalanne3. Suzanne Charles
Meeting at IOT, Port Victoria, Mahe, Seychelles: 1. Mr Francois Rossi-Operations Manager, 12. Mr Gregoire Malot-Finance Manager and 13. Ms Helda PortLouis-Human Resources Manager
Meeting at Sea Harvest, Port Victoria, Mahe, Seychelles:1. David Bentley, CEO
Meeting with fishing boat owner association (FBOA) , Port Victoria, Mahe, Seychelles1. Virginie Lagarde, chairperson14. Beatty, Treasurer and Tuna Longline fisher15. Keith Andre (also on SFA board)
Meeting with Seychelles Sports Fishing Club (SSFC) at SFA, Port Victoria, Mahe, Seychelles1. Grant Heyer16. Keith Andre (also on SFA board and FBOA)17. several other representatives came to SFA
Meeting with hospitality Industry at SFA, Port Victoria, Mahe, Seychelles1. several representatives came to SFA
Meeting with UK consultants from VIVID economics doing a similar project on the Seychelles demersal fisheries.
1. Robin Smale, Director18. Aditi Sahni, associate
Meetings with these key persons helped to better understand the context under which SFA operates and to better assess the FEIU potential. Also discussions with several key tuna fishing stakeholders helped to clearly identify what resources and data were made available to SFA. In the context of the FEIU tool (the economic dashboards and the various economic and activities indicators), one of the main results of the mission was to assess the quality, usefulness and comprehensiveness of the data collected by the consultant who designed and populated the FEIU database. Although the structure of the database is in place, there are a few issues to be addressed before the data can fully and flawlessly be integrated into the FEIU tool.
Finally, the success of establishing a fully-functional FEIU could be potentially threaten by the following:
§ First, by the lack of collaboration between FEIU and other SFA units (e.g. MCS, research, statistics department) or between FEIU and other public (e.g. NBS) and private (e.g. IOT) institutions providing data and analysis,
§ Secondly, by inadequate linkage between the FIEU and the SFA unit responsible for the management of the repository database (i.e. the Statistic and information division);
§ Last but not least, inadequate FEIU staffing forcing most FEIU service delivery to excessively rely on consultancies via ad hoc projects and contracted research.
5 REFERENCESBreuil, C. (2014). Support to the Improvement of Marine Fisheries Governance and Management (Seychelles) and Start-Up Assistance to the New Economic Intelligence Unit in Seychelles. Ebene, Mauritius: IOT-Smartfish, 37p.
Cantanzano, J. (2013). Mission Smartfish Novembre 2013 Seychelles. Appui à l’Unité Spéciale d’Economie des Seychelles. Extrait 1 Réf. JC 15 11 2013 version 3. Ebene, Mauritius: IOC-Smartfish, 44p.
Catanzano, J., & Nageon, J. (2013). Smartfish, Statement of Intent to support national fisheries priorities for the Seychelles fishing policy. Ebene, Mauritius: IOC-Smartfish, 44p.
World Bank. (2011). Republic of Seychelles - Technical Assistance for Tuna Industry Management - Project no. P118247. Washington, DC: World Bank, 23p.
6 APPENDIX
6.1 Mission Terms of ReferenceUnder the supervision of IOC-SmartFish and in very close collaboration with the SFA Fisheries Economic Intelligence Unit (FEIU), and on the basis of information available in the specific repository data base (under development), existing literature and complementary investigations with public and private sectors directly or indirectly concerned with the tuna industry (including Port Authorities, Land marine and IOT cannery), the consultant will:
1. Assess the impact of the tuna industry on the national economy whilst making use of ratios that can be derived from the economic model developed in 2011 by the Ministry of Finance with the support of the World Bank
2. Fulfil a dashboard summarizing the principal indicators, including data that can be derived from the use of the economic model mentioned above.
3. Analyse major changes in the legal and economic environment that have occurred since 2009 or are likely to occur in the coming years in the tuna industry (e.g. market, EPA, by-catch, etc.)
4. List any type of indirect economic effects that are induced by the tuna industry in the Seychelles
5. Based on the above, produce a short note (max 5 pages) on major issues and challenges faced by Seychelles regarding the management of the tuna industry in line with the overall objectives of the Blue Seychelles Economy.
6.2 Schedule of the Mission and Persons MetDuring his inbound/ outbound visit to Mauritius, the consultant met with IOC-SmartFish key personnel

38 Supporting the improvement of marine fisheries governance and management in seychelles 39
Tasks Start Date End date Place
Travel back to Mauritius (Ebene) from Seychelles (Mahe Island)
Sat 16/05/2015
Sat 16/05/2015
Debriefing meeting at IOC- SmartFish Dominique Greboval, Yann Yvergniaux
Mon 18/05/2015
Mon 18/05/2015
Mauritius (Ebene)
Travel back from Mauritius to South Africa (Cape Town)
Thu 21/05/2015
Thu 21/05/2015
Development of a functional SFA -FEIU tool and final report writing
Mon 25/05/2015
Thu 25/06/2015
South Africa (Cape Town)
6.3 Tuna Industry’s Primary Added Values Calculation (2009-2013)
The Summary tables below were generated by the SFA-FEIU tool developed by Philippe Lallemand and are based on the 2011 World Bank (WB) model. The 2011 WB economic model (using data from 2009) gave an estimate of the Primary Value Added (PVA) not including transfer pricing at SCR 557.4 million (US$ 40.8 million). Our estimates for 2009 are SCR 585.63 million (US$ 43 million at the exchange rate of SCR 13.6/ US$ as reported in the SFA-FEIU database for 2009) (Table 26). The 2010 PVA was estimated at SCR 558.6 (US$ 46.54 at the exchange rate of SCR 12/ US$ as reported in the SFA-FEIU database for 2010) or a decrease of -4.6% when expressed in SCR (but a corresponding increase of 8.1% when expressed in US$) (Table 27). The PVA for the following years were estimated at SCR 639.15 (US$52.11 at SCR 12.26/ US$) or an increase of +14.4% (w.r.t. SCR) & +12% (w.r.t. US$) in 2011 (Table 28), SCR 701.7 (US$ 51.81 at SCR 13.54/ US$) or an increase of +9.8% (w.r.t. SCR) & decrease of -0.6% (w.r.t. US$) in 2012 (Table 29) and SCR 770.90 (63.99 at SCR 12.05/ US$) or an increase of +9.9% (w.r.t. SCR) & +23.5% (w.r.t. US$) in 2013 (Table 30).
Note that with the SFA-FEIU tool, all added values can be expressed in 3 currencies, Seychelles Rupee (SCR), US Dollars (US$) or Euro (€). The following tables showing the DVA, IVA and PVA estimates are expressed in the local currency (SCR)
Table 25 Schedule of the mission
Tasks Start Date End date Place
Travel to Mauritius (Ebene) from South Africa (Cape Town)
Sun 3/05/2015
Sun 3/05/2015
Inbound Visit to IOC (Ebene, Mauritius) Dominique Greboval and Yann Yvergniaux
Mon 4/05/2015
Tue 5/05/2015
Mauritius (Ebene)
Travel to Seychelles (Mahe Island) from Mauritius Tue 5/05/2015
Tue 5/05/2015
AM: Meet SFA staff in Port Victoria Vincent Lucas (CEO), Michel Marguerite (chief econo-mist), Karine Rassool (Senior Economist), Juliette Lucas (consultant-statistician), Jan Anderson (consultant-scientist) PM: Meeting at Ministry of Finance Philippe Michaud, technical Adviser at Seychelles Min-istry of Foreign Affairs (Blue Ocean)
Wed 6/05/2015
Wed 6/05/2015
Seychelles (Port Victo-ria)
Meeting with local processor David Bentley, Sea Harvest (CEO)
Thu 7/05/2015
Thu 7/05/2015
Seychelles (Port Victo-ria)
AM: Meeting w/ Recreation industry and Fishermen & boat owner association (FBOA) Grant Heyer, Keith Andre (SFA & FBOA board) + 3 oth-er representatives PM: Meeting with hospitality industry (3 representa-tives)
Fri 8/05/2015
Fri 8/05/2015
Seychelles (Port Victo-ria)
Review meeting notes Sat 9/05/2015
Sun 10/05/2015
Seychelles (Port Victo-ria)
Meeting with fishermen & boat owner association (FBOA) Virginie Lagarde (chairperson), Beatty (Treasurer and Tuna semi-indistrial Longliner fisher)
Mon 11/05/2015
Mon 11/05/2015
Seychelles (Port Victo-ria)
Project debriefing. Meeting with Christophe Breuil (IOC-SmartFish lead consultant)
Tue 12/05/2015
Tue 12/05/2015
Seychelles (Port Victo-ria)
Meeting at Seychelles Ministry of Finance Philippe Michaud (technical Adviser at Seychelles Ministry of Foreign Affairs & Blue Ocean), Rebecca Loustau Lalanne, Suzanne Charles and several SFA staff
Wed 13/05/2015
Wed 13/05/2015
Seychelles (Port Victo-ria)
Wrap up meeting at SFA. Presentation of Concept SFA-FEIU Tool + discussion All SFA interested parties + Philippe Michaud
Thu 14/05/2015
Thu 14/05/2015
Seychelles (Port Victo-ria)
Meeting at Indian Ocean Tuna (IOT) with Juliette Lucas (SFA) and head of SFA stats department Mr Francois Rossi (Operations Manager) , Mr Gregoire Malot (Finance Manager), and Ms Helda PortLouis (Hu-man Resources Manager)
Fri 15/05/2015
Fri 15/05/2015
Seychelles (Port Victo-ria)
40 Supporting the improvement of marine fisheries governance and management in seychelles 41
Table 27 2010 Primary Added value calculation (SCR)Table 26 2009 Primary Added value calculation (SCR)

42 Supporting the improvement of marine fisheries governance and management in seychelles 43
Table 29 2012 Primary Added value calculation (SCR)Table 28 2011 Primary Added value calculation (SCR)

44 Supporting the improvement of marine fisheries governance and management in seychelles 45
6.4 Technical Appendix regarding the “FEIU Tool”
6.4.1 Overview
The FEIU tool was developed by the consultant in MS Excel 20138 consisting of a Workbook dynamically linked to the FEIU MS Access database developed by Juliette Lucas for SFA. The FEIU tool and the MS Access database are currently available for download from Dropbox (link available from IOC-SmartFish upon request)
The FEIU tool is composed of a brief instruction sheet, two dashboards (an historical and a simulation one) and several interactive pivot tables and pivot charts. The instruction sheet, the two dashboards as well as the pivot tables and charts can easily be accessed through a menu on the Excel Ribbon (on the Ribbon’s right hand side), under the menu option labelled “SFA-FEIU” (as shown below):
Or by right-clicking on any portion of any of the sheet’s working area which will trigger a popup menu (as shown herein on the right-hand side).
The pivot tables and charts are dynamically linked in ”real-time” to the FEIU database and as such, can be refreshed at any time to reflect data newly entered in the FEIU database. The tool also comprises 2 economic dashboards, an historical-dashboard and a simulation dashboard. At the time of writing, the historical dashboard gathers data collected between 2009 and 20139; this will evolve as more data are being added to the FEIU database. At the moment, the simulation dashboard is used to simulate scenarios under various economic conjectures (inflation, exchange rates) and fishing fleet composition (number of purse seiners by country). The tool can easily be expanded to include additional economic indicators and other performance indicators which could be provided through the FEIU database.
8 The FEIU tool was also tested successfully with MS Excel version 2007 and 2010.9 Data for 2014 and 2015 are still incomplete and therefore were not included in the analysis
Table 30 2013 Primary Added value calculation (SCR)

46 Supporting the improvement of marine fisheries governance and management in seychelles 47
5. tuna imports/ exports to/ from Seychelles in local (i.e. Rupees) of foreign currency
6. Main economic indicators (CPI, GDP, Exchange rates,…)
7. Management data (number of registered vessels by activity, licensing and financial contribution to the tuna fishery sector).
The individual pivot tables and charts can be accessed through the submenus either from the Excel Ribbon as shown above, or through the popup menu (see example herein on the right hand side for the Catch-Effort menu and submenus).
All the data generated through the FEIU’s pivot table and charts come from the linked FEIU MS Access database covering years as early as 2000 and as recent as 2015, although the last 2 years are incomplete. The FEIU pivot tables and charts can be used to identify gaps in the data especially incomplete sets of data covering the more recent years.
6.4.2 The FEIU tool’s dynamic pivot tables and pivot charts At the time of writing, the FEIU tool which is still under development, consists of 24 pivot tables with, for most of them, a corresponding pivot chart grouped into 7 main categories (showing below each category, how to access the tables and charts from the Ribbon):
1. Historical and Simulation Dashboards
2. tuna catch-effort, landing, transhipment and ex-vessel prices information by species/ vessel/ fishery/ country
3. tuna vessel production (tuna production onboard of vessels)
4. port10 activities related to the tuna fishing industry (port expenditures, containers and vessel activity)
10 Port of Victoria, Mahe, Seychelles

48 Supporting the improvement of marine fisheries governance and management in seychelles 49
1. Data year of simulation
The data year of reference to calibrate the data in the simulation. By checking the “All Default” box, the data used in the simulation are reset to their observed value for that year (Exchange rates, CPI, fleet and number of plants).
2. Currency
The user can select a currency to be used to represent the data displayed in the simulation dashboard. Currently there are 3 possible currencies to be chosen from: Seychelles Rupee (SCR) US Dollar (US$) and Euro (€). The data thus displayed will reflect the exchange rate as defined by the slider relevant to the selected currency, either using the default value if the “Default” box is checked or applying the value indicated by the slider if the “Default” box is unchecked.
3. Exchange rate
The user can define 2 exchange rates, SCR vs US Dollar and SCR vs Euro by using the slider to increase (moving the slider to the right) or decrease (moving the slider to the left) the exchange rate. By checking the “Default” box under the relevant slider, the data calculation for the simulation will be based on the observed exchange rate for the data year of simulation. The exchange rate for a given currency will not only affect the conversion factor for the data displayed in that currency, but some internal computation as well even if the corresponding currency is not selected. In other words, although the data might be expressed in SCR, some revenues and expenses might be paid in one of the 2 foreign currencies and thus would be affected by a change in exchange rates.
4. Inflation based on the Consumer Price Index (CPI)
The inflation factor is only relevant here because we based some of our estimates on the World Bank (2009) report which needed to be adjusted for the subsequent years to reflect the level of inflation in Seychelles. The default value (when the “default” box is checked) reflects the inflation level for the data year of simulation. The user may override the default value by increasing (moving the slider to the right) or decreasing (moving the slider to the left) the inflation index (the base year is 2009).
5. Fleet size by country and type
If the “default” box is checked under each category representing the fleet size by country/ vessel type, the dashboard will simulate the data based on the known fleet size for the data year of simulation. The user can override the default values in some or all the categories by increasing (moving the slider to the right) or decreasing (moving the slider to the left) the fleet size. In other words, the user may
6.4.3 The FEIU tool’s Dashboards
The information generated by the dashboards is based on data coming from 2 main sources:
1. Estimates from the original 2011 World Bank (WB) model using 2009 data. The 2011 WB model was used essentially to fill up the data gaps identified in the FEIU database and pertaining to the following sectors:
a. The local processing sector (IOT): operating expenses, employment data, investment and other relevant financial information.
b. The harvesting sector fishing in the Seychelles EEZ: operating expenses, employment data, investment and other relevant financial contributions from the EU based on fisheries trade agreement (FTA) signed with the Seychelles to allow European flagged vessels to operate in the their EEZ.
2. Data currently collected in the FEIU database:
a. Licenses paid by foreign vessels which allow them to fish in Seychelles water
b. Expenses related to port activities such as fees and port charges, stevedoring expenses, bunkering, etc.
c. Economic indicators such as annual CPIs and Exchange rates
Both dashboards can be accessed through the Ribbon or popup menus as shown herein on the right hand side.
The FEIU dashboards were used not only to simulate recent contributions of the Tuna industry to the Seychelles economy but also to compare and contrast trends in the industry throughout the years (2009 to 2013). When specific data were unavailable in the FEIU database, the missing data were either extrapolated from the 2011 WB model or from ad hoc sources (internet search and personal communication).
Data taken from the 2011 WB model, when relevant, were adjusted to reflect annual variations in exchange rate and inflation. The data on annual exchange rates and inflation related to fishing activity in Seychelles (CPI11 fish product) were taken directly from the FEIU database. Also some expenses from the 2011 WB model were calibrated to reflect the level of activity for the year being simulated based on the number of active fishing vessels and the corresponding estimated number of crew. However, some other activities not specifically identified in the scenarios such as container movements should also be integrated to improve the simulation capabilities of the tool. Based on a specific year, the FEIU tool can not only simulate a variety of exchange and inflation rates, it can also make assumptions on the fleets’ sizes and their composition between vessel types (Industrial Longliners versus Purse Seiners).
11 A producer price index (PPI) would have been more appropriate to simulate/ extrapolate some of the data.

50 Supporting the improvement of marine fisheries governance and management in seychelles 51
Table 31 Interactive Pivot table generated by the FEIU tool showing the number of active vessels by year, fishery, gear type, and country of origin
change the purse seiners’ fleet size for 5 different countries and one “other” purse seiners’ category. The industrial long liners’ fleet size (all countries combined) can also be changed.
6. Number of processing plants
If the “default” box is checked, only one (IOT) processing plant will be taken into account in the simulation. The user may override the default value by increasing (moving the slider to the right) or decreasing (moving the slider to the left) the number of tuna processing plants in Port Victoria.
7. All default value
If the “All default” value is checked, each value will be reset to its default value as observed in the data year used in the simulation.
6.4.4 Example of FEIU tool’s Pivot Tables and Pivot Charts
Most categories of information presented in the FEIU tool can be presented either as a dynamic pivot table or as the corresponding pivot chart. The underlying data are linked to the FEIU MS Access database which can be refreshed on demand.
The information to display can be filtered by following the standard protocol for MS Excel pivot tables and pivot charts (See MS Excel Help for more information). The following table and figures show examples of a pivot table (Table 31) and several pivot charts (Figure 1 to Figure 4) that can be found in the FEIU tool.
It is important to note that a portion of the data generated in the dashboards are linked to several pivot tables and therefore filtering out some information in those tables will affect the data generated in the dashboards. An improvement of the FEIU tool would be to isolate a duplicate version of the Pivot tables used to generate the dashboard data to bypass such limitation.

52 Supporting the improvement of marine fisheries governance and management in seychelles 53
Figure 2 IOT Containers movement (in versus out) in Port Victoria between 2009 and 2013Figure 1 Interactive Pivot chart generated by the FEIU tool showing Purse Seiners’ annual expenditures by country and type while in the Port of Victoria, Seychelles between 2009 and 2013

54 Supporting the improvement of marine fisheries governance and management in seychelles 55
Figure 4 2013 estimates of the Tuna industry’s Direct and Indirect Added value by category of contribution, activity type and country
Figure 3 Licence fees comparison (Industrial Longliners versus Purse Seiners) by country between 2009 and 2013

56 Supporting the improvement of marine fisheries governance and management in seychelles 57
6 Erroneous or inconsistent data: This is a problem area which is harder to address as errors are being identified mostly from calculation in the FEIU tool. However as soon as errors are being identified, the FEIU database can be corrected immediately. For example the total Tuna catch in the Seychelles EEZ was inconsistent with the reported FAO catch by several folds raising the suspicion that the data was incorrectly incorporating catch outside the EEZ.
7 Labelling errors: these labels are used to identify categories, groups, etc. I identified a few instances in which the label was incorrectly spelt leading to the data being left out of a category with the corresponding label using the right spelling. This can be a problem when the data is being accessed remotely through a Pivot table while querying specific labels. However this issue is easily fixed by correcting the spelling mistake. We note that although the database has a tracking error mechanism in place where labels can only be selected from a predefined list, this did not stop some of the label from being incorrectly entered.
6.5 Issues identified in the FEIU Repository DatabaseThe following points describe problem areas found in the FEIU database and identified by the consultant.
The issues identified were:
1 Inconsistency in the data measurement within a same table: switching between different currencies, different scale (units, thousands, millions,…) or different types of measurement altogether (currency vs. percentage). This creates a problem especially when comparing or aggregating data with different measurement units. This problem can easily be addressed by standardising similar data using the same unit.
2 Data expressed in foreign currencies: similarly to point 1, to avoid inconsistency in data measured in monitory terms within a same table we suggest adding a field where data expressed in a foreign exchange currency would also be expressed in the local currency (SCR or Seychelles rupees) using the annual or monthly (when relevant) average exchange rate for the conversion.
3 Data sourcing: There are few conflicts in the data reported in the FEIU database compared with the same data reported by internationally recognized data repositories: for example the data on exchange rates do not match the values reported by the United Nations (see the UN Monthly Bulletin of Statistics Online). Moreover, I could not find the source used to collect the data on exchange rates. For example, the exchange rates used by the World Bank in their 2009 Model is different from the ones used in the FEIU tool leading to small discrepancies between the 2 results. Also the reported annual GDP for Seychelles at current prices is different from the GDP as reported by the World Bank (see World Development Indicators, Gross Domestic Product from Google). Although it is acknowledged that the discrepancy might be an artefact caused by the exchange rate used in the conversion since the GDP values reported by Google are in US dollars.
4 Incomplete or missing data within a table: for example ex-vessel prices data by tuna species are inadequate covering only few species for few months over a 2 year period (2013 and 2014). Another problem (see point 2) is that the available prices are expressed in either Euro or SCR. Furthermore, the overall GDP for 2013 is absent while the GDP for 2013 covering the fisheries sector is present in the database.
5 Missing tables:
a. Data regarding tuna processing activities: there are no data pertaining to tuna processing activity in Seychelles (IOT) although we engaged with IOT who indicated their willingness to provide SFA with the required data which they currently report to the Seychelles National Bureau of Statistics (NBS). However, the final approval must come from MW brand headquarters. We are still waiting to hear back from IOT.
b. Data regarding employment in the Tuna fishing sector: no data has been collected. The only data available through NBS has been aggregated by primary sectors.
c. Economic indices: such as unemployment rates (by sector if available), Producer price Index (all sectors, fishery sector if available, by primary sector such as harvesting, manufacturing, ...)
d. Trade data which could be useful to compare the competitiveness of the tuna products exported from Seychelles vis-à-vis the rest of the world (see UN Comtrade and ITC data).


Blue Tower, 5th floor, Rue de l’InstitutEbene, Mauritius
Tel: (+230) 402 61 00Fax: (+230) 466 01 60
www.coi-ioc.orgwww.smartfish-coi.org
IOC-SmartFish is a regional fisheries programme managed by the Indian Ocean Commission, funded by the European Union and co-implemented by the Food and Agriculture Organization of the United Nations. IOC-SmartFish, which operates in twenty countries throughout the Indian Ocean Region, Southern and Eastern Africa, focuses on fisheries governance, management, monitoring control and surveillance, trade, and food security.