Supporting the British economy through teaching English … · Supporting the British economy...
40
November 2015 Supporting the British economy through teaching English as a foreign language An assessment of the contribution of English language teaching to the United Kingdom economy A report by Capital Economics for English UK Justin Chaloner Andrew Evans Mark Pragnell
Transcript of Supporting the British economy through teaching English … · Supporting the British economy...
November 2015
Supporting the British economy through teaching English as a foreign language
An assessment of the contribution of English language teaching to the United Kingdom economy
A report by Capital Economics for English UK
Justin Chaloner Andrew Evans Mark Pragnell
This report was commissioned by English UK’s late chief executive, Eddie Byers, who understood the signifi cance of amassing robust information about the UK ELT sector in order to put forward the industry’s case with opinion-formers and Government.
English UK would like to thank our member centres and other accredited English language centres who took the time to contribute to this report, and Capital Economics for their detailed work.
On behalf of
Produced by
Capital Economics Limited150 Buckingham Palace Road, London SW1W 9TRwww .capitaleconomics .comRegistered offi ce: as above . Registered in England No . 2484735 VAT No . GB 713 8940 25
English UK219 St John Street, London EC1V 4LY, United Kingdom+44 20 7608 7960 | www .englishuk .com | info@englishuk .com
English UK 1
Contents
Disclaimer . . . . . . . . . . . . . . . . . . . . . . . . . . . . . . . . . . . . . . . . . . . . . . . . . . . . . . . . . . . . . . . . . . . . . . . 03
Foreword . . . . . . . . . . . . . . . . . . . . . . . . . . . . . . . . . . . . . . . . . . . . . . . . . . . . . . . . . . . . . . . . . . . . . . . 04
Key findings . . . . . . . . . . . . . . . . . . . . . . . . . . . . . . . . . . . . . . . . . . . . . . . . . . . . . . . . . . . . . . . . . . . . . 05
Introduction and summary . . . . . . . . . . . . . . . . . . . . . . . . . . . . . . . . . . . . . . . . . . . . . . . . . . . . . . . . . . . 06
Background and context . . . . . . . . . . . . . . . . . . . . . . . . . . . . . . . . . . . . . . . . . . . . . . . . . . . . . . . . . . . . 08
Direct contribution of the centres . . . . . . . . . . . . . . . . . . . . . . . . . . . . . . . . . . . . . . . . . . . . . . . . . . . . . 11
Knock-on impact of the centres . . . . . . . . . . . . . . . . . . . . . . . . . . . . . . . . . . . . . . . . . . . . . . . . . . . . . . . 16
Students’ contribution to the economy . . . . . . . . . . . . . . . . . . . . . . . . . . . . . . . . . . . . . . . . . . . . . . . . . . 20
Post-study impact of the English language students . . . . . . . . . . . . . . . . . . . . . . . . . . . . . . . . . . . . . . . . 30
Overall impact . . . . . . . . . . . . . . . . . . . . . . . . . . . . . . . . . . . . . . . . . . . . . . . . . . . . . . . . . . . . . . . . . . . . 33
Appendix: Methodology . . . . . . . . . . . . . . . . . . . . . . . . . . . . . . . . . . . . . . . . . . . . . . . . . . . . . . . . . . . . . 35
Supporting the British economy through teaching English as a foreign languageAn assessment of the contribution of English language teaching to the United Kingdom economy

English UK 3
DisclaimerThis report has been commissioned by English UK . The views expressed remain those of Capital Economics and are not necessarily shared by English UK . Likewise, Capital Economics does not necessarily share the views of those who have commissioned this report .
The report is based on analysis by Capital Economics of information available in the public domain, together with a survey of English language teaching centres . Where survey data are employed, it is clearly stated in the report .
While every effort has been made to ensure that the data quoted and used for the research behind this document is reliable, there is no guarantee that it is correct, and Capital Economics Limited and its subsidiaries can accept no liability whatsoever in respect of any errors or omissions . This document is a piece of economic research and is not intended to constitute investment advice, nor to solicit dealing in securities or investments .
AcknowledgmentsWe wish to acknowledge and thank those organisations that gave their time to help provide the data used in this report and without which it would not have been possible .
4 Capital Economics
Foreword
The UK has been teaching English to the world for well over a century, but this report is the first serious attempt to quantify the value of our sector in economic, employment and other beneficial ways .
As chair of industry body English UK, I am pleased that Capital Economics’ research shows English Language teaching (ELT) must not be underestimated, bringing £1 .2bn in export revenue and supporting 26,000 jobs throughout the UK .
It shows that every student who comes here to improve their English and experience our culture is worth £378 per week, bringing £1 .1 billion of added value to the economy last year and contributing £194 million to the exchequer .
They keep tens of thousands of people in jobs, from highly-skilled teachers, textbook writers and administrators, to taxi drivers, shopkeepers and cafe owners . For thousands of families, hosting students in their spare bedroom is both a financial lifeline and a way of meeting interesting young people from all over the world .
The unquantifiable benefits are even more important in a world interconnected as never before . Over 650,000 students studied English here last year: they return home with happy and positive memories of their time in the UK, influencing friends, family, colleagues - and in the case of many who are high-flyers, bringing soft power benefits .
Why are we producing this report now, a century after the first accredited English school opened in London? Because our once world-beating industry is shrinking, and it is time for us to highlight its worth as part of our campaign to get the Government and opinion-formers working to help us grow for the UK economy . Competitor destinations which are thriving have more Government support, not least in visa matters .
So we ask that our Government works with us to bring more export income and jobs to the UK by recognising that students are not migrants - a status which means they are dragged into the rhetoric of the immigration debate - and to improve the visa rules . We also call for politicians and opinion-formers to work with us to promote UK ELT globally, making students feel welcome and also to fully recognise the educational excellence achieved in our sector .
Our students are some of the most aspirational people in the world: some are teenagers on holiday courses, some are adults improving their language skills to work in a world where business speaks English . In between there are many students for whom improving their English is a first step to further UK study at one of our colleges or universities .
If the UK sends out a message that these students are not welcome, then they take those first steps to study - and all subsequent steps - elsewhere and are lost to us forever . It is time to support our industry .
Steve Phillips Chair English UK
English UK 5
Key findings
Key findings:
• Around 650,000 students studied English as a foreign language in the United Kingdom at more than 550 accredited institutions in 2014
• Overall, the industry supported around 26,500 jobs in the United Kingdom through its supply chain, employee and student spending, and its direct teaching activity
• The sector added approximately £1 .1 billion of value to the economy over the year, or an average of £378 per student for each week they stay
• The total value of international English language students’ spending, including tuition fees, accommodation and other living costs, added £1 .2 billion to United Kingdom export revenues in 2014
• The students bring in more money for the government than they take out through their use of public services . They contributed a net £194 million to the exchequer through studying here, or £65 for each week they stayed in 2014
• In addition to net contribution we have modelled, there are likely to be other positive impacts that are more difficult to quantify . Students can continue to contribute to the British economy when they return to their home country; they may be more likely to do business with the United Kingdom in the future, or return as a visitor, as a result of studying here
Capital Economics has been commissioned by English UK to evaluate the contribution of teaching English as a foreign language to the United Kingdom economy.
6 Capital Economics
1 . Introduction and summary
Capital Economics has been commissioned by English UK to evaluate the contribution of teaching English as a foreign language to the United Kingdom economy .
English has become the dominant language for international business, science and academia . It is spoken at a useful level by one in every four people worldwide . The removal of language barriers boosts international trade and enhances the prospects for businesses and individuals . More than 1 .4 million students worldwide studied English outside their home country in 2014, with over a third of these choosing to come to the United Kingdom . (See chapter 2 .)
There are more than 550 accredited English language centres in the United Kingdom including private and state institutions, specialist language schools, further education colleges, universities and summer language camps .
In total, the centres turned over a combined £1 .1 billion in 2014, with £0 .7 billion of their revenues generated directly from the teaching of English . They provided the equivalent of 9,300 full-time jobs and employed around 12,100 people after taking into account part-time arrangements . Their activities added almost £400 million of value to the British
economy and generated in the order of £94 million in taxes in 2014 . (See chapter 3 .)
The economic value of English language centres does not stop with their direct activities . They stimulate economic activity through their purchases from domestic suppliers to support their teaching activities .
In addition, they support jobs and value creation through employees spending their income in Britain . We estimate that the centres and their employees spent over £500 million in 2014, supporting more than 8,000 jobs and nearly £350 million of gross value added . This gives a jobs multiplier of 1 .9; for every ten direct jobs, a further nine are supported in the wider economy . The benefits are spread across the country and through a range of industries . (See chapter 4 .)
On top of the contribution of the centres, the international students who come to study English bring benefits to the United Kingdom economy . Around 650,000 students study on English language courses across the United Kingdom each year, staying for 4 .6 weeks on average . The majority come from Europe, with over a quarter from Italy alone .1
1 In this report we use ‘Europe’ to mean those countries that are members of the European Union plus Iceland, Liechtenstein, Norway and Switzerland .
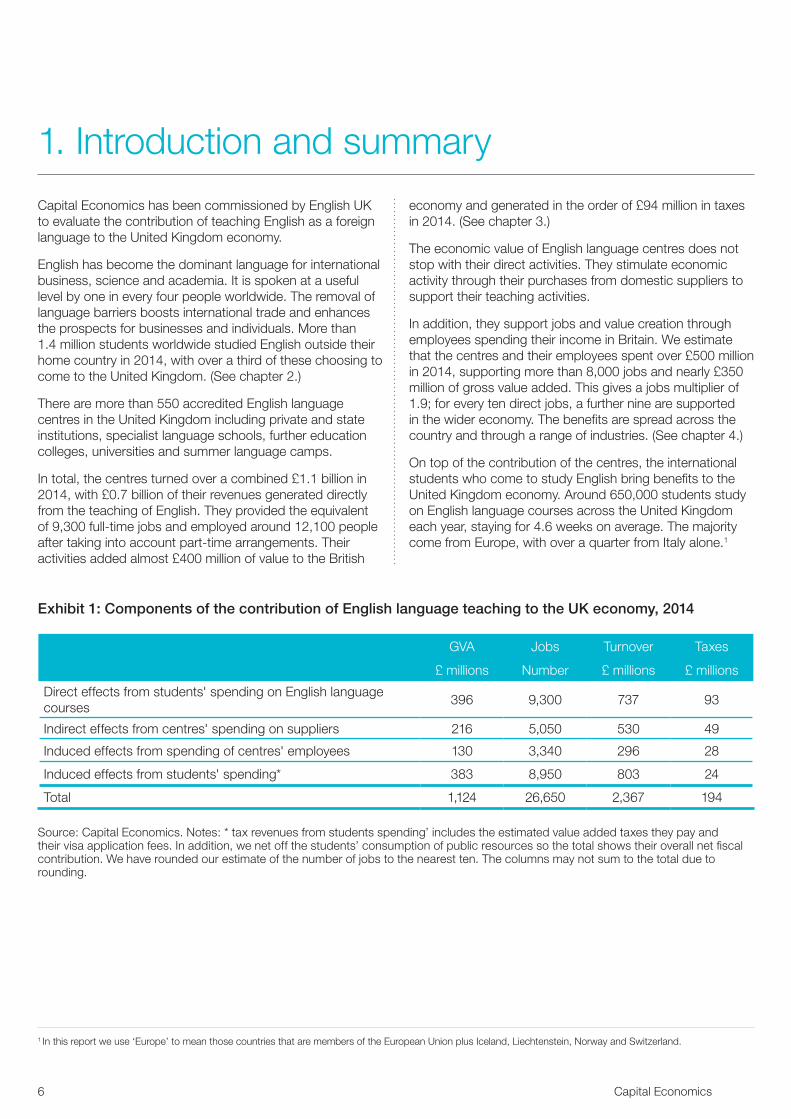
Exhibit 1: Components of the contribution of English language teaching to the UK economy, 2014
GVA Jobs Turnover Taxes
£ millions Number £ millions £ millions
Direct effects from students' spending on English language courses
396 9,300 737 93
Indirect effects from centres' spending on suppliers 216 5,050 530 49
Induced effects from spending of centres' employees 130 3,340 296 28
Induced effects from students' spending* 383 8,950 803 24
Total 1,124 26,650 2,367 194
Source: Capital Economics . Notes: * tax revenues from students spending’ includes the estimated value added taxes they pay and their visa application fees . In addition, we net off the students’ consumption of public resources so the total shows their overall net fiscal contribution . We have rounded our estimate of the number of jobs to the nearest ten . The columns may not sum to the total due to rounding .
English UK 7
The students spent over £450 million in addition to the fees and payments to their centres in 2014, supporting 9,000 jobs and £383 million of gross value added across the country . They bring in more money for the government than they take out through their use of public services . They pay tax when they buy goods or services, support the taxes paid by the centres and their employees and students from outside Europe pay fees for their visa .
Overall they contributed a net £194 million to the exchequer through studying here, or £65 for each week a student stays in the United Kingdom . Meanwhile, the total value of international English language students’ spending, including tuition fees, accommodation and other living costs added £1 .2 billion to United Kingdom export revenues . (See chapter 5 .)
Some students have an impact on the United Kingdom economy after they complete their course . The majority, some 81 per cent, return to their home country . This means they have no direct fiscal or economic impact, but may contribute to the economy as they are more likely to do business with, or return as a visitor to, the United Kingdom
in the future as a result of studying here . Of those that stay, three-quarters (or 14 per cent of the total) go on to further study supporting the further and tertiary education sectors and generating more export income for the economy . Of the remainder, almost all remain to take up employment . (See chapter 6 .)
Overall, teaching English to international students adds £1 .1 billion of value to the economy or £378 for each week a student stays in the United Kingdom . It supports around 26,500 jobs and, after taking into account students’ use of public services, generates more than £194 million of net tax revenues for the government .
The economic activity sustained by the sector means that for every direct job, a further two are supported in the wider economy . (See Exhibit 1, Exhibit 2 and chapter 7 .)
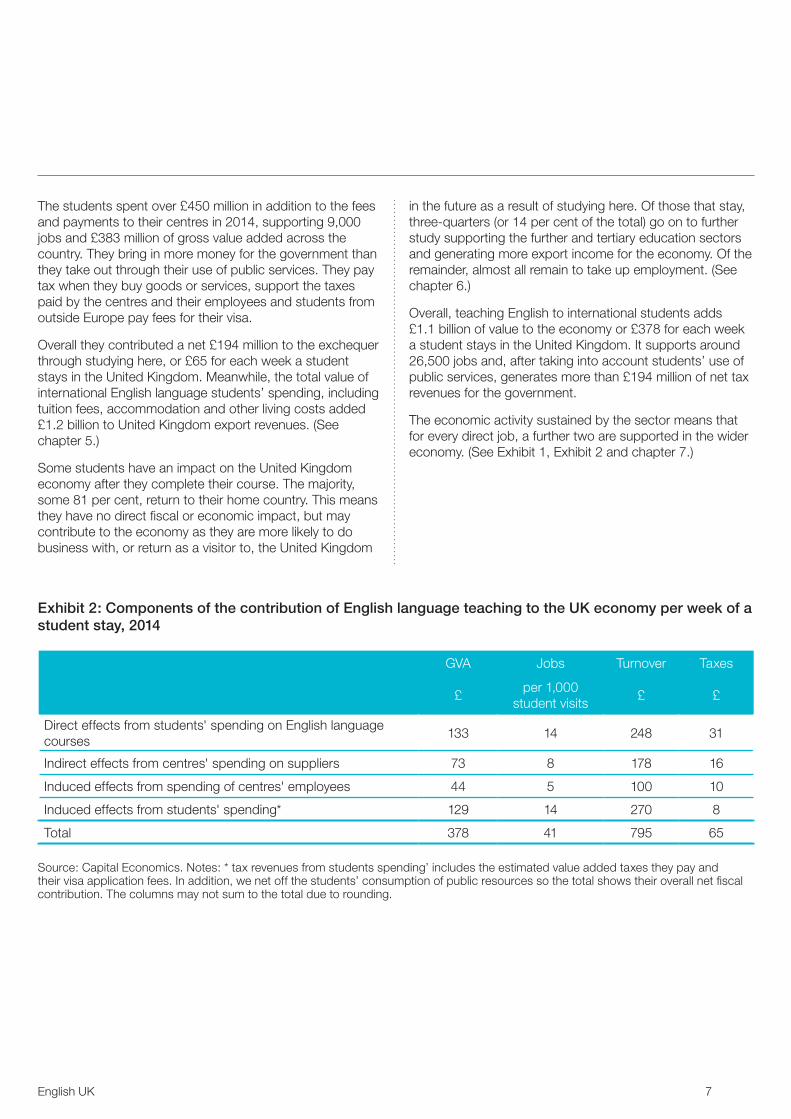
Exhibit 2: Components of the contribution of English language teaching to the UK economy per week of a student stay, 2014
GVA Jobs Turnover Taxes
£per 1,000
student visits£ £
Direct effects from students' spending on English language courses
133 14 248 31
Indirect effects from centres' spending on suppliers 73 8 178 16
Induced effects from spending of centres' employees 44 5 100 10
Induced effects from students' spending* 129 14 270 8
Total 378 41 795 65
Source: Capital Economics . Notes: * tax revenues from students spending’ includes the estimated value added taxes they pay and their visa application fees . In addition, we net off the students’ consumption of public resources so the total shows their overall net fiscal contribution . The columns may not sum to the total due to rounding .
8 Capital Economics
2 . Background and contextIn this section, we outline the background and context to the English language teaching sector in the United Kingdom .
We discuss briefly the demand for English as a global language, define the English language teaching sector in the United Kingdom and outline the approach we have taken to assess the sector’s economic contribution .
2.1 The English languageEnglish has become the dominant language for international business, science and academia . It is spoken at a useful level by one in every four people worldwide, some 1 .75 billion people, and the number of non-native speakers now far outnumber native speakers at an estimated ratio of four to one .2
English is the lingua franca for many countries and this has important trade implications for economies across the globe; countries with a common language trade more .3 A language barrier makes trading more costly and more difficult . It increases search costs for companies and individuals trying to find buyers or sellers for products . Removing this barrier encourages traders to seek out new markets and facilitates trade that otherwise would not have happened .4 Indeed, trade within the European Union might be as much as a fifth larger because of the use of English as a common language .5
The ability to communicate across the world with a common language can greatly enhance individuals’ prospects as well as businesses . Non-native speakers who learn English become more attractive to prospective employers . A survey of executives globally found that nearly 70 per cent said their workforce will need to master English to realise corporate expansion plans, and a quarter said that more than 50 per cent of their total workforce will need some ability in the language .6
The global use of the English language generates significant benefits for British businesses, and in particular for exporting
firms . The majority are able to communicate with firms globally in English – helping to limit language as a barrier to trade to just a fifth of British exporters .7
Our language is a durable national asset that should continue to deliver benefits in the future . It is unlikely to lose its place as the leading language for international business as the costs of switching would be too high . It has been estimated that the full, long-term economic benefit to the United Kingdom through the use of English, in both
international trade with English-speaking countries and in the domestic economy has a net present value of £405 billion .8
The prevalence and usefulness of English across international businesses helps to drive the continued desire of non-natives to learn it . More than 1 .4 million students worldwide study English outside of their home country .9 Around 35 per cent of these students choose to come to the United Kingdom to study .10 Not only do they help to support the economy during their time here but, as a result of studying here, the majority of students are more likely to do business with the United Kingdom thus creating long-term trade benefits .11
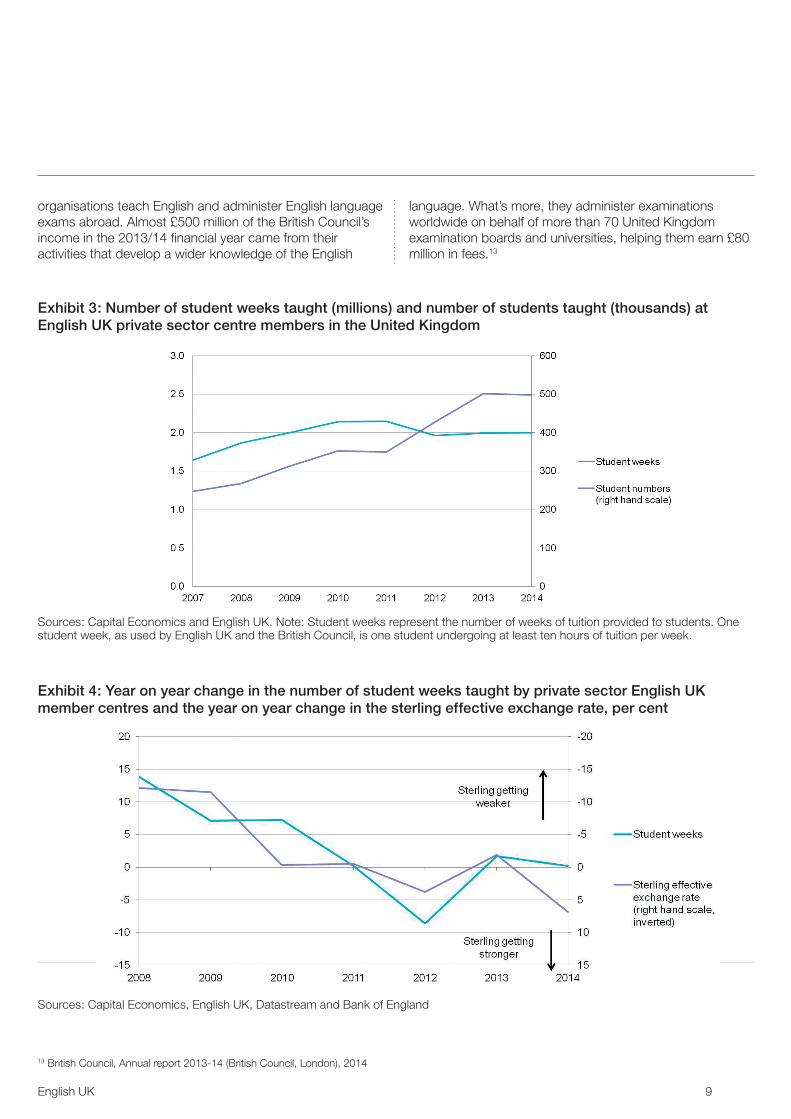
The popularity of learning English as a foreign language in the United Kingdom has increased in recent years, with the number of students rising from just over 350,000 in 2010 to almost 500,000 in 2014 .12 However, on average each student is staying for a shorter period of time, with total student weeks taught falling from 2 .1 million to 2 .0 million over the same period . (See Exhibit 3 .)
The ability of students to come to the United Kingdom to study English may fluctuate in the short-term due to exchange rate movements . A stronger pound increases the cost to foreign students of staying and studying here . This is reflected in annual fluctuations in the number of taught student weeks . (See Exhibit 4 .)
In addition to their activities in the United Kingdom, British
2 British Council, The English Effect (British Council, London), 20133 Andrew Rose, ‘One Reason Countries Pay Their Debts: Renegotiation and International Trade’, Journal of Development Economics, v77, 20054 Department for Business Innovation and Skills (BIS), ‘International Trade and Investment – the Economic Rationale for Government Support’, BIS Economics Paper No . 13, 20115 Jan Fidrmuc and Jarko Fidrmuc, ‘Foreign Languages and Trade’, CEDI Discussion Paper Series No . 09-03, 2009 . Note: this analysis is for the 15 countries that were members of the European Union prior to the accession of ten candidate countries on 1 May 2004 . It covers trade flows between 2001 and 20076 Economist Intelligence Unit, Competing across borders: how cultural and communication barriers affect business (Economist Intelligence Unit, London), 20127 BIS, ‘International Trade and Investment – the Economic Rationale for Government Support’, BIS Economics Paper No . 13, 20118 British Council, The English Effect (British Council, London), 20139 English UK, Student Statistics Report 2014 (English UK, London), 2014 10 See: www .englishuk .com/en/about-us/overview/who-are-we11 London First and PricewaterhouseCoopers, London Calling: International students’ contribution to Britain’s economic growth (LondonFirst, London), 201512 Note: data are for students studying at English UK private sector centre members
English UK 9
organisations teach English and administer English language exams abroad . Almost £500 million of the British Council’s income in the 2013/14 financial year came from their activities that develop a wider knowledge of the English
language . What’s more, they administer examinations worldwide on behalf of more than 70 United Kingdom examination boards and universities, helping them earn £80 million in fees .13
13 British Council, Annual report 2013-14 (British Council, London), 2014
Exhibit 3: Number of student weeks taught (millions) and number of students taught (thousands) at English UK private sector centre members in the United Kingdom
Sources: Capital Economics and English UK . Note: Student weeks represent the number of weeks of tuition provided to students . One student week, as used by English UK and the British Council, is one student undergoing at least ten hours of tuition per week .
Exhibit 4: Year on year change in the number of student weeks taught by private sector English UK member centres and the year on year change in the sterling effective exchange rate, per cent
Sources: Capital Economics, English UK, Datastream and Bank of England
10 Capital Economics
2.2 What is the English language teaching sector?In this report, we focus on the domestic operations of accredited businesses and institutions that teach English to foreign students . The sector covers teaching English as a foreign language to non-native speakers who can study at more than 550 accredited centres across the country .14
These centres have to meet strict standards for the quality of teaching, facilities and student care to be awarded accreditation under the Accreditation UK scheme .15 This is one of several schemes that are approved by the United Kingdom visas and immigration department and accreditation permits the centres to enrol international students with visas .16
Some centres exclusively teach English language courses, whereas others might be part of a college or university . In addition some only teach adults whereas others will have courses for children as well . The industry is represented by English UK, which is the national association of accredited English language centres and has 479 members in the private and state sectors .17
2.3 MethodologyIn order to assess fully the contribution of the English language teaching sector to the British economy, we have undertaken a survey of teaching centres in the United Kingdom, which we have combined with publically available data . Our survey was sent to all 568 centres that are accredited by Accreditation UK – the quality assurance scheme run by English UK and the British Council .18
The survey covered a number of key topics:
• The centres’ turnover, including the share that is directly attributable to English language teaching courses, the number of permanent and temporary employees, the number of hours these employees typically work and the total wage bill
• The estimated average expenditure of the centres’ students per week excluding fees and other expenses paid to the centre
• The post-study activities of English language students, including the share that leave the United Kingdom immediately after their course and those that stay to continue their education or work
Of the full list of 568 centres that were sent the survey, we received 222 responses representing 237 schools, giving an overall response rate of 41 .7 per cent . The responses to the survey varied in completeness, so the sample for different questions varies .
Please refer to the appendix for more detailed methodological notes .
14 Our definition of the sector covers all centres accredited under the Accreditation UK scheme . It does not include institutions that may be accredited under other schemes or those without any accreditation . Other accreditation bodies include the Accreditation Body for Language Services and the British Accreditation Council . For a full list of bodies see: www .gov .uk/study-visit-visa/eligibility15 See: www .educationuk .org/global/articles/english-language-centres16 British Council, Accreditation UK Handbook 2014 and 2015 (British Council, London), 2014 and www .gov .uk/study-visit-visa/eligibility17 Correct as of 1 September 201518 See a full list at: www .britishcouncil .org/education/accreditation/centres . Number of listed centres correct as of 24 August 2015 .
2 . Background and context
English UK 11
3 . Direct contribution of the centresIn this section we consider the direct contribution of English language teaching centres to the United Kingdom economy .
3.1 RevenuesThere are 568 English language teaching centres in the United Kingdom with accreditation from Accreditation UK .19 These include private and state institutions and cover specialist language schools, further education colleges, universities and summer language camps .
Combining our survey results with annual accounting information and other publicly available statistics, we estimate that the total revenue of centres was £1 .1 billion in 2014 .20 Nearly two-thirds of their revenue, some £0 .7 billion, comes directly from English language teaching courses . The rest of their revenues come from a variety of areas, such as teaching other languages, providing exam centres, cafeteria or catering services, and training and developing teachers .
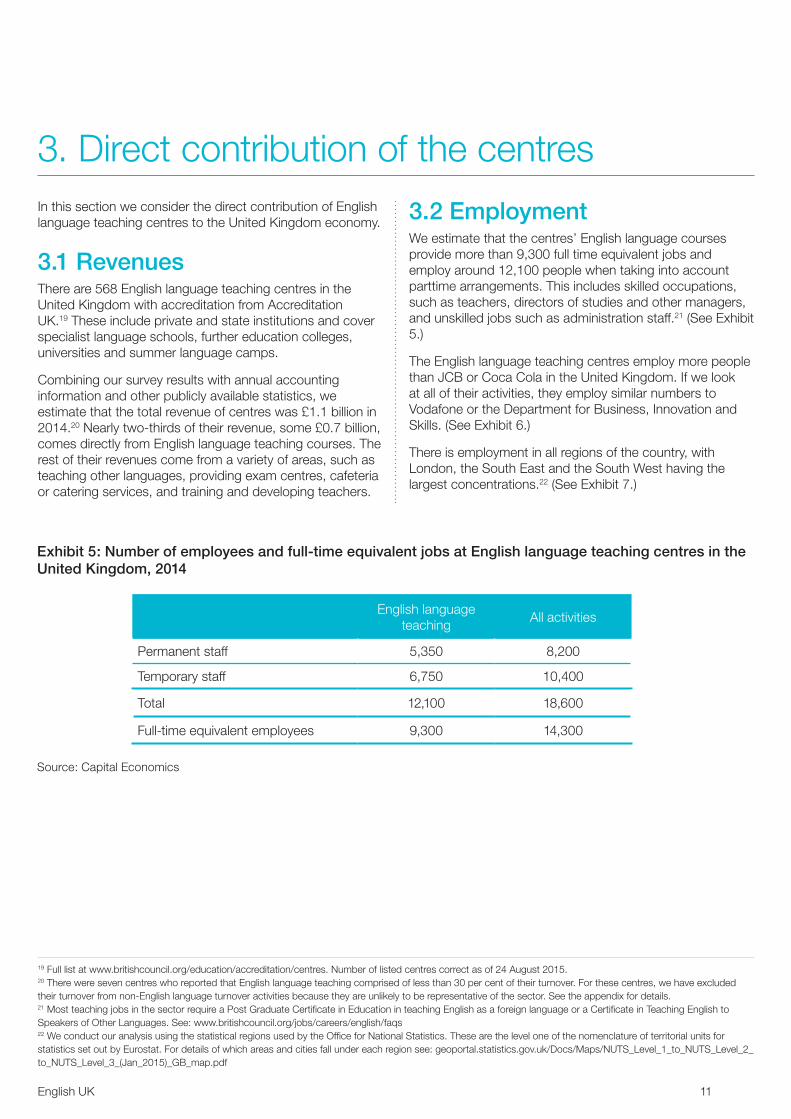
3.2 EmploymentWe estimate that the centres’ English language courses provide more than 9,300 full time equivalent jobs and employ around 12,100 people when taking into account parttime arrangements . This includes skilled occupations, such as teachers, directors of studies and other managers, and unskilled jobs such as administration staff .21 (See Exhibit 5 .)
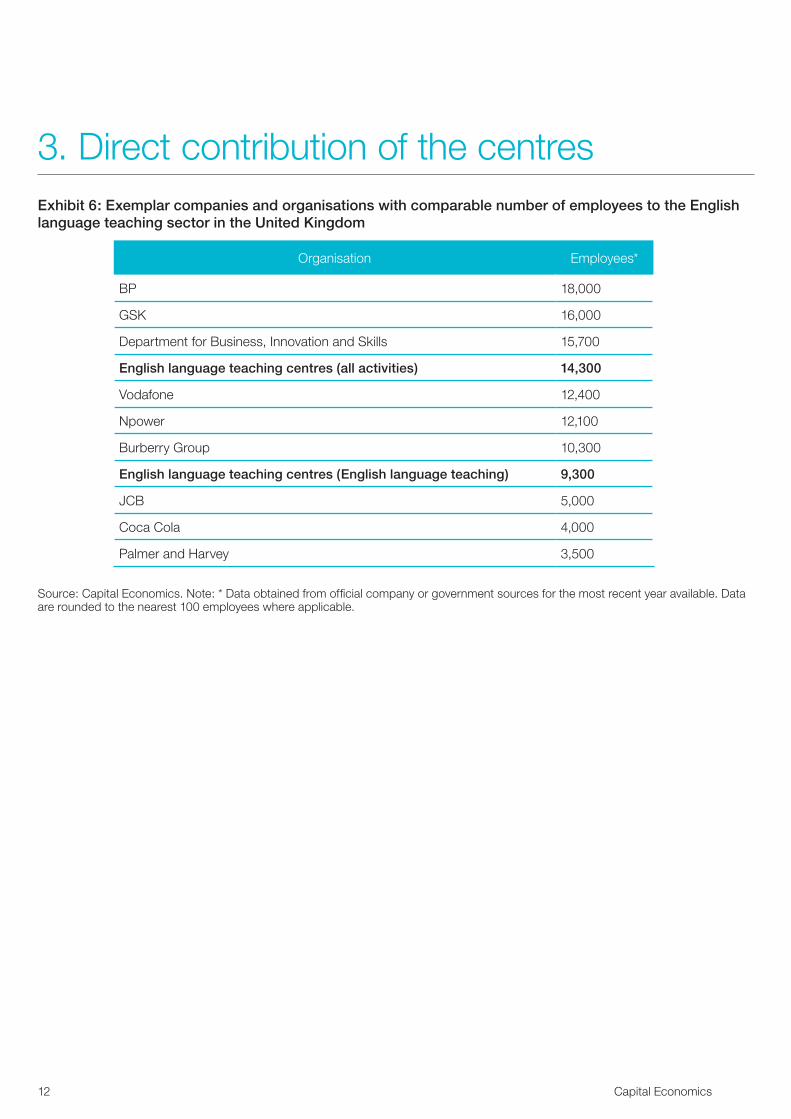
The English language teaching centres employ more people than JCB or Coca Cola in the United Kingdom . If we look at all of their activities, they employ similar numbers to Vodafone or the Department for Business, Innovation and Skills . (See Exhibit 6 .)
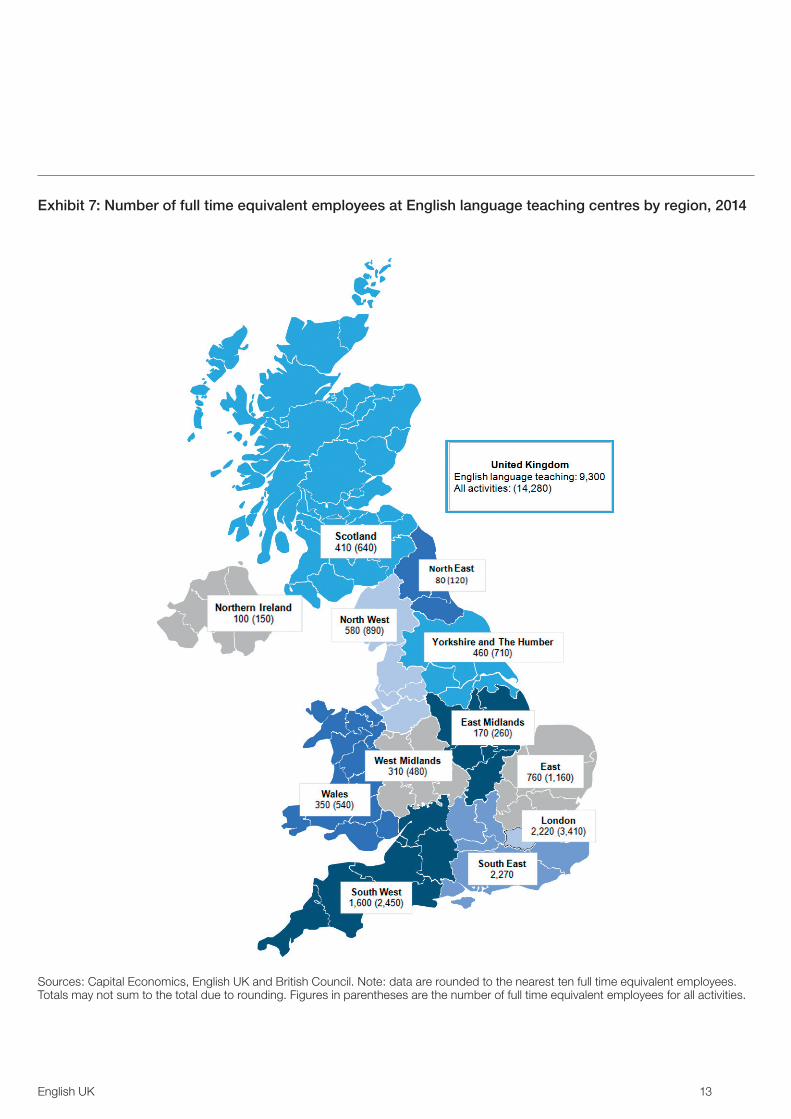
There is employment in all regions of the country, with London, the South East and the South West having the largest concentrations .22 (See Exhibit 7 .)
19 Full list at www .britishcouncil .org/education/accreditation/centres . Number of listed centres correct as of 24 August 2015 .20 There were seven centres who reported that English language teaching comprised of less than 30 per cent of their turnover . For these centres, we have excluded their turnover from non-English language turnover activities because they are unlikely to be representative of the sector . See the appendix for details .21 Most teaching jobs in the sector require a Post Graduate Certificate in Education in teaching English as a foreign language or a Certificate in Teaching English to Speakers of Other Languages . See: www .britishcouncil .org/jobs/careers/english/faqs22 We conduct our analysis using the statistical regions used by the Office for National Statistics . These are the level one of the nomenclature of territorial units for statistics set out by Eurostat . For details of which areas and cities fall under each region see: geoportal .statistics .gov .uk/Docs/Maps/NUTS_Level_1_to_NUTS_Level_2_to_NUTS_Level_3_(Jan_2015)_GB_map .pdf
Exhibit 5: Number of employees and full-time equivalent jobs at English language teaching centres in the United Kingdom, 2014
English language teaching
All activities
Permanent staff 5,350 8,200
Temporary staff 6,750 10,400
Total 12,100 18,600
Full-time equivalent employees 9,300 14,300
Source: Capital Economics
12 Capital Economics
Exhibit 6: Exemplar companies and organisations with comparable number of employees to the English language teaching sector in the United Kingdom
Organisation Employees*
BP 18,000
GSK 16,000
Department for Business, Innovation and Skills 15,700
English language teaching centres (all activities) 14,300
Vodafone 12,400
Npower 12,100
Burberry Group 10,300
English language teaching centres (English language teaching) 9,300
JCB 5,000
Coca Cola 4,000
Palmer and Harvey 3,500
Source: Capital Economics . Note: * Data obtained from official company or government sources for the most recent year available . Data are rounded to the nearest 100 employees where applicable .
3 . Direct contribution of the centres
English UK 13
Exhibit 7: Number of full time equivalent employees at English language teaching centres by region, 2014
Sources: Capital Economics, English UK and British Council . Note: data are rounded to the nearest ten full time equivalent employees . Totals may not sum to the total due to rounding . Figures in parentheses are the number of full time equivalent employees for all activities .
14 Capital Economics
3 . Direct contribution of the centres
23 See the appendix for further details 24 We use ‘gross surpluses’ to represent gross profits as not all centres are private market entities . Gross trading profit is the operating profit of private market entities . Gross trading surplus is the same concept for public market entitiesas in principle they do not make a profit . It is the trading surplus earned by public bodies and non-profit institutions serving households 25 We use our estimate for full-time equivalent employees in this calculation .
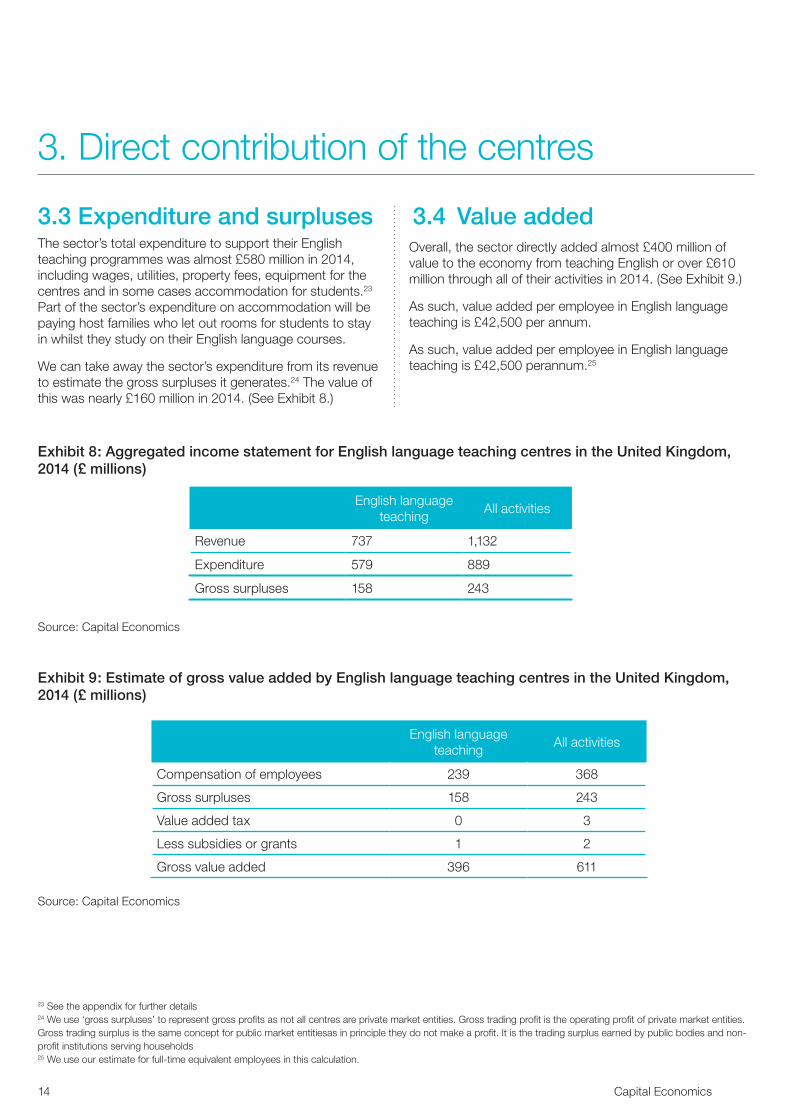
Exhibit 8: Aggregated income statement for English language teaching centres in the United Kingdom, 2014 (£ millions)
English language teaching
All activities
Revenue 737 1,132
Expenditure 579 889
Gross surpluses 158 243
Source: Capital Economics
3.3 Expenditure and surplusesThe sector’s total expenditure to support their English teaching programmes was almost £580 million in 2014, including wages, utilities, property fees, equipment for the centres and in some cases accommodation for students .23 Part of the sector’s expenditure on accommodation will be paying host families who let out rooms for students to stay in whilst they study on their English language courses .
We can take away the sector’s expenditure from its revenue to estimate the gross surpluses it generates .24 The value of this was nearly £160 million in 2014 . (See Exhibit 8 .)
3.4 Value addedOverall, the sector directly added almost £400 million of value to the economy from teaching English or over £610 million through all of their activities in 2014 . (See Exhibit 9 .)
As such, value added per employee in English language teaching is £42,500 per annum .
As such, value added per employee in English language teaching is £42,500 perannum .25
Exhibit 9: Estimate of gross value added by English language teaching centres in the United Kingdom, 2014 (£ millions)
English language teaching
All activities
Compensation of employees 239 368
Gross surpluses 158 243
Value added tax 0 3
Less subsidies or grants 1 2
Gross value added 396 611
Source: Capital Economics
English UK 15
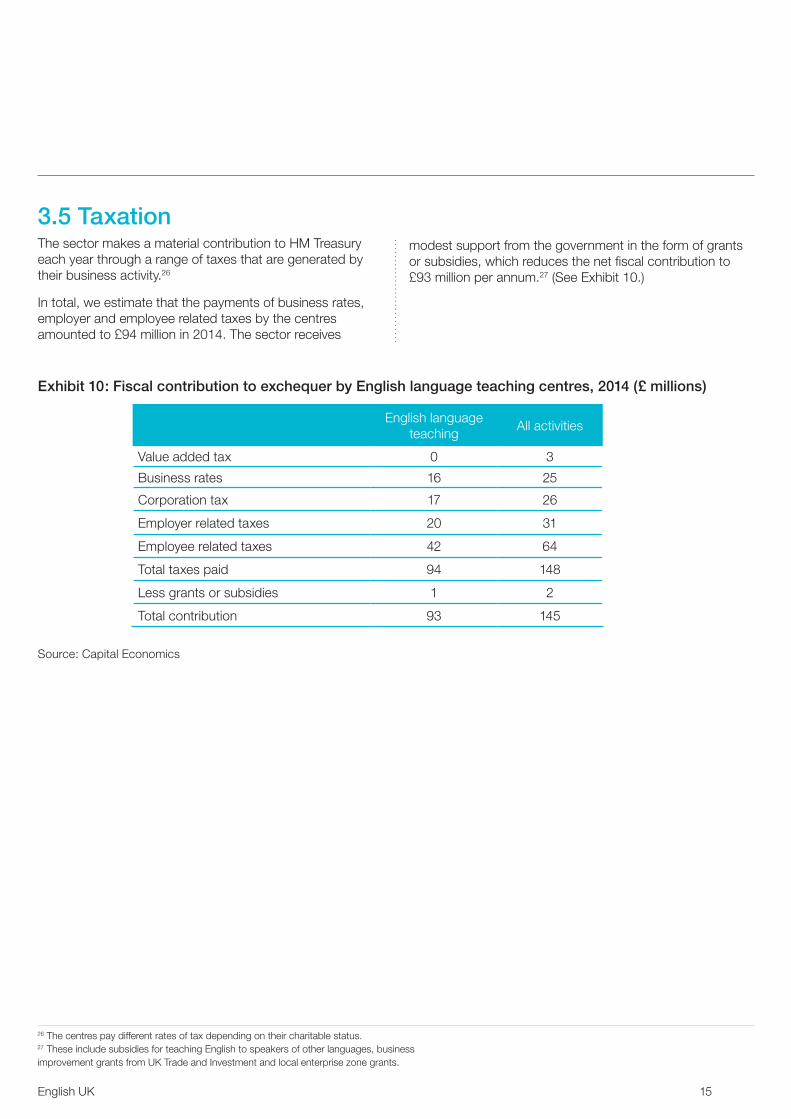
3.5 TaxationThe sector makes a material contribution to HM Treasury each year through a range of taxes that are generated by their business activity .26
In total, we estimate that the payments of business rates, employer and employee related taxes by the centres amounted to £94 million in 2014 . The sector receives
modest support from the government in the form of grants or subsidies, which reduces the net fiscal contribution to £93 million per annum .27 (See Exhibit 10 .)
Exhibit 10: Fiscal contribution to exchequer by English language teaching centres, 2014 (£ millions)
English language teaching
All activities
Value added tax 0 3
Business rates 16 25
Corporation tax 17 26
Employer related taxes 20 31
Employee related taxes 42 64
Total taxes paid 94 148
Less grants or subsidies 1 2
Total contribution 93 145
Source: Capital Economics
26 The centres pay different rates of tax depending on their charitable status .27 These include subsidies for teaching English to speakers of other languages, businessimprovement grants from UK Trade and Investment and local enterprise zone grants .
16 Capital Economics
4 . Knock-on impact of the centresIn this section we examine the knock-on effects of the centres’ spending on suppliers and the spending of the centres’ employees .
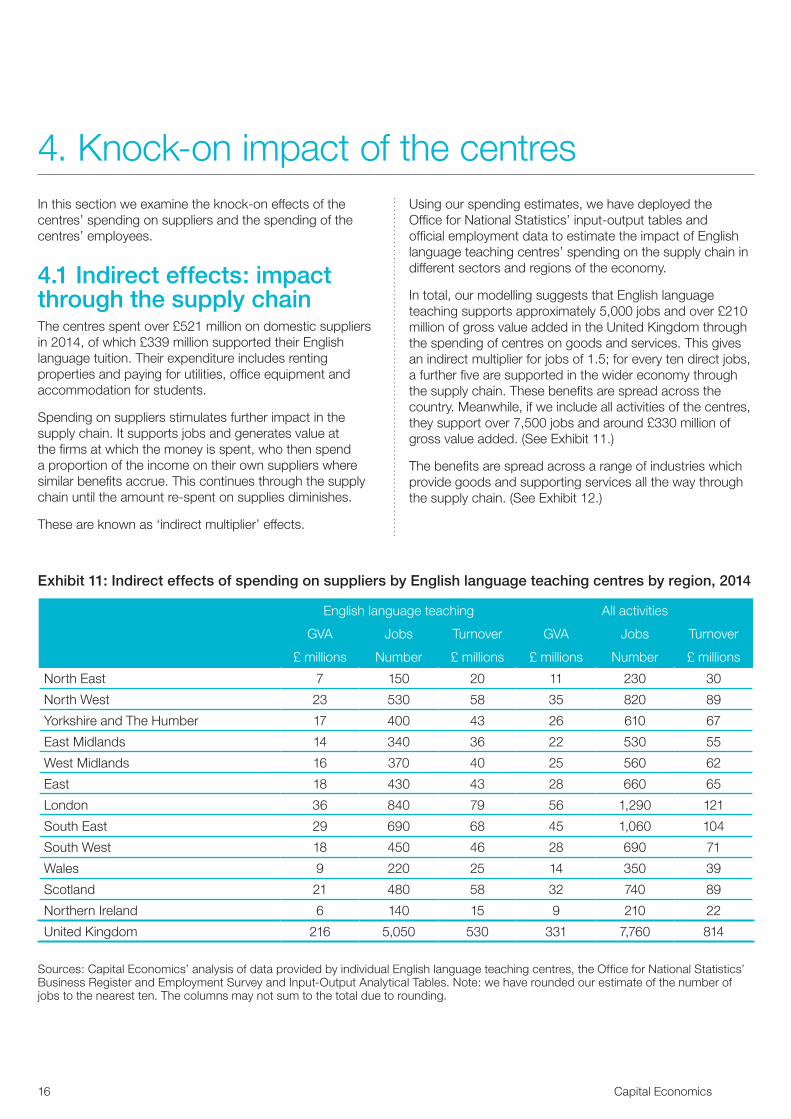
4.1 Indirect effects: impact through the supply chainThe centres spent over £521 million on domestic suppliers in 2014, of which £339 million supported their English language tuition . Their expenditure includes renting properties and paying for utilities, office equipment and accommodation for students .
Spending on suppliers stimulates further impact in the supply chain . It supports jobs and generates value at the firms at which the money is spent, who then spend a proportion of the income on their own suppliers where similar benefits accrue . This continues through the supply chain until the amount re-spent on supplies diminishes .
These are known as ‘indirect multiplier’ effects .
Using our spending estimates, we have deployed the Office for National Statistics’ input-output tables and official employment data to estimate the impact of English language teaching centres’ spending on the supply chain in different sectors and regions of the economy .
In total, our modelling suggests that English language teaching supports approximately 5,000 jobs and over £210 million of gross value added in the United Kingdom through the spending of centres on goods and services . This gives an indirect multiplier for jobs of 1 .5; for every ten direct jobs, a further five are supported in the wider economy through the supply chain . These benefits are spread across the country . Meanwhile, if we include all activities of the centres, they support over 7,500 jobs and around £330 million of gross value added . (See Exhibit 11 .)
The benefits are spread across a range of industries which provide goods and supporting services all the way through the supply chain . (See Exhibit 12 .)
Exhibit 11: Indirect effects of spending on suppliers by English language teaching centres by region, 2014
English language teaching All activities
GVA Jobs Turnover GVA Jobs Turnover
£ millions Number £ millions £ millions Number £ millions
North East 7 150 20 11 230 30
North West 23 530 58 35 820 89
Yorkshire and The Humber 17 400 43 26 610 67
East Midlands 14 340 36 22 530 55
West Midlands 16 370 40 25 560 62
East 18 430 43 28 660 65
London 36 840 79 56 1,290 121
South East 29 690 68 45 1,060 104
South West 18 450 46 28 690 71
Wales 9 220 25 14 350 39
Scotland 21 480 58 32 740 89
Northern Ireland 6 140 15 9 210 22
United Kingdom 216 5,050 530 331 7,760 814
Sources: Capital Economics’ analysis of data provided by individual English language teaching centres, the Office for National Statistics’ Business Register and Employment Survey and Input-Output Analytical Tables . Note: we have rounded our estimate of the number of jobs to the nearest ten . The columns may not sum to the total due to rounding .

English UK 17
Exhibit 12: Indirect effects of spending on suppliers by English language teaching centres by sector, 2014
English language teaching All activities
GVA Jobs Turnover GVA Jobs Turnover
£ millions Number £ millions £ millions Number £ millions
Sectors
Primary activities including energy 7 50 28 11 80 43
Manufacturing 19 330 106 30 510 163
Construction 7 90 17 10 140 27
Services 182 4,570 379 279 7,020 582
Comprising of:
Wholesale, retail and other services 50 1,690 145 77 2,590 223
Transport and storage 8 170 19 12 260 29
Financial, business and professional services
44 510 83 68 790 127
Arts, entertainment and recreation 1 40 3 2 60 5
Administrative support 23 870 48 35 1,330 73
Communications 13 170 24 19 250 38
Public services 42 1,140 57 65 1,740 88
Total 216 5,050 530 331 7,760 814
Sources: Capital Economics’ analysis of data provided by individual English language teaching centres, the Office for National Statistics’ Business Register and Employment Survey and Input-Output Analytical Tables . Note: we have rounded our estimate of the number of jobs to the nearest ten . The columns may not sum to the total due to rounding .
18 Capital Economics
4 . Knock-on impact of the centres
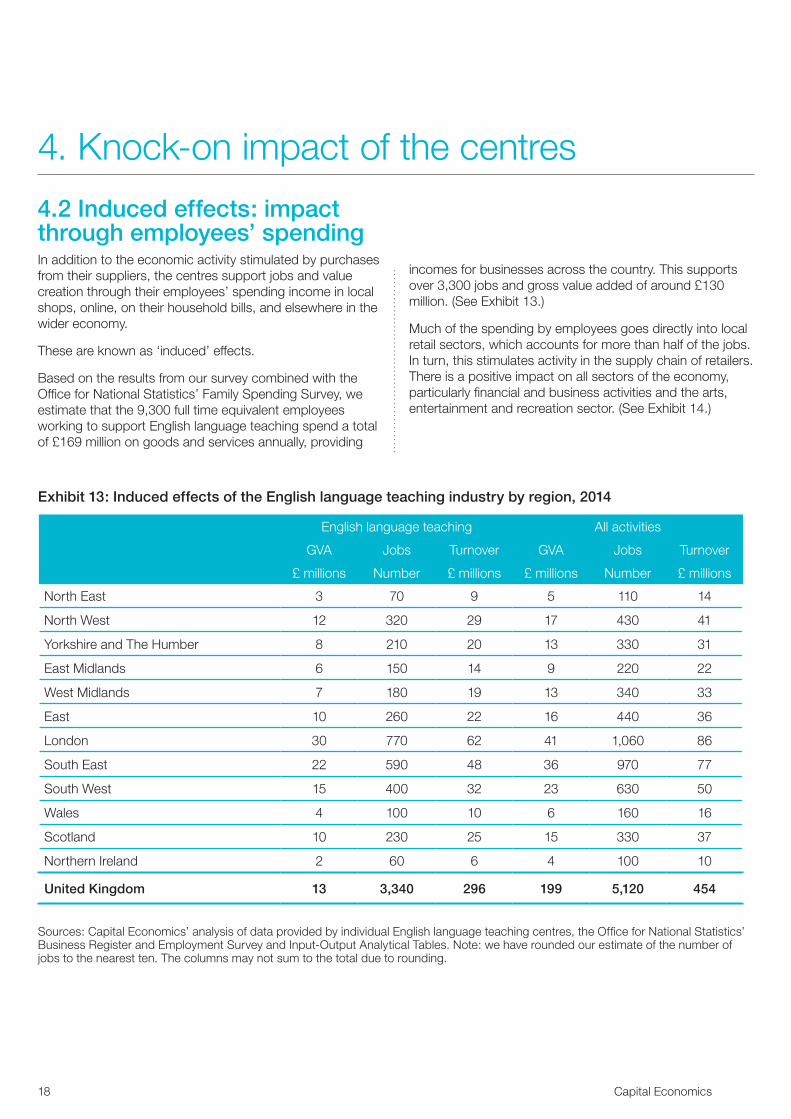
Exhibit 13: Induced effects of the English language teaching industry by region, 2014
English language teaching All activities
GVA Jobs Turnover GVA Jobs Turnover
£ millions Number £ millions £ millions Number £ millions
North East 3 70 9 5 110 14
North West 12 320 29 17 430 41
Yorkshire and The Humber 8 210 20 13 330 31
East Midlands 6 150 14 9 220 22
West Midlands 7 180 19 13 340 33
East 10 260 22 16 440 36
London 30 770 62 41 1,060 86
South East 22 590 48 36 970 77
South West 15 400 32 23 630 50
Wales 4 100 10 6 160 16
Scotland 10 230 25 15 330 37
Northern Ireland 2 60 6 4 100 10
United Kingdom 13 3,340 296 199 5,120 454
Sources: Capital Economics’ analysis of data provided by individual English language teaching centres, the Office for National Statistics’ Business Register and Employment Survey and Input-Output Analytical Tables . Note: we have rounded our estimate of the number of jobs to the nearest ten . The columns may not sum to the total due to rounding .
4.2 Induced effects: impact through employees’ spendingIn addition to the economic activity stimulated by purchases from their suppliers, the centres support jobs and value creation through their employees’ spending income in local shops, online, on their household bills, and elsewhere in the wider economy .
These are known as ‘induced’ effects .
Based on the results from our survey combined with the Office for National Statistics’ Family Spending Survey, we estimate that the 9,300 full time equivalent employees working to support English language teaching spend a total of £169 million on goods and services annually, providing
incomes for businesses across the country . This supports over 3,300 jobs and gross value added of around £130 million . (See Exhibit 13 .)
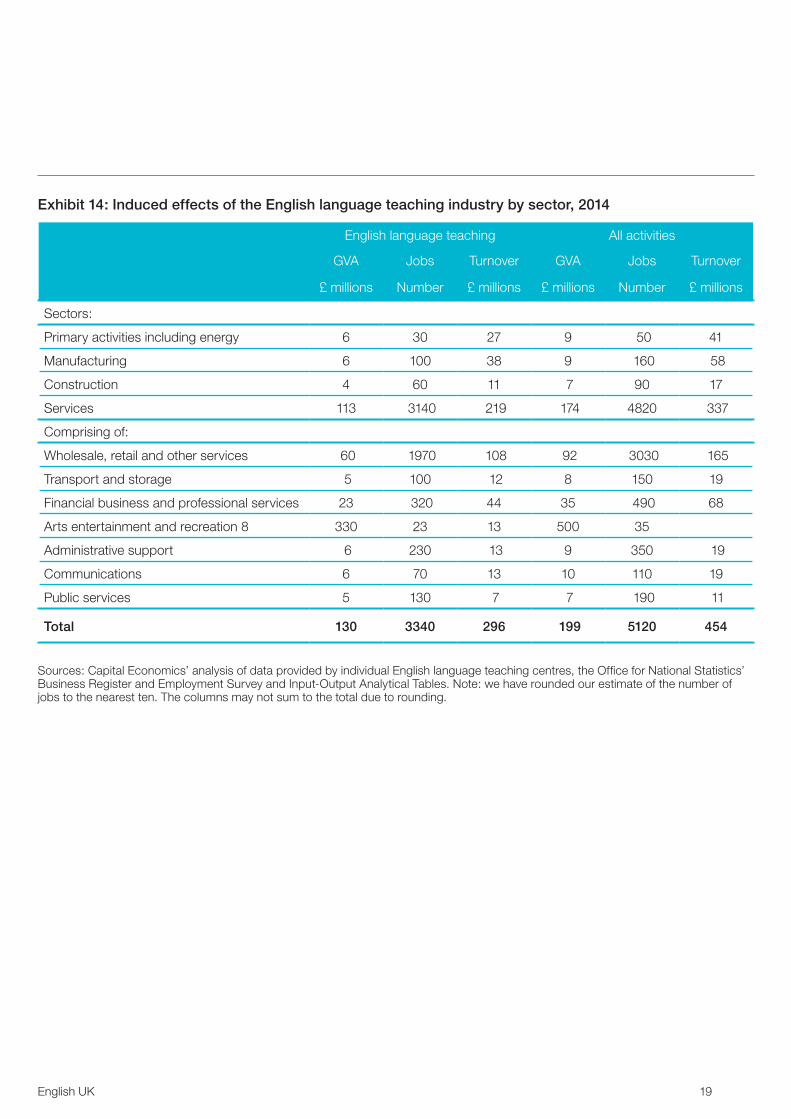
Much of the spending by employees goes directly into local retail sectors, which accounts for more than half of the jobs . In turn, this stimulates activity in the supply chain of retailers . There is a positive impact on all sectors of the economy, particularly financial and business activities and the arts, entertainment and recreation sector . (See Exhibit 14 .)
English UK 19
Exhibit 14: Induced effects of the English language teaching industry by sector, 2014
English language teaching All activities
GVA Jobs Turnover GVA Jobs Turnover
£ millions Number £ millions £ millions Number £ millions
Sectors:
Primary activities including energy 6 30 27 9 50 41
Manufacturing 6 100 38 9 160 58
Construction 4 60 11 7 90 17
Services 113 3140 219 174 4820 337
Comprising of:
Wholesale, retail and other services 60 1970 108 92 3030 165
Transport and storage 5 100 12 8 150 19
Financial business and professional services 23 320 44 35 490 68
Arts entertainment and recreation 8 330 23 13 500 35
Administrative support 6 230 13 9 350 19
Communications 6 70 13 10 110 19
Public services 5 130 7 7 190 11
Total 130 3340 296 199 5120 454
Sources: Capital Economics’ analysis of data provided by individual English language teaching centres, the Office for National Statistics’ Business Register and Employment Survey and Input-Output Analytical Tables . Note: we have rounded our estimate of the number of jobs to the nearest ten . The columns may not sum to the total due to rounding .
20 Capital Economics
5 . Students’ contribution to the economyIn this section we evaluate the students’ impacts through their spending on goods and services in addition to their tuition fees, examine the associated knock-on effects for the United Kingdom economy and assess their net benefit to the exchequer .
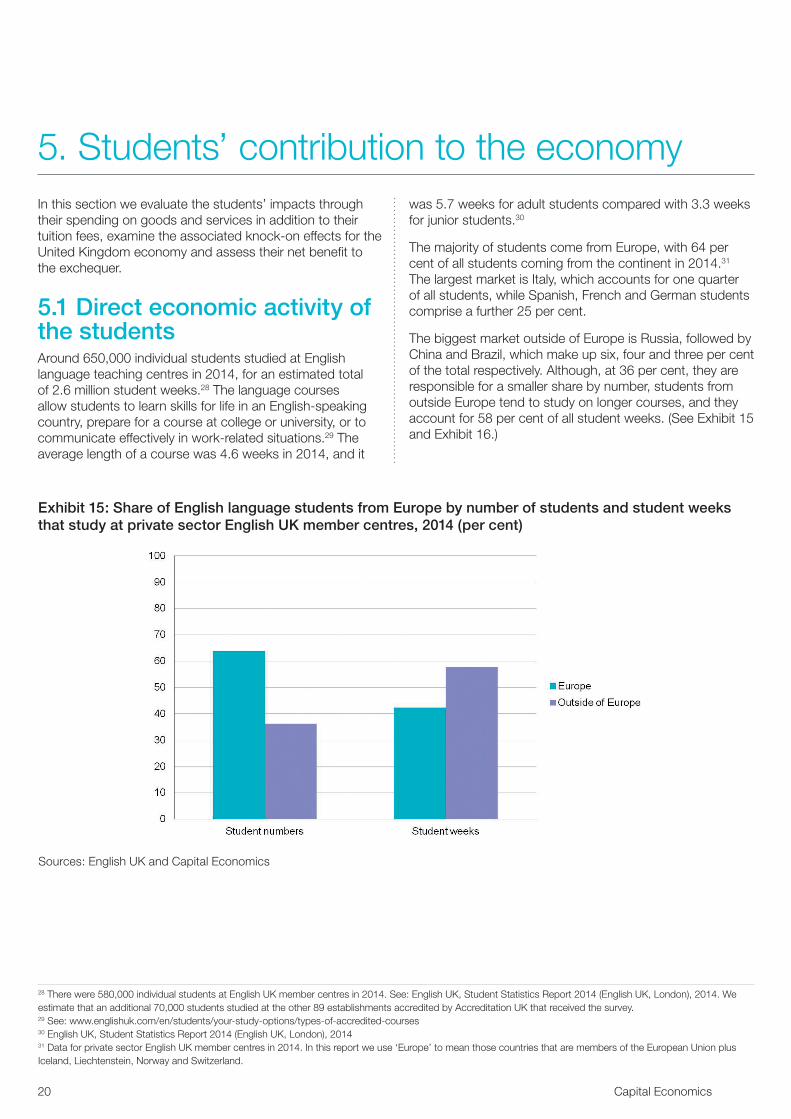
5.1 Direct economic activity of the studentsAround 650,000 individual students studied at English language teaching centres in 2014, for an estimated total of 2 .6 million student weeks .28 The language courses allow students to learn skills for life in an English-speaking country, prepare for a course at college or university, or to communicate effectively in work-related situations .29 The average length of a course was 4 .6 weeks in 2014, and it
was 5 .7 weeks for adult students compared with 3 .3 weeks for junior students .30
The majority of students come from Europe, with 64 per cent of all students coming from the continent in 2014 .31 The largest market is Italy, which accounts for one quarter of all students, while Spanish, French and German students comprise a further 25 per cent .
The biggest market outside of Europe is Russia, followed by China and Brazil, which make up six, four and three per cent of the total respectively . Although, at 36 per cent, they are responsible for a smaller share by number, students from outside Europe tend to study on longer courses, and they account for 58 per cent of all student weeks . (See Exhibit 15 and Exhibit 16 .)
28 There were 580,000 individual students at English UK member centres in 2014 . See: English UK, Student Statistics Report 2014 (English UK, London), 2014 . We estimate that an additional 70,000 students studied at the other 89 establishments accredited by Accreditation UK that received the survey .29 See: www .englishuk .com/en/students/your-study-options/types-of-accredited-courses30 English UK, Student Statistics Report 2014 (English UK, London), 201431 Data for private sector English UK member centres in 2014 . In this report we use ‘Europe’ to mean those countries that are members of the European Union plus Iceland, Liechtenstein, Norway and Switzerland .
Exhibit 15: Share of English language students from Europe by number of students and student weeks that study at private sector English UK member centres, 2014 (per cent)
Sources: English UK and Capital Economics

English UK 21
Exhibit 16: Top ten countries for English language students at private sector English UK member centres by share of total number of student visitors, 2014 (per cent)
Sources: English UK and Capital Economics
The majority of students study in the south of England, and in particular the London and South East regions, which together account for 59 .6 per cent of students at private sector English language centres . Along with the South West, these regions have the greatest density of students relative to the region’s population . The density is greatest in London, with an average of 1 .8 student visitors each week for every 1,000 of population, and smallest in the North East with just 0 .1 student visitors each week per 1,000 of population . (See Exhibit 17 .)
Our survey results suggest that students spent £737 million on English language centres in 2014 . This covered their tuition fees and in some cases their accommodation costs as well . However, their contribution stretches further than this by meeting living costs such as food and leisure, spending on study-related books and travel, and in some cases accommodation not provided through the centres .
Some of this spending will go to families across the county who provide homestay accommodation for students . Letting
out a spare room to students can make an important contribution to a household’s finances . The ‘Rent a Room relief’ currently allows individuals who rent out a room in their main residence to earn up to £4,250 per year tax free . This will rise to £7,500 per year from April 2016 .32
Based on the centres’ understanding of their students’ activities, we estimate that the average student spends in the order of £150 every week in addition to the fees and payments to their centres . This suggests English language students spent £453 million outside of the centres in 2014 or £693 each on average for a typical length of stay of 4 .6 weeks, or £1,121 for students from outside of Europe who stay on average for 7 .4 weeks .33
32 HM Treasury, Summer Budget 2015 (HM Treasury, London), 201533 This includes their spending on accommodation not provided through the centres .
22 Capital Economics
5 . Students’ contribution to the economy
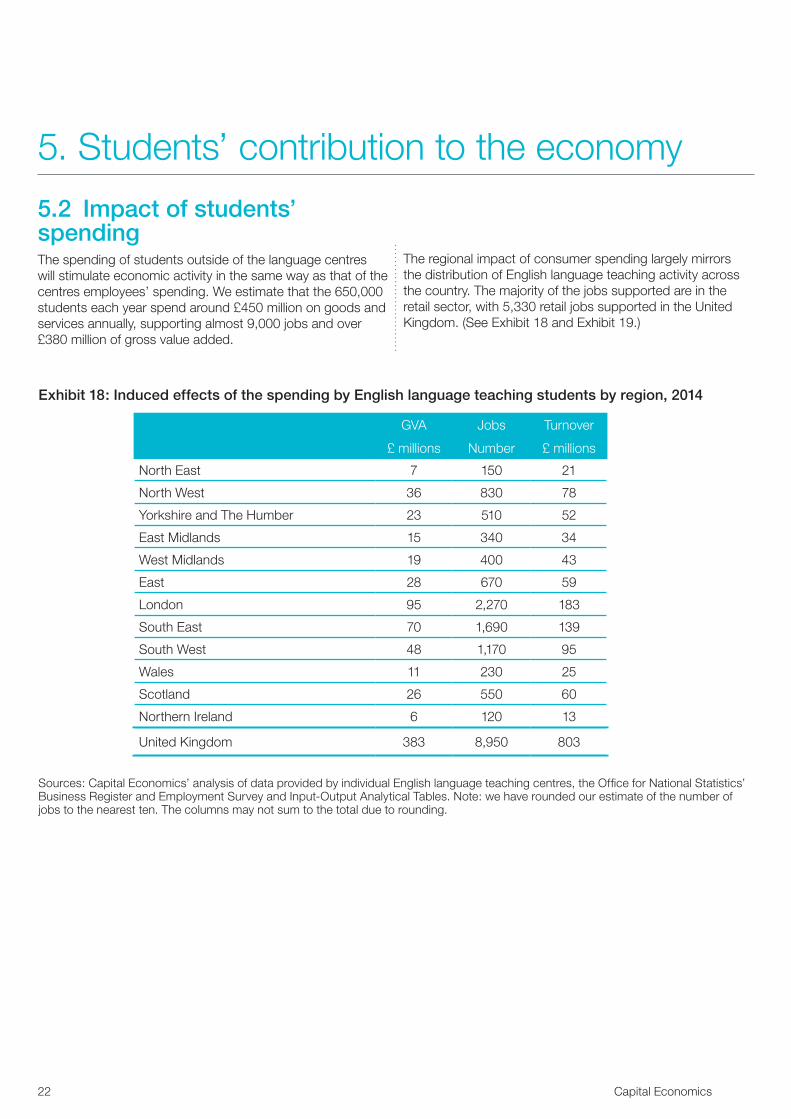
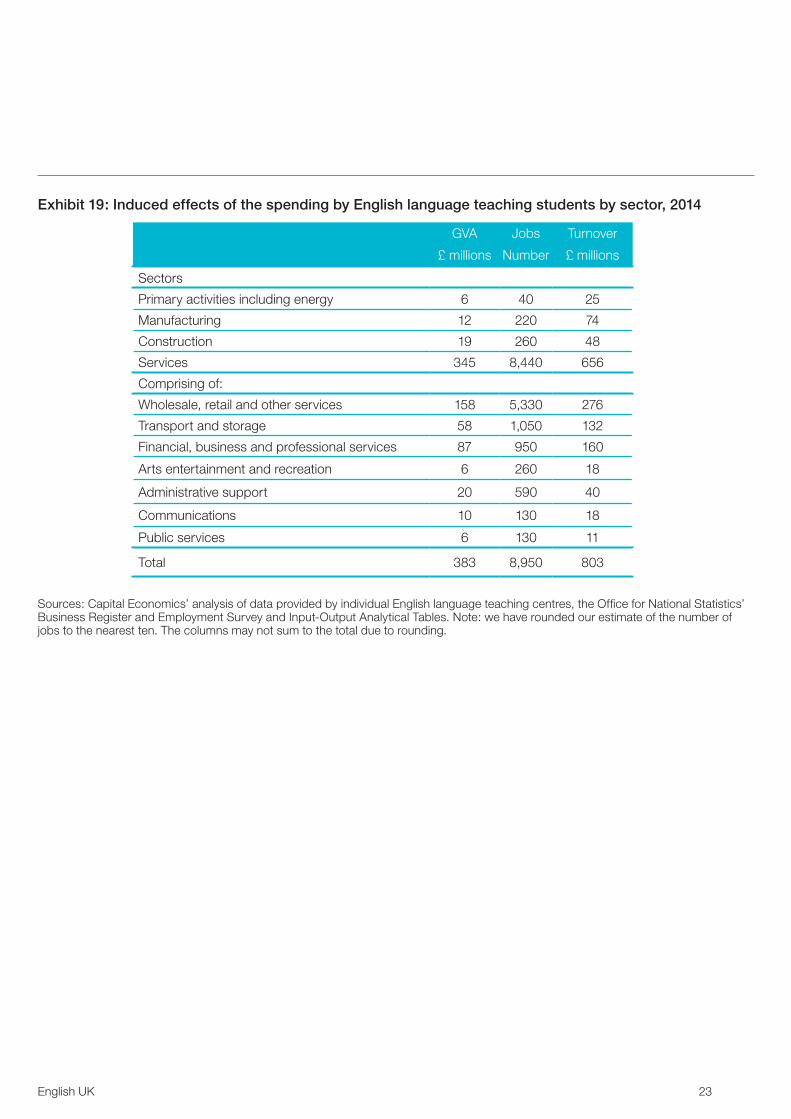
5.2 Impact of students’ spendingThe spending of students outside of the language centres will stimulate economic activity in the same way as that of the centres employees’ spending . We estimate that the 650,000 students each year spend around £450 million on goods and services annually, supporting almost 9,000 jobs and over £380 million of gross value added .
The regional impact of consumer spending largely mirrors the distribution of English language teaching activity across the country . The majority of the jobs supported are in the retail sector, with 5,330 retail jobs supported in the United Kingdom . (See Exhibit 18 and Exhibit 19 .)
Exhibit 18: Induced effects of the spending by English language teaching students by region, 2014
GVA Jobs Turnover
£ millions Number £ millions
North East 7 150 21
North West 36 830 78
Yorkshire and The Humber 23 510 52
East Midlands 15 340 34
West Midlands 19 400 43
East 28 670 59
London 95 2,270 183
South East 70 1,690 139
South West 48 1,170 95
Wales 11 230 25
Scotland 26 550 60
Northern Ireland 6 120 13
United Kingdom 383 8,950 803
Sources: Capital Economics’ analysis of data provided by individual English language teaching centres, the Office for National Statistics’ Business Register and Employment Survey and Input-Output Analytical Tables . Note: we have rounded our estimate of the number of jobs to the nearest ten . The columns may not sum to the total due to rounding .
English UK 23
Exhibit 19: Induced effects of the spending by English language teaching students by sector, 2014
GVA Jobs Turnover
£ millions Number £ millions
Sectors
Primary activities including energy 6 40 25
Manufacturing 12 220 74
Construction 19 260 48
Services 345 8,440 656
Comprising of:
Wholesale, retail and other services 158 5,330 276
Transport and storage 58 1,050 132
Financial, business and professional services 87 950 160
Arts entertainment and recreation 6 260 18
Administrative support 20 590 40
Communications 10 130 18
Public services 6 130 11
Total 383 8,950 803
Sources: Capital Economics’ analysis of data provided by individual English language teaching centres, the Office for National Statistics’ Business Register and Employment Survey and Input-Output Analytical Tables . Note: we have rounded our estimate of the number of jobs to the nearest ten . The columns may not sum to the total due to rounding .
24 Capital Economics
5 . Students’ contribution to the economy
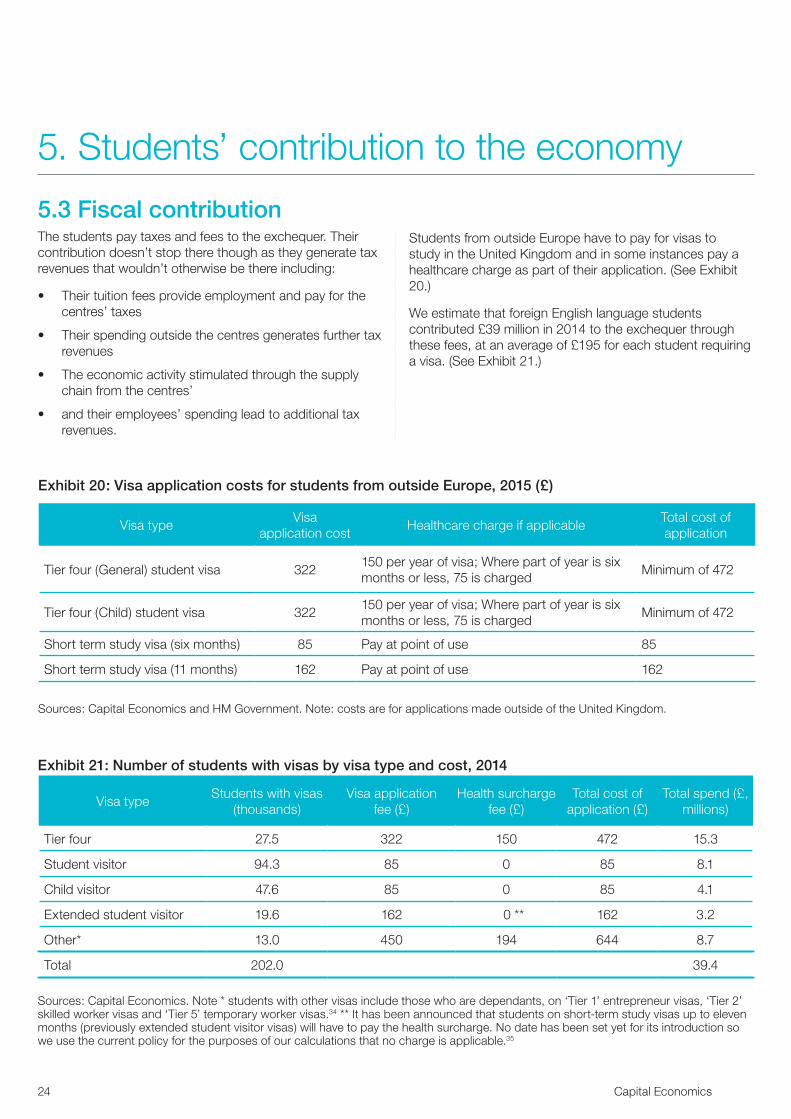
5.3 Fiscal contributionThe students pay taxes and fees to the exchequer . Their contribution doesn’t stop there though as they generate tax revenues that wouldn’t otherwise be there including:
• Their tuition fees provide employment and pay for the centres’ taxes
• Their spending outside the centres generates further tax revenues
• The economic activity stimulated through the supply chain from the centres’
• and their employees’ spending lead to additional tax revenues .
Students from outside Europe have to pay for visas to study in the United Kingdom and in some instances pay a healthcare charge as part of their application . (See Exhibit 20 .)
We estimate that foreign English language students contributed £39 million in 2014 to the exchequer through these fees, at an average of £195 for each student requiring a visa . (See Exhibit 21 .)
Exhibit 20: Visa application costs for students from outside Europe, 2015 (£)
Visa typeVisa
application costHealthcare charge if applicable
Total cost of application
Tier four (General) student visa 322150 per year of visa; Where part of year is six months or less, 75 is charged
Minimum of 472
Tier four (Child) student visa 322150 per year of visa; Where part of year is six months or less, 75 is charged
Minimum of 472
Short term study visa (six months) 85 Pay at point of use 85
Short term study visa (11 months) 162 Pay at point of use 162
Sources: Capital Economics and HM Government . Note: costs are for applications made outside of the United Kingdom .
Exhibit 21: Number of students with visas by visa type and cost, 2014
Visa typeStudents with visas
(thousands)Visa application
fee (£)Health surcharge
fee (£)Total cost of
application (£)Total spend (£,
millions)
Tier four 27 .5 322 150 472 15 .3
Student visitor 94 .3 85 0 85 8 .1
Child visitor 47 .6 85 0 85 4 .1
Extended student visitor 19 .6 162 0 ** 162 3 .2
Other* 13 .0 450 194 644 8 .7
Total 202 .0 39 .4
Sources: Capital Economics . Note * students with other visas include those who are dependants, on ‘Tier 1’ entrepreneur visas, ‘Tier 2’ skilled worker visas and ‘Tier 5’ temporary worker visas .34 ** It has been announced that students on short-term study visas up to eleven months (previously extended student visitor visas) will have to pay the health surcharge . No date has been set yet for its introduction so we use the current policy for the purposes of our calculations that no charge is applicable .35

English UK 25
The students pay value added tax and duties on some of their expenditure other than tuition fees . To understand the type of purchases that the students make, we use the results from a government survey of higher education students themselves in the United Kingdom .36 Much of their spending is on goods or services, such as food or travel, that do not attract the full value added tax rate in the United Kingdom, if at all .
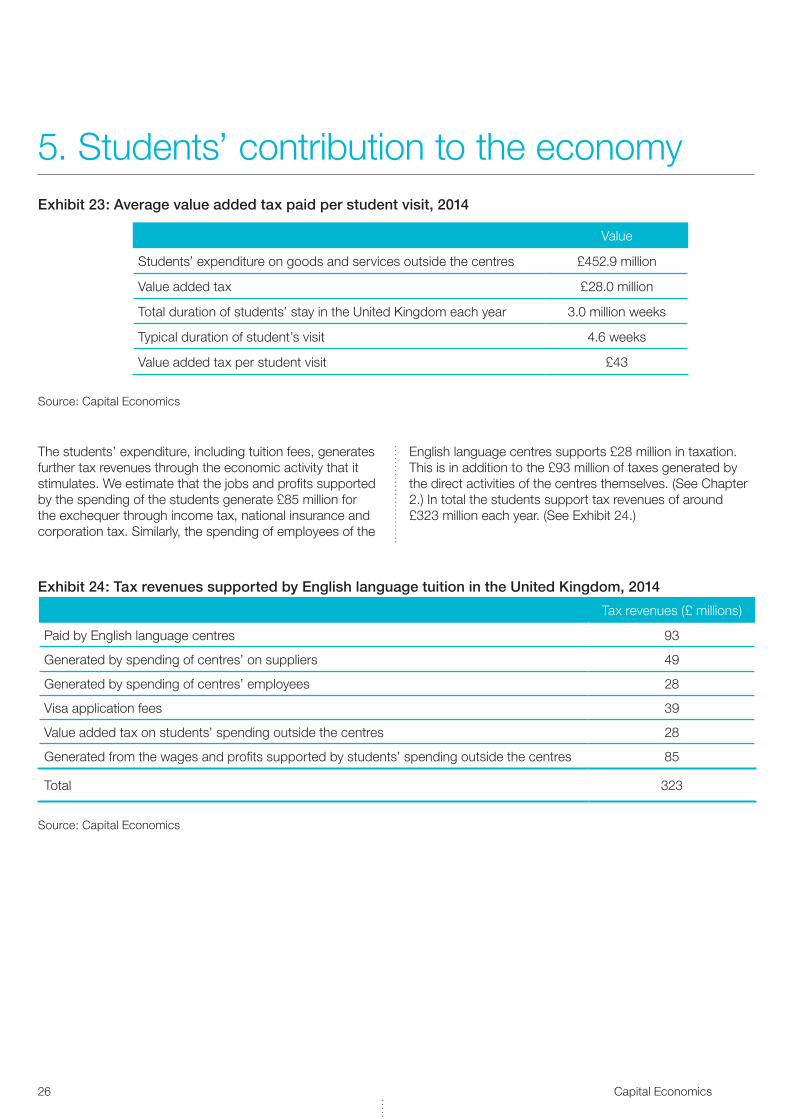
We estimate that around six per cent of students’ expenditure comprises of value added tax, generating revenue for the exchequer of approximately £28 million or around £43 per student visit .37 (See Exhibit 22 and Exhibit 23 .)
Exhibit 22: Share of value added tax in students’ expenditure outside the centres, 2014
Share of weekly expenditure (per cent)
Share of expenditure on goods or services that is on value added tax (per cent)
Food 20 .7 0 .0
Household goods 3 .8 16 .7
Insurance and other living costs 0 .4 16 .7
Personal items 20 .2 16 .7
Leisure related travel* 17 .2 0 .0
Leisure 11 .9 12 .2
Books and equipment 5 .0 13 .1
Study related travel* 4 .3 0 .0
Accommodation** 16 .5 0 .0
Weighted average 6 .2
Source: Capital Economics analysis of results in: Department for Business, Innovation and Skills, ‘Student Income and Expenditure Survey 2011/12’, BIS Research Paper Number 115, 2013 . Note: * This analysis does not include duties payable on goods such as alcohol and fuel; ** we have assumed that half of students pay the centres directly for their accommodation and half pay other providers directly .
34 We assume that the students on ‘other’ visas are allocated to the various ‘Tier 1’, ‘Tier 2’ and ‘Tier 5’ visas in proportion to the entry clearance visas granted by type in 2014 . We calculate a weighted average visa application fee and health surcharge fee using the applicable fees by visa type . See: Home Office, Immigration Statistics (Home Office, London), 2015; www .gov .uk/healthcare-immigration-application/when-you-need-to-pay; and, www .gov .uk/government/uploads/system/uploads/attachment_data/file/419449/fees_table_for_website_2015_03_30 .pdf35 Home Office, Short-term students version 2 .0 (Home Office, London), 201534 Department for Business, Innovation and Skills, ‘Student Income and Expenditure Survey 2011/12’, BIS Research Paper Number 115, 201335 Note: this is likely to be an underestimate of the total taxes they pay on their expenditure as we do not estimate the value of duties payable on their purchases of goods such as alcohol and fuel .
26 Capital Economics
5 . Students’ contribution to the economy
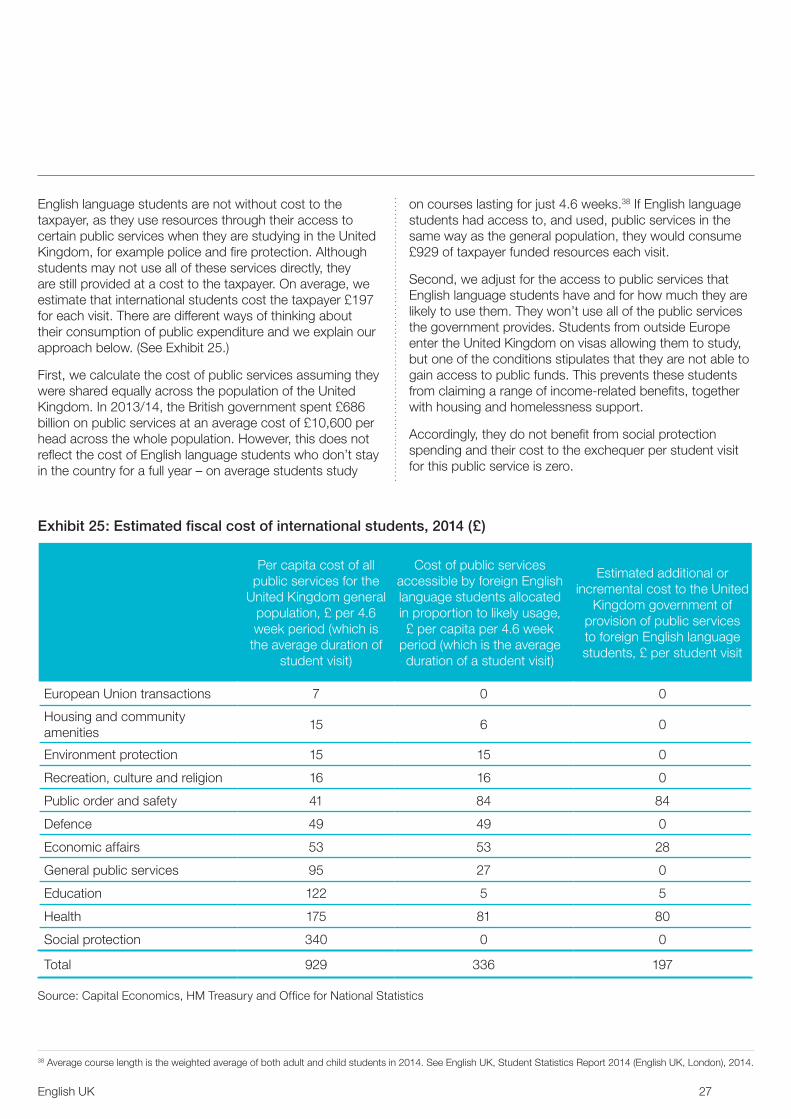
Exhibit 24: Tax revenues supported by English language tuition in the United Kingdom, 2014
Tax revenues (£ millions)
Paid by English language centres 93
Generated by spending of centres’ on suppliers 49
Generated by spending of centres’ employees 28
Visa application fees 39
Value added tax on students’ spending outside the centres 28
Generated from the wages and profits supported by students’ spending outside the centres 85
Total 323
Source: Capital Economics
The students’ expenditure, including tuition fees, generates further tax revenues through the economic activity that it stimulates . We estimate that the jobs and profits supported by the spending of the students generate £85 million for the exchequer through income tax, national insurance and corporation tax . Similarly, the spending of employees of the
English language centres supports £28 million in taxation . This is in addition to the £93 million of taxes generated by the direct activities of the centres themselves . (See Chapter 2 .) In total the students support tax revenues of around £323 million each year . (See Exhibit 24 .)
Exhibit 23: Average value added tax paid per student visit, 2014
Value
Students’ expenditure on goods and services outside the centres £452 .9 million
Value added tax £28 .0 million
Total duration of students’ stay in the United Kingdom each year 3 .0 million weeks
Typical duration of student’s visit 4 .6 weeks
Value added tax per student visit £43
Source: Capital Economics
English UK 27
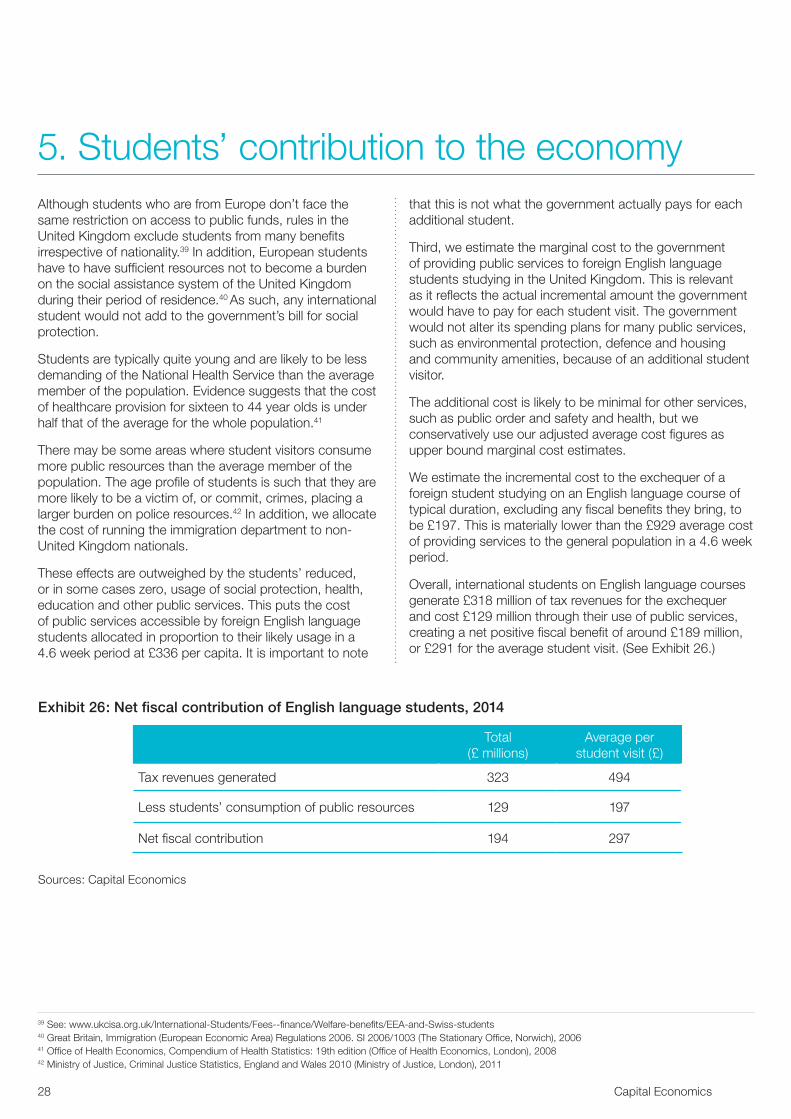
English language students are not without cost to the taxpayer, as they use resources through their access to certain public services when they are studying in the United Kingdom, for example police and fire protection . Although students may not use all of these services directly, they are still provided at a cost to the taxpayer . On average, we estimate that international students cost the taxpayer £197 for each visit . There are different ways of thinking about their consumption of public expenditure and we explain our approach below . (See Exhibit 25 .)
First, we calculate the cost of public services assuming they were shared equally across the population of the United Kingdom . In 2013/14, the British government spent £686 billion on public services at an average cost of £10,600 per head across the whole population . However, this does not reflect the cost of English language students who don’t stay in the country for a full year – on average students study
on courses lasting for just 4 .6 weeks .38 If English language students had access to, and used, public services in the same way as the general population, they would consume £929 of taxpayer funded resources each visit .
Second, we adjust for the access to public services that English language students have and for how much they are likely to use them . They won’t use all of the public services the government provides . Students from outside Europe enter the United Kingdom on visas allowing them to study, but one of the conditions stipulates that they are not able to gain access to public funds . This prevents these students from claiming a range of income-related benefits, together with housing and homelessness support .
Accordingly, they do not benefit from social protection spending and their cost to the exchequer per student visit for this public service is zero .
38 Average course length is the weighted average of both adult and child students in 2014 . See English UK, Student Statistics Report 2014 (English UK, London), 2014 .
Exhibit 25: Estimated fiscal cost of international students, 2014 (£)
Per capita cost of all public services for the
United Kingdom general population, £ per 4 .6 week period (which is
the average duration of student visit)
Cost of public services accessible by foreign English language students allocated in proportion to likely usage, £ per capita per 4 .6 week
period (which is the average duration of a student visit)
Estimated additional or incremental cost to the United
Kingdom government of provision of public services to foreign English language students, £ per student visit
European Union transactions 7 0 0
Housing and community amenities
15 6 0
Environment protection 15 15 0
Recreation, culture and religion 16 16 0
Public order and safety 41 84 84
Defence 49 49 0
Economic affairs 53 53 28
General public services 95 27 0
Education 122 5 5
Health 175 81 80
Social protection 340 0 0
Total 929 336 197 Source: Capital Economics, HM Treasury and Office for National Statistics
28 Capital Economics
5 . Students’ contribution to the economyAlthough students who are from Europe don’t face the same restriction on access to public funds, rules in the United Kingdom exclude students from many benefits irrespective of nationality .39 In addition, European students have to have sufficient resources not to become a burden on the social assistance system of the United Kingdom during their period of residence .40 As such, any international student would not add to the government’s bill for social protection .
Students are typically quite young and are likely to be less demanding of the National Health Service than the average member of the population . Evidence suggests that the cost of healthcare provision for sixteen to 44 year olds is under half that of the average for the whole population .41
There may be some areas where student visitors consume more public resources than the average member of the population . The age profile of students is such that they are more likely to be a victim of, or commit, crimes, placing a larger burden on police resources .42 In addition, we allocate the cost of running the immigration department to non-United Kingdom nationals .
These effects are outweighed by the students’ reduced, or in some cases zero, usage of social protection, health, education and other public services . This puts the cost of public services accessible by foreign English language students allocated in proportion to their likely usage in a 4 .6 week period at £336 per capita . It is important to note
that this is not what the government actually pays for each additional student .
Third, we estimate the marginal cost to the government of providing public services to foreign English language students studying in the United Kingdom . This is relevant as it reflects the actual incremental amount the government would have to pay for each student visit . The government would not alter its spending plans for many public services, such as environmental protection, defence and housing and community amenities, because of an additional student visitor .
The additional cost is likely to be minimal for other services, such as public order and safety and health, but we conservatively use our adjusted average cost figures as upper bound marginal cost estimates .
We estimate the incremental cost to the exchequer of a foreign student studying on an English language course of typical duration, excluding any fiscal benefits they bring, to be £197 . This is materially lower than the £929 average cost of providing services to the general population in a 4 .6 week period .
Overall, international students on English language courses generate £318 million of tax revenues for the exchequer and cost £129 million through their use of public services, creating a net positive fiscal benefit of around £189 million, or £291 for the average student visit . (See Exhibit 26 .)
39 See: www .ukcisa .org .uk/International-Students/Fees--finance/Welfare-benefits/EEA-and-Swiss-students40 Great Britain, Immigration (European Economic Area) Regulations 2006 . SI 2006/1003 (The Stationary Office, Norwich), 2006 41 Office of Health Economics, Compendium of Health Statistics: 19th edition (Office of Health Economics, London), 200842 Ministry of Justice, Criminal Justice Statistics, England and Wales 2010 (Ministry of Justice, London), 2011
Exhibit 26: Net fiscal contribution of English language students, 2014
Total (£ millions)
Average per student visit (£)
Tax revenues generated 323 494
Less students’ consumption of public resources 129 197
Net fiscal contribution 194 297
Sources: Capital Economics
www .englishuk .com 29
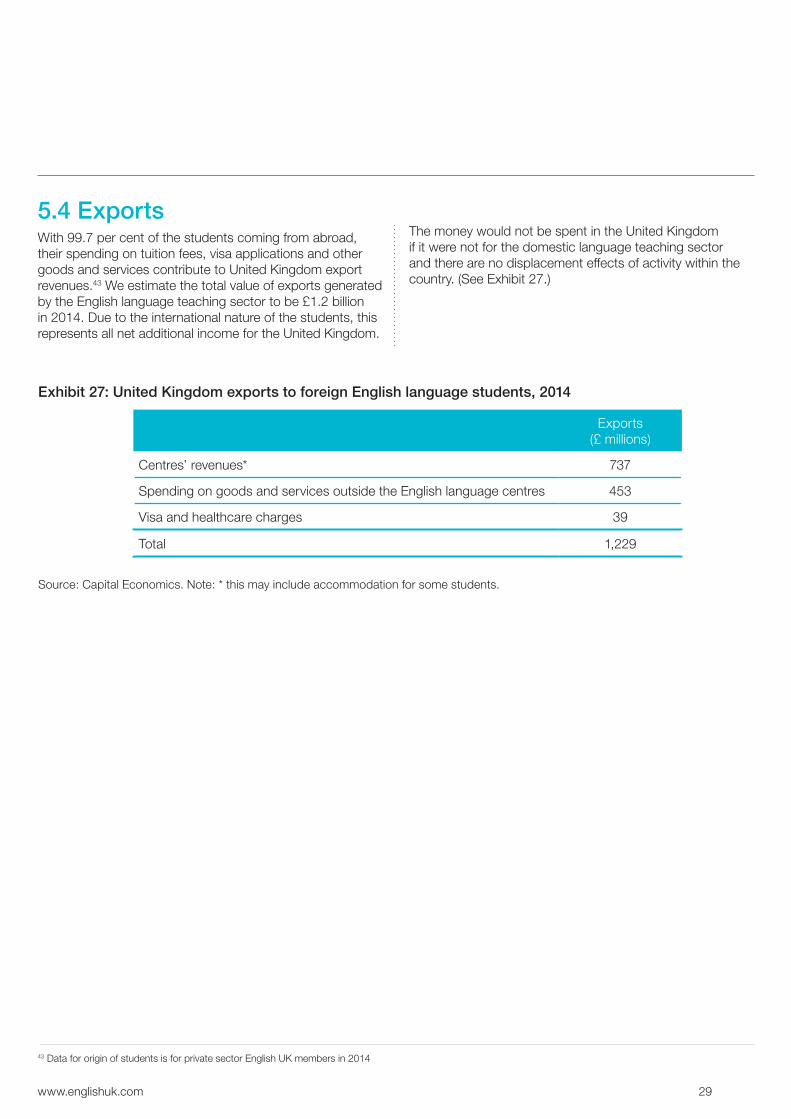
5.4 ExportsWith 99 .7 per cent of the students coming from abroad, their spending on tuition fees, visa applications and other goods and services contribute to United Kingdom export revenues .43 We estimate the total value of exports generated by the English language teaching sector to be £1 .2 billion in 2014 . Due to the international nature of the students, this represents all net additional income for the United Kingdom .
The money would not be spent in the United Kingdom if it were not for the domestic language teaching sector and there are no displacement effects of activity within the country . (See Exhibit 27 .)
43 Data for origin of students is for private sector English UK members in 2014
Exhibit 27: United Kingdom exports to foreign English language students, 2014
Exports (£ millions)
Centres’ revenues* 737
Spending on goods and services outside the English language centres 453
Visa and healthcare charges 39
Total 1,229
Source: Capital Economics . Note: * this may include accommodation for some students .
30 Capital Economics
6 . Post-study impact of English language studentsIn this section we examine how English language teaching benefits the British economy after the students have completed their courses . We assess the post-study activities of the students and the contribution of the current visa system to this and evaluate the implications of these for the United Kingdom .
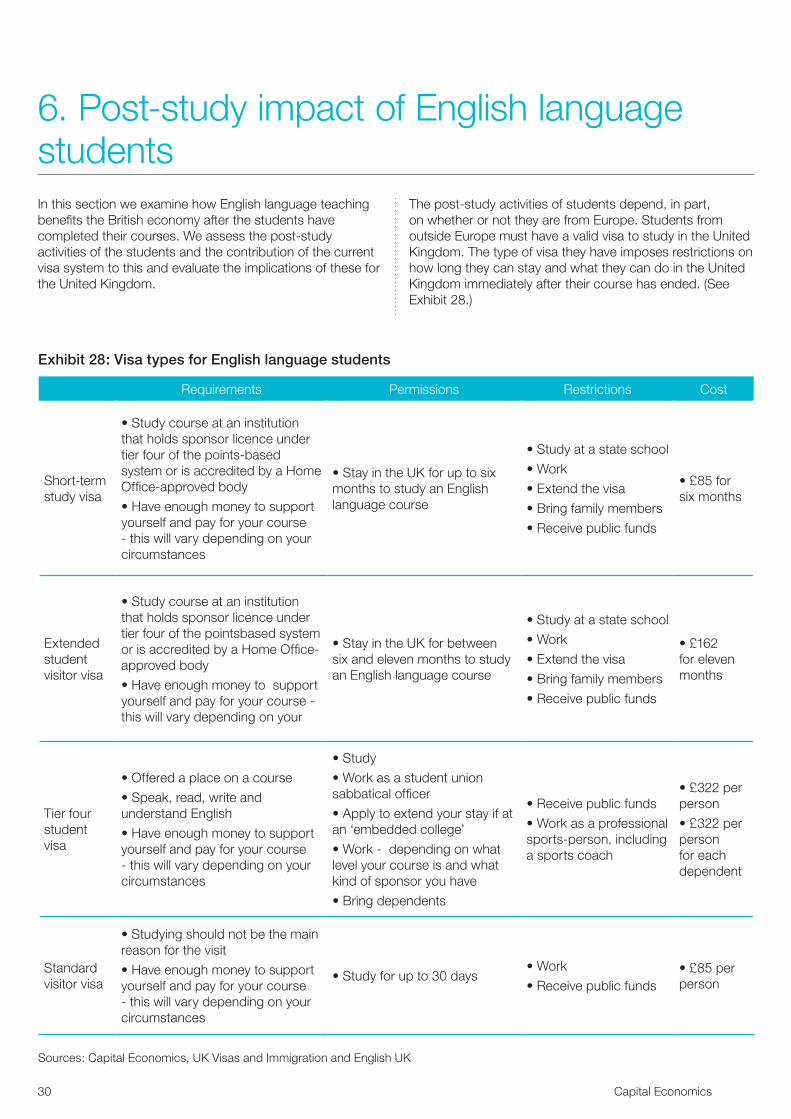
The post-study activities of students depend, in part, on whether or not they are from Europe . Students from outside Europe must have a valid visa to study in the United Kingdom . The type of visa they have imposes restrictions on how long they can stay and what they can do in the United Kingdom immediately after their course has ended . (See Exhibit 28 .)
Exhibit 28: Visa types for English language students
Requirements Permissions Restrictions Cost
Short-term study visa
•Studycourseataninstitutionthat holds sponsor licence under tier four of the points-based system or is accredited by a Home Office-approved body
•Haveenoughmoneytosupportyourself and pay for your course - this will vary depending on your circumstances
•StayintheUKforuptosixmonths to study an English language course
•Studyatastateschool
•Work
•Extendthevisa
•Bringfamilymembers
•Receivepublicfunds
•£85forsix months
Extended student visitor visa
•Studycourseataninstitutionthat holds sponsor licence under tier four of the pointsbased system or is accredited by a Home Office-approved body
•Haveenoughmoneytosupportyourself and pay for your course - this will vary depending on your
•StayintheUKforbetweensix and eleven months to study an English language course
•Studyatastateschool
•Work
•Extendthevisa
•Bringfamilymembers
•Receivepublicfunds
•£162for eleven months
Tier four student visa
•Offeredaplaceonacourse
•Speak,read,writeandunderstand English
•Haveenoughmoneytosupportyourself and pay for your course - this will vary depending on your circumstances
•Study
•Workasastudentunionsabbatical officer
•Applytoextendyourstayifatan ‘embedded college’
•Work-dependingonwhatlevel your course is and what kind of sponsor you have
•Bringdependents
•Receivepublicfunds
•Workasaprofessionalsports-person, including a sports coach
•£322perperson
•£322perperson for each dependent
Standard visitor visa
•Studyingshouldnotbethemainreason for the visit
•Haveenoughmoneytosupportyourself and pay for your course - this will vary depending on your circumstances
•Studyforupto30days•Work
•Receivepublicfunds•£85perperson
Sources: Capital Economics, UK Visas and Immigration and English UK
English UK 31
Data provided by English UK show that 45 per cent of students from outside Europe held a short-term study visa in 2014, a further quarter of students came using a child visitor visa, 15 per cent of students had a tier four student visa and the remainder came on other visas . This means that the majority of students from outside of Europe that come to the United Kingdom to study English are not entitled to stay once their course is completed .
A student’s decision to stay or leave after their course has finished affects whether they impose additional fiscal costs on the British taxpayer or generate benefits for the economy from inside or outside the United Kingdom .
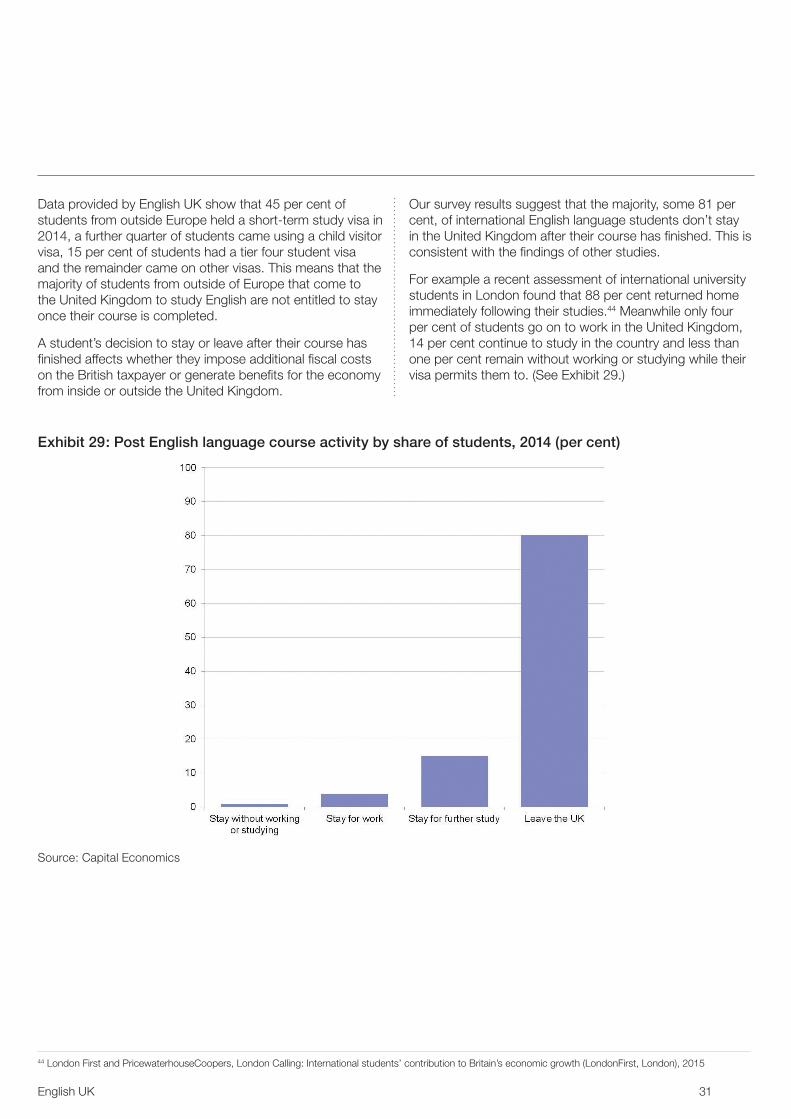
Our survey results suggest that the majority, some 81 per cent, of international English language students don’t stay in the United Kingdom after their course has finished . This is consistent with the findings of other studies .
For example a recent assessment of international university students in London found that 88 per cent returned home immediately following their studies .44 Meanwhile only four per cent of students go on to work in the United Kingdom, 14 per cent continue to study in the country and less than one per cent remain without working or studying while their visa permits them to . (See Exhibit 29 .)
Exhibit 29: Post English language course activity by share of students, 2014 (per cent)
Source: Capital Economics
44 London First and PricewaterhouseCoopers, London Calling: International students’ contribution to Britain’s economic growth (LondonFirst, London), 2015
32 Capital Economics
6 . Post-study impact of English language studentsThe majority of students return to their home country, which means that they impose no additional fiscal burden on the United Kingdom . However there could be future benefits for British trade as a result of their experiences studying here . A number of respondents to our survey commented how students often return on holiday or recommend Britain as a place to visit to friends and family . Meanwhile the majority of international students who have studied here are more likely to do business with the United Kingdom in the future .45
A 14 per cent share of English language students take up further study in the United Kingdom once they finish their English language course . The tuition provided by the centres helps to support the tertiary education sector in the United Kingdom by increasing the number of international students who attend .
This could either be because they now have the necessary English qualifications to study at universities or that their positive experiences here encourage them to apply . Although our survey results suggest that only 14 per cent of students stay for further study after their course finishes, this doesn’t capture those students who return home first and then come back to further their education . Often the terms of their visa will mean they have to leave the country before they can apply to study here again .
The students that continue to live in the United Kingdom to undertake higher education courses will have a positive economic impact .46
Domestic full-time students in the United Kingdom typically spend £21,500 on subsistence and course fees in a 39 week academic year .47 If this is representative of the students who stay on after their English language course for further study, their expenditure could total in the order of £1 .9 billion each year .48 This does not take into account that university fees paid by international students are typically higher and is therefore a cautious estimate .
Studies of international students on higher education courses have found that students do make a positive contribution to the economy . One study has estimated that the overall spending by students and associated visitors from outside the United Kingdom supported £3 .5 billion of gross value added in 2011/12,49 while another has estimated that London’s international students bring a net
benefit of £2 .3 billion per annum to our economy or around £34,100 per student on average .50
The proportion of students that stay in the United Kingdom to work is small — only four per cent of students proceed to find employment after their course . But by teaching students the English language, the centres play a role in expanding the potential labour pool for businesses in the United Kingdom and can release the full potential of international workers in the United Kingdom . Highly skilled immigrants can be under-utilised by employers if they aren’t proficient speakers of the English language .51 Improving their English language skills can enhance their economic potential and contribution .
There are a small number of students that aren’t known to go directly into further study or employment immediately after their course finished . This group makes up less than one per cent of the total . This is immaterial and their consumption of public services would be outweighed by the net positive contributions of those that work or stay on to study .
45 London First and PricewaterhouseCoopers, London Calling: International students’ contribution to Britain’s economic growth (LondonFirst, London), 2015 46 We do not include these impacts in our headline numbers47 See www .nus .org .uk/en/news/press-releases/nus-figures-show-new-students-face-cost-of-living-crisis/ . We use the figure for students outside of London and uprate it to 2014 prices .48 Our survey results suggest that 14 per cent of students on English language courses or around 90,000 students stay on for further study in the United Kingdom .49 Universities UK, The impact of universities on the UK economy (Universities UK, London), 201450 London First and PricewaterhouseCoopers, London Calling: International students’ contribution to Britain’s economic growth (LondonFirst, London), 201551 Christian Dustmann, Tommaso Frattini and Ian Preston, ‘The Effect of Immigration along the Distribution of Wages’, Review of Economic Studies, 80(1), 2013
English UK 33
7 . Overall impactIn this section, we bring together the overall contribution of English language teaching centres and their students to the United Kingdom economy .
7.1 Overall impactThe English language teaching sector makes a significant contribution to the United Kingdom economy . This includes the money that students bring in to the country to spend on tuition fees and other goods and services, the activities of the centres themselves and the expenditure of their employees .
In 2014, there were 9,300 jobs in English language centres related to the teaching of English to international students, which added nearly £400 million of value to the economy . The centres’ spending on suppliers supported more than 5,000 jobs and over £200 million of gross value added . Furthermore, the spending of English language teaching employees on businesses around the country supports over
3,300 British jobs .
International English language students do not only create income for the centres that teach them . In 2014 their spending outside of the centres (on goods and services including food, drink, leisure activities and accommodation) supported nearly 9,000 jobs and £380 million in gross value added to the economy .
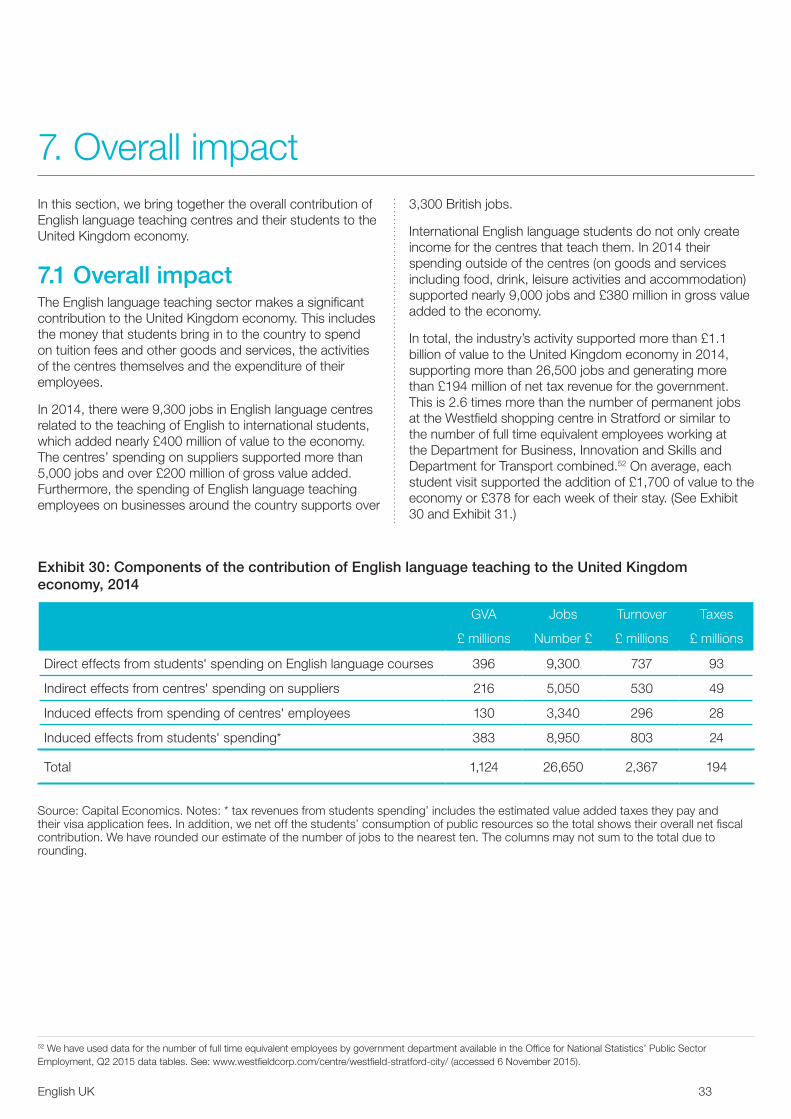
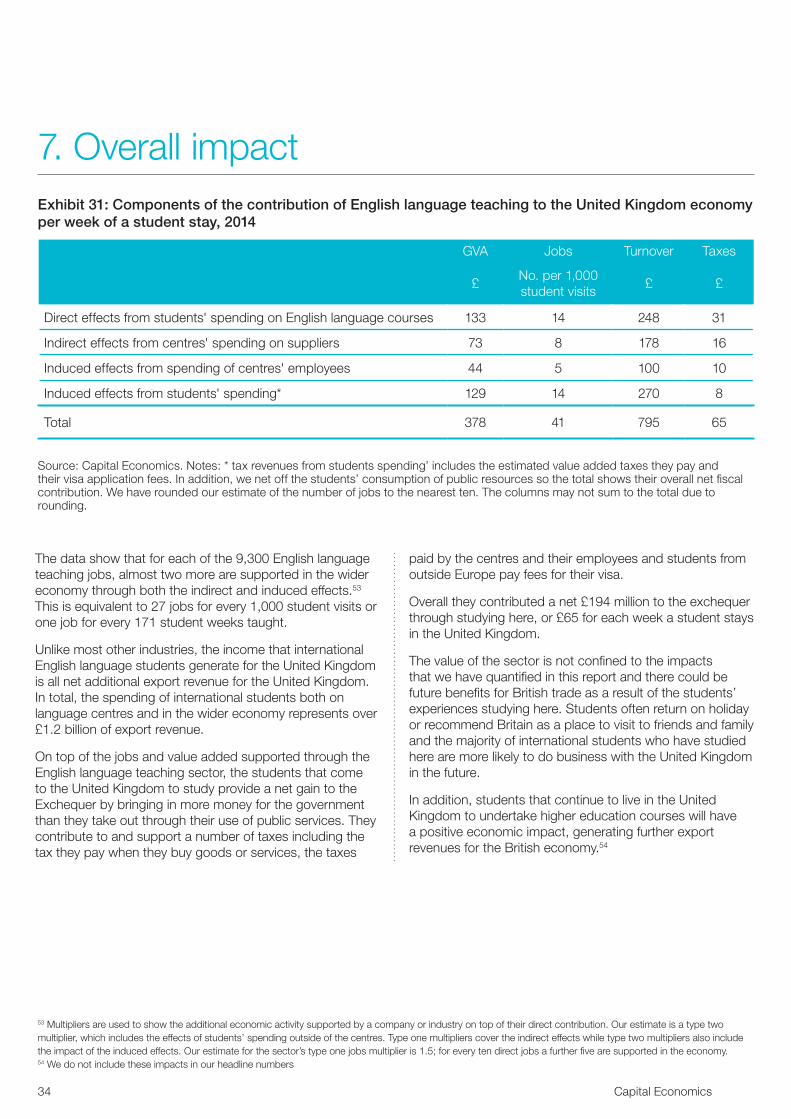
In total, the industry’s activity supported more than £1 .1 billion of value to the United Kingdom economy in 2014, supporting more than 26,500 jobs and generating more than £194 million of net tax revenue for the government . This is 2 .6 times more than the number of permanent jobs at the Westfield shopping centre in Stratford or similar to the number of full time equivalent employees working at the Department for Business, Innovation and Skills and Department for Transport combined .52 On average, each student visit supported the addition of £1,700 of value to the economy or £378 for each week of their stay . (See Exhibit 30 and Exhibit 31 .)
Exhibit 30: Components of the contribution of English language teaching to the United Kingdom economy, 2014
GVA Jobs Turnover Taxes
£ millions Number £ £ millions £ millions
Direct effects from students' spending on English language courses 396 9,300 737 93
Indirect effects from centres' spending on suppliers 216 5,050 530 49
Induced effects from spending of centres' employees 130 3,340 296 28
Induced effects from students' spending* 383 8,950 803 24
Total 1,124 26,650 2,367 194
Source: Capital Economics . Notes: * tax revenues from students spending’ includes the estimated value added taxes they pay and their visa application fees . In addition, we net off the students’ consumption of public resources so the total shows their overall net fiscal contribution . We have rounded our estimate of the number of jobs to the nearest ten . The columns may not sum to the total due to rounding .
52 We have used data for the number of full time equivalent employees by government department available in the Office for National Statistics’ Public Sector Employment, Q2 2015 data tables . See: www .westfieldcorp .com/centre/westfield-stratford-city/ (accessed 6 November 2015) .
34 Capital Economics
The data show that for each of the 9,300 English language teaching jobs, almost two more are supported in the wider economy through both the indirect and induced effects .53 This is equivalent to 27 jobs for every 1,000 student visits or one job for every 171 student weeks taught .
Unlike most other industries, the income that international English language students generate for the United Kingdom is all net additional export revenue for the United Kingdom . In total, the spending of international students both on language centres and in the wider economy represents over £1 .2 billion of export revenue .
On top of the jobs and value added supported through the English language teaching sector, the students that come to the United Kingdom to study provide a net gain to the Exchequer by bringing in more money for the government than they take out through their use of public services . They contribute to and support a number of taxes including the tax they pay when they buy goods or services, the taxes
paid by the centres and their employees and students from outside Europe pay fees for their visa .
Overall they contributed a net £194 million to the exchequer through studying here, or £65 for each week a student stays in the United Kingdom .
The value of the sector is not confined to the impacts that we have quantified in this report and there could be future benefits for British trade as a result of the students’ experiences studying here . Students often return on holiday or recommend Britain as a place to visit to friends and family and the majority of international students who have studied here are more likely to do business with the United Kingdom in the future .
In addition, students that continue to live in the United Kingdom to undertake higher education courses will have a positive economic impact, generating further export revenues for the British economy .54
Exhibit 31: Components of the contribution of English language teaching to the United Kingdom economy per week of a student stay, 2014
GVA Jobs Turnover Taxes
£No . per 1,000 student visits
£ £
Direct effects from students' spending on English language courses 133 14 248 31
Indirect effects from centres' spending on suppliers 73 8 178 16
Induced effects from spending of centres' employees 44 5 100 10
Induced effects from students' spending* 129 14 270 8
Total 378 41 795 65
Source: Capital Economics . Notes: * tax revenues from students spending’ includes the estimated value added taxes they pay and their visa application fees . In addition, we net off the students’ consumption of public resources so the total shows their overall net fiscal contribution . We have rounded our estimate of the number of jobs to the nearest ten . The columns may not sum to the total due to rounding .
53 Multipliers are used to show the additional economic activity supported by a company or industry on top of their direct contribution . Our estimate is a type two multiplier, which includes the effects of students’ spending outside of the centres . Type one multipliers cover the indirect effects while type two multipliers also include the impact of the induced effects . Our estimate for the sector’s type one jobs multiplier is 1 .5; for every ten direct jobs a further five are supported in the economy .54 We do not include these impacts in our headline numbers
7 . Overall impact
English UK 35
Appendix: methodology
Distribution of the surveyOur survey was sent to 568 English language teaching centres that are accredited by Accreditation UK – the quality assurance scheme run by English UK and the British Council .55
The survey covered a number of key topics:
• The centres’ turnover, including the share that is directly attributable to English language teaching courses, the number of permanent and temporary employees, the number of hours these employees typically work and the total wage bill
• The estimated average expenditure of the centres’ students per week excluding fees and other expenses paid to the centre
• The post-study activities of English language students, including the share that leave the United Kingdom immediately after their course and those that stay to continue their education or work
The survey was distributed as a web link to fill in via an online form . The information was collected between May and August 2015 . The data were collected for 2014 .
Survey response rateOf the full list of centres that were sent the survey, we received 222 responses representing 237 schools, giving an overall response rate of 41 .7 per cent .
Supplementary informationIn addition, we have been able to extract relevant information from quarterly and annual statistics collected by English UK from its members and by the British Council .
Estimation techniquesWe estimate the total number of students who studied at the 568 centres with accreditation from Accreditation UK in 2014 using data provided by English UK and the British Council .
For centres without data from those sources, we estimate the number of students by their revenues from English language teaching from our survey results . We assume that the centres that we have no data for are equivalent to the average of the other centres .
We use detail on the centres’ characteristics to scale up our survey results for revenues from English language teaching to estimate an industry total .
Our survey captures the centres’ revenues from English language teaching for 27 per cent of the 568 centres with accreditation from Accreditation UK . We estimate the revenue per student week taught, adjusting for the centre’s region and whether it operates in the private or state sector, and use these data and the number of student weeks taught for centres which did not respond to the survey to scale up to an industry total .
Our survey captures the centres’ total expenditure for 25 per cent of the 568 centres with accreditation from Accreditation UK . We estimate the expenditure of centres for which we had no response by the number of full-time equivalent employees at the centres .
We assume that the proportion of expenditure that relates to English language teaching is equivalent to the share of their total revenues from teaching English as a foreign language .
Indirect effects: impact through the supply chainTo estimate the ‘indirect effects’ we deployed the Office for National Statistics’ input-output tables, which provide data on the linkages between different sectors of the economy .
We use our survey results to estimate the industry’s spending on different sectors, which we feed through the input-output tables in an iterative process which allows us to estimate employment and gross value added supported each time the spending is recycled through the supply chain .
Induced effects: impact through employees’ spendingOur survey results provide salary costs for 26 per cent of the 568 accredited centres . We estimate the salary bill for other centres by the number of full time equivalent employees, and adjust for the centre’s region and whether or not it is private or state sector .
This provides us with a total of salaries paid by the industry . We deduct taxes using the average effective taxation rate for the average wage . We further deduct our assumed savings ratio of five per cent to leave total net consumer spending .
55 See a full list at: www .britishcouncil .org/education/accreditation/centres . Number of listed centres correct as of 24 August 2015 .
36 Capital Economics
Appendix: methodologyWe allocate spending to sectors within the standard industrial classification (2007) based on spending patterns taken from the Family Spending Survey, the majority of which goes directly into the retail and services sectors .
This is fed into iterations of the input-output tables to get estimates of the jobs and gross value added supported by the spending of employees as it is recycled through the economy .
Impact of students’ spendingThe average weekly expenditure of the centres’ students, in addition to the fees and expenses they pay the centres directly, was taken from our survey .
We scale this up by the number of student visitors each year and the average duration of stay in the United Kingdom to estimate the total spending by students outside of the centres .
We allocate their spending to sectors within the standard industrial classification (2007) based on spending patterns taken from the student income and expenditure survey 2011 to 2012 . We assume that half of the students pay the centres directly for their accommodation and the remaining half pay other providers .
The majority of spending goes directly into the retail and services sectors . This is fed into iterations of the input-output tables to get estimates of the jobs and gross value added supported by the spending of students as it is recycled through the economy .
Fiscal contributionWe estimate the fiscal contribution of the students on English language courses at the centres to the exchequer from several sources and deduct the resources they consume through their use of public services when they stay in the United Kingdom .
First, we estimate the tax revenues paid by the English language centres as a result of their English language tuition . We use our survey results to estimate the average rate of corporation tax paid by private sector centres and apply this to their actual or estimated profits . We assume that state sector centres pay no corporation tax . We estimate business rates using our survey results and adjusting for the region the centre is located in and whether it is private or state sector . Data for corporation tax and business rates were taken from our survey . From our estimate of total salaries, we calculate employer and employee related taxes
using the average effective taxation rate for the average wage of employees in the industry as per our survey results .
Second, we estimate the tax revenues generated by the spending of centres on suppliers, the spending of the centres’ employees and from the wages and profits supported by the students’ spending outside the centres . We assume that businesses pay corporation tax at a rate of 20 per cent on the profits supported and use the average effective taxation rate for the jobs supported .
Third, we estimate the fees paid by students from outside Europe for their visas . We use the fees set out in current government policy and use data from English UK and the British Council to estimate the number of students on different visa types .
Fourth, we estimate the value added tax on students’ spending outside the centres . We allocate the students’ spending to different products using the results of the Student Income and Expenditure survey 2011/12 . We then determine what rate of tax is applicable for that expenditure .
55 See a full list at: www .britishcouncil .org/education/accreditation/centres . Number of listed centres correct as of 24 August 2015 .


englishuk .com