Supporting Online Material pear roasted pecan potato pineapple watermelon yam muscat grape lemon...
16
Supporting Online Material Flavor network and the principles of food pairing by Yong-Yeol Ahn, Sebastian E. Ahnert, James P. Bagrow, Albert-L´ aszl´ o Barab´ asi Table of Contents S1 Materials and methods 2 S1.1 Flavor network .................................... 2 S1.1.1 Ingredient-compounds bipartite network ................... 2 S1.1.2 Incompleteness of data and the third edition ................. 3 S1.1.3 Extracting the backbone ........................... 5 S1.1.4 Sociological bias ............................... 6 S1.2 Recipes ........................................ 6 S1.2.1 Size of recipes ................................. 7 S1.2.2 Frequency of recipes ............................. 10 S1.3 Number of shared compounds ............................ 10 S1.4 Shared compounds hypothesis ............................ 11 S1.4.1 Null models .................................. 11 S1.4.2 Ingredient contributions ............................ 13 List of Figures S1 Full ingredient network ................................ 2 S2 Degree distribution of flavor network ......................... 3 S3 Comparing the third and fifth edition of Fenaroli’s .................. 4 S4 Backbone ....................................... 5 S5 Potential biases .................................... 6 S6 Coherency of datasets ................................. 8 S7 Number of ingredients per recipe ........................... 9 S8 The distribution of duplicated recipes ......................... 10 S9 Measures ....................................... 11 S10 Null models ...................................... 12 S11 Shared compounds and usage ............................. 13 List of Tables S1 Statistics of 3rd and 5th editions ........................... 3 S2 Recipe dataset ..................................... 7 S3 Coherence of cuisines ................................. 8 S4 Each cuisine’s average number of ingredients per recipe ............... 9 S5 Top contributors in North American and East Asian cuisines ............ 15 1
Transcript of Supporting Online Material pear roasted pecan potato pineapple watermelon yam muscat grape lemon...
Supporting Online Material
Flavor network and the principles of food pairingby Yong-Yeol Ahn, Sebastian E. Ahnert, James P. Bagrow, Albert-Laszlo Barabasi
Table of ContentsS1 Materials and methods 2
S1.1 Flavor network . . . . . . . . . . . . . . . . . . . . . . . . . . . . . . . . . . . . 2S1.1.1 Ingredient-compounds bipartite network . . . . . . . . . . . . . . . . . . . 2S1.1.2 Incompleteness of data and the third edition . . . . . . . . . . . . . . . . . 3S1.1.3 Extracting the backbone . . . . . . . . . . . . . . . . . . . . . . . . . . . 5S1.1.4 Sociological bias . . . . . . . . . . . . . . . . . . . . . . . . . . . . . . . 6
S1.2 Recipes . . . . . . . . . . . . . . . . . . . . . . . . . . . . . . . . . . . . . . . . 6S1.2.1 Size of recipes . . . . . . . . . . . . . . . . . . . . . . . . . . . . . . . . . 7S1.2.2 Frequency of recipes . . . . . . . . . . . . . . . . . . . . . . . . . . . . . 10
S1.3 Number of shared compounds . . . . . . . . . . . . . . . . . . . . . . . . . . . . 10S1.4 Shared compounds hypothesis . . . . . . . . . . . . . . . . . . . . . . . . . . . . 11
S1.4.1 Null models . . . . . . . . . . . . . . . . . . . . . . . . . . . . . . . . . . 11S1.4.2 Ingredient contributions . . . . . . . . . . . . . . . . . . . . . . . . . . . . 13
List of FiguresS1 Full ingredient network . . . . . . . . . . . . . . . . . . . . . . . . . . . . . . . . 2S2 Degree distribution of flavor network . . . . . . . . . . . . . . . . . . . . . . . . . 3S3 Comparing the third and fifth edition of Fenaroli’s . . . . . . . . . . . . . . . . . . 4S4 Backbone . . . . . . . . . . . . . . . . . . . . . . . . . . . . . . . . . . . . . . . 5S5 Potential biases . . . . . . . . . . . . . . . . . . . . . . . . . . . . . . . . . . . . 6S6 Coherency of datasets . . . . . . . . . . . . . . . . . . . . . . . . . . . . . . . . . 8S7 Number of ingredients per recipe . . . . . . . . . . . . . . . . . . . . . . . . . . . 9S8 The distribution of duplicated recipes . . . . . . . . . . . . . . . . . . . . . . . . . 10S9 Measures . . . . . . . . . . . . . . . . . . . . . . . . . . . . . . . . . . . . . . . 11S10 Null models . . . . . . . . . . . . . . . . . . . . . . . . . . . . . . . . . . . . . . 12S11 Shared compounds and usage . . . . . . . . . . . . . . . . . . . . . . . . . . . . . 13
List of TablesS1 Statistics of 3rd and 5th editions . . . . . . . . . . . . . . . . . . . . . . . . . . . 3S2 Recipe dataset . . . . . . . . . . . . . . . . . . . . . . . . . . . . . . . . . . . . . 7S3 Coherence of cuisines . . . . . . . . . . . . . . . . . . . . . . . . . . . . . . . . . 8S4 Each cuisine’s average number of ingredients per recipe . . . . . . . . . . . . . . . 9S5 Top contributors in North American and East Asian cuisines . . . . . . . . . . . . 15
1

S1 Materials and methods
S1.1 Flavor networkS1.1.1 Ingredient-compounds bipartite network
The starting point of our research is Fenaroli’s handbook of flavor ingredients (fifth edition [1]),which offers a systematic list of flavor compounds and their natural occurrences (food ingredients).Two post-processing steps were necessary to make the dataset appropriate for our research: (A) Inmany cases, the book lists the essential oil or extract instead of the ingredient itself. Since these arephysically extracted from the original ingredient, we associated the flavor compounds in the oilsand extracts with the original ingredient. (B) Another post-processing step is including the flavorcompounds of a more general ingredient into a more specific ingredient. For instance, the flavorcompounds in ‘meat’ can be safely assumed to also be in ‘beef’ or ‘pork’. ‘Roasted beef’ containsall flavor compounds of ‘beef’ and ‘meat’.
The ingredient-compound association extracted from [1] forms a bipartite network. As thename suggests, a bipartite network consists of two types of nodes, with connections only betweennodes of different types. Well known examples of bipartite networks include collaboration net-works of scientists [2] (with scientists and publications as nodes) and actors [3] (with actors andfilms as nodes), or the human disease network [4] which connects health disorders and diseasegenes. In the particular bipartite network we study here, the two types of nodes are food ingredi-ents and flavor compounds, and a connection signifies that an ingredient contains a compound.
The full network contains 1,107 chemical compounds and 1,531 ingredients, but only 381ingredients appear in recipes, together containing 1,021 compounds (see Fig. S1). We project thisnetwork into a weighted network between ingredients only [5, 6, 7, 8]. The weight of each edgewi j is the number of compounds shared between the two nodes (ingredients) i and j, so that therelationship between the M×M weighted adjacency matrix wi j and the N×M bipartite adjacency
Figure S1: The full flavor network. The size of anode indicates average prevalence, and the thicknessof a link represents the number of shared compounds.All edges are drawn. It is impossible to observe indi-vidual connections or any modular structure.
2
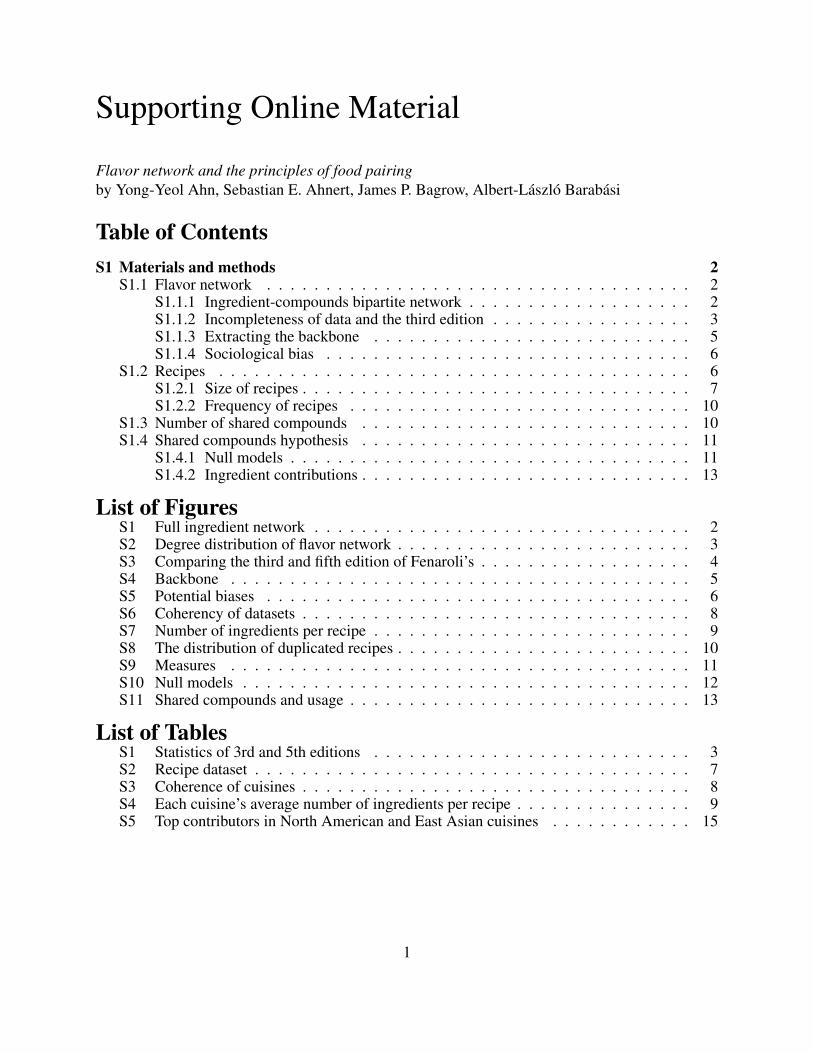
3rd eds. 5th eds.# of ingredients 916 1507# of compounds 629 1107
# of edges in I-C network 6672 36781
Table S1: The basic statistics on two different datasets. The 5th Edition of Fenaroli’s handbook contains much moreinformation than the third edition.
matrix aik (for ingredient i and compound k) is given by:
wi j =N
∑k=1
aika jk (S1)
The degree distributions of ingredients and compounds are shown in Fig. S2.
S1.1.2 Incompleteness of data and the third edition
The situation encountered here is similar to the one encountered in systems biology: we do nothave a complete database of all protein, regulatory and metabolic interactions that are present inthe cell. In fact, the existing protein interaction data covers less than 10% of all protein interactionsestimated to be present in the human cell [9].
To test the robustness of our results against the incompleteness of data, we have performed
100
101
102
103
100 101 102 103
N(k
i)
Ingredient degree, ki
100
101
102
103
100 101 102 103
N(k
c)
Compound degree, kc
100
101
102
100 101 102 103
N(k
)
Degree in ingredient network, k
100
101
102
103
104
100 101 102 103
N(k
i) (c
umul
ativ
e)
Ingredient degree, ki
100
101
102
103
104
100 101 102 103
N(k
c) (c
umul
ativ
e)
Compound degree, kc
100
101
102
103
104
100 101 102 103
N(k
) (cu
mul
ativ
e)
Degree in ingredient network, k
Figure S2: Degree distributions of the flavor network. Degree distribution of ingredients in the ingredient-compoundnetwork, degree distribution of flavor compounds in the ingredient-compound network, and degree distribution ofthe (projected) ingredient network, from left to right. Top: degree distribution. Bottom: complementary cumulativedistribution. The line and the exponent value in the leftmost figure at the bottom is purely for visual guide.
3
-0.05
0
0.05
0.1
0.15
0.2
0.25
0.3
NorthAmerican
WesternEuropean
LatinAmerican
SouthernEuropean
EastAsian
∆Ns
-4
-2
0
2
4
6
8
10
12
14
NorthAmerican
WesternEuropean
LatinAmerican
SouthernEuropean
EastAsian
Z
55.7
-0.4-0.2
00.20.40.60.8
11.21.41.61.8
NorthAmerican
WesternEuropean
LatinAmerican
SouthernEuropean
EastAsian
∆Ns
-4
-2
0
2
4
6
8
10
12
14
NorthAmerican
WesternEuropean
LatinAmerican
SouthernEuropean
EastAsian
Z
45.5
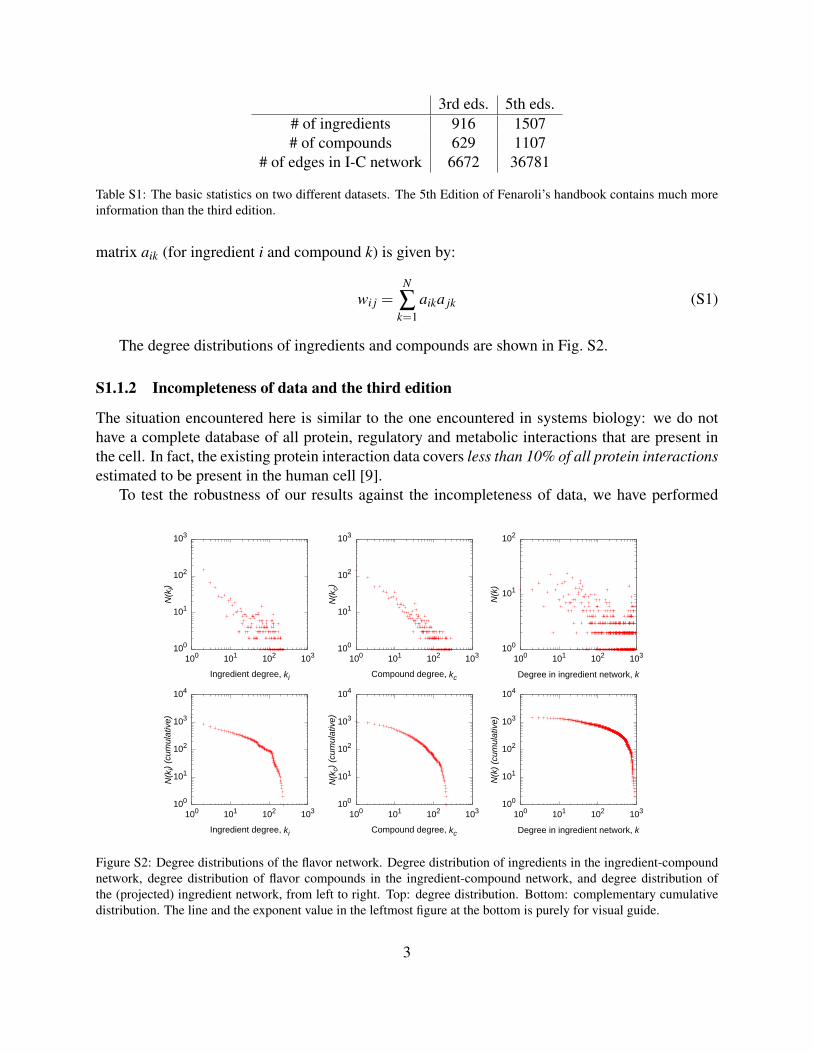
Figure S3: Comparing the third and fifth edition of Fenaroli’s to see if incomplete data impacts our conclusions. Themuch sparser data of the 3rd edition (Top) shows a very similar trend to that of the 5th edition (Bottom, repeatedfrom main text Fig. 3). Given the huge difference between the two editions (Table S1), this further supports that theobserved patterns are robust.
4
Alco
holic
drin
ks
Anim
alpr
oduc
ts
Dairy
Fruits
Herbs
Spices
Meats
Cereal
Nuts and seeds
Plants
Plant derivatives
Vegetables
Seaf
oods
Flow
ers
almond
leek
blueberrywoo
d
caviar
corn flake
fish
mandarin
bacon
lemongrass
apricot
olive
ruta
baga
herring
pear brandy
pars
nip
black pepper
kiwi
turn
ip
blue cheese
saffron
sunf
lowe
r oil
cass
ava
gree
n be
ll pe
pper
mango
cane
mol
asse
s
tom
ato
juic
e
licorice
smok
e
bell
pepp
er
gin
butterparmesan cheese
sesame seed
tarragon
salmon
macaroni
sage
currant
thyme
caca
o
carro
t
cured pork
fatty fish
anise seed
porc
ini
pork sausage
hazelnut
haddock
star anise
scallop
date
grape brandyrum
bitter orange
berry
zucc
hini
cucu
mbe
r
whole grain wheat flourbrown rice
marjoram
lettu
celim
a be
an
grilled beef
bartlett pear
woo
d sp
irit
litchi
hors
erad
ish
pean
ut o
il
ginger
bean
seed
huckleberry
cumin
lentil
bananapassion fruit
cilantro
barley
codsalmon roe
coco
a
nut
sour milkbutterfat
caps
icum
ann
uum
cash
ew
pear
ham
catfish
yogurt
root
beef liver
shiit
ake
leaf
basilparsley
tabasco pepper
mussel
black currant
camembert cheese
roas
ted
onio
nbl
ack
bean
cheddar cheese
orange
swiss cheese
fruit
rye bread
black raspberry
balm
pum
pkin
concord grapeco
ffee
pecan
juniper berry
lavender
cream
fried chicken
palm
boiled pork
roaste
d alm
ond
tulip
aspa
ragu
s
veal
cardamom
wild straw
berry
turmeric
mus
hroo
m
chicken broth
cayenne
smoked fish
sake
dill
prawn
romano cheese
man
darin
pee
l
orange flower
frankfurter
corn
brus
sels
spr
out
scal
lion
galanga
cabernet sauvignon wine
cream cheese
caraway
onio
ncele
ry o
il
endi
ve
rice bran
port wine
shrimp
walnut
peach
lambbeef broth
map
le s
yrup
soyb
ean
oil
crab
tamarind
citrusprickly pear
roaste
d pec
an
pota
to
pineapplew
atermelon
yam
muscat grape
lemon
pee
l
popcorn
jasm
ine
tea
okra
pean
ut
fennel
garlic
tom
ato
whiskey
tangerine
roquefort cheese
honeygrape juice
cider
bread
milk
cognac
yeas
t
corn grit
flower
clove
wine
papaya
cinnamon
raspberryavocado
katsuobushi
kumquat
ouzo
spearmint
pepp
erm
int o
il
strawberry
plum
feta cheese
rose
melon
laur
el
bayca
uliflo
wer
cabb
age
vege
table
orange juice
pistac
hio
kohlr
abi
lemon
fenugreek
bergamot
cranberry
coco
nut
saue
rkrau
t
rhub
arb
buttermilk
lovage
roasted beef
roaste
d nut
brandy
chicken
cherry brandy
shellfish
celer
ysq
uash
apple brandyarmagnac
chervil
blackberry brandy
nutmeg
pea
mint
lemon juice
lime
oat
vege
tabl
e oi
l
malt
soyb
ean
chick
pea
oran
ge p
eel
lardgr
een
tea
soy
sauc
e
mus
tard
quince
sherry wine
bake
d pota
to
beef pork liver
eggte
a
egg noodle
beet
beer
geranium
oyster
mutton
rosemary
chicken liver
tuna
gardenia
rye flour
lingonberry
chico
ry
potat
o chip
chive
blackberry
rape
seed
coriander
milk fat
mace
apple
pork
kale
blac
k te
a
liver
smoked salmon
beec
h
savory
grapefruit
vanilla
coco
nut o
il
fig
smoked sausage
champagne wine
roaste
d haz
elnut
chamomile
oliv
e oi
l
lime juice
roas
ted pe
anut
pepper
nectarine
cheese
buckwheat
holy basil
grape
meat
seaweed
white bread
kidney b
ean
broccoli
bone oil
sesa
me
oil
wheat bread wheat
angelica
rice
peppermint
lobster
cottage cheese
octopus
radish
watercress
squid
cereal
roas
ted se
same s
eed
anise
cherry
artichoke
oatmeal
white wine
mung bean
guava
vine
gar
violet
red wine
sturgeon caviar
clam
sherry
red kidney bean
turkey
crayfish
chayote
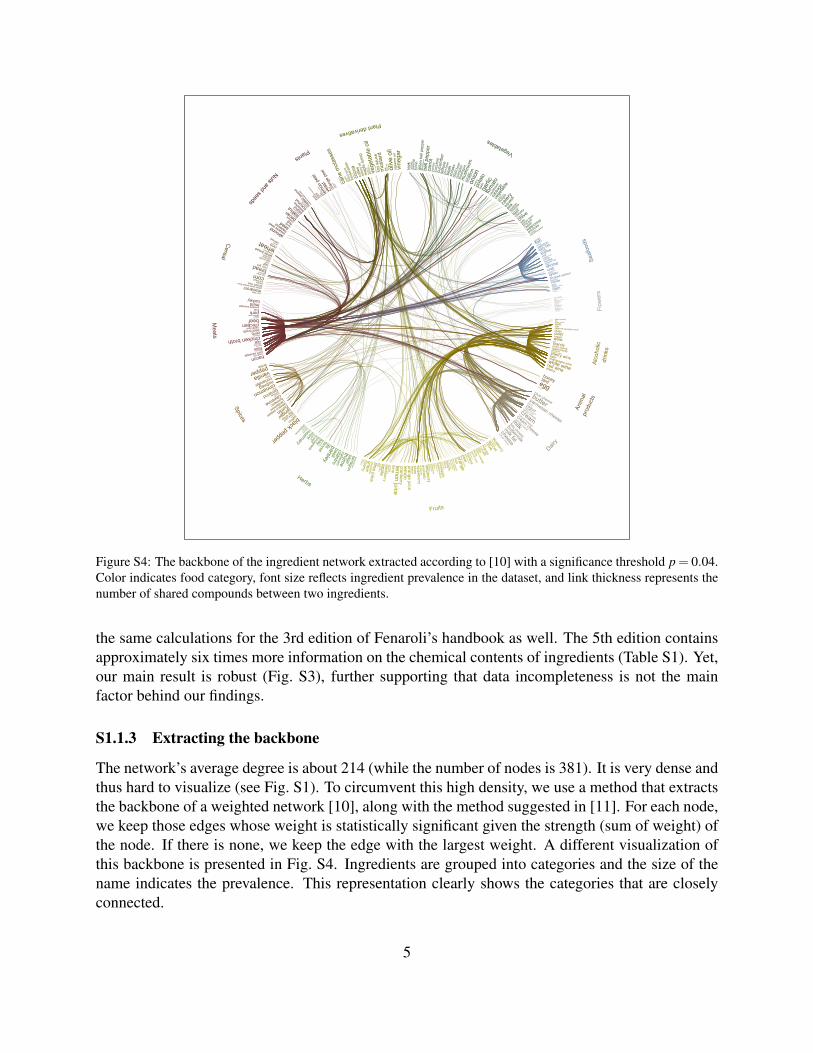
Figure S4: The backbone of the ingredient network extracted according to [10] with a significance threshold p = 0.04.Color indicates food category, font size reflects ingredient prevalence in the dataset, and link thickness represents thenumber of shared compounds between two ingredients.
the same calculations for the 3rd edition of Fenaroli’s handbook as well. The 5th edition containsapproximately six times more information on the chemical contents of ingredients (Table S1). Yet,our main result is robust (Fig. S3), further supporting that data incompleteness is not the mainfactor behind our findings.
S1.1.3 Extracting the backbone
The network’s average degree is about 214 (while the number of nodes is 381). It is very dense andthus hard to visualize (see Fig. S1). To circumvent this high density, we use a method that extractsthe backbone of a weighted network [10], along with the method suggested in [11]. For each node,we keep those edges whose weight is statistically significant given the strength (sum of weight) ofthe node. If there is none, we keep the edge with the largest weight. A different visualization ofthis backbone is presented in Fig. S4. Ingredients are grouped into categories and the size of thename indicates the prevalence. This representation clearly shows the categories that are closelyconnected.
5
0
50
100
150
200
250
300
0 100 200 300
Num
ber o
f com
poun
dsNorth AmericanA
B
p-value = 0.01 (*)
0
50
100
150
200
250
300
0 100 200 300
Num
ber o
f com
poun
ds
Western European
p-value = 0.07
0
50
100
150
200
250
300
0 100 200 300
Num
ber o
f com
poun
ds
Southern European
p-value = 0.23
0
50
100
150
200
250
300
0 100 200 300
Num
ber o
f com
poun
ds
Latin American
p-value = 0.04 (*)
0
50
100
150
200
250
300
0 100 200 300
Num
ber o
f com
poun
ds
East Asian
p-value = 0.12
0 50
100 150 200 250 300 350 400
0 100 200 300
Avg.
com
poun
d de
gree
Ingredient rank
p-value = 0.82
0 50
100 150 200 250 300 350 400
0 100 200 300
Avg.
com
poun
d de
gree
Ingredient rank
p-value = 0.99
0 50
100 150 200 250 300 350 400
0 100 200 300
Avg.
com
poun
d de
gree
Ingredient rank
p-value = 0.53
0 50
100 150 200 250 300 350 400
0 100 200 300
Avg.
com
poun
d de
gree
Ingredient rank
p-value = 0.50
0 50
100 150 200 250 300 350 400
0 100 200 300
Avg.
com
poun
d de
gree
Ingredient rank
p-value = 0.72
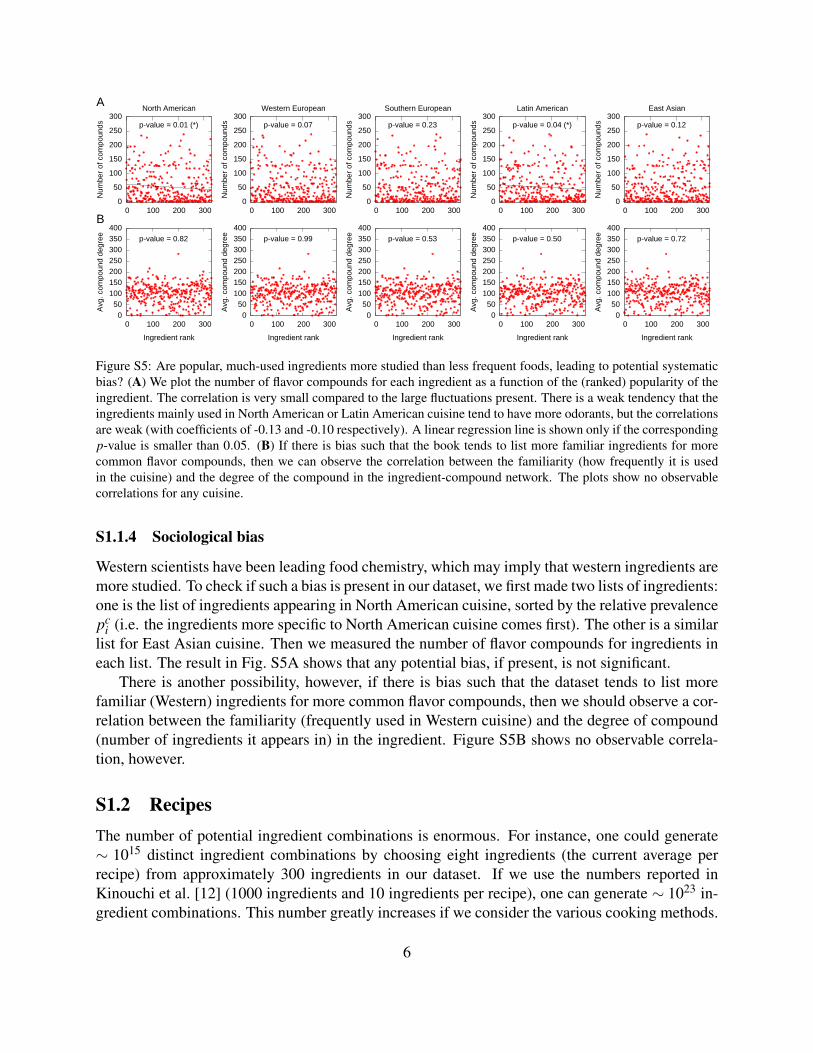
Figure S5: Are popular, much-used ingredients more studied than less frequent foods, leading to potential systematicbias? (A) We plot the number of flavor compounds for each ingredient as a function of the (ranked) popularity of theingredient. The correlation is very small compared to the large fluctuations present. There is a weak tendency that theingredients mainly used in North American or Latin American cuisine tend to have more odorants, but the correlationsare weak (with coefficients of -0.13 and -0.10 respectively). A linear regression line is shown only if the correspondingp-value is smaller than 0.05. (B) If there is bias such that the book tends to list more familiar ingredients for morecommon flavor compounds, then we can observe the correlation between the familiarity (how frequently it is usedin the cuisine) and the degree of the compound in the ingredient-compound network. The plots show no observablecorrelations for any cuisine.
S1.1.4 Sociological bias
Western scientists have been leading food chemistry, which may imply that western ingredients aremore studied. To check if such a bias is present in our dataset, we first made two lists of ingredients:one is the list of ingredients appearing in North American cuisine, sorted by the relative prevalencepc
i (i.e. the ingredients more specific to North American cuisine comes first). The other is a similarlist for East Asian cuisine. Then we measured the number of flavor compounds for ingredients ineach list. The result in Fig. S5A shows that any potential bias, if present, is not significant.
There is another possibility, however, if there is bias such that the dataset tends to list morefamiliar (Western) ingredients for more common flavor compounds, then we should observe a cor-relation between the familiarity (frequently used in Western cuisine) and the degree of compound(number of ingredients it appears in) in the ingredient. Figure S5B shows no observable correla-tion, however.
S1.2 RecipesThe number of potential ingredient combinations is enormous. For instance, one could generate∼ 1015 distinct ingredient combinations by choosing eight ingredients (the current average perrecipe) from approximately 300 ingredients in our dataset. If we use the numbers reported inKinouchi et al. [12] (1000 ingredients and 10 ingredients per recipe), one can generate ∼ 1023 in-gredient combinations. This number greatly increases if we consider the various cooking methods.
6

Table S2: Number of recipes and the detailed cuisines in each regional cuisine in the recipe dataset. Five groups havereasonably large size. We use all cuisine data when calculating the relative prevalence and flavor principles.
Cuisine set Number of recipes Cuisines includedNorth American 41525 American, Canada, Cajun, Creole, Southern
soul food, Southwestern U.S.Southern European 4180 Greek, Italian, Mediterranean, Spanish, Por-
tugueseLatin American 2917 Caribbean, Central American, South American,
MexicanWestern European 2659 French, Austrian, Belgian, English, Scottish,
Dutch, Swiss, German, IrishEast Asian 2512 Korean, Chinese, Japanese
Middle Eastern 645 Iranian, Jewish, Lebanese, TurkishSouth Asian 621 Bangladeshian, Indian, Pakistani
Southeast Asian 457 Indonesian, Malaysian, Filipino, Thai, Viet-namese
Eastern European 381 Eastern European, RussianAfrican 352 Moroccan, East African, North African, South
African, West AfricanNorthern European 250 Scandinavian
Regardless, the fact that this number exceeds by many orders of magnitude the∼ 106 recipes listedin the largest recipe repositories (e.g. http://cookpad.com) indicates that humans are exploitinga tiny fraction of the culinary space.
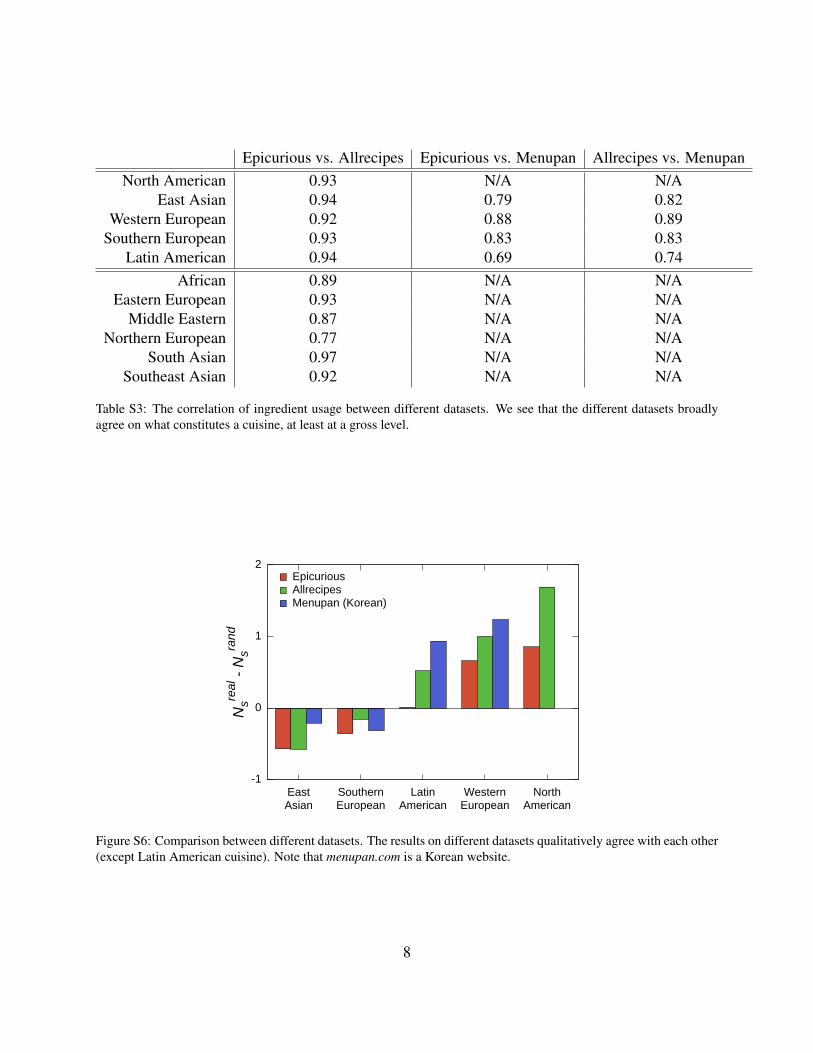
We downloaded all available recipes from three websites: allrecipes.com, epicurious.com, andmenupan.com. Recipes tagged as belonging to an ethnic cuisine are extracted and then groupedinto 11 larger regional groups. We used only 5 groups that each contain more than 1,000 recipes(See Table S2). In the curation process, we made a replacement dictionary for frequently usedphrases that should be discarded, synonyms for ingredients, complex ingredients that are brokeninto ingredients, and so forth. We used this dictionary to automatically extract the list of ingredientsfor each recipe. As shown in Fig. 1D, the usage of ingredients is highly heterogenous. Egg,wheat, butter, onion, garlic, milk, vegetable oil, and cream appear more than 10,000 recipes whilegeranium, roasted hazelnut, durian, muscat grape, roasted pecan, roasted nut, mate, jasmine tea,jamaican rum, angelica, sturgeon caviar, beech, lilac flower, strawberry jam, and emmental cheeseappear in only one recipe. Table S3 shows the correlation between ingredient usage frequency ineach cuisine and in each dataset. Figure. S6 shows that the three datasets qualitatively agree witheach other, offering a base to combine these datasets.
S1.2.1 Size of recipes
We reports the size of the recipes for each cuisine in Table S4. Overall, the mean number ofingredients per recipe is smaller than that reported in Kinouchi et al. [12]. We believe that it is
7
Epicurious vs. Allrecipes Epicurious vs. Menupan Allrecipes vs. MenupanNorth American 0.93 N/A N/A
East Asian 0.94 0.79 0.82Western European 0.92 0.88 0.89
Southern European 0.93 0.83 0.83Latin American 0.94 0.69 0.74
African 0.89 N/A N/AEastern European 0.93 N/A N/A
Middle Eastern 0.87 N/A N/ANorthern European 0.77 N/A N/A
South Asian 0.97 N/A N/ASoutheast Asian 0.92 N/A N/A
Table S3: The correlation of ingredient usage between different datasets. We see that the different datasets broadlyagree on what constitutes a cuisine, at least at a gross level.
-1
0
1
2
EastAsian
SouthernEuropean
LatinAmerican
WesternEuropean
NorthAmerican
Nsre
al -
Nsra
nd
EpicuriousAllrecipesMenupan (Korean)
Figure S6: Comparison between different datasets. The results on different datasets qualitatively agree with each other(except Latin American cuisine). Note that menupan.com is a Korean website.
8
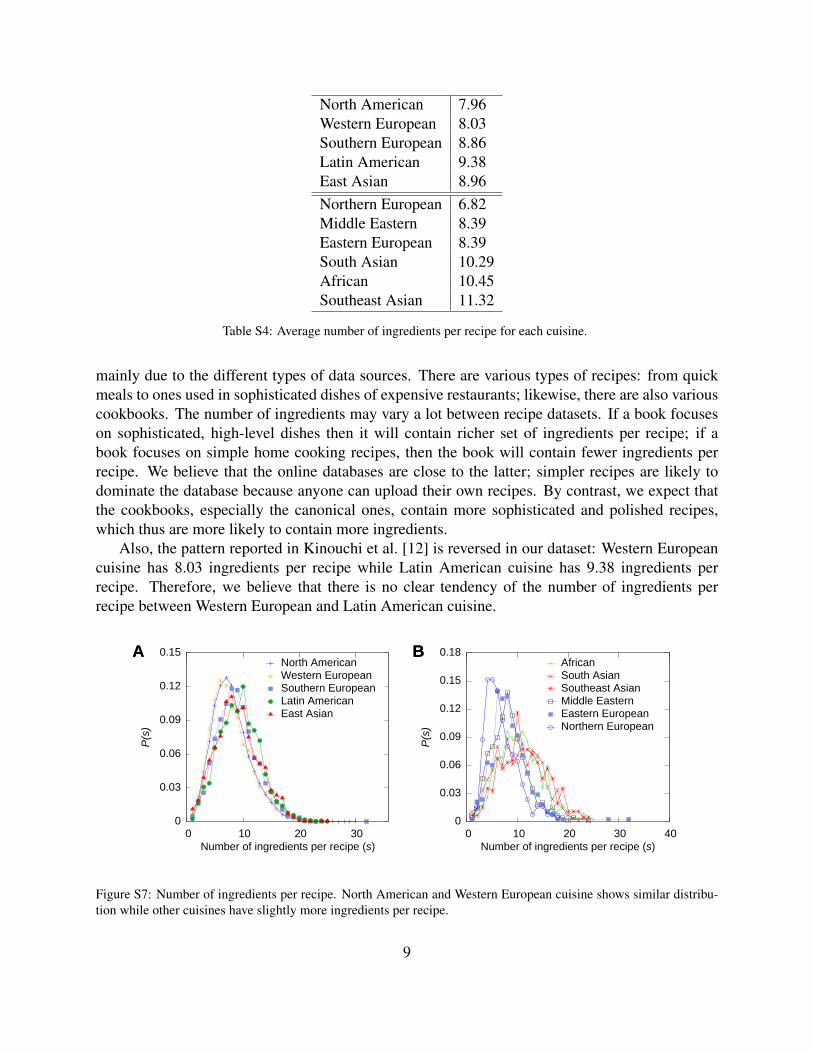
North American 7.96Western European 8.03Southern European 8.86Latin American 9.38East Asian 8.96Northern European 6.82Middle Eastern 8.39Eastern European 8.39South Asian 10.29African 10.45Southeast Asian 11.32
Table S4: Average number of ingredients per recipe for each cuisine.
mainly due to the different types of data sources. There are various types of recipes: from quickmeals to ones used in sophisticated dishes of expensive restaurants; likewise, there are also variouscookbooks. The number of ingredients may vary a lot between recipe datasets. If a book focuseson sophisticated, high-level dishes then it will contain richer set of ingredients per recipe; if abook focuses on simple home cooking recipes, then the book will contain fewer ingredients perrecipe. We believe that the online databases are close to the latter; simpler recipes are likely todominate the database because anyone can upload their own recipes. By contrast, we expect thatthe cookbooks, especially the canonical ones, contain more sophisticated and polished recipes,which thus are more likely to contain more ingredients.
Also, the pattern reported in Kinouchi et al. [12] is reversed in our dataset: Western Europeancuisine has 8.03 ingredients per recipe while Latin American cuisine has 9.38 ingredients perrecipe. Therefore, we believe that there is no clear tendency of the number of ingredients perrecipe between Western European and Latin American cuisine.
0
0.03
0.06
0.09
0.12
0.15
0 10 20 30
P(s
)
Number of ingredients per recipe (s)
A BNorth AmericanWestern EuropeanSouthern EuropeanLatin AmericanEast Asian
0
0.03
0.06
0.09
0.12
0.15
0.18
0 10 20 30 40
P(s
)
Number of ingredients per recipe (s)
A BAfricanSouth AsianSoutheast AsianMiddle EasternEastern EuropeanNorthern European
Figure S7: Number of ingredients per recipe. North American and Western European cuisine shows similar distribu-tion while other cuisines have slightly more ingredients per recipe.
9
1
10
100
1000
10000
100000
1 10 100N
umbe
r of r
ecip
es w
ith D
dup
licat
es
Number of duplicates, D
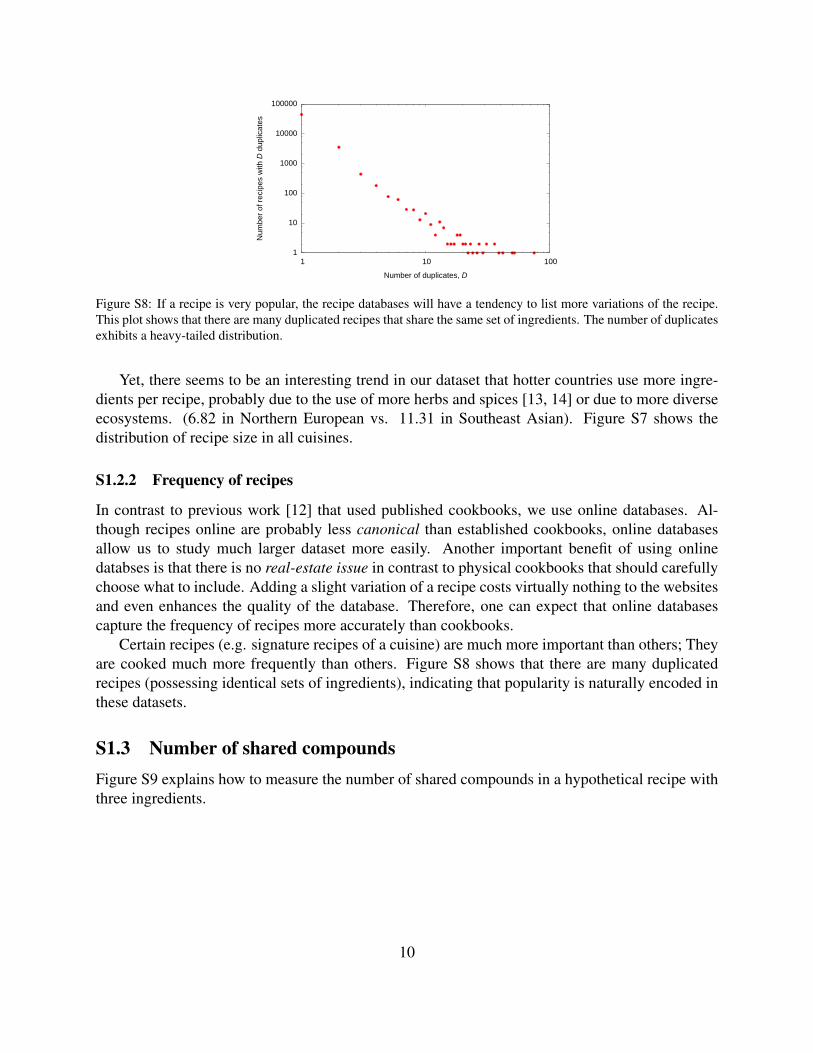
Figure S8: If a recipe is very popular, the recipe databases will have a tendency to list more variations of the recipe.This plot shows that there are many duplicated recipes that share the same set of ingredients. The number of duplicatesexhibits a heavy-tailed distribution.
Yet, there seems to be an interesting trend in our dataset that hotter countries use more ingre-dients per recipe, probably due to the use of more herbs and spices [13, 14] or due to more diverseecosystems. (6.82 in Northern European vs. 11.31 in Southeast Asian). Figure S7 shows thedistribution of recipe size in all cuisines.
S1.2.2 Frequency of recipes
In contrast to previous work [12] that used published cookbooks, we use online databases. Al-though recipes online are probably less canonical than established cookbooks, online databasesallow us to study much larger dataset more easily. Another important benefit of using onlinedatabses is that there is no real-estate issue in contrast to physical cookbooks that should carefullychoose what to include. Adding a slight variation of a recipe costs virtually nothing to the websitesand even enhances the quality of the database. Therefore, one can expect that online databasescapture the frequency of recipes more accurately than cookbooks.
Certain recipes (e.g. signature recipes of a cuisine) are much more important than others; Theyare cooked much more frequently than others. Figure S8 shows that there are many duplicatedrecipes (possessing identical sets of ingredients), indicating that popularity is naturally encoded inthese datasets.
S1.3 Number of shared compoundsFigure S9 explains how to measure the number of shared compounds in a hypothetical recipe withthree ingredients.
10

S1.4 Shared compounds hypothesisS1.4.1 Null models
In order to test the robustness of our findings, we constructed several random recipe datasets usinga series of appropriate null models and compare the mean number of shared compounds Ns be-tween the real and the randomized recipe sets. The results of these null models are summarized inFig. S10, each confirming the trends discussed in the paper. The null models we used are:
(A, B) Frequency-conserving. Cuisine c uses a set of nc ingredients, each with frequency fi. Fora given recipe with Ni ingredients in this cuisine, we pick Ni ingredients randomly from theset of all nc ingredients, according to fi. That is the more frequently an ingredient is used,the more likely the ingredient is to be picked. It preserves the prevalence of each ingredient.This is the null model presented in the main text.
(C, D) Frequency and ingredient category preserving. With this null model, we conserve thecategory (meats, fruits, etc) of each ingredient in the recipe, and when sample random in-gredients proportional to the prevalence. For instance, a random realization of a recipe withbeef and onion will contain a meat and a vegetable. The probability to pick an ingredient isproportional to the prevalence of the ingredient in the cuisine.
(E, F) Uniform random. We build a random recipe by randomly choosing an ingredient that isused at least once in the particular cuisine. Even very rare ingredients will frequently appearin random recipes.
(G, H) Uniform random, ingredient category preserving. For each recipe, we preserve the cat-egory of each ingredient, but not considering frequency of ingredients.
Although these null models greatly change the frequency and type of ingredients in the randomrecipes, North American and East Asian recipes show a robust pattern: North American recipesalways share more flavor compounds than expected and East Asian recipes always share less flavorcompounds than expected. This, together with the existence of both positive and negative Nreal
s −
Shared Compounds
ab
a cd
d
c fg
2
102+1+0
3=1
Binary
ab
a cd
d
c fg
1
10
1+1+03
=0.67
Jaccard
ab
a cd
d
c fg
2/6
1/50
1/3 + 1/53
=0.18
Figure S9: For a recipe with three ingredients, we count the number of shared compounds in every possible pair ofingredients, and divide it by the number of possible pair of ingredients.
11

0
1
2
NorthAmerican
WesternEuropean
LatinAmerican
SouthernEuropean
EastAsian
Nsre
al -
Nsra
nd
A B
C D
E F
G H
Frequencyconserving
-4
-2
0
2
4
6
8
10
NorthAmerican
WesternEuropean
LatinAmerican
SouthernEuropean
EastAsian
Z
Frequencyconserving
0
1
NorthAmerican
WesternEuropean
LatinAmerican
EastAsian
SouthernEuropean
Nsre
al -
Nsra
nd
Frequency and ingredientcategory preserving
-3-2-10123456789
10
NorthAmerican
WesternEuropean
LatinAmerican
EastAsian
SouthernEuropean
Z
Frequency and ingredientcategory preserving
-3
-2
-1
0
1
2
3
4
5
NorthAmerican
SouthernEuropean
WesternEuropean
LatinAmerican
EastAsian
Nsre
al -
Nsra
nd
Uniform random
-20
-10
0
10
20
30
40
50
NorthAmerican
SouthernEuropean
WesternEuropean
LatinAmerican
EastAsian
Z
Uniform random
-2
-1
0
1
2
NorthAmerican
SouthernEuropean
LatinAmerican
WesternEuropean
EastAsian
Nsre
al -
Nsra
nd
category preservingand uniform random
-20
-10
0
10
20
30
40
50
NorthAmerican
SouthernEuropean
LatinAmerican
WesternEuropean
EastAsian
Z
category preservingand uniform random
Figure S10: Four different null models. Although the size of the discrepancy between cuisines varies greatly, theoverall trend is stable.
12
0.1 0.3 0.5 0.7 0.9
0 50 100 150
P(n)
Number of shared compounds
LatinAmerican
0.1 0.3 0.5 0.7 0.9
P(n)
WesternEuropean
0.1 0.3 0.5 0.7 0.9
P(n)
NorthAmerican
0 50 100 150
Number of shared compounds
EastAsian
SouthernEuropean
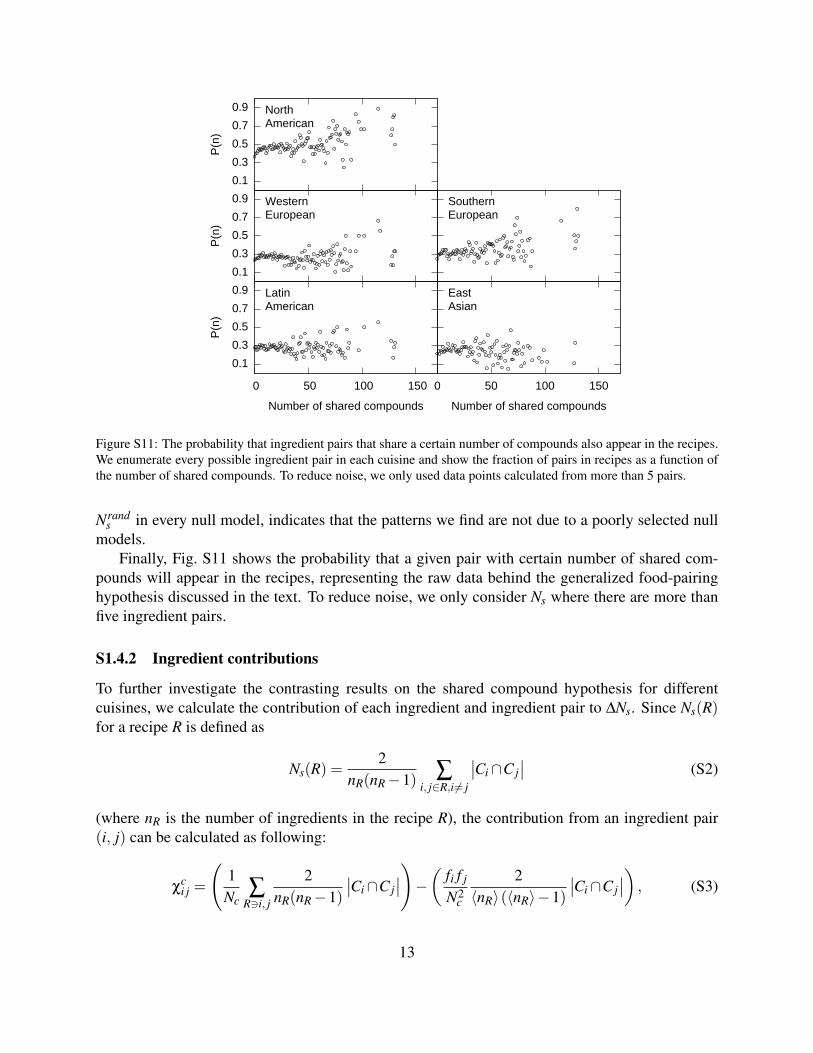
Figure S11: The probability that ingredient pairs that share a certain number of compounds also appear in the recipes.We enumerate every possible ingredient pair in each cuisine and show the fraction of pairs in recipes as a function ofthe number of shared compounds. To reduce noise, we only used data points calculated from more than 5 pairs.
Nrands in every null model, indicates that the patterns we find are not due to a poorly selected null
models.Finally, Fig. S11 shows the probability that a given pair with certain number of shared com-
pounds will appear in the recipes, representing the raw data behind the generalized food-pairinghypothesis discussed in the text. To reduce noise, we only consider Ns where there are more thanfive ingredient pairs.
S1.4.2 Ingredient contributions
To further investigate the contrasting results on the shared compound hypothesis for differentcuisines, we calculate the contribution of each ingredient and ingredient pair to ∆Ns. Since Ns(R)for a recipe R is defined as
Ns(R) =2
nR(nR−1) ∑i, j∈R,i 6= j
∣∣Ci∩C j∣∣ (S2)
(where nR is the number of ingredients in the recipe R), the contribution from an ingredient pair(i, j) can be calculated as following:
χci j =
(1
Nc∑
R3i, j
2nR(nR−1)
∣∣Ci∩C j∣∣)−( fi f j
N2c
2〈nR〉(〈nR〉−1)
∣∣Ci∩C j∣∣) , (S3)
13

where fi indicates the ingredient i’s number of occurrences. Similarly, the individual contributioncan be calculated:
χci =
(1
Nc∑R3i
2nR(nR−1) ∑
j 6=i( j,i∈R)
∣∣Ci∩C j∣∣)−( 2 fi
Nc〈nR〉∑ j∈c f j
∣∣Ci∩C j∣∣
∑ j∈c f j
). (S4)
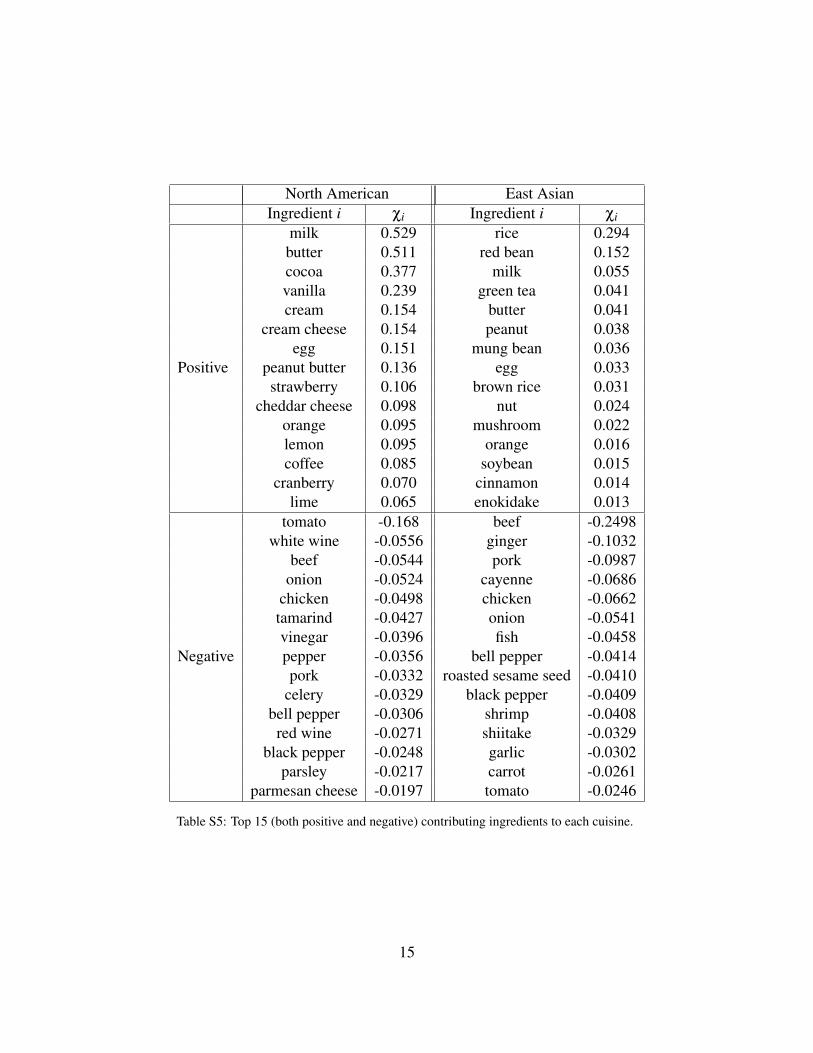
We list in Table. S5 the top contributors in North American and East Asian cuisines.
14
North American East AsianIngredient i χi Ingredient i χi
Positive
milk 0.529 rice 0.294butter 0.511 red bean 0.152cocoa 0.377 milk 0.055vanilla 0.239 green tea 0.041cream 0.154 butter 0.041
cream cheese 0.154 peanut 0.038egg 0.151 mung bean 0.036
peanut butter 0.136 egg 0.033strawberry 0.106 brown rice 0.031
cheddar cheese 0.098 nut 0.024orange 0.095 mushroom 0.022lemon 0.095 orange 0.016coffee 0.085 soybean 0.015
cranberry 0.070 cinnamon 0.014lime 0.065 enokidake 0.013
Negative
tomato -0.168 beef -0.2498white wine -0.0556 ginger -0.1032
beef -0.0544 pork -0.0987onion -0.0524 cayenne -0.0686
chicken -0.0498 chicken -0.0662tamarind -0.0427 onion -0.0541vinegar -0.0396 fish -0.0458pepper -0.0356 bell pepper -0.0414pork -0.0332 roasted sesame seed -0.0410
celery -0.0329 black pepper -0.0409bell pepper -0.0306 shrimp -0.0408red wine -0.0271 shiitake -0.0329
black pepper -0.0248 garlic -0.0302parsley -0.0217 carrot -0.0261
parmesan cheese -0.0197 tomato -0.0246
Table S5: Top 15 (both positive and negative) contributing ingredients to each cuisine.
15

References[1] Burdock, G. A. Fenaroli’s handbook of flavor ingredients (CRC Press, 2004), 5th edn.
[2] Newman, M. E. J. The structure of scientific collaboration networks. Proc. Natl. Acad. Sci.USA 98, 404 (2001).
[3] Watts, D. J. & Strogatz, S. H. Collective dynamics of ‘small-world’ networks. Natue 393,440 (1998).
[4] Goh, K.-I. et al. The human disease network. Proc. Natl. Acad. Sci. USA 104, 8685 (2007).
[5] Newman, M. E. J., Barabasi, A.-L. & Watts, D. J. The structure and dynamics of networks:(Princeton University Press, 2006).
[6] Caldarelli, G. Scale-free networks: complex webs in nature and technology (Oxford Univer-sity Press, USA, 2007).
[7] Dorogovtsev, S. N. & Mendes, J. F. F. Evolution of networks: from biological nets to theinternet and WWW (Oxford University Press, USA, 2003).
[8] Barrat, A., Barthelemy, M., Pastor-Satorras, R. & Vespignani, A. The architecture of complexweighted networks. Proc. Nat. Acad. Sci. 111, 3747 (2004).
[9] Venkatesan, K. et al. An empirical framework for binary interactome mapping. NatureMethods 6, 83–90 (2009).
[10] Serrano, M. A., Boguna, M. & Vespignani, A. Extracting the multiscale backbone of com-plex weighted networks. Proceedings of the National Academy of Sciences 106, 6483–6488(2009).
[11] Lee, S. H., Kim, P.-J., Ahn, Y.-Y. & Jeong, H. Googling social interactions: web searchengine based social network construction. PLoS One 5, e11233 (2010).
[12] Kinouchi, O., Diez-Garcia, R. W., Holanda, A. J., Zambianchi, P. & Roque, A. C. Thenon-equilibrium nature of culinary evolution. New Journal of Physics 10, 073020 (2008).
[13] Billing, J. & Sherman, P. W. Antimicrobial functions of spices: why some like it hot. TheQuarterly Review of Biology 73, 3–49 (1998).
[14] Sherman, P. W. & Hash, G. A. Why vegetable recipes are not very spicy. Evolution andHuman Behavior 22, 147–163 (2001).
16