Supporting Material - University of Cambridge
8
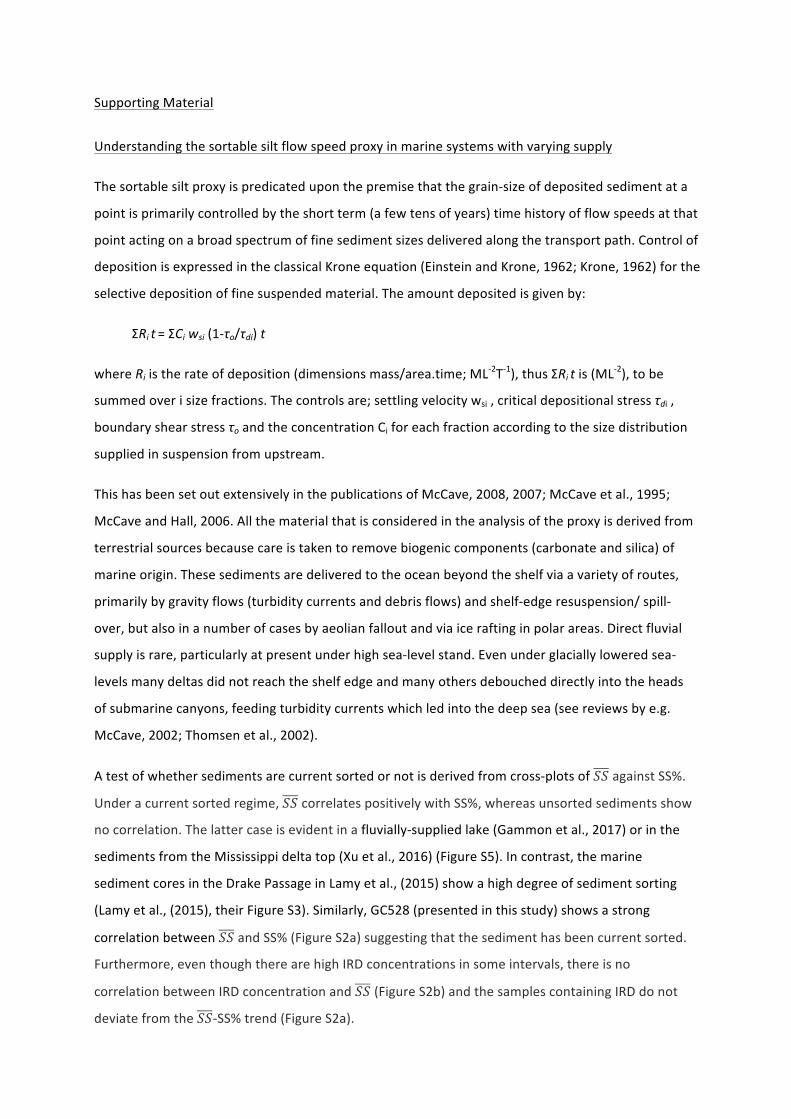
Supporting Material Understanding the sortable silt flow speed proxy in marine systems with varying supply The sortable silt proxy is predicated upon the premise that the grain-size of deposited sediment at a point is primarily controlled by the short term (a few tens of years) time history of flow speeds at that point acting on a broad spectrum of fine sediment sizes delivered along the transport path. Control of deposition is expressed in the classical Krone equation (Einstein and Krone, 1962; Krone, 1962) for the selective deposition of fine suspended material. The amount deposited is given by: ΣR i t =ΣC i w si (1-τ o /τ di ) t where R i is the rate of deposition (dimensions mass/area.time; ML -2 T -1 ), thus ΣR i t is (ML -2 ), to be summed over i size fractions. The controls are; settling velocity w si , critical depositional stress τ di , boundary shear stress τ o and the concentration C i for each fraction according to the size distribution supplied in suspension from upstream. This has been set out extensively in the publications of McCave, 2008, 2007; McCave et al., 1995; McCave and Hall, 2006. All the material that is considered in the analysis of the proxy is derived from terrestrial sources because care is taken to remove biogenic components (carbonate and silica) of marine origin. These sediments are delivered to the ocean beyond the shelf via a variety of routes, primarily by gravity flows (turbidity currents and debris flows) and shelf-edge resuspension/ spill- over, but also in a number of cases by aeolian fallout and via ice rafting in polar areas. Direct fluvial supply is rare, particularly at present under high sea-level stand. Even under glacially lowered sea- levels many deltas did not reach the shelf edge and many others debouched directly into the heads of submarine canyons, feeding turbidity currents which led into the deep sea (see reviews by e.g. McCave, 2002; Thomsen et al., 2002). A test of whether sediments are current sorted or not is derived from cross-plots of against SS%. Under a current sorted regime, correlates positively with SS%, whereas unsorted sediments show no correlation. The latter case is evident in a fluvially-supplied lake (Gammon et al., 2017) or in the sediments from the Mississippi delta top (Xu et al., 2016) (Figure S5). In contrast, the marine sediment cores in the Drake Passage in Lamy et al., (2015) show a high degree of sediment sorting (Lamy et al., (2015), their Figure S3). Similarly, GC528 (presented in this study) shows a strong correlation between and SS% (Figure S2a) suggesting that the sediment has been current sorted. Furthermore, even though there are high IRD concentrations in some intervals, there is no correlation between IRD concentration and (Figure S2b) and the samples containing IRD do not deviate from the -SS% trend (Figure S2a).
Transcript of Supporting Material - University of Cambridge
SupportingMaterial
Understandingthesortablesiltflowspeedproxyinmarinesystemswithvaryingsupply
Thesortablesiltproxyispredicateduponthepremisethatthegrain-sizeofdepositedsedimentata
pointisprimarilycontrolledbytheshortterm(afewtensofyears)timehistoryofflowspeedsatthat
pointactingonabroadspectrumoffinesedimentsizesdeliveredalongthetransportpath.Controlof
depositionisexpressedintheclassicalKroneequation(EinsteinandKrone,1962;Krone,1962)forthe
selectivedepositionoffinesuspendedmaterial.Theamountdepositedisgivenby:
ΣRit=ΣCiwsi(1-τo/τdi)t
whereRiistherateofdeposition(dimensionsmass/area.time;ML-2T-1),thusΣRitis(ML-2),tobe
summedoverisizefractions.Thecontrolsare;settlingvelocitywsi,criticaldepositionalstressτdi,
boundaryshearstressτoandtheconcentrationCiforeachfractionaccordingtothesizedistribution
suppliedinsuspensionfromupstream.
ThishasbeensetoutextensivelyinthepublicationsofMcCave,2008,2007;McCaveetal.,1995;
McCaveandHall,2006.Allthematerialthatisconsideredintheanalysisoftheproxyisderivedfrom
terrestrialsourcesbecausecareistakentoremovebiogeniccomponents(carbonateandsilica)of
marineorigin.Thesesedimentsaredeliveredtotheoceanbeyondtheshelfviaavarietyofroutes,
primarilybygravityflows(turbiditycurrentsanddebrisflows)andshelf-edgeresuspension/spill-
over,butalsoinanumberofcasesbyaeolianfalloutandviaiceraftinginpolarareas.Directfluvial
supplyisrare,particularlyatpresentunderhighsea-levelstand.Evenunderglaciallyloweredsea-
levelsmanydeltasdidnotreachtheshelfedgeandmanyothersdeboucheddirectlyintotheheads
ofsubmarinecanyons,feedingturbiditycurrentswhichledintothedeepsea(seereviewsbye.g.
McCave,2002;Thomsenetal.,2002).
Atestofwhethersedimentsarecurrentsortedornotisderivedfromcross-plotsof𝑆𝑆againstSS%.
Underacurrentsortedregime,𝑆𝑆correlatespositivelywithSS%,whereasunsortedsedimentsshow
nocorrelation.Thelattercaseisevidentinafluvially-suppliedlake(Gammonetal.,2017)orinthe
sedimentsfromtheMississippideltatop(Xuetal.,2016)(FigureS5).Incontrast,themarine
sedimentcoresintheDrakePassageinLamyetal.,(2015)showahighdegreeofsedimentsorting
(Lamyetal.,(2015),theirFigureS3).Similarly,GC528(presentedinthisstudy)showsastrong
correlationbetween𝑆𝑆 andSS%(FigureS2a)suggestingthatthesedimenthasbeencurrentsorted.
Furthermore,eventhoughtherearehighIRDconcentrationsinsomeintervals,thereisno
correlationbetweenIRDconcentrationand𝑆𝑆(FigureS2b)andthesamplescontainingIRDdonot
deviatefromthe𝑆𝑆-SS%trend(FigureS2a).

SupplementaryFigures
FigureS1:Assessingtheimpactofchangesinsealevelonthepatternsofsedimentation.(Left)Map
showingthepositionofthecoastlineatvariousintervalsduringthelastdeglaciation(seeinsetbox)
basedonbathymetry.(Right)(A)Globalrelativesealevelchangeoverthelastdeglaciation(Lambeck
etal.,2014);(B)MassaccumulationrateatsiteGC528;(C)SedimentationrateatsiteMR806-PC9
(Lamyetal.,2015).
0 5 0 0
0
1000
2000
3000
4000
5000
Bath
ym
etr
y /
m
Distance / km
GC528
MR806-PC9
SAF
PF
SACCF125m (LGM)110m (20-17 ka)60m (13-12 ka)0m (7-0 ka)
−150
−100
−50
0
50
RS
L (m
)
(A)
0.000.020.040.060.080.100.12
MA
R (g
/cm
2 /yr)
(B)
01020304050607080
Sed
. rat
e (c
m/k
yr) (C)
0 5 10 15 20 25Age (ka)
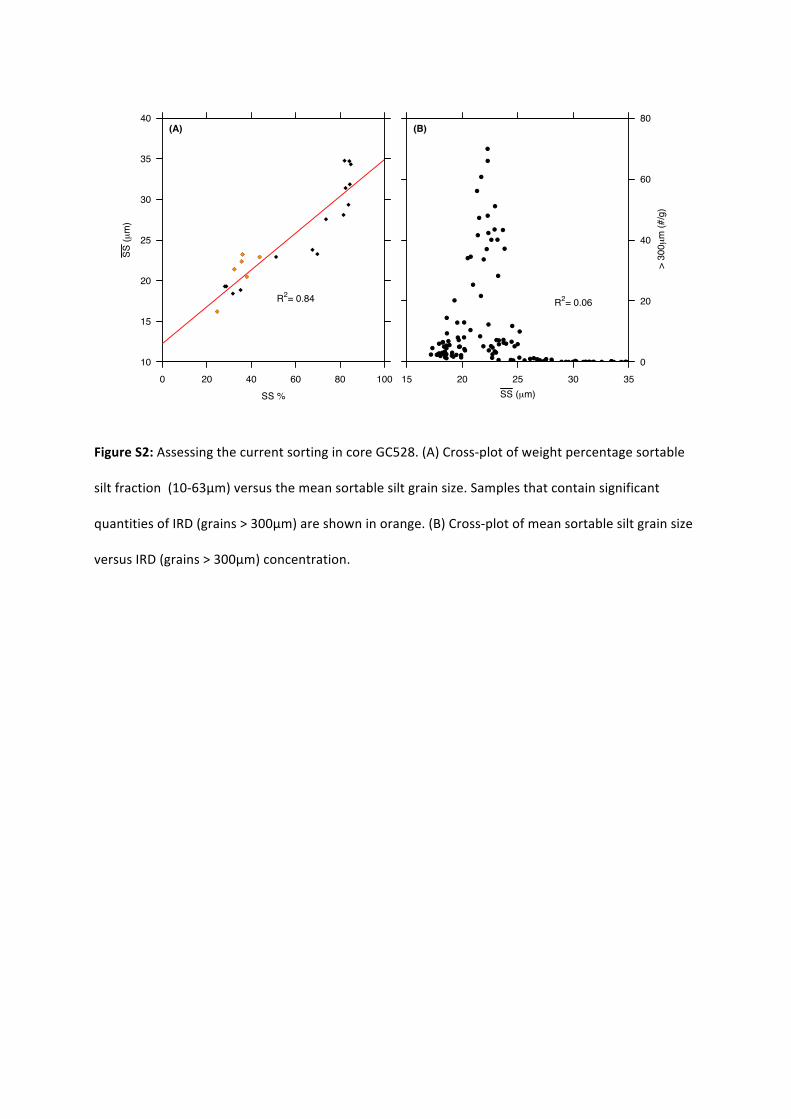
FigureS2:AssessingthecurrentsortingincoreGC528.(A)Cross-plotofweightpercentagesortable
siltfraction(10-63μm)versusthemeansortablesiltgrainsize.Samplesthatcontainsignificant
quantitiesofIRD(grains>300μm)areshowninorange.(B)Cross-plotofmeansortablesiltgrainsize
versusIRD(grains>300μm)concentration.
0 20 40 60 80 10010
15
20
25
30
35
40SS
(µm
)
SS %
R2= 0.84
(A)
●● ●●●● ●● ●● ●●●●● ●●● ●● ●●●●●●● ●● ●●● ●● ●●● ●●●
●
●
●
●●●
●
●●
●
●
●
●
●
●●●
●
●●
●
●
●
●
●
●
●●
●●
●
●
●
●●
●
●●
●●●
●● ●● ●●●● ●● ●●
●● ●●
●●
●
●
●
●
●
●
●●
●
●
● ●
●
●
●
●
●
●
●
●
●
●
●
●
●
●
●
15 20 25 30 350
20
40
60
80
(A) GC528
R2= 0.06
SS (µm)
> 3
00µ
m (#
/g)
(B)
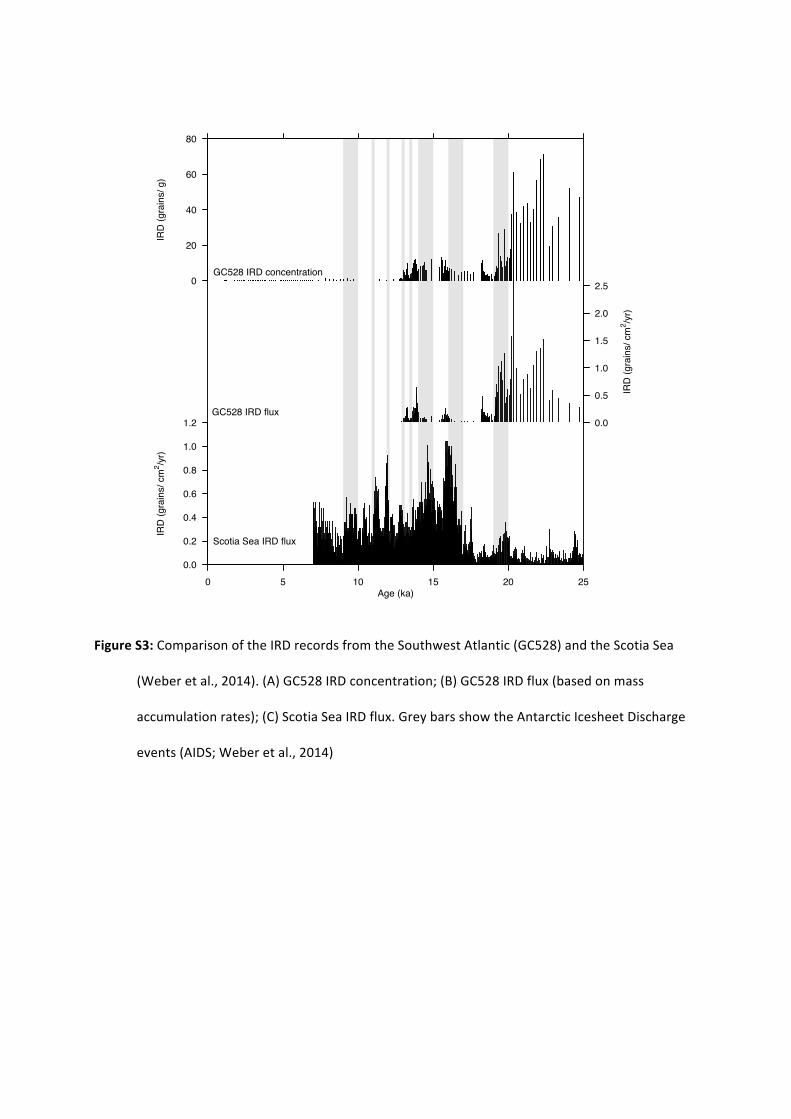
FigureS3:ComparisonoftheIRDrecordsfromtheSouthwestAtlantic(GC528)andtheScotiaSea
(Weberetal.,2014).(A)GC528IRDconcentration;(B)GC528IRDflux(basedonmass
accumulationrates);(C)ScotiaSeaIRDflux.GreybarsshowtheAntarcticIcesheetDischarge
events(AIDS;Weberetal.,2014)
0
20
40
60
80
IRD
(gra
ins/
g)
GC528 IRD concentration
0.0
0.5
1.0
1.5
2.0
2.5
IRD
(gra
ins/
cm
2 /yr)
GC528 IRD flux
0.0
0.2
0.4
0.6
0.8
1.0
1.2
IRD
(gra
ins/
cm
2 /yr)
Scotia Sea IRD flux
0 5 10 15 20 25Age (ka)
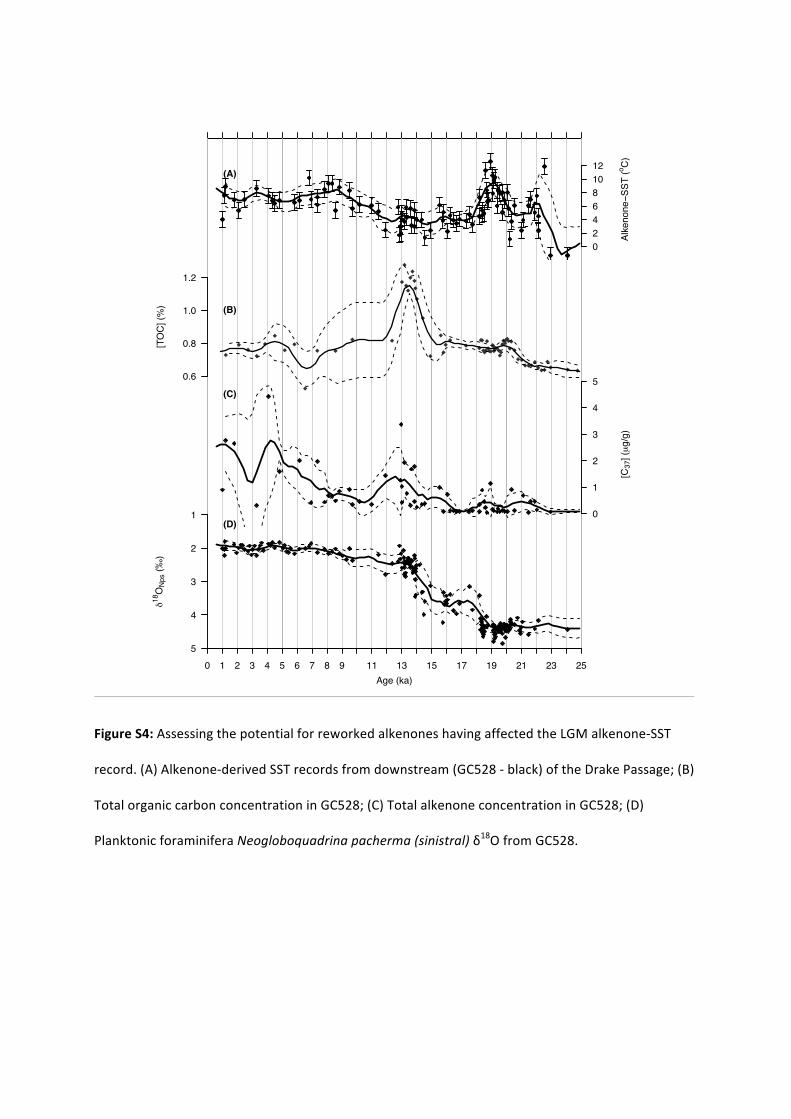
FigureS4:AssessingthepotentialforreworkedalkenoneshavingaffectedtheLGMalkenone-SST
record.(A)Alkenone-derivedSSTrecordsfromdownstream(GC528-black)oftheDrakePassage;(B)
TotalorganiccarbonconcentrationinGC528;(C)TotalalkenoneconcentrationinGC528;(D)
PlanktonicforaminiferaNeogloboquadrinapacherma(sinistral)δ18OfromGC528.
024681012
Alke
none−S
ST (o C
)
(A)
0.6
0.8
1.0
1.2
[TO
C] (
%) (B)
0
1
2
3
4
5
[C37
] (µ
g/g)
(C)
5
4
3
2
1
0 1 2 3 4 5 6 7 8 9 11 13 15 17 19 21 23 25
δ18O
Nps
(‰)
(D)
Age (ka)
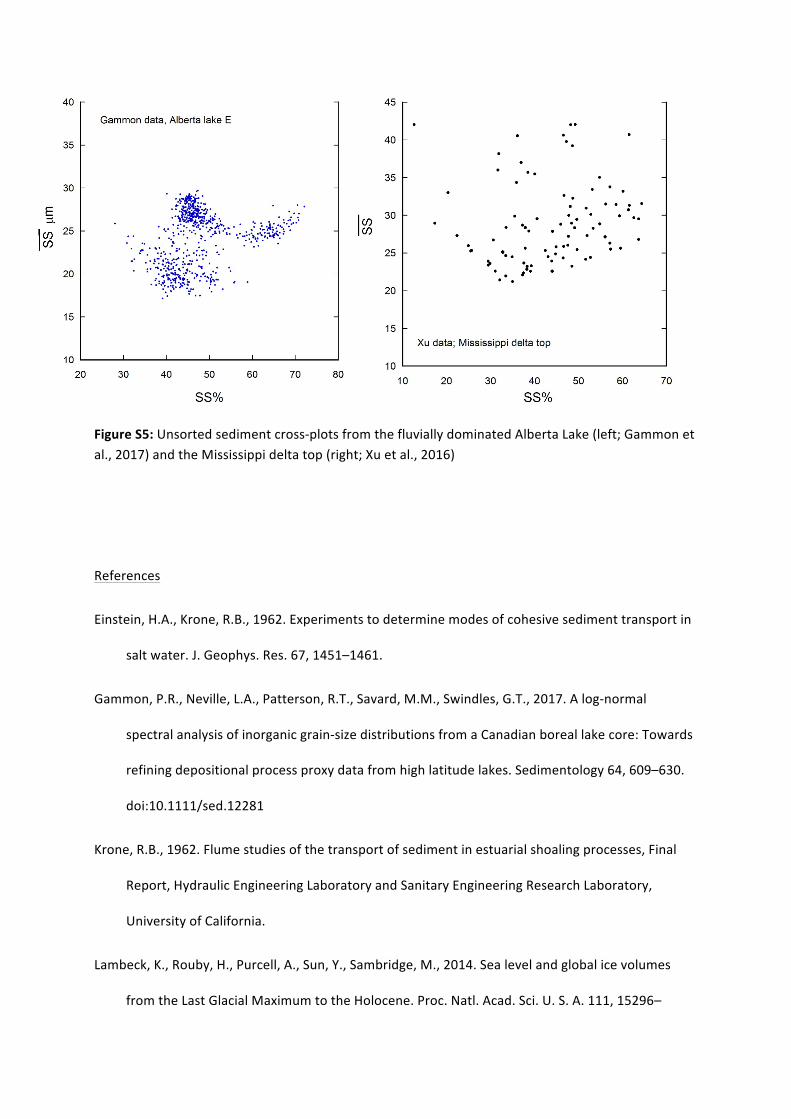
FigureS5:Unsortedsedimentcross-plotsfromthefluviallydominatedAlbertaLake(left;Gammonetal.,2017)andtheMississippideltatop(right;Xuetal.,2016)
References
Einstein,H.A.,Krone,R.B.,1962.Experimentstodeterminemodesofcohesivesedimenttransportin
saltwater.J.Geophys.Res.67,1451–1461.
Gammon,P.R.,Neville,L.A.,Patterson,R.T.,Savard,M.M.,Swindles,G.T.,2017.Alog-normal
spectralanalysisofinorganicgrain-sizedistributionsfromaCanadianboreallakecore:Towards
refiningdepositionalprocessproxydatafromhighlatitudelakes.Sedimentology64,609–630.
doi:10.1111/sed.12281
Krone,R.B.,1962.Flumestudiesofthetransportofsedimentinestuarialshoalingprocesses,Final
Report,HydraulicEngineeringLaboratoryandSanitaryEngineeringResearchLaboratory,
UniversityofCalifornia.
Lambeck,K.,Rouby,H.,Purcell,A.,Sun,Y.,Sambridge,M.,2014.Sealevelandglobalicevolumes
fromtheLastGlacialMaximumtotheHolocene.Proc.Natl.Acad.Sci.U.S.A.111,15296–

15303.doi:10.1073/pnas.1411762111
Lamy,F.,Arz,H.W.,Kilian,R.,Lange,C.B.,Lembke-Jene,L.,Wengler,M.,Kaiser,J.,Baeza-Urrea,O.,
Hall,I.R.,Harada,N.,Tiedemann,R.,2015.Glacialreductionandmillennial-scalevariationsin
DrakePassagethroughflow.Proc.Natl.Acad.Sci.U.S.A.112,13496–501.
doi:10.1073/pnas.1509203112
McCave,I.N.,2008.SizeSortingDuringTransportandDepositionofFineSediments.SortableSiltand
FlowSpeed,in:Rebesco,M.,Camerlenghi,A.(Eds.),DevelopmentsinSedimentology.Elsevier,
Amsterdam,pp.121–142.doi:10.1016/S0070-4571(08)10008-5
McCave,I.N.,2007.Deep-SeaSedimentDepositsandPropertiesControlledbyCurrents,in:Hillaire-
Marcel,C.,deVernal,A.(Eds.),ProxiesinLateCenozoicPaleoceanography.Elsevier,
Amsterdam,pp.19–62.doi:10.1016/S1572-5480(07)01006-8
McCave,I.N.,2002.SedimentarySettingsonContinentalMargins-anOverview,in:Wefer,G.,Billet,
D.,Hebbeln,D.,Jorgensen,B.B.,Schlüter,M.,vanWeering,T.C.E.(Eds.),OceanMarginSystems.
SpringerBerlinHeidelberg,Berlin,Heidelberg,pp.1–14.doi:10.1007/978-3-662-05127-6_1
McCave,I.N.,Hall,I.R.,2006.Sizesortinginmarinemuds:Processes,pitfalls,andprospectsfor
paleoflow-speedproxies.Geochemistry,Geophys.Geosystems7,n/a-n/a.
doi:10.1029/2006GC001284
McCave,I.N.,Manighetti,B.,Robinson,S.G.,1995.Sortablesiltandfinesedimentsize/composition
slicing:Parametersforpalaeocurrentspeedandpalaeoceanography.Paleoceanography10,
593–610.doi:10.1029/94PA03039
Thomsen,L.,Weering,T.van,Blondel,P.,Lampitt,R.,Lamy,F.,McCave,N.,McPhail,S.,Mienert,J.,
Neves,R.,D’Ozouville,L.,Ristow,D.,Waldmann,C.,Wollast,R.,2002.MarginBuilding-
RegulatingProcesses,in:Wefer,G.,Billet,D.,Hebbeln,D.,Jorgensen,B.B.,Schlüter,M.,van
Weering,T.C.E.(Eds.),OceanMarginSystems.Springer,Berlin,Heidelberg,pp.195–203.
doi:10.1007/978-3-662-05127-6_12
Weber,M.E.,Clark,P.U.,Kuhn,G.,Timmermann,A.,Sprenk,D.,Gladstone,R.,Zhang,X.,Lohmann,
G.,Menviel,L.,Chikamoto,M.O.,Friedrich,T.,Ohlwein,C.,2014.Millennial-scalevariabilityin
Antarcticice-sheetdischargeduringthelastdeglaciation.Nature510,134–8.
doi:10.1038/nature13397
Xu,K.,Bentley,S.,Robichaux,P.,Sha,X.,Yang,H.,2016.ImplicationsofTextureandErodibilityfor
SedimentRetentioninReceivingBasinsofCoastalLouisianaDiversions.Water8,26.
doi:10.3390/w8010026