Supporting Information - PNAS · Supporting Information ... were analyzed on a BD Accuri C6 Flow...
10
Supporting Information Tzeng et al. 10.1073/pnas.1416159112 SI Materials and Methods Mice. Female C57BL/6 mice (Taconic) were maintained under specific pathogen-free conditions and used at 6–10 wk of age. All experiments were approved by the Massachusetts Institute of Technology Division of Comparative Medicine and performed in accordance with federal, state, and local regulations. Cell Lines. B16F10 (ATCC), CTLL-2 (ATCC), and HEK293-F (Life Technologies) cells were cultured according to the sup- pliers’ instructions. MC38-CEA cells (a gift from Jeffrey Schlom, National Cancer Institute, Bethesda) were maintained in DMEM (Sigma-Aldrich) supplemented with 10% (vol/vol) FBS, 2 mM L-glutamine, 1% (vol/vol) penicillin-streptomycin, and 0.5 mg/mL G418 (Life Technologies). B16F10-GFP cells were established by retroviral transduction as follows. SFG-EGFP-F2A-CBRLuc was generated using the SFG retroviral backbone (a gift from Michel Sadelain, Memorial Sloan Kettering Cancer Center, New York), an EGFP (Clontech Laboratories), and a click beetle red luciferase (Promega) by overlap extension PCR. An F2A skip peptide sequence was added between the GFP and lu- ciferase sequences during plasmid construction to generate two separate proteins from the expression cassette. Phoenix Eco cells (ATCC) were transfected with SFG-EGFP-F2A-CBRLuc using calcium phosphate precipitation (Life Technologies) for 8 h, after which the transfection media was replaced with fresh media; 24 h later, viral vector-containing supernatant was harvested and added to RetroNectin-coated culture dishes (Takara Bio). B16F10 cells were then added to the dishes and spun at 2,000 × g for 90 min; 24 h later, the cells were passaged into fresh media. GFP + cells were sorted to >98% purity using a MoFlo FACS (Beckman Coulter). The resulting stable polyclonal population of GFP + cells was designated B16F10-GFP. Immunocytokine Production. DNA inserts encoding the heavy- chain variable regions of TA99 (1) or sm3E (2) antibodies were subcloned into a gWiz expression vector (Genlantis) containing the sequence for a murine IgG2a heavy-chain con- stant region. DNA inserts encoding the light-chain variable regions of TA99 or sm3E were subcloned into a separate gWiz vector containing the sequence for a murine κ–light-chain con- stant region. Using a modified Pfu polymerase-mediated site- directed mutagenesis protocol (3), the murine IL-2 sequence along with a flexible (Gly 4 Ser) 2 spacer were inserted at the C termini of the TA99 and sm3E light chains. Complete DNA sequence information for the immunocytokines is presented in Dataset S1. For Fc effector function knockouts, the D265A mutation was introduced to the heavy chain by site-directed mutagenesis. The resulting immunocytokines were expressed by transient transfection of HEK293-F cells using the Free- Style 293 Expression System (Life Technologies) as described previously (4). Cell culture supernatants were harvested 7 d posttransfection (centrifugation at 15,000 × g for 30 min at 4 °C), passed through a 0.22-μm filter, and purified by protein A chromatography according to the manufacturer’s instructions (Thermo Scientific). Purified immunocytokines were quan- tified by measuring absorbance at 280 nm using a NanoDrop 2000 spectrophotometer (Thermo Scientific). Molecular weights were confirmed by reducing and nonreducing SDS/PAGE using NuPAGE 4– 12% Bis-Tris Gels (Life Technologies) in 3-(N-morpholino)propansulfonic acid (MOPS) buffer fol- lowed by Coomassie staining. Purity was evaluated by FPLC size-exclusion chromatography (Superdex 200 Increase 10/300 GL; GE Healthcare). Dual-Binding Assay. In total, 5 × 10 5 trypsinized B16F10 or MC38-CEA cells were washed with PBS and 0.1% BSA (PBSA) and incubated with 50 nM immunocytokine or buffer for 30 min at room temperature. Subsequently, cells were incubated with 0.25 μg rat anti-mIL2 antibody (clone JES6- 1A12; R&D Systems) followed by incubation with 1 μg Alexa Fluor 647 goat anti-rat IgG (Life Technologies). All in- cubations were performed for 15 min on ice followed by washing one time with PBSA unless otherwise noted. Samples were analyzed on a BD Accuri C6 Flow Cytometer, and data were evaluated using FlowJo v.10.0.7 software (Tree Star). For serum stability assessment, immunocytokines were in- cubated in PBSA or 50% mouse serum (Life Technologies) in PBSA for various times at 37 °C before addition to cells as detailed above. CTLL-2 Proliferation Assay. CTLL-2 cells were seeded into flat- bottom 96-well plates at a density of 4,000 cells per well in 100 μL medium. Cells were incubated with varying concentrations of immunocytokine or WT IL-2 (BioLegend) for 48 h, after which cell proliferation was determined using a WST-1– based col- orimetric assay according to the manufacturer’ s instructions (Roche); 0.25 μg mIL2-neutralizing antibody (clone JES6- 1A12; R&D Systems) was added to a corresponding set of wells to verify that cell proliferation was IL-2–specific. To determine EC 50 values, data were normalized to those of control cells treated with 50 ng/mL IL-2 and fit to a four-parameter logistic curve using GraphPad Prism 6 software. Alexa Fluor 647 Labeling. Protein conjugates containing Alexa Fluor 647 were prepared by incubating proteins (at concen- trations of 1–2 mg/mL in PBS with 1/10 volume 1 M potassium phosphate, pH 9) with seven- to ninefold molar excess of Alexa Fluor 647 NHS ester (at 10 mg/mL in DMSO) for 15 min at room temperature in the dark. Free dye was re- moved using two successive 7K MWCO Zeba Spin Columns (Thermo Scientific). Protein concentrations and degrees of labeling were measured using a NanoDrop 2000 Spectro- photometer (Thermo Scientific). Dye-to-protein ratios ranged from 2.5 to 4.0. Blood Binding Assay. The percentage binding of antibody and immunocytokines to circulating blood cells was determined using the methods described in ref. 5. Briefly, fresh murine blood was collected into lithium heparin-treated collection tubes (Greiner Bio-One). High (140 nM) or low (5.5 nM) concentrations of Alexa Fluor 647-labeled proteins were in- cubated in equal blood volumes for 20 min at room temper- ature in the dark. The blood cell and plasma components were separated by centrifugation at 900 × g for 5 min. Plasma was transferred to heparin-coated capillary tubes (VWR In- ternational), and fluorescence was detected using a Typhoon Imager (GE Healthcare). Corrected total fluorescence was quantified using ImageJ software (NIH) as detailed in ref. 6 and normalized to the fluorescence of the total Alexa Fluor 647-labeled protein doses. The percentage of dose bound to cells was defined as the percentage of dose not found in plasma. Tzeng et al. www.pnas.org/cgi/content/short/1416159112 1 of 10
-
Upload
phunghuong -
Category
Documents
-
view
218 -
download
0
Transcript of Supporting Information - PNAS · Supporting Information ... were analyzed on a BD Accuri C6 Flow...

Supporting InformationTzeng et al. 10.1073/pnas.1416159112SI Materials and MethodsMice. Female C57BL/6 mice (Taconic) were maintained underspecific pathogen-free conditions and used at 6–10 wk of age.All experiments were approved by the Massachusetts Institute ofTechnology Division of Comparative Medicine and performed inaccordance with federal, state, and local regulations.
Cell Lines. B16F10 (ATCC), CTLL-2 (ATCC), and HEK293-F(Life Technologies) cells were cultured according to the sup-pliers’ instructions. MC38-CEA cells (a gift from Jeffrey Schlom,National Cancer Institute, Bethesda) were maintained in DMEM(Sigma-Aldrich) supplemented with 10% (vol/vol) FBS, 2 mML-glutamine, 1% (vol/vol) penicillin-streptomycin, and 0.5 mg/mLG418 (Life Technologies). B16F10-GFP cells were established byretroviral transduction as follows. SFG-EGFP-F2A-CBRLuc wasgenerated using the SFG retroviral backbone (a gift fromMichel Sadelain, Memorial Sloan Kettering Cancer Center,New York), an EGFP (Clontech Laboratories), and a clickbeetle red luciferase (Promega) by overlap extension PCR. AnF2A skip peptide sequence was added between the GFP and lu-ciferase sequences during plasmid construction to generate twoseparate proteins from the expression cassette. Phoenix Eco cells(ATCC) were transfected with SFG-EGFP-F2A-CBRLuc usingcalcium phosphate precipitation (Life Technologies) for 8 h, afterwhich the transfection media was replaced with fresh media; 24 hlater, viral vector-containing supernatant was harvested and addedto RetroNectin-coated culture dishes (Takara Bio). B16F10 cellswere then added to the dishes and spun at 2,000 × g for 90 min;24 h later, the cells were passaged into fresh media. GFP+ cellswere sorted to >98% purity using a MoFlo FACS (BeckmanCoulter). The resulting stable polyclonal population of GFP+
cells was designated B16F10-GFP.
Immunocytokine Production. DNA inserts encoding the heavy-chain variable regions of TA99 (1) or sm3E (2) antibodieswere subcloned into a gWiz expression vector (Genlantis)containing the sequence for a murine IgG2a heavy-chain con-stant region. DNA inserts encoding the light-chain variableregions of TA99 or sm3E were subcloned into a separate gWizvector containing the sequence for a murine κ–light-chain con-stant region. Using a modified Pfu polymerase-mediated site-directed mutagenesis protocol (3), the murine IL-2 sequencealong with a flexible (Gly4Ser)2 spacer were inserted at the Ctermini of the TA99 and sm3E light chains. Complete DNAsequence information for the immunocytokines is presentedin Dataset S1. For Fc effector function knockouts, the D265Amutation was introduced to the heavy chain by site-directedmutagenesis. The resulting immunocytokines were expressedby transient transfection of HEK293-F cells using the Free-Style 293 Expression System (Life Technologies) as describedpreviously (4). Cell culture supernatants were harvested 7 dposttransfection (centrifugation at 15,000 × g for 30 min at4 °C), passed through a 0.22-μm filter, and purified by protein Achromatography according to the manufacturer’s instructions(Thermo Scientific). Purified immunocytokines were quan-tified by measuring absorbance at 280 nm using a NanoDrop2000 spectrophotometer (Thermo Scientific). Molecular weightswere confirmed by reducing and nonreducing SDS/PAGEusing NuPAGE 4–12% Bis-Tris Gels (Life Technologies) in3-(N-morpholino)propansulfonic acid (MOPS) buffer fol-lowed by Coomassie staining. Purity was evaluated by FPLC
size-exclusion chromatography (Superdex 200 Increase 10/300GL; GE Healthcare).
Dual-Binding Assay. In total, 5 × 10⁵ trypsinized B16F10 orMC38-CEA cells were washed with PBS and 0.1% BSA(PBSA) and incubated with 50 nM immunocytokine or bufferfor 30 min at room temperature. Subsequently, cells wereincubated with 0.25 μg rat anti-mIL2 antibody (clone JES6-1A12; R&D Systems) followed by incubation with 1 μg AlexaFluor 647 goat anti-rat IgG (Life Technologies). All in-cubations were performed for 15 min on ice followed bywashing one time with PBSA unless otherwise noted. Sampleswere analyzed on a BD Accuri C6 Flow Cytometer, and datawere evaluated using FlowJo v.10.0.7 software (Tree Star).For serum stability assessment, immunocytokines were in-cubated in PBSA or 50% mouse serum (Life Technologies) inPBSA for various times at 37 °C before addition to cells asdetailed above.
CTLL-2 Proliferation Assay. CTLL-2 cells were seeded into flat-bottom 96-well plates at a density of 4,000 cells per well in 100 μLmedium. Cells were incubated with varying concentrationsof immunocytokine or WT IL-2 (BioLegend) for 48 h, after whichcell proliferation was determined using a WST-1–based col-orimetric assay according to the manufacturer’s instructions(Roche); 0.25 μg mIL2-neutralizing antibody (clone JES6-1A12; R&D Systems) was added to a corresponding set of wells toverify that cell proliferation was IL-2–specific. To determine EC50values, data were normalized to those of control cells treated with50 ng/mL IL-2 and fit to a four-parameter logistic curve usingGraphPad Prism 6 software.
Alexa Fluor 647 Labeling. Protein conjugates containing AlexaFluor 647 were prepared by incubating proteins (at concen-trations of 1–2 mg/mL in PBS with 1/10 volume 1 M potassiumphosphate, pH 9) with seven- to ninefold molar excess ofAlexa Fluor 647 NHS ester (at 10 mg/mL in DMSO) for15 min at room temperature in the dark. Free dye was re-moved using two successive 7K MWCO Zeba Spin Columns(Thermo Scientific). Protein concentrations and degrees oflabeling were measured using a NanoDrop 2000 Spectro-photometer (Thermo Scientific). Dye-to-protein ratios rangedfrom 2.5 to 4.0.
Blood Binding Assay. The percentage binding of antibody andimmunocytokines to circulating blood cells was determinedusing the methods described in ref. 5. Briefly, fresh murineblood was collected into lithium heparin-treated collectiontubes (Greiner Bio-One). High (140 nM) or low (5.5 nM)concentrations of Alexa Fluor 647-labeled proteins were in-cubated in equal blood volumes for 20 min at room temper-ature in the dark. The blood cell and plasma components wereseparated by centrifugation at 900 × g for 5 min. Plasma wastransferred to heparin-coated capillary tubes (VWR In-ternational), and fluorescence was detected using a TyphoonImager (GE Healthcare). Corrected total fluorescence wasquantified using ImageJ software (NIH) as detailed in ref. 6and normalized to the fluorescence of the total Alexa Fluor647-labeled protein doses. The percentage of dose boundto cells was defined as the percentage of dose not foundin plasma.
Tzeng et al. www.pnas.org/cgi/content/short/1416159112 1 of 10

Pharmacokinetic Studies. Fifty micrograms Alexa Fluor 647-labeledimmunocytokines were injected retroorbitally into mice. At varioustime points, blood was collected through the tail vein into heparin-coated capillary tubes (VWR International) and stored at 4 °C in thedark until sample collection was complete. Plasma was obtainedafter centrifugation (900 × g for 5 min) and transferred to newcapillary tubes. Fluorescence was detected using a Typhoon Im-ager (GE Healthcare) and quantified using ImageJ software (NIH).To calculate immunocytokine half-lives, data were normalized tothe initial time point and fit to a biphasic exponential decay curveusing GraphPad Prism 6 software.
Tumor Treatment. For tumor induction, 106 B16F10 melanoma cellsin 100 μL PBS were injected s.c. into the right flanks of mice. Micewere injected retroorbitally with 6 μg murine IL-2 (BioLegend),32 μg immunocytokine (molar IL-2 dose equivalent to 6 μg freeIL-2), and/or 100 μg TA99 on days 6, 12, 18, 24, and 30 after tumorinoculation for a total of five treatments. Tumor length and widthwere measured using calipers, and mice were weighed on a digitalscale every 2–3 d for up to 70 d posttumor inoculation. Mice wereeuthanized when tumors reached 200 mm2.
Tumor Saturation Assay. For tumor induction, 106 B16F10-GFPmelanoma cells in 100 μL PBS were injected s.c. into the rightflanks of mice. Mice were injected retroorbitally with 32 μg AlexaFluor 647-labeled immunocytokine and/or 100 μg Alexa Fluor 647-labeled TA99 (or a low dose of 25.4 μg TA99 alone equimolar to32 μg immunocytokine) on day 8 after tumor inoculation; 24 h later,tumors were harvested, mechanically dissociated between frostedglass slides, and rendered into single-cell suspensions by filtrationthrough 70-μmmesh screens. Cells were stained with Zombie AquaFixable Dye (BioLegend) for dead cell exclusion. Subsequently,cells were incubated with TruStain fcX (93; BioLegend) and stainedwith fluorochrome-conjugated antibodies against CD11b (M1/70;BioLegend) and CD11c (N418; BioLegend), which were used toexclude phagocytes. Doublets were excluded based on forwardscatter pulse width and height (FSC-W/FSC-H) and side scatterpulse width and height (SSC-W/SSC-H). Samples were analyzedusing a BD LSR II Flow Cytometer, and data were evaluated usingFlowJo v.10.0.7 software (Tree Star).
Multiplex Cytokine Assay. B16F10 tumors were induced as detailedabove. Mice were injected retroorbitally with 6 μg murine IL-2(BioLegend), 32 μg TA99-IL2 (molar IL-2 dose equivalent to 6 μgfree IL-2), and/or 100 μg TA99. Tumors were harvested 24 h later,immediately flash-frozen in liquid nitrogen, and stored at −80 °Cuntil processing. Frozen samples were placed into chilled 2-mL ho-mogenization tubes containing 3.0 mm zirconium beads (BenchmarkScientific). Cold PBS with cOmplete Protease Inhibitor Mixture(Roche) was added in a ratio of 4 μL per 1 mg tissue, and thesamples were homogenized using a Mini-Beadbeater-16 (BioSpecProducts). After centrifugation (14,000 × g for 15 min at 4 °C), su-pernatant aliquots were taken for protein quantification using a BCAAssay Kit (Thermo Scientific). PBS with protease inhibitor wasadded to normalize the protein concentrations of all supernatantsamples, and samples were flash-frozen in liquid nitrogen and storedat −80 °C until analysis. Samples were evaluated in triplicate usingthe 32-Plex Mouse Cytokine/Chemokine Panel Luminex Assay (EveTechnologies). Expression of the chemokine LIX was not detected inany group.
Cellular Biodistribution Assay and IL-2R Expression by DCs. B16F10tumors were induced as detailed above. Mice were injected ret-roorbitally with 50 μg Alexa Fluor 647-labeled immunocytokine or
40 μg Alexa Fluor 647-labeled TA99 (equimolar to 50 μg im-munocytokine) on day 8 after tumor inoculation; 24 h later, bloodwas collected by cardiac puncture into EDTA-treated tubes (BD),and tumors, draining lymph nodes, and spleens were harvested,weighed, mechanically dissociated between frosted glass slides, andrendered into single-cell suspensions by filtration through 70-μmmesh screens. Splenocytes and whole blood were treated withammonium-chloride-potassium (ACK) lysing buffer. Cells wereincubated with Zombie Aqua Dye followed by TruStain fcX (93)and the following fluorochrome-conjugated antibodies fromBioLegend: anti-CD3e (145-2C11), anti-CD4 (GK1.4), anti-CD8α(53-6.7), anti-CD11b (M1/70), anti-CD11c (N418), anti-CD19(6D5), anti-CD25 (PC61), anti-CD122 (TM-β1), anti-CD132(TUGm2), anti-Ly6C (HK1.4), anti-Ly6G (1A8), and anti-NK1.1(PK136). For intracellular Foxp3 staining, cells were fixed andpermeabilized with the eBioscience Foxp3 staining buffer setaccording to the manufacturer’s instructions and stained withanti-Foxp3 (MF-14; BioLegend) or isotype control (BioLegend)antibodies. Doublets were excluded based on FSC-W/FSC-H andSSC-W/SSC-H. Samples were analyzed using a BD LSR IIFlow Cytometer, and data were evaluated using FlowJov.10.0.7 software (Tree Star). The following gating strategieswere used for immunophenotyping. T cells: CD3e followedby CD8α+, CD4+CD25−FOXP3−, and CD4+CD25+FOXP3+
(Tregs); monocytes/macrophages: CD3e−CD11b+CD11c−/lo
NK1.1−Ly6G−SSClo based on ref. 7; DCs: CD3e−CD11chi;NK cells: NK1.1+CD3e−; and NKT cells: NK1.1+CD3e+. Im-munocytokine or antibody binding to B cells (CD3e−CD19+) orneutrophils (CD3e−CD11c−CD11b+Ly6G+) was not detected.
Statistical Analysis.Results were analyzed using GraphPad Prism 6software. Univariate analysis of survival differences was per-formed using the Mantel–Cox method. Comparisons betweenflow cytometry data from different treatment groups were madeusing one-way ANOVA with posthoc Tukey test. Cytokinemultiplex assay data were evaluated using two-way ANOVAwith posthoc Tukey test.
Mathematical Model. This ODE model describes the bio-distribution of active immunocytokine (IC) between the bloodand tumor compartments. All simulations were performed inMATLAB (MathWorks). A detailed schematic of this modelis shown in Fig. S6, and the model equations are below:
d½IC�t−fdt
=2PRcap�Rkrogh
�2"½IC�p −
½IC�t−f
«
!#
− kon½IC�t−f�½Ag�t
«
�+ koff ½IC�t−b;
[S1]
d½IC�t−bdt
= kon½IC�t−f�½Ag�t
«
�−�koff + kendo
�½IC�t−b; [S2]
and
d½IC�t−idt
= kendo½IC�t−b − kexp½IC�t−i; [S3]
with the variables described below (N/A indicates not applicable).
Tzeng et al. www.pnas.org/cgi/content/short/1416159112 2 of 10

The plasma immunocytokine concentration is determined bya standard biexponential decay equation of the following format:
½IC�pðtÞ=Ae−αt +Be−βt; [S4]
where A, B, α, and β represent the systemic clearance rates ofa given molecule.The parameters described in these equations are derived from
the literature (8–11) unless otherwise indicated. The followingparameters require additional explanation:
i) The permeability (P) of any molecule across the tumor capillarywall is dependent on molecular weight (12) but does not exhibitmuch variability in the relevant size range of immunocytokines(8). Therefore, it is kept constant throughout all simulations.
ii) The rate of export of degraded immunocytokine from tumorcells (kexp) is derived from experimental data on 125I-labeledantibody trafficking. The experimental data values were ob-tained using DataThief III. The radioactivity of degradedantibody was plotted against the time integral of intracellularradioactivity, and the slope of that linear relationship is kexp.
iii) A, B, α, and β are derived from the literature. The pharma-cokinetic parameters of the large-immunocytokine formatare based on a study with a single-chain variable fragment(scFv)–Fc–IL2 fusion (13). The parameters of the small-immunocytokine format are based on a study with F16–IL-2(14). Note that the small-format immunocytokine exhibitsmonophasic clearance behavior, unlike the large-format im-munocytokine.
Validation of this model was performed using biodistributionparameters from three different sources (13, 15, 16). The ratio oftumor immunocytokine (free, bound, and internalized) to plasmaimmunocytokine was determined from experimental results ineach of these cases and plotted against the simulation results (Fig.S7). Note that no fitting of parameters to these cases was per-formed, but the model is able to capture the behavior of the datain a fairly robust manner.Simulations of large- and small-format immunocytokines (Fig. 6
and Fig. S8) distinguish the concentration of active immuno-cytokine in the tumor to be only immunocytokine that is free orbound on the surface, excluding internalized immunocytokine.Internalized immunocytokine is excluded because immunocy-tokine is unable to bind to its cognate cytokine receptor if it isalready internalized through its antigen receptor. Additionally,the activity of these immunocytokines (Fig. S8) is determined bythe following equation:
%Activity=1
1+½EC50�½IC�
× 100; [S5]
where EC50 refers to the concentration at which 50% maximalactivity is achieved, and [IC] refers to the concentration of im-munocytokine in the compartment of interest.
1. Takechi Y, Hara I, Naftzger C, Xu Y, Houghton AN (1996) A melanosomal mem-brane protein is a cell surface target for melanoma therapy. Clin Cancer Res 2(11):1837–1842.
2. Graff CP, Chester K, Begent R, Wittrup KD (2004) Directed evolution of an anti-car-cinoembryonic antigen scFv with a 4-day monovalent dissociation half-time at 37 ° C.Protein Eng Des Sel 17(4):293–304.
3. Geiser M, Cèbe R, Drewello D, Schmitz R (2001) Integration of PCR fragments at anyspecific site within cloning vectors without the use of restriction enzymes and DNAligase. Biotechniques 31(1):88–92.
4. Orcutt KD, et al. (2010) A modular IgG-scFv bispecific antibody topology. Protein EngDes Sel 23(4):221–228.
5. Hemmerle T, Neri D (2014) The dose-dependent tumor targeting of antibody-IFNγfusion proteins reveals an unexpected receptor-trapping mechanism in vivo.Cancer Immunol Res 2(6):559–567.
6. Burgess A, et al. (2010) Loss of human Greatwall results in G2 arrest and multiplemitotic defects due to deregulation of the cyclin B-Cdc2/PP2A balance. Proc Natl AcadSci USA 107(28):12564–12569.
7. Rose S, Misharin A, Perlman H (2012) A novel Ly6C/Ly6G-based strategy to analyze themouse splenic myeloid compartment. Cytometry A 81(4):343–350.
8. Schmidt MM, Wittrup KD (2009) A modeling analysis of the effects of molecular sizeand binding affinity on tumor targeting. Mol Cancer Ther 8(10):2861–2871.
9. Thurber GM, Dane Wittrup K (2012) A mechanistic compartmental model for totalantibody uptake in tumors. J Theor Biol 314:57–68.
10. Thurber GM, Schmidt MM, Wittrup KD (2008) Factors determining antibody distri-bution in tumors. Trends Pharmacol Sci 29(2):57–61.
11. Ali SA, et al. (1990) Improving the tumor retention of radioiodinated antibody: Arylcarbohydrate adducts. Cancer Res 50(3 Suppl):783s–788s.
12. Dreher MR, et al. (2006) Tumor vascular permeability, accumulation, and penetrationof macromolecular drug carriers. J Natl Cancer Inst 98(5):335–344.
13. Xu X, et al. (2000) Targeting and therapy of carcinoembryonic antigen-expressing tumors intransgenic micewith an antibody-interleukin 2 fusion protein. Cancer Res 60(16):4475–4484.
14. Mårlind J, et al. (2008) Antibody-mediated delivery of interleukin-2 to the stroma of breastcancer strongly enhances the potency of chemotherapy. Clin Cancer Res 14(20):6515–6524.
15. Borsi L, et al. (2002) Selective targeting of tumoral vasculature: Comparison of differentformats of an antibody (L19) to the ED-B domain of fibronectin. Int J Cancer 102(1):75–85.
16. Tijink BM, et al. (2009) (124)I-L19-SIP for immuno-PET imaging of tumour vasculatureand guidance of (131)I-L19-SIP radioimmunotherapy. Eur J Nucl Med Mol Imaging36(8):1235–1244.
Variable Description Value Source
½IC�t−f Concentration of immunocytokine in the tumor that is free(i.e., not bound to antigen or internalized)
N/A (part of simulation) N/A (part of simulation)
P Permeability of immunocytokine across the tumor capillary wall 3 × 10⁹ m/s Ref. 6Rcap Radius of a capillary 8 μm Ref. 7Rkrogh Radius of the Krogh cylinder 75 μm Ref. 7½IC�p Concentration of immunocytokine in the plasma N/A (part of simulation) N/A (part of simulation)« Void fraction 0.2 Ref. 6kon Association rate between immunocytokine and target antigen 1 × 10⁵ M−1 s−1 Based on protein–protein
interaction with Kd = 1 nM½Ag�t Concentration of antigen in the tumor 500 nM Ref. 8koff Dissociation rate between immunocytokine and target antigen 1 × 10⁻⁴ s−1 Based on protein–protein
interaction with Kd = 1 nM½IC�t−b Concentration of immunocytokine in the tumor that is bound to
antigen on the surfaceN/A (part of simulation) N/A (part of simulation)
kendo Endocytosis rate of immunocytokine–antigen complexes Varies in simulations N/A (part of simulation)½IC�t−i Concentration of internalized immunocytokine in the tumor N/A (part of simulation) N/A (part of simulation)kexp Export rate of degraded immunocytokine from cells 0.0782 h−1 Ref. 9
Tzeng et al. www.pnas.org/cgi/content/short/1416159112 3 of 10

0 1 2 3 4 5 6 70.00.20.40.60.81.01.2
TA99-IL2
Dua
l bin
ding
frac
tion
PBSAserum
0 1 2 3 4 5 6 7
sm3E-IL2
PBSAserum
PBS
TA99-IL
2
sm3E
-IL2
TA990
40
80
120
Spl
een
wei
ght
(mg)
* *
A BkDa M T SNR R NR R
250
150
100
80
60
50
40
30ml
Abs
orba
nce
(280
nm
)
0 10 20 300
20
40
60
80
100TA99-IL2
sm3E-IL2
C
% o
f max
B16F10 MC38-CEA
IL-2
TA99-IL2sm3E-IL2no IC
D
Time (days)
E
Fig. S1. In vitro and in vivo characterization of IL-2 immunocytokines. (A) Size-exclusion FPLC of immunocytokines. (B) SDS/PAGE analysis of nonreduced (NR)and reduced (R) immunocytokines. M, molecular mass marker; T, TA99-IL2; S, sm3E-IL2. (C) Simultaneous binding of immunocytokines to cell surface antigensand anti–IL-2 antibody. B16F10 (murine melanoma) or MC38-CEA (murine colon carcinoma transfected with CEA) cells were incubated with immunocytokinefollowed by anti–IL-2 and fluorescent secondary antibodies and analyzed using flow cytometry. IC, immunocytokine. (D) Thermal and serum stability of im-munocytokines at 37 °C for 7 d as detected by the flow cytometry assay in C. Immunocytokines were incubated in either PBSA or 50% mouse serum in PBSA,and binding function was normalized to that of corresponding constructs stored at 4 °C (n = 3). (E) Spleen wet weights 24 h after injection of PBS or equimolarimmunocytokine or antibody (n = 5–6). *P < 0.05 vs. PBS controls by one-way ANOVA with Dunnett’s posttest.
Tzeng et al. www.pnas.org/cgi/content/short/1416159112 4 of 10
0 10 20 30 40 50 60 700
50
100
150
200TA99-IL2 D265A + TA99
Days post tumor injection
Tum
or a
rea
(mm
2 )
4/10
0 10 20 30 40 50 60 700
50
100
150
200TA99-IL2 + TA99
Days post tumor injection
Tum
or a
rea
(mm
2 )
3/10
0 10 20 30 40 50 60 700
50
100
150
200TA99-IL2 D265A
Days post tumor injection
Tum
or a
rea
(mm
2 )
0 10 20 30 40 50 60 700
50
100
150
200TA99-IL2
Days post tumor injection
Tum
or a
rea
(mm
2 )
0 10 20 30 40 50 60 700
50
100
150
200PBS
Days post tumor injection
Tum
or a
rea
(mm
2 )
0 10 20 30 40 50 60 700
50
100
150
200sm3E-IL2 + TA99
Days post tumor injection
Tum
or a
rea
(mm
2 )
2/11
0 10 20 30 40 50 60 700
50
100
150
200sm3E-IL2
Days post tumor injection
Tum
or a
rea
(mm
2 )
0 10 20 30 40 50 60 700
50
100
150
200sm3E-IL2 D265A
Days post tumor injection
Tum
or a
rea
(mm
2 )
0 10 20 30 40 50 60 700
50
100
150
200IL2 + TA99
Days post tumor injection
Tum
or a
rea
(mm
2 )
0 10 20 30 40 50 60 700
50
100
150
200sm3E-IL2 D265A + TA99
Days post tumor injection
Tum
or a
rea
(mm
2 )
5/12
B
AIL2 + TA99
0 10 20 30 4080
95
110
125
140
Days post tumor injection
% w
eigh
t cha
nge PBS
TA99-IL2 + TA99TA99-IL2
sm3E-IL2 + TA99sm3E-IL2
0 10 20 30 4080
95
110
125
140
Days post tumor injection
% w
eigh
t cha
nge PBS
TA99-IL2 D265A + TA99TA99-IL2 D265A
sm3E-IL2 D265A + TA99sm3E-IL2 D265A
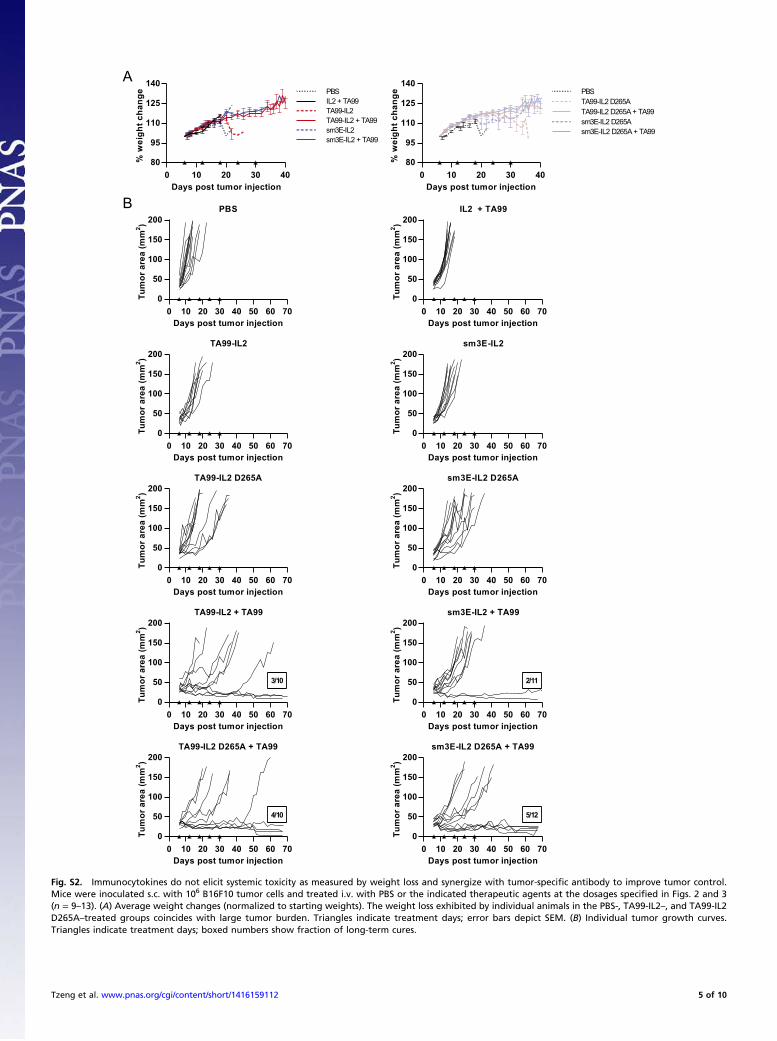
Fig. S2. Immunocytokines do not elicit systemic toxicity as measured by weight loss and synergize with tumor-specific antibody to improve tumor control.Mice were inoculated s.c. with 106 B16F10 tumor cells and treated i.v. with PBS or the indicated therapeutic agents at the dosages specified in Figs. 2 and 3(n = 9–13). (A) Average weight changes (normalized to starting weights). The weight loss exhibited by individual animals in the PBS-, TA99-IL2–, and TA99-IL2D265A–treated groups coincides with large tumor burden. Triangles indicate treatment days; error bars depict SEM. (B) Individual tumor growth curves.Triangles indicate treatment days; boxed numbers show fraction of long-term cures.
Tzeng et al. www.pnas.org/cgi/content/short/1416159112 5 of 10

Days post tumor injectionTu
mor
are
a (m
m2 )
0 5 10 15 200
50
100
150
200B16F10
B16F10-GFP
Fig. S3. B16F10 and B16F10-GFP tumors exhibit similar growth rates. Mice were inoculated s.c. with 106 B16F10 or B16F10-GFP tumor cells, and tumor growthwas monitored over time. Data represent mean ± SEM (n = 5).
Tzeng et al. www.pnas.org/cgi/content/short/1416159112 6 of 10

TA99
TA99-IL
2
sm3E
-IL2
TA99-IL
2 D26
5A
sm3E
-IL2 D
265A
0
20
40
60
80
% d
ose
boun
d to
cel
ls
Cel
ls/g
TregsA
0
20
40
60
80
100 CD8+ T cells
% A
lexa
Flu
or 6
47+
PBSTA99-IL2TA99-IL2 D265Asm3E-IL2sm3E-IL2 D265ATA99
CD4+ T cells
blood
splee
ntumor
draining LN
NK cells
blood
splee
ntumor
draining LN
DCs
blood
splee
ntumor
draining LN
0
20
40
60
80
100monocytes/macrophages
blood
splee
ntumor
draining LN
NKT cells
*******
*
***
*
**
****
B
0
2x10⁶
4x10⁶
6x10⁶
8x10⁶
Cel
ls/g
0
2x10⁶
4x10⁶
6x10⁶
Cel
ls/g
0
5.0x10⁴
1.0x10⁵
1.5x10⁵
2.0x10⁵
Cel
ls/g
*Tregs
PBS
TA99-IL
2
TA99-IL
2 D26
5A
sm3E
-IL2
sm3E
-IL2 D
265A
TA990
2x10⁵
4x10⁵
6x10⁵
8x10⁵
Cel
ls/g
PBS
TA99-IL
2
TA99-IL
2 D26
5A
sm3E
-IL2
sm3E
-IL2 D
265A
TA990
2x10⁶
4x10⁶
6x10⁶
Cel
ls/g
PBS
TA99-IL
2
TA99-IL
2 D26
5A
sm3E
-IL2
sm3E
-IL2 D
265A
TA990
5x10⁵
1x10⁶
2x10⁶
Cel
ls/g
monocytes/macrophages
spleen tumor
0
1x10⁵
2x10⁵
3x10⁵
4x10⁵
5x10⁵
0
2x10⁷
4x10⁷
6x10⁷
Cel
ls/g
CD8+ T cells
0
1x10⁷
2x10⁷
3x10⁷
4x10⁷
5x10⁷
Cel
ls/g
draining LN
C
TA99
TA99-IL
2
sm3E
-IL2
TA99-IL
2 D26
5A
sm3E
-IL2 D
265A
0
20
40
60
80
% d
ose
boun
d to
cel
ls
noitartnecnoc wolnoitartnecnoc hgih
Fig. S4. Ablating Fc receptor interactions modulates immunocytokine distribution to immune cells but does not significantly impact systemic or tumor-proximal cell numbers 24 h after treatment. As in Fig. 4, B16F10 tumor-bearing mice were injected i.v. with PBS or equimolar doses of Alexa Fluor 647-labeledproteins; 24 h later, immune cell populations from various organs were evaluated by flow cytometry to determine (A) the percentage of each cell type boundto fluorescent protein and (B) the numbers of each cell type per unit organ mass. Data represent means ± SEMs (n = 5). LN, lymph node. *P < 0.05; **P < 0.01;***P < 0.001; ****P < 0.0001 by one-way ANOVA with posthoc Tukey test (D265A vs. parent immunocytokines and TA99 vs. all immunocytokines). (C) Freshmurine blood was incubated with high (140 nM) or low (5.5 nM) concentrations of Alexa Fluor 647-labeled proteins and then separated into plasma and cellcomponents. Results are expressed as a percentage of the fluorescence of the total dose, and data represent means ± SEMs (n = 3–6).
Tzeng et al. www.pnas.org/cgi/content/short/1416159112 7 of 10

A PBS TA99-IL2 sm3E-IL2 TA99
blood
spleen
tumor
CD25
AF647
B PBS TA99-IL2 sm3E-IL2 TA99
blood
spleen
tumor
CD122
AF647
C PBS TA99-IL2 sm3E-IL2 TA99
blood
spleen
tumor
CD132
AF647
Fig. S5. IL-2R subunit expression by mouse DCs varies according to tissue compartment and administered therapies. B16F10 tumor-bearing mice were treatedwith PBS or equimolar amounts of the indicated therapeutic agents; 24 h later, the surface expressions of (A) CD25, (B) CD122, and (C) CD132 by CD11chi DCsfrom different organs were analyzed by flow cytometry. Gates were established using fluorescence minus one controls. Data represent one of at least twoindependent experiments with similar results.
Tzeng et al. www.pnas.org/cgi/content/short/1416159112 8 of 10

Fig. S6. Detailed schematic of the mathematical model for immunocytokine distribution and implications for biodistribution studies. (Upper) All four states ofimmunocytokine (plasma, free in tumor, bound in tumor, and internalized in tumor) are detailed here along with the processes that allow for transfer betweenstates. Note the two sinks for immunocytokine are denoted by the null symbol (Ø). (Lower) A comparison of activity exhibited by different payload types invarious compartments. Although the presence of radiolabels or fluorophores in a biodistribution assay indicates the compartment where the protein of in-terest is located, it is unable to distinguish between the active/inactive states of the protein. For example, an antibody–drug conjugate only has drug activity oninternalization, whereas immunocytokine needs to be extracellular (plasma, free in tumor, or bound in tumor) for activity. Although this model has only beenexplored for immunocytokine biodistribution, it can apply to other types of payloads as well. ADC, antibody–drug conjugate; CDC, complement-dependentcytotoxicity; IC, immunocytokine.
0 50 100 1500
1
2
3
4
5
Time (h)
Tum
or:b
lood
ratio
IgG
0 50 100 1500.0
0.2
0.4
0.6
0.8
1.0
Time (h)
Tum
or:b
lood
ratio
Control IgG
Adapted DataModel Prediction
0 50 100 1500
1
2
3
4
5
Time (h)
Tum
or:b
lood
ratio
scFv-Fc
0 50 100 1500
10
20
30
40
50
Time (h)
Tum
or:b
lood
ratio
SIP
Fig. S7. Validation of the immunocytokine mathematical model. To determine the ability of the model to accurately predict biodistribution of therapeuticproteins, biodistribution data were obtained from three different literature sources, and the results were plotted as tumor-to-blood ratios. Four cases wereinvestigated: IgG (1), control IgG lacking antigen specificity (1), scFv–Fc (2), and small-immune protein format (SIP) (3). The model prediction closely correspondswith the published results on an order of magnitude basis, indicating that this model is capable of predicting tumor-to-blood ratios of differently sizedproteins.
1. Borsi L, et al. (2002) Selective targeting of tumoral vasculature: Comparison of different formats of an antibody (L19) to the ED-B domain of fibronectin. Int J Cancer 102(1):75–85.2. Xu X, et al. (2000) Targeting and therapy of carcinoembryonic antigen-expressing tumors in transgenic mice with an antibody-interleukin 2 fusion protein. Cancer Res 60(16):4475–4484.3. Tijink BM, et al. (2009) (124)I-L19-SIP for immuno-PET imaging of tumour vasculature and guidance of (131)I-L19-SIP radioimmunotherapy. Eur J Nucl Med Mol Imaging 36(8):1235–1244.
Tzeng et al. www.pnas.org/cgi/content/short/1416159112 9 of 10

A
0 15 30 45 60 750
20
40
60
80
100
Time (h)%
act
ivity
Active Plasma ICActive Tumor IC (t1/2-endo = 2h)Active Tumor IC (t1/2-endo = 10h)Active Tumor IC (t1/2-endo = 50h)Active Tumor IC (non-binding)
0 15 30 45 60 750
20
40
60
80
100
Time (h)
% a
ctiv
ity
B
Fig. S8. Percentage activity of immunocytokine as determined by immunocytokine concentration and the EC50 of IL-2 (estimated as 0.03 nM). (A) Large-immunocytokine format has essentially identical activity curves in both plasma and tumor compartments regardless of antigen turnover rate, indicating thatthe system is saturated with IL-2. (B) Small-immunocytokine format has therapeutic windows that allow for differential IL-2 activity between plasma andtumor, reflecting the trend seen with the tumor-to-blood ratios. IC, immunocytokine.
Other Supporting Information Files
Dataset S1 (DOCX)
Table S1. Pharmacokinetic parameters of TA99-IL2 and sm3E-IL2 administered as a single i.v. bolus
Immunocytokine A α, h−1 B β, h−1 t1/2,α, h* t1/2,β, h†
TA99-IL2 0.3175 ± 0.02703 0.3303 ± 0.00582 0.6825 ± 0.02703 0.0512 ± 0.00066 2.1 ± 0.03673 13.54 ± 0.1719sm3E-IL2 0.2906 ± 0.054 0.7302 ± 0.4265 0.7094 ± 0.054 0.05892 ± 0.0034 1.77 ± 0.7636 11.85 ± 0.6814
Fifty micrograms Alexa Fluor 647-labeled immunocytokine was injected retroorbitally, and serum levels were monitored at various timepoints (n = 3 mice per construct). Data were fit to the equation MFI(t) = Ae−αt + Be−βt. MFI, median fluorescence intensity.*t1/2,α = ln(2)/α.†t1/2,β = ln(2)/β.
Tzeng et al. www.pnas.org/cgi/content/short/1416159112 10 of 10