Supporting Information Information . ... (SPS) consisted of a ... frequency of ca. 23 Hz was used to...
9
Supporting Information A Copper(I) Dye-Sensitized TiO 2 -Based System for Efficient Light Harvesting and Photoconversion of CO 2 into Hydrocarbon Fuel Yong-Jun Yuan, a Zhen-Tao Yu,* a,b Ji-Yuan Zhang, a and Zhi-Gang Zou,* a a Eco-Materials and Renewable Energy Research Center, National Laboratory of Solid State Mircrostructures, Department of Materials Science and Engineering, Nanjing University, Nanjing, 210093, P. R. China b State Key Laboratory of Coordination Chemistry, Nanjing University, Nanjing, 210093, P. R. China *Authors to whom correspondence should be addressed. E-mail :[email protected]; [email protected] Fax:(+86)-25-83686632 Electronic Supplementary Material (ESI) for Dalton Transactions This journal is © The Royal Society of Chemistry 2012
Transcript of Supporting Information Information . ... (SPS) consisted of a ... frequency of ca. 23 Hz was used to...

Supporting Information
A Copper(I) Dye-Sensitized TiO2-Based System for Efficient Light Harvesting and Photoconversion
of CO2 into Hydrocarbon Fuel
Yong-Jun Yuan,a Zhen-Tao Yu,*a,b Ji-Yuan Zhang,a and Zhi-Gang Zou,*a
a Eco-Materials and Renewable Energy Research Center, National Laboratory of Solid State
Mircrostructures, Department of Materials Science and Engineering, Nanjing University, Nanjing,
210093, P. R. China
b State Key Laboratory of Coordination Chemistry, Nanjing University, Nanjing, 210093, P. R. China *Authors to whom correspondence should be addressed.
E-mail :[email protected]; [email protected]
Fax:(+86)-25-83686632
Electronic Supplementary Material (ESI) for Dalton TransactionsThis journal is © The Royal Society of Chemistry 2012

Experimental Section
General information for synthesis and characterization. All reagents and solvents were reagent grade quality, obtained commercially and used without further purification except as noted. 4,4'-dibromo-6,6'-dimethyl-2,2'-bipyridine, 4-aldehydebenzeneboronic acid pinacol ester and [Cu(CH3CN)4]PF6 were prepared according to previously published procedure1-3.
1H NMR spectra was measured on a Bruker AMX500 MHZ FT NMR spectrometer. Analyses for C, H and N were performed on a Perkin-Elmer 240C element analyzer. The FT-IR spectra was obtained on a on the Nexus 870 FT-IR spectrometer. Absorption spectrum of solution was measured with a Varian Cary 50 UV-Vis spectrophotometer, and absorption spectra of solid sample and film were obtained by using a Shimadzu UV-2550 UV-Visible spectrophotometer. The measurement system for the surface photovoltage spectroscopy (SPS) consisted of a source of monochromatic light, a lock-in amplifier (SR830-DSP) with a light chopper (SR540) and a photovoltaic cell. A 500 W xenon lamp and a grating monochromator (Omni-λ 500) were combined to provide the monochromatic light. A low chopping frequency of ca. 23 Hz was used to obtain stable and intensive signals. The photovoltaic cell was a sandwich-like structure of ITO-sample-ITO. The transient photovoltage spectra from a Nd:YAG laser (Polaris II, NewWave Research, Inc.) were performed with a Nd:YAG laser (Polaris II, NewWave Research, Inc.) and the signals were registered by a 500 MHz digital phosphor oscilloscope (TDS 5054, Tektronix) with a preamplifier.
N N
CN
COOH
NC
HOOC
NN
NC
HOOC
CN
COOH
Cu
+
N N
Br Br
CHOBO
ON N
OHC CHO
N N
COOH
CN
COOH
NC
+
Pd(PPh3)4, Na2CO3
THF/H2O, reflux piperidine, CHCl3 reflux
cyanoacteic acid
Cu(CH3CN)4PF6
CH3OH/CH2Cl2 reflux
+
Scheme S1. Synthesis of complex 1.
Preparation of 4,4'-di(p-aldehyde)phenyl-6,6'-dimethyl-2,2'-bipyridine. 4,4'-di(p-aldehyde)phenyl-6,6'-dimethyl-2,2'-bipyridine was obtained using a general coupling procedure4. 4,4'-dibromo-6,6'-dimethyl-2,2'-bipyridine (1 mmol), 4-aldehydebenzeneboronic acid pinacol ester (3 mmol), Pd(PPh3)4 (5 mol%), and K2CO3 (15 mmol) were added to a solution of tetrahydrofuran (50 mL) and water (10 mL). The mixture was stirred at 50 oC under nitrogen for 24 h, its color changed from yellow to dark during reaction. After cooling, water (30 mL) was added, the organic layer was separated and aqueous solution was extracted by ethyl acetate (2 × 30 mL), the organic phases were collected together. After drying over Na2SO4, the solvent was removed under reduced pressure. The pure product was obtained by column chromatography on silica gel (ethyl acetate) to give pale yellow solid.
Electronic Supplementary Material (ESI) for Dalton TransactionsThis journal is © The Royal Society of Chemistry 2012

Yield (71%). 1H NMR (500 MHz, CDCl3): 10.13 (2H, s), 8.57 (2H, s), 8.05 (4H, J = 8.5, d), 7.95 (4H, J = 6.5, d), 7.50 (2H, S), 8.77(4H, s), 2.76 (6H, s). Preparation of ligand: 4,4'-di[p-(cyanoacrylic acid)phenyl]-6,6'-dimethyl-2,2' -bipyridine. 4,4'-di[(p-aldehyde)phenyl]-6,6'-dimethyl-2,2'-bipyridine (1 mmol), cyanoacetic acid (2.98 mmol), and piperidine (1 mmol) were added to CHCl3 (10 mL) solution. The mixture was refluxed overnight; the yellow solid formed in the solution. The precipitate was filtered as product for next use. Yield (57%). 1H NMR (500 MHz, DMSO): 8.74 (4H, s), 8.55 (4H, s), 8.20 (4H, s), 8.14 (8H, J = 8.5, d), 8.04 (8H, J = 8.5, d), 8.77(4H, s), 2.69 (12H, s). Preparation of Cu(I) complex 1. 4,4'-di[p-(cyanoacrylic acid)phenyl]-6,6'-dimethyl-2,2'-bipyridine (1 mmol), [Cu(CH3CN)4]PF6 (0.5 mmol) were added to a solution of CH2Cl2 (15ml) and CH3OH (15 ml), the reaction mixture immediately turn red and then the solution was refluxed under nitrogen for 24h. After cooling, the solvent was removed under reduced pressure. The pure compound was obtain by column chromatography on silica gel (CH3OH/CH3COOH, v/v = 2:1). The product was dried under vacuum at 100 oC overnight for next. Yield (51%). The well resolved 1H NMR has been limited by their poor solubility in common organic solvents such as CHCl3, CH2Cl2, MeOH, DMSO and so on. 1H NMR (500 MHz, CF3COOD): δ 8.93 (4H, s), 8.85 (4H, s), 8.59 (4H, s), 8.47 (8H, J = 8.5, d), 8.29 (8H, J = 6.5, d), 3.26 (12H, S). IR (KBr, cm-1), 3396, 2217, 1628, 1570, 1544, 1389, 1195, 1015, 834, 788, 724. Anal. Found for CuC64N8H32O8PF6: C, 61.08; H, 3.62;N, 8.92; Calcd for CuC64N8H32O8PF6: C, 60.93; H, 3.52; N, 8.88. Device Fabrication for DSSCs.
The TiO2 paste preparation and device fabrication for sandwich-type DSSCs were carried out according to a previously reported procedure.5 FTO glass plates were cleaned in a detergent solution using an ultrasonic bath for 15 min, rinsed with water and ethanol. The FTO glass plates were immersed in 40 mM TiCl4 (aqueous) at 70 oC for 20 min, and washed with deionized water and ethanol. Then, an 80 μm layer of TiO2 paste was coated onto the FTO. After dried at 125 oC, the electrodes were annealed at 450 oC for 20 min. Another layer of TiO2 paste was coated onto the films again. After being annealed at 450 oC, the films were immersed in aqueous TiCl4 at 70 oC again. The films were sintered at 500 oC in an air flow. When cooled to room temperature, the electrodes were soaked into the CH3OH/CH2Cl2 solution of complex 1 (0.5 mM) for 24 h. The resulting sensitized TiO2 electrodes were washed with distilled water and dried at room temperature for 30 min. The substrate, film, and counter electrode (a magnetron sputter platinum mirror) constituted a sandwich-like open cell. The electrolyte was composed of 1.0 M BMII, 50 mM LiI, 30 mM I2, and 0.5 M tert-butylpyridine in a mixture of acetonitrile and valeronitrile (volume ratio, 85:15). Current density voltage (J-V) curves of the DSSC with an active area of 0.132 cm2
was measured under AM1.5 (100 mW/cm2) illumination, the irradiation source was a 450 W Xenon light source (Keithley 236), and the solar simulator was calibrated by using a reference Si reference cell (Oriel, Model 91150V).
Preparation of 1/TiO2. 0.25 g P-25 was added into 10 mL of 1 mM CH3OH/CH2Cl2 solution of complex 1. After sonicated for
about 10 min, the mixture was stirred in the dark at 50 oC for about 24 h. Centrifuged and washed with absolute ethanol; the product was dried under vacuum at 100 oC overnight for further CO2 reaction.
Photocatalytic CO2 reduction Photocatalytic CO2 reduction was conducted in the gas phase over solids under visible-light irradiation
using a 300 W Xenon arc lamp with a cut-off filter (λ > 420 nm).6 0.1 g of solid sample was uniformly placed on a glass reactor with a typical area of 4.2 cm2. The volume of the reaction system was about 230 mL. After the setup was fully evacuated to remove any air, high-purity CO2 gas was introduced into the system at near-ambient pressure. Then, 0.4 mL of deionized water was injected into the reaction chamber. At given irradiation time intervals, a series of gases of a certain volume (ca. 1.0 mL) were taken out via a syringe for analysis with a gas chromatograph (Shimadzu GC-2014) equipped with Porapak-N column. Calibration of the methane gas chromatograph is accomplished by measuring instrument response to a known concentration of methane in argon. For the second run, the setup was fully evacuated again. Then, 0.4 mL of deionized water was injected into the reaction chamber prior to light irradiation.
Electronic Supplementary Material (ESI) for Dalton TransactionsThis journal is © The Royal Society of Chemistry 2012
Theoretical Calculation. The calculation was performed with Gaussian 09 program based on density functional theory, the geometries and energy was optimized by using the B3LYP/LAND2DZ. The calculation was done on the IBM Blade cluster system in the High Performance Computing Center of Nanjing University. Reference (1) Han, W-S.; Han, J-K.; Kim, H-Y.; Choi, M. Jin.; Kang, Y. S.; Pac, C.; Kang, S. O. Inorg. Chem. 2011, 50, 3271-3280. (2) Huang, C. S.; Wen, L. P.; Liu, H. B.; Li, Y. L.; Liu, X. F.; Yuan, M. J.; Zhai, L.; Zhu, D. B. Adv. Mater. 2009, 21, 1721-1725. (3) Kubas, G. J.; Monzyk, B.; Crumbliss, A. L. Inorg. Synth. 2007, 19, 90-91. (4) Kim, J. J.; Lim, K.; Choi, H. B.; Kang, M. S, Gao, G. H. Inorg. Chem. 2010, 49, 8351-8357. (5) Wang, P.; Zakeeruddin, S. M.; Comte, P.; Charvet, R.; Humphry-Baker, R.; Grätzel, M. J. Phys. Chem. B 2003, 107, 14336-14341. (6) (a) Liu, Q.; Zhou, Y.; Kou, J.; Chen, X.; Tian, Z.; Gao, J.; Yan, S. C.; Zou, Z. G. J. Am. Chem. Soc. 2010, 132, 14385-14387. (b) Yan, S. C.; Ouyang, S. X.; Gao, J.; Yang, M.; Feng, J. Y.; Fan, X. X.; Wan, L. J.; Li, Z. S.; Ye, J. H.; Zhou, Y.; Zou, Z. G. Angew. Chem. Int. Ed. 2010, 49, 6400-6404.
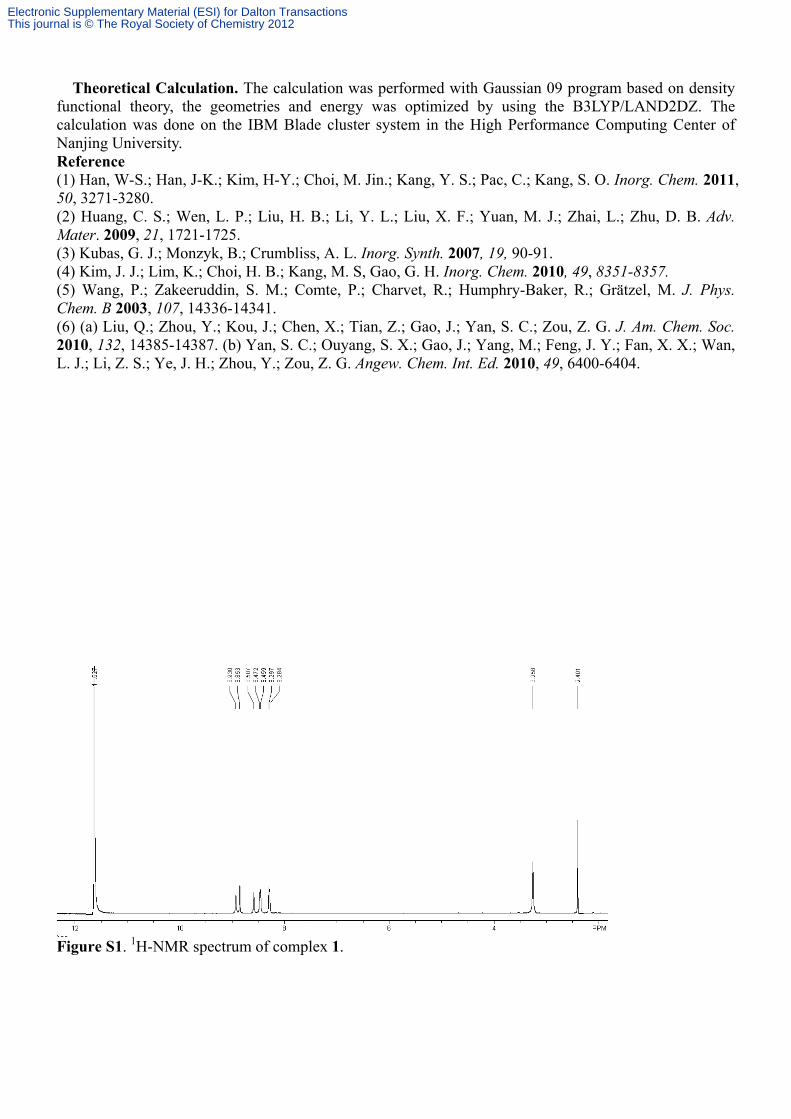
Figure S1. 1H-NMR spectrum of complex 1.
Electronic Supplementary Material (ESI) for Dalton TransactionsThis journal is © The Royal Society of Chemistry 2012

(a)
(b)
200 300 400 500 600 700 8000.00
0.02
0.04
0.06
0.08
0.10
0.12
Ab
sort
ance
Wavelength (nm)
Figure S2. Comparison of the UV-vis absorption spectra of 1 in methanol solution (ca. 0.01 mM), on P-25 and a thin transparent TiO2 film (a); Solid-state electronic absorption spectrum of complex 1 at 298 K (b).
Electronic Supplementary Material (ESI) for Dalton TransactionsThis journal is © The Royal Society of Chemistry 2012

4000 3000 2000 10000
20
40
60
80
100
Tra
nsm
itta
nce
(%
)
Wavenumbers (cm-1)
-CN
Figure S3. FT-IR of complex 1.
Figure S4.Chemical structure of complex 1 optimized by DFT.
Electronic Supplementary Material (ESI) for Dalton TransactionsThis journal is © The Royal Society of Chemistry 2012

Figure S5. HOMO distribution of complex 1 by DFT calculation.
Figure S6. LUMO distribution of complex 1 by DFT calculation.
400 500 600 700 800
Ab
s (
a.u
)
Wavelength (nm)
Before photocatalysis After photocatalysis
Figure S7. Absorption spectrum of 1/TiO2 powder recorded before and after CO2 photoreduction.
Electronic Supplementary Material (ESI) for Dalton TransactionsThis journal is © The Royal Society of Chemistry 2012

4000 3000 2000 1000
0
20
40
60
80
100
120 T
ran
sm
itta
nce
(%
)
Wavenumbers (cm-1)
1/TiO2 before photocatalysis
1/TiO2 after photocatalysis
Figure S8. FT-IR of 1/TiO2 before and after photocatalysis.
250 300 350 400 450 500 550 600 6500.00
0.02
0.04
0.06
0.08
0.10
0.12
0.14
0.16 TiO2 (0 V)
1/TiO2 (0 V)
1/TiO2 (1 V)
Wavelength (nm)
Ph
oto
volt
age
(mV
)
Figure S9. Surface photovoltage spectrum of TiO2 and 1/TiO2.
Electronic Supplementary Material (ESI) for Dalton TransactionsThis journal is © The Royal Society of Chemistry 2012

hν
hν
CO2
CH4
Cu[(bpy)2]+/TiO2 *Cu[(bpy)2]+/TiO2
2H2O
O2 Cu[(bpy)2]2+/TiO2
hν
hν
CO2
CH4
Cu[(bpy)2]+/TiO2 *Cu[(bpy)2]+/TiO2
2H2O
O2 Cu[(bpy)2]2+/TiO2
2H2O → O2 + 4H+ + 4e-
CO2 + 8H+ + 8e-→ CH4 + 2H2O Figure S10. The possible photocatalysis process.
Electronic Supplementary Material (ESI) for Dalton TransactionsThis journal is © The Royal Society of Chemistry 2012