Supporting Information - rsc.org · carbon tape. Samples were then coated with a thin layer of gold...
23
Supporting Information Controlling integrin-based adhesion to a degradable electrospun fibre scaffold via SI- ATRP By Andrew E. Rodda,* Francesca Ercole, Veronica Glattauer, David R. Nisbet, Kevin E. Healy, Andrew P. Dove, Laurence Meagher and John S. Forsythe * Electronic Supplementary Material (ESI) for Journal of Materials Chemistry B. This journal is © The Royal Society of Chemistry 2016
Transcript of Supporting Information - rsc.org · carbon tape. Samples were then coated with a thin layer of gold...

Supporting Information
Controlling integrin-based adhesion to a degradable electrospun fibre scaffold via SI-
ATRP
By Andrew E. Rodda,* Francesca Ercole, Veronica Glattauer, David R. Nisbet, Kevin E.
Healy, Andrew P. Dove, Laurence Meagher and John S. Forsythe *
Electronic Supplementary Material (ESI) for Journal of Materials Chemistry B.This journal is © The Royal Society of Chemistry 2016
Materials and methods
Instrumental Methods
NMR
1H NMR spectra were recorded on a Bruker DPX-400, AC-400, or DRX-500 spectrometer at
298 K. Chemical shifts are reported in parts per million (ppm) and referenced to the chemical
shift of the residual solvent resonances (CHCl3: 1H δ = 7.26 ppm).
GPC
Gel permeation chromatography (GPC) studies of the Br-PCL macroinitiator was conducted
on a system composed of a Varian 390-LC Multi detector suite fitted with differential
refractive index, light scattering, and ultraviolet detectors equipped with a guard column
(Varian Polymer Laboratories PLGel 5 M, 50 × 7.5 mm) and two mixed D columns (Varian
Polymer Laboratories PLGel 5M, 300 × 7.5 mm). The mobile phase was CHCl3 (HPLC
grade) with 0.5 % TEA, at a flow rate of 1.0 mL min-1. Samples were filtered prior to analysis
(0.45 μm) and results were calibrated against Varian Polymer Laboratories Easi-Vials linear
polystyrene standards (162 - 2.4 × 10⁵ g mol-1) using Cirrus v3.3 software. Polymer solutions
were filtered through 0.45 µm filters before injection.
GPC analyses of the degraded fibre samples were performed using a Shimadzu modular
system comprising a DGU-20A3R degasser unit, an SIL-20A HT autosampler, a 10.0 µm
bead-size Agilent PLgel guard column (50 × 7.8 mm) followed by three Agilent PLgel Mixed
C columns (300 × 8 mm, bead size: 5 µm), a SPD-20A UV/Vis detector, and an RID-10A
differential refractive-index detector. The temperature of columns was maintained at 40°C
using a CTO-20A oven. The eluent was tetrahydrofuran (Chromasolv Plus for HPLC) and the
flow rate was kept at 0.8 mL/min using a LC-20AD pump. A molecular weight calibration
curve was produced using commercial narrow molecular weight distribution polystyrene
standards with molecular weights ranging from 500 to 2 × 10⁶ g/mol. Polymer solutions at
approx. 2 mg/mL were prepared and filtered through 0.45 µm PTFE filters before injection.
XPS
XPS analysis was performed using an AXIS Ultra DLD spectrometer (Kratos Analytical Inc.,
Manchester, UK) with a monochromated Al K source at a power of 150 W (15 kV 10
mA), a hemispherical analyser operating in the fixed analyser transmission mode and the
standard aperture (analysis area: 0.3 mm × 0.7 mm) The total pressure in the main vacuum
chamber during analysis was typically between 10-9 and 10-8 mbar. Charging of the samples
during irradiation was reduced by the use of an internal flood gun, coupled with a magnetic
immersion lens. Fibrous samples were also mounted beneath a metallic mask to further reduce
problematic charging of the sample. Survey spectra were acquired at a pass energy of 160 eV,
while high resolution C 1s spectra were recorded at 20 eV pass energy. Each specimen was
analysed at an emission angle of 0° as measured from the surface normal. Under these
conditions the XPS analysis depth typically ranges between 5 and 10 nm depending on the
element.
Data processing was performed using CasaXPS processing software version 2.3.15 (Casa
Software Ltd., Teignmouth, UK). Curve fitting was performed using a simplex algorithm
where residuals were minimised with multiple iterations. Binding energies were referenced to
the aliphatic hydrocarbon peak at 285.0 eV. Peaks resulting from primary and secondary ester
carbons were constrained to have identical integral and shape parameters.
DSC
Differential scanning calorimetry was performed using a Pyris 1 calorimeter. Two heating
cycles were performed between -50 °C and 150 °C, using a heating rate of 5 °C/min. The
analysis result obtained with the second temperature cycle were reported.
SEM
Electrospun fibre samples were dried under vacuum and attached to a stub using double-sided
carbon tape. Samples were then coated with a thin layer of gold using a sputter coater (Ulvac
VPS-020) at 4 mA for 3 minutes. Images were obtained using a benchtop SEM (FEI Phenom,
5 kV) according to manufacturer instructions.
Supplementary experimental methods and results
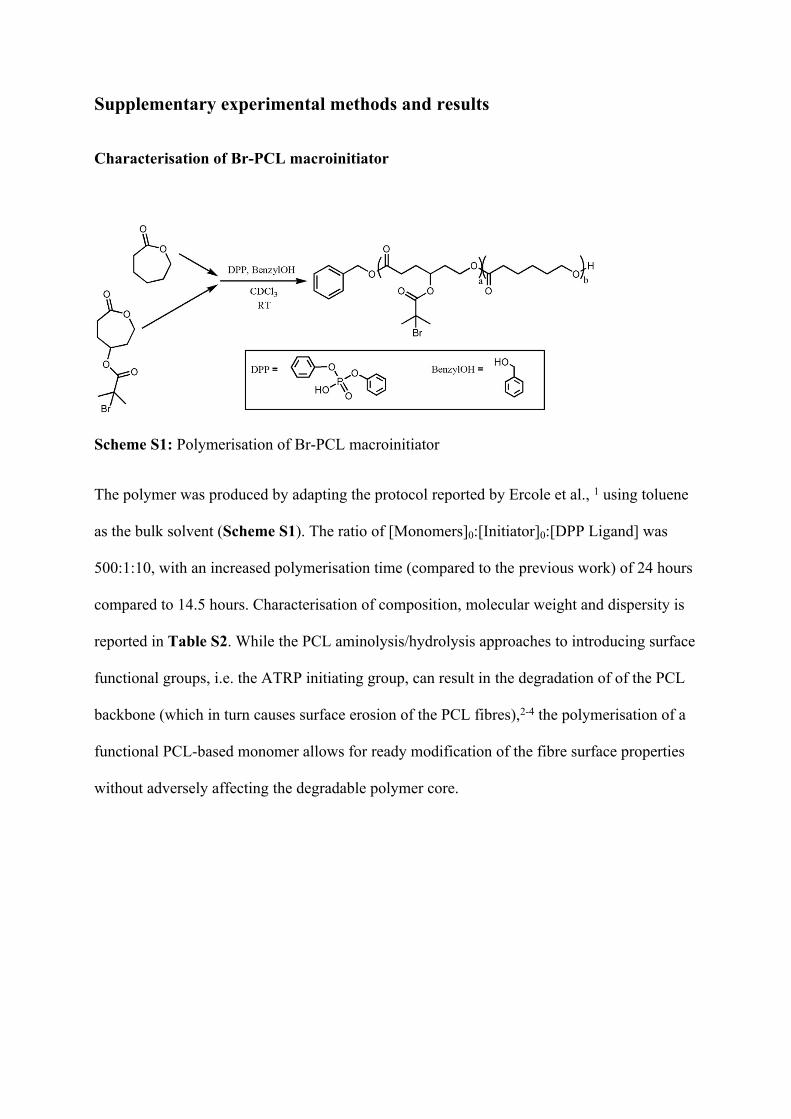
Characterisation of Br-PCL macroinitiator
Scheme S1: Polymerisation of Br-PCL macroinitiator
The polymer was produced by adapting the protocol reported by Ercole et al., 1 using toluene
as the bulk solvent (Scheme S1). The ratio of [Monomers]0:[Initiator]0:[DPP Ligand] was
500:1:10, with an increased polymerisation time (compared to the previous work) of 24 hours
compared to 14.5 hours. Characterisation of composition, molecular weight and dispersity is
reported in Table S2. While the PCL aminolysis/hydrolysis approaches to introducing surface
functional groups, i.e. the ATRP initiating group, can result in the degradation of of the PCL
backbone (which in turn causes surface erosion of the PCL fibres),2-4 the polymerisation of a
functional PCL-based monomer allows for ready modification of the fibre surface properties
without adversely affecting the degradable polymer core.

Table S1: Analysis of Br-PCL macroinitiator polymer used in this study. A similar
previously-described, lower molecular weight copolymer is shown for comparison.
Polymer % Br-CL
(feed) [a]
% conv.
(CL/Br-CL) [b]
Final %
Br-CL [c]
Mn theo.
(kDa) [d]
Mn (GPC/NMR)
(kDa) [e][f]
Đ [f]
Br-PCL 15 82/91 14 61.4 91.6/77.3 1.24
Br-PCL
(Ercole et al.) 116 61/63 13 40.5 65.9/50.0 1.07
[a] Molar percentage of Br-CL in feed. [b] Calculated from ratio of integrals (1H NMR) of
monomer peaks to broad polymer peaks in the crude polymerization mixture. [c] Composition
of purified polymer calculated from 1H NMR [d] Mn (theo.) was determined from the feed
concentrations of the monomers (Br-CL and ε-CL) and initiator (I) and their final conversions
(as determined by comparing monomer and polymer peaks) using the equation: Mn (theo.) =
(([Br-CL]/[I]0) × conversion × (MW of Br-CL)) + (([ε-CL]/[I]0) × conversion × (MW of ε-
CL)) + (MW of initiator) [e] Mn was determined from 1H NMR by integrating the peaks
related to the aromatic end groups and comparing to those of the polymer. [f] Determined by
GPC analysis in CHCl3 with 0.5 vol% triethylamine, using polystyrene standards.
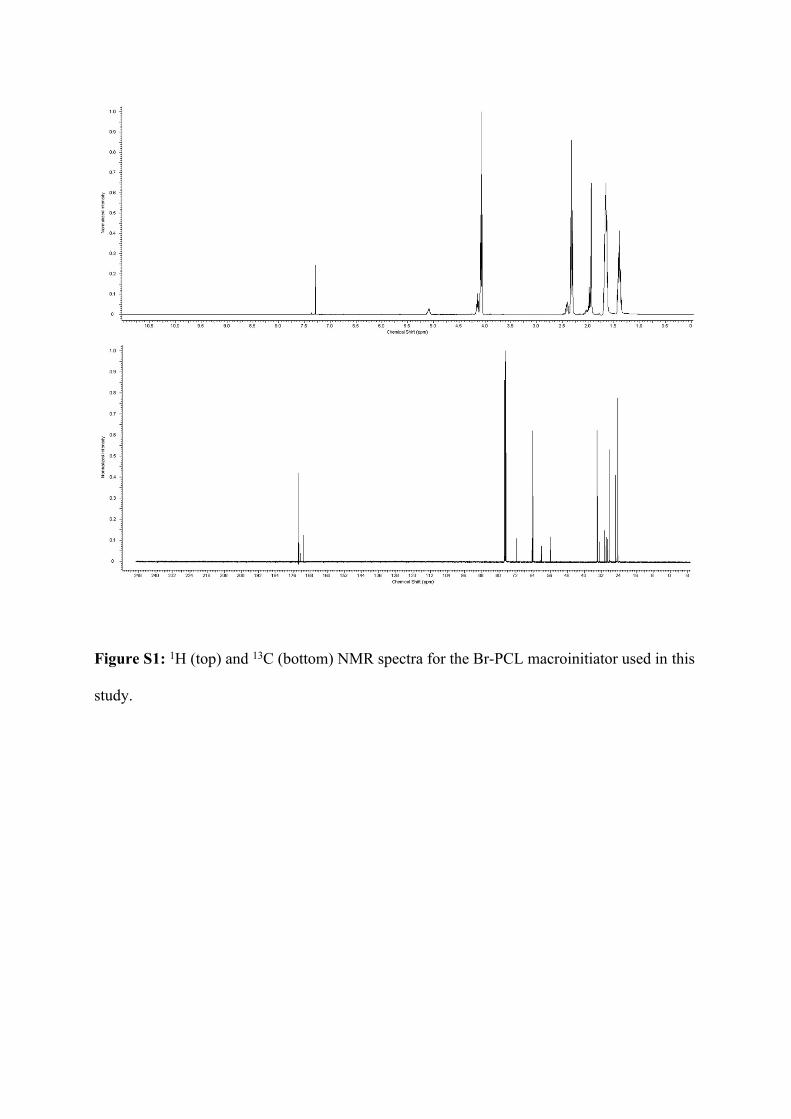
Figure S1: 1H (top) and 13C (bottom) NMR spectra for the Br-PCL macroinitiator used in this
study.

Electrospinning of Br-PCL blends
Methods
Four separate polymer solutions were prepared, comprising 14 %, 25 %, 50 % and 75 %
blends of Br-PCL with commercially-obtained pure PCL, using 3:1 chloroform:methanol as
the solvent. Total polymer concentration was adjusted empirically to produce solutions of
similar viscosity; while Br-PCL was of a similar Mn to the commercial PCL, a lower degree
of polymerisation and small amounts of branching meant that chain entanglement
concentration and viscosity were decreased for a similar mass concentration. Quantities that
were disolved in 2 ml of solvent are shown in Table S2.
Table S2: Solutions used to investigate electrospinning of Br-PCL/PCL blends
14 % 25 % 50 % 75 %
Br-PCL 36 mg 71 mg 150 mg 370 mg
PCL 216 mg 213 mg 150 mg 123 mg
These solutions were electrospun on a custom-built electrospinner using the following
conditions: +15 kV (18 gauge needle), 0 kV (plate collector covered with aluminium foil), 0.6
ml/hr, 22 °C, 42 % relative humidity. Fibre matrices were spun from working distances of 10,
14, 18 and 22 cm and stored in a vacuum desiccator prior to analysis. Similar sets of fibres
were electrospun by reversing the polarities of the needle and collector.
Results
Samples of electrospun fibres were analysed using XPS to determine the relative surface
bromine content of the electrospun fibres. A series of fibres was also produced using a

reversed polarity electrospinning setup (i.e. a negatively charged needle and positively
charged collector) to check for charge-driven phase separation of the blended polymers.
Surface bromine abundance consistently increased along with Br-PCL content, but no
consistent trend in bromine concentration was observed for fibres produced via changed
polarity (Figure S2A). This is in contrast to a recent report of PCL that was end-
functionalised with similar ATRP initiator groups.5 When compared to the atomic
composition predicted via the stoichiometry of the polymer blend, the measured atomic
abundance of Br was lower than expected in all spectra, which we attributed either to
adventitious carbon contamination, or potentially to loss of Br during analysis as a result of
X-ray damage to the sample.
While solutions with high percentages of Br-PCL produced scaffolds with higher surface
concentrations of bromine, they were also more likely to form fibres with a “liquified”
morphology (Figure S2(B-I)). Working distance was also found to have a secondary
influence on fibre morphology, with larger working distance reducing the observed extent of
the liquified morphology, potentially by allowing greater time for solvent evaporation prior to
deposition. Unlike solutions that were blended with PCL, solutions of neat Br-PCL did not
produce fibres under these conditions, nor through a range of alternative electrospinning
protocols. We suggest that this can be explained by supposing that the ATRP initiating group
alters the packing of the PCL crystals, and thereby prevents the effective solidification of the
Br-PCL fibres. As can be observed in Figure S3, analysis of the melting temperature of Br-
PCL via differential scanning calorimetry (DSC) showed that Br-PCL melted at a far lower
temperature (30 – 35 °C) than PCL, indicating that the polymer packing had been disrupted
by the addition of the ATRP initiator group. However, examination of the fibres used in later
experiments (1:3 blend of Br-PCL:PCL) showed good miscibility and a melting temperature
similar to that of PCL (approximately 55 °C).
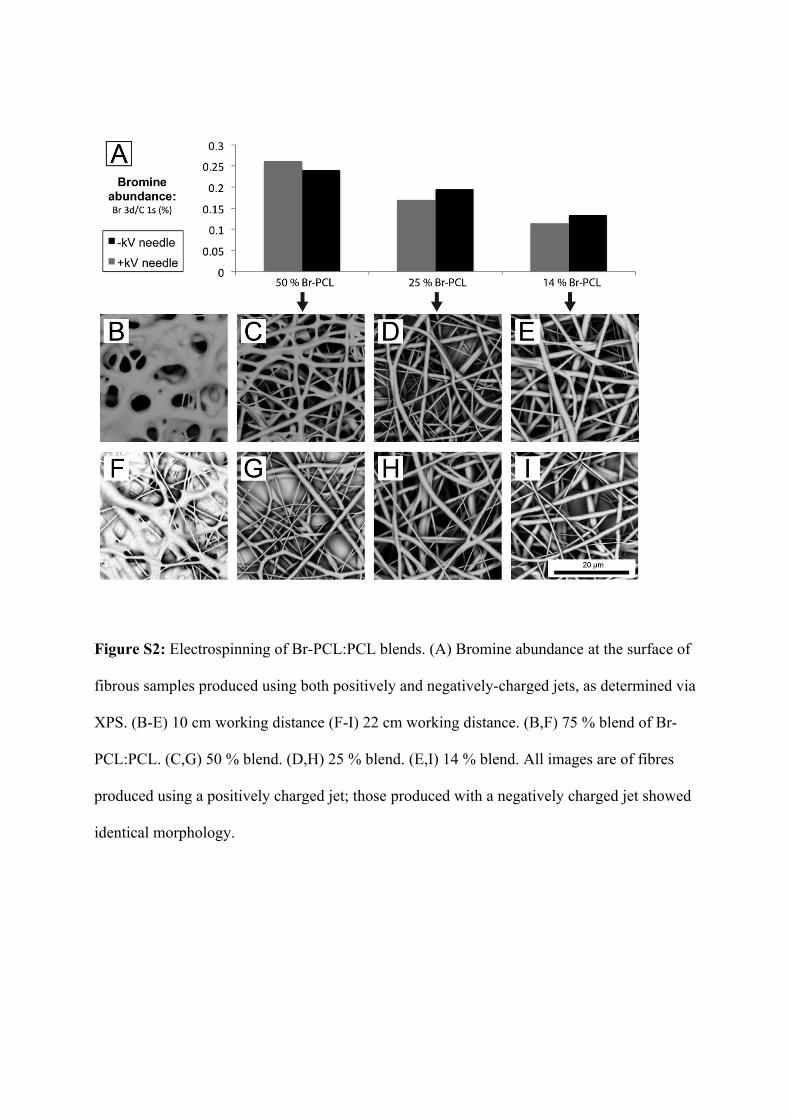
Figure S2: Electrospinning of Br-PCL:PCL blends. (A) Bromine abundance at the surface of
fibrous samples produced using both positively and negatively-charged jets, as determined via
XPS. (B-E) 10 cm working distance (F-I) 22 cm working distance. (B,F) 75 % blend of Br-
PCL:PCL. (C,G) 50 % blend. (D,H) 25 % blend. (E,I) 14 % blend. All images are of fibres
produced using a positively charged jet; those produced with a negatively charged jet showed
identical morphology.

Figure S3: DSC analysis of Br-PCL shown a reduced melting temperature compared to
commercial PCL. However, a 1:3 blend of Br-PCL:PCL retained a higher melting
temperature. The top two curves have been offset vertically from baseline readings that match
those of PCL.

KF deprotection
Treatment with a 0.5 M solution of KF in methanol successfully removed silyl protecting
groups from the brush layers, as determined by XPS analysis of silicon abundance. However,
analysis of the deprotected fibres showed that the integrity of the grafted polymer brush
coating was compromised by longer reaction times. A decrease in the ether
carbon:hydrocarbon ratio was observed following treatment with KF, along with traces of
bromine. Br-PCL in solutions of chloroform/methanol (from electrospinning) had also been
observed to degrade (yellowed solution and small extra resonance detected by NMR at 3.67
ppm) which we ascribe to transesterification of the Br-PCL by methanol. We thus believe that
the methanol/KF solution degraded the coatings via this same reaction, leading to release of
the grafted brushes and exposure of the underlying electrospun fibres.
As can be seen in Table S3, deprotection for 6 hours resulted in noticeably less hydrocarbon
species being present in the spectra compared to a 24 hour treatment, and a concomitant
increase in the abundance of ether carbon. As might be expected from a theoretical
deprotection reaction with no side reactions, hydrocarbon content decreased following
reaction with KF for 6 hours, due to the removal of the trimethylsilyl protective group.
Furthermore, XPS analysis indicated that the shorter reaction time removed a similar quantity
of silicon from the surfaces as a longer reaction. While it is likely that the transesterification
reaction is still occurring to a small degree (see Table S3), a 6 hour deprotection time was
adopted as the standard for grafted Br-PCL fibres in further experiments.

Table S3: XPS atomic abundance on fibre samples following deprotection using 0.5 M KF.
Data are reported as mean atomic % (standard deviation). Shortened reaction times led to
higher abundances of oxygen and ether carbon and lower abundances of hydrocarbons and
bromine (indicating better retention of the brush coating) while the silyl protecting group was
removed equally well (reduction in Si 2p).
Peak
(approximate position)
Prior to KF
treatmentKF 6 hrs KF 24 hrs
O 1s (529 eV) 27 (0) 28 (0) 26 (0)
C 1s 72 (0) 72 (0) 73 (0)
Hydrocarbon (285 eV) 15 (1) 12 (3) 19 (3)
Ether (286.4 eV) 46 (2) 43 (2) 37 (2)
Ester/Secondary Ester
(289.1/285.7 eV)6 (0) 9 (2) 8 (0)
Si 2p (100 eV) 0.7 (0.1) 0.2 (0.0) 0.3 (0.1)
Br 3d (69 eV) 0.00 0.03 (0.01) 0.05 (0.01)

Grafting of TMS-Prg-HEGMA from solutions containing varied concentrations of
monomer
Grafting was performed as described above, using either 10 %, 20 % or 30 % molar
concentration TMS-Prg-HEGMA (with regard to total monomer). The abundance of silicon
on the surfaces of the grafted fibres was found to increase along with the feed concentration
of alkyne monomer (Table S4), although the detected abundances are higher than would be
predicted based on the stoichiometry of the feed solution. This is in accordance with previous
observations for this monomer,6 and is supported by the modelling work below, which
suggests that TMS-Prg-HEGMA is preferentially incorporated into the polymer brush coating,
and shows that the density of surface reactive groups can be easily manipulated.
Table S4: XPS atomic abundance on the surfaces of Br-PCL-graft-poly(TMS-Prg-HEGMA-
co-OEGMA) using 10 %, 20 % and 30 % TMS-Prg-HEGMA monomer solutions. The
abundance of silicon on the surfaces increases with the proportion of alkyne monomer in the
feed. Determined via XPS analysis of single samples Data are reported as total atomic
percent.
Peak 10 % alkyne 20 % alkyne 30 % alkyne
C 1s 71.6 72.0 71.1
Hydrocarbon (285 eV) 21 23 21
Ether (286.4 eV) 37 34 35
Ester/Secondary Ester
(289.1/285.7 eV)7 7 7
O 1s (529 eV) 26.9 26.0 26.5
Si 2p (100 eV) 1.4 1.7 2.2

Semi-quantitative analysis of fluorine content in p(OEGMA-co-Prg-HEGMA) brush
coatings, derivatised via click reaction with TFAB
The atomic compositions of the graft layer were modelled in a speadsheet using the following
vectors, and fitted to survey spectra (examples of survey spectra can be seen in Figure S4).
Atom X1 =
TMS-Prg-HEGMA
X2 =
Prg-HEGMA
X3 =
OEGMA 475
X4 =
TFAB
F 0 0 0 3
O 8 8 11 2
N 0 0 0 3
C 22 19 23 10
Si 1 0 0 0
And the total composition was modelled as:
�̅� = 𝑅𝑔𝑋3 + (1 ‒ 𝑅𝑔)[𝑌𝑑(𝑋2 + 𝑌𝑐𝑋4) + (1 ‒ 𝑌𝑑)𝑋1]
Where: 𝑅𝑔 = Graft ratio (% OEGMA vs total monomer)
𝑌𝑑 = Yield of deprotection reaction
𝑌𝑐 = Yield of click reaction
Errors were defined as:
i Xi Xi
Xi

Normalisation was used to compensate for the widely varied abundances of different elements,
but equal importance in fitting the model. The entire process was also repeated, with similar
results, for errors that were normalised to the experimental measurements rather than the
model predictions.
The sum of squared errors was minimised by optimising the three parameters (Rg/Yd/Yc) until
a minimum was reached that was stable for perturbations in all three parameters.
This technique makes several approximations, which prevent it from being fully quantitative:
it assumes no contamination by either adventitious carbon or silicon, both of which were
commonly observed in Br-PCL polymer-based coatings. It also assumes that no signal is
detected from the underlying macroinitiator polymer.
Figure S4: Survey spectra of fibres at various stages during functionalisation
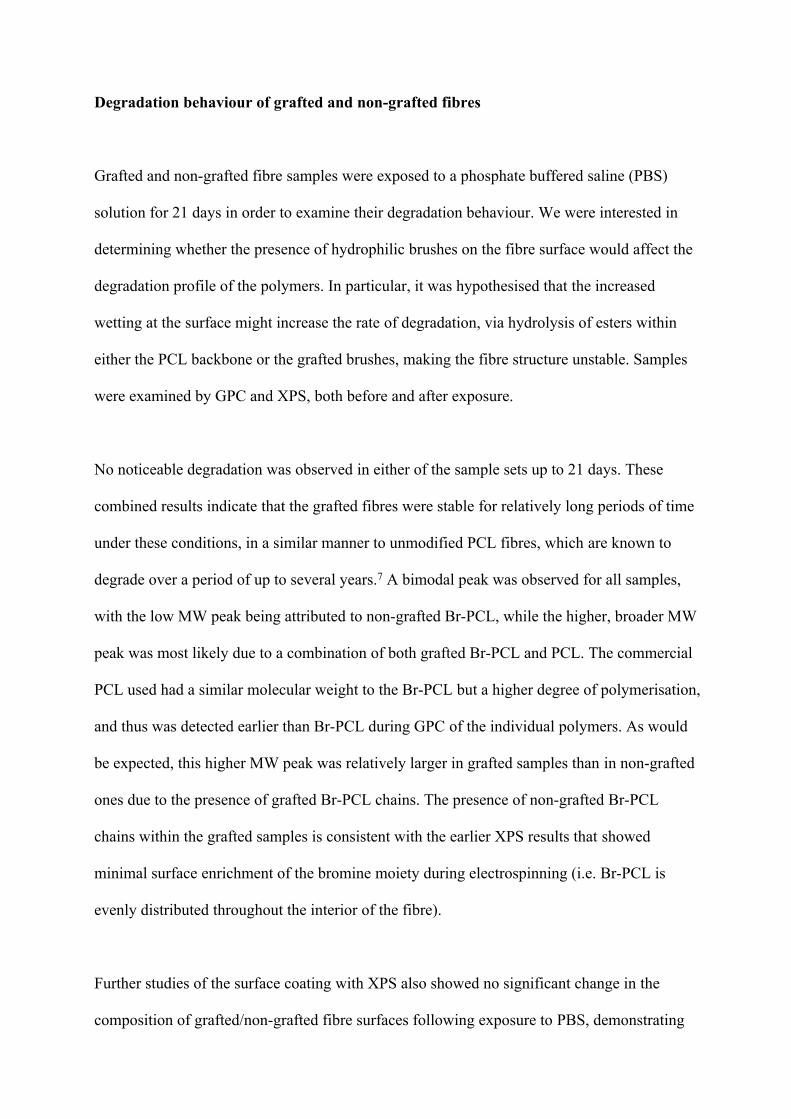
Degradation behaviour of grafted and non-grafted fibres
Grafted and non-grafted fibre samples were exposed to a phosphate buffered saline (PBS)
solution for 21 days in order to examine their degradation behaviour. We were interested in
determining whether the presence of hydrophilic brushes on the fibre surface would affect the
degradation profile of the polymers. In particular, it was hypothesised that the increased
wetting at the surface might increase the rate of degradation, via hydrolysis of esters within
either the PCL backbone or the grafted brushes, making the fibre structure unstable. Samples
were examined by GPC and XPS, both before and after exposure.
No noticeable degradation was observed in either of the sample sets up to 21 days. These
combined results indicate that the grafted fibres were stable for relatively long periods of time
under these conditions, in a similar manner to unmodified PCL fibres, which are known to
degrade over a period of up to several years.7 A bimodal peak was observed for all samples,
with the low MW peak being attributed to non-grafted Br-PCL, while the higher, broader MW
peak was most likely due to a combination of both grafted Br-PCL and PCL. The commercial
PCL used had a similar molecular weight to the Br-PCL but a higher degree of polymerisation,
and thus was detected earlier than Br-PCL during GPC of the individual polymers. As would
be expected, this higher MW peak was relatively larger in grafted samples than in non-grafted
ones due to the presence of grafted Br-PCL chains. The presence of non-grafted Br-PCL
chains within the grafted samples is consistent with the earlier XPS results that showed
minimal surface enrichment of the bromine moiety during electrospinning (i.e. Br-PCL is
evenly distributed throughout the interior of the fibre).
Further studies of the surface coating with XPS also showed no significant change in the
composition of grafted/non-grafted fibre surfaces following exposure to PBS, demonstrating
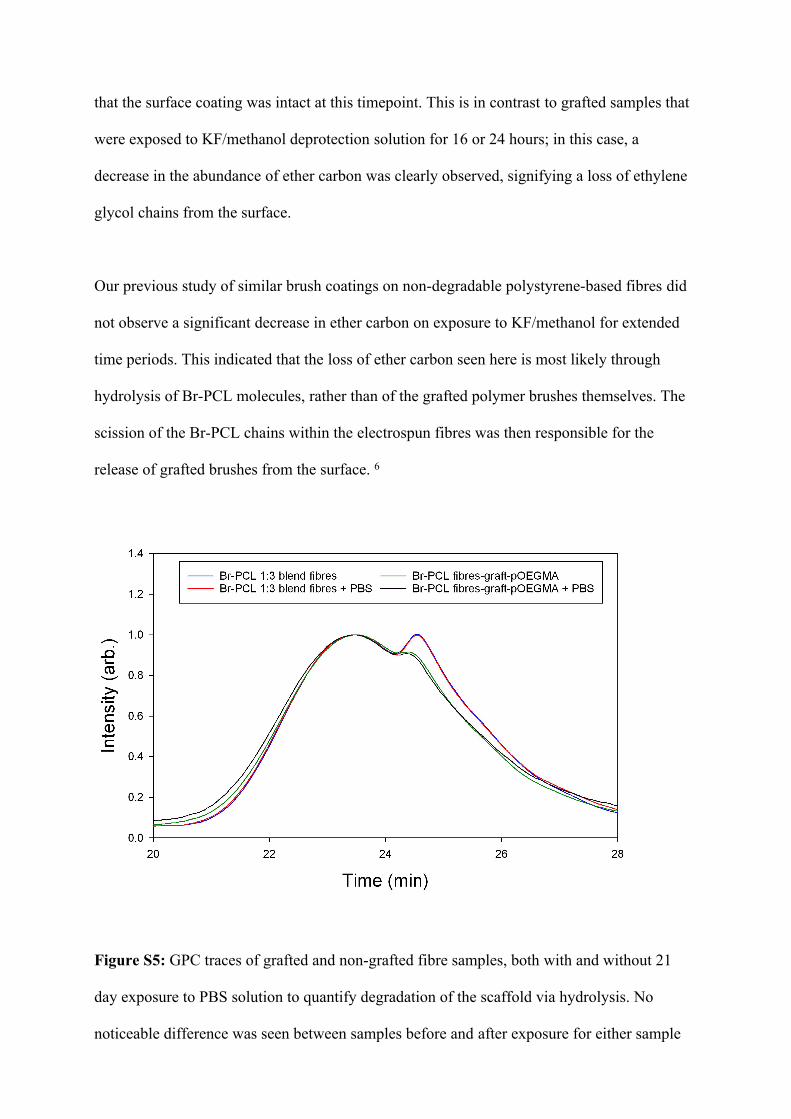
that the surface coating was intact at this timepoint. This is in contrast to grafted samples that
were exposed to KF/methanol deprotection solution for 16 or 24 hours; in this case, a
decrease in the abundance of ether carbon was clearly observed, signifying a loss of ethylene
glycol chains from the surface.
Our previous study of similar brush coatings on non-degradable polystyrene-based fibres did
not observe a significant decrease in ether carbon on exposure to KF/methanol for extended
time periods. This indicated that the loss of ether carbon seen here is most likely through
hydrolysis of Br-PCL molecules, rather than of the grafted polymer brushes themselves. The
scission of the Br-PCL chains within the electrospun fibres was then responsible for the
release of grafted brushes from the surface. 6
Figure S5: GPC traces of grafted and non-grafted fibre samples, both with and without 21
day exposure to PBS solution to quantify degradation of the scaffold via hydrolysis. No
noticeable difference was seen between samples before and after exposure for either sample
type. Individual analysis of PCL and Br-PCL produced curves that appeared to correspond to
the two major peaks observed here.
Figure S6: Peak fitting quantification of high resolution C 1s XPS spectra of grafted and non-
grafted fibres with/without exposure to PBS solution for 21 days. No significant changes were
seen following PBS exposure, indicating that the fibre coatings were stable.

L929 fibroblast culture: automated cell shape analysis
Methods:
Scaffolds were prepared as for MSC cultures. Stock cultures of L929 murine fibroblasts (cell
line ATCC-CCL-1, Rockville, MD, USA) were cultured in minimum essential medium
containing 10 % fetal bovine serum (FBS) and 1 % nonessential amino acids. L929 cells were
washed with PBS and harvested with TrypLE™ Express (Gibco), then washed twice in media.
They were then seeded onto fibre scaffolds at a density of 2.5 × 10⁴ cells/cm2 (relative to the
area of the underlying plate) and incubated for 24 hours. Cells were then stained and imaged
as described for MSCs.
Images of L929 cells taken at low magnification were processed using brightness/contrast,
automated edge-finding and thresholding to create a black and white image, which was
analyzed using ImageJ Particle Analysis tool. Cells at the edge of the image and clusters of
multiple cells were excluded from analysis. Several hundred cells were analyzed for both
conditions and the resulting shape parameters for cells on the two surfaces were compared
using a Mann-Whitney non-parametric test performed using Prism 6 software.
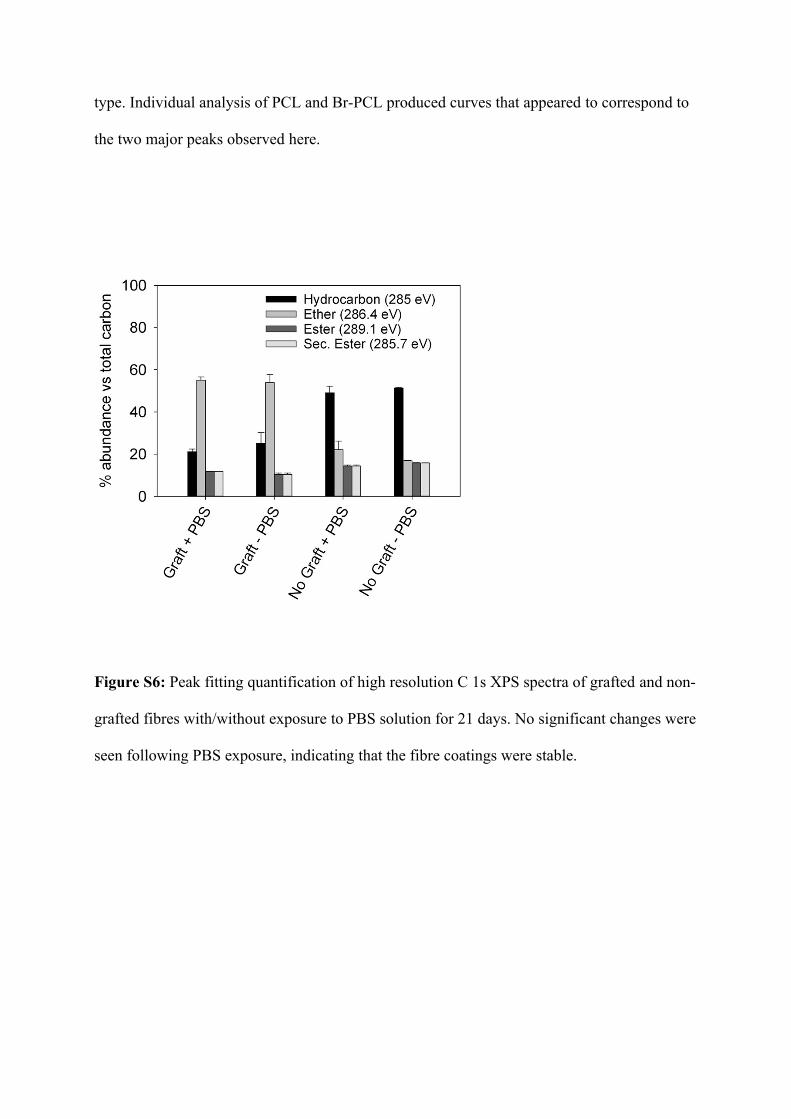
Cells grown on fibres with attached cRGD were spread, while those grown on brush-only
surfaces were far more rounded. Analysis of the results showed a significant change in the
shape of fibroblasts cultured on the two surfaces (Figure S7).
Figure S7: L929 fibroblast cells had significantly higher aspect ratios (p < 0.0001) when
cultured on fibrous substrates bearing the cRGDfK(azide) peptide, compared to brush-only
controls.
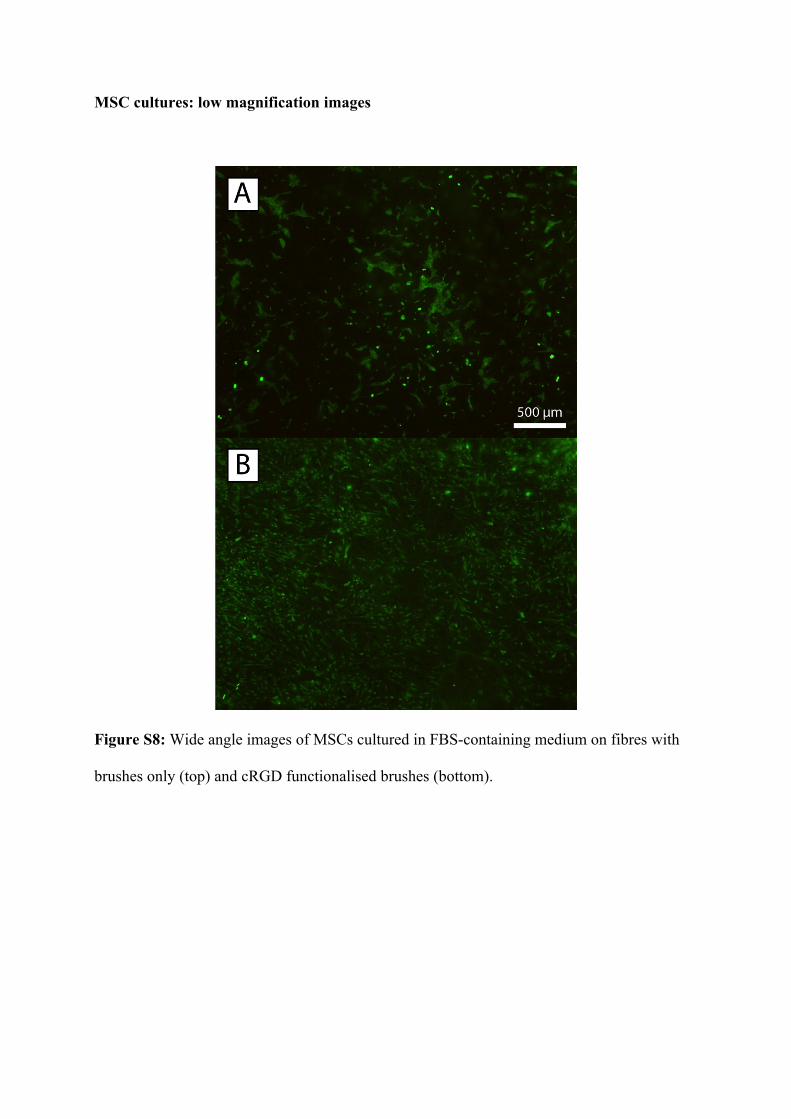
MSC cultures: low magnification images
Figure S8: Wide angle images of MSCs cultured in FBS-containing medium on fibres with
brushes only (top) and cRGD functionalised brushes (bottom).
1. Ercole, F.; Rodda, A. E.; Meagher, L.; Forsythe, J. S.; Dove, A., Surface Grafted Poly(Ε-Caprolactone) Prepared Using Organocatalysed Ring-Opening Polymerisation Followed by Si-Atrp. Polym. Chem. 2014, 5, 2809-2815.2. Jiang, H.; Wang, X.; Li, C.; Li, J.; Xu, F.; Mao, C.; Yang, W.; Shen, J., Improvement of Hemocompatibility of Polycaprolactone Film Surfaces with Zwitterionic Polymer Brushes. Langmuir 2011, 27, 11575-11581.3. Xu, F.; Wang, Z.; Yang, W., Surface Functionalization of Polycaprolactone Films Via Surface-Initiated Atom Transfer Radical Polymerization for Covalently Coupling Cell-Adhesive Biomolecules. Biomaterials 2010, 31 (12), 3139-3147.4. Yuan, W.; Li, C.; Zhao, C.; Sui, C.; Yang, W.-T.; Xu, F.-J.; Ma, J., Facilitation of Gene Transfection and Cell Adhesion by Gelatin-Functionalized Pcl Film Surfaces. Adv. Funct. Mater. 2012, 22, 1842-1851.5. Harrison, R. H.; Steele, J. A. M.; Chapman, R.; Gormley, A. J.; Chow, L. W.; Mahat, M. M.; Podhorska, L.; Palgrave, R. G.; Payne, D. J.; Hettiaratchy, S. P.; Dunlop, I. E.; Stevens, M. M., Modular and Versatile Spatial Functionalization of Tissue Engineering Scaffolds through Fiber-Initiated Controlled Radical Polymerization. Adv. Funct. Mater. 2015, 25 (36), 5748-5757.6. Rodda, A. E.; Ercole, F.; Glattauer, V.; Gardiner, J.; Nisbet, D. R.; Healy, K. E.; Forsythe, J. S.; Meagher, L., Low Fouling Electrospun Scaffolds with Clicked Bioactive Peptides for Specific Cell Attachment. Biomacromolecules 2015, 16 (7), 2109-2118.7. Cipitria, A.; Skelton, A.; Dargaville, T. R.; Dalton, P. D.; Hutmacher, D. W., Design, Fabrication and Characterization of Pcl Electrospun Scaffolds: A Review. J. Mater. Chem. 2011, 21, 9419-9453.