Supporting information - Proceedings of the National … information Cui et al....
9
Supporting information Cui et al. 10.1073/pnas.1217020110 SI Materials and Methods Molecular Cloning of JMJ703. To clone the full-length JMJ703 cDNA, we amplified a 3,717-bp cDNA fragment from a reverse- transcribed cDNA pool derived from a rice japonica variety. The PCR product was cloned into pENTR/D-TOPO (Invitrogen). A QuikChange Site-Directed Mutagenesis Kit (Stratagene) was used to make a point mutation in the JMJ703 coding sequence to switch amino acid histidine 394 to alanine. The wild-type and mutant JMJ703 coding sequences were introduced into the pEarley- Gate101 vector. Primers used for cloning are listed in Dataset S4. In Vivo Histone Demethylation Assays. Nuclei transfected with JMJ703-YFP-HA and JMJ703H394A-YFP-HA were visualized by observing the YFP signal under a microscope. Immunolabeling was conducted by using histone methylation-specific antibodies (H3K4me3: Millipore 07-473, 1:100; H3K4me2: Millipore 07-030, 1:500; H3K4me1: Millipore 07-436, 1:100; H3K9me3: Millipore 07-442, 1:100; H3K9me2: Millipore 07-441, 1:200; H3K9me1: Millipore 07-450, 1:100; H3K27me3: Millipore 07-449, 1:100; H3K27me2: Millipore 07-452, 1:100; H3K27me1: Millipore 07- 448, 1:100; H3K36me3: Abcam ab9050, 1:100; H3K36me2: Mil- lipore 07-274, 1:100; H3K36me1: Millipore 07-548, 1:100). Alexa Fluor 488-conjugated goat anti-rabbit (1:200, Invitrogen) was used as secondary antibody to determine the specific lysine modification site in vivo. After staining, nuclei were mounted by dispensing one drop of VECTASHIELD Mounting Medium with 4′, 6-diamidino- 2-phenylindole (DAPI) (Vector Laboratories) onto each slide, then photographed under a fluorescent microscope (Olympus BX51). At least 50 pairs of transfected nuclei versus nontrans- fected nuclei were observed under the same field of view to get consistent results. ImageJ (National Institutes of Health) software was used for quantification of the immunolabeled nuclei. Transcriptional Level Analysis. Total RNA was extracted by using TRIzol Reagent (15596–026; Invitrogen) for reverse transcrip- tase-PCR (RT-PCR) and real-time quantitative PCR (qPCR) analysis. Real-time qPCR analysis were performed on a CFX96 Real-Time PCR Instrument (Bio-Rad) by using SYBR Green (CWBIO, CW0760A). Primers used for transcriptional analysis are listed in Dataset S4. ChIP-seq Data Analysis. ChIP was performed as described with minor modification (1). Briefly, 1 g of leaves of 7 d-after-germi- nation (DAG) seedlings grown under long day conditions were fixed with formaldehyde then immunoprecipitated with anti- H3K4me3 (Millipore; 07-473) and anti-H3 (Abcam; ab1791) antibodies. After decross-linking and proteinase K and RNase treatment, the immunoprecipitated DNA was purified by phe- nol/chloroform extraction for the additional experiments in- cluding Illumina single end sequencing or qPCR. ChIPed DNA was subjected to library preparation for sequencing on the Illu- mina GAII platform. In brief, Illumina single-end genome se- quencing adapters were ligated with ChIPed DNA and adapter- modified fragments of approximately 300 bp were gel purified and amplified by PCR before sequencing according to standard protocols (single-end 36 cycles). Raw single-end reads of 36 nt in length were aligned to TIGR 6.1 genome by using Bowtie al- lowing up to two mismatches (2). The MASC program was used to shift the reads and convert the data to WIG format (3). The Integrated Genome Browser was used to visualize the WIG file (4). The ChIPDiff program was used for quantitative comparison of H3K4me3 levels in wild type and jmj703 (5). Regions with a change of more than 1.5-fold were kept for downstream analysis. Reads with multiple genomic locations were also used to avoid improper deletion of reads from transposon regions. Finally, the gene list in Dataset S1 was manually checked to avoid false positives caused by the 1-Kb window size used in the ChIPDiff program. RNA-seq Data Analysis. Rice genome sequences and annotated gene models were downloaded from TIGR6.1 (http://rice.plantbiology. msu.edu). The single end reads were aligned to genome sequences by using TopHat, allowing up to two mismatches (6). Splice junction sequences required at least four bases on each side of the junction. Reads mapping to multiple locations and uniquely mapped reads were used and compared with each other to avoid the improper deletion of reads for subsequent analysis. Gene ex- pression levels were measured in reads per kilobase of exon model per million mapped reads (RPKM), which indicated that the total exons of a gene were detected when they met the criterion of more than 3 RPKM (7). Differentially expressed genes were identified by using DEGsEq. (8). Genes with more than a 1.5-fold change and P < 0.01 were regarded as differentially expressed. Primers used for qPCR analysis are listed in Dataset S4. GO Analysis. The Rice Oligonucleotide Array Database was used for GO enrichment analysis (9), which identified significantly enriched molecular functions and biological processes among the up-regulated genes in jmj703 mutants (P < 0.05). Data Deposition. The ChIP-seq and RNA-seq data have been deposited in the Gene Expression Omnibus (GEO) database (accession GSE41183). 1. Yin BL, et al. (2008) Integration of cytological features with molecular and epigenetic properties of rice chromosome 4. Mol Plant 1(5):816–829. 2. Langmead B, Trapnell C, Pop M, Salzberg SL (2009) Ultrafast and memory-efficient alignment of short DNA sequences to the human genome. Genome Biol 10(3):R25. 3. Zhang Y, et al. (2008) Model-based analysis of ChIP-Seq (MACS). Genome Biol 9(9):R137. 4. Nicol JW, Helt GA, Blanchard SG, Jr., Raja A, Loraine AE (2009) The Integrated Genome Browser: Free software for distribution and exploration of genome-scale datasets. Bioinformatics 25(20):2730–2731. 5. Xu H, Wei CL, Lin F, Sung WK (2008) An HMM approach to genome-wide identification of differential histone modification sites from ChIP-seq data. Bioinformatics 24(20): 2344–2349. 6. Trapnell C, Pachter L, Salzberg SL (2009) TopHat: Discovering splice junctions with RNA- Seq. Bioinformatics 25(9):1105–1111. 7. Mortazavi A, Williams BA, McCue K, Schaeffer L, Wold B (2008) Mapping and quantifying mammalian transcriptomes by RNA-Seq. Nat Methods 5(7):621–628. 8. Wang L, Feng Z, Wang X, Wang X, Zhang X (2010) DEGseq: An R package for identifying differentially expressed genes from RNA-seq data. Bioinformatics 26(1): 136–138. 9. Jung KH, et al. (2008) Refinement of light-responsive transcript lists using rice oligonucleotide arrays: evaluation of gene-redundancy. PLoS ONE 3(10):e3337. Cui et al. www.pnas.org/cgi/content/short/1217020110 1 of 9
Transcript of Supporting information - Proceedings of the National … information Cui et al....

Supporting informationCui et al. 10.1073/pnas.1217020110SI Materials and MethodsMolecular Cloning of JMJ703. To clone the full-length JMJ703cDNA, we amplified a 3,717-bp cDNA fragment from a reverse-transcribed cDNA pool derived from a rice japonica variety. ThePCR product was cloned into pENTR/D-TOPO (Invitrogen). AQuikChange Site-Directed Mutagenesis Kit (Stratagene) was usedto make a point mutation in the JMJ703 coding sequence to switchamino acid histidine 394 to alanine. The wild-type and mutantJMJ703 coding sequences were introduced into the pEarley-Gate101 vector. Primers used for cloning are listed in Dataset S4.
In Vivo Histone Demethylation Assays. Nuclei transfected withJMJ703-YFP-HA and JMJ703H394A-YFP-HA were visualizedby observing the YFP signal under a microscope. Immunolabelingwas conducted by using histone methylation-specific antibodies(H3K4me3: Millipore 07-473, 1:100; H3K4me2: Millipore 07-030,1:500; H3K4me1: Millipore 07-436, 1:100; H3K9me3: Millipore07-442, 1:100; H3K9me2: Millipore 07-441, 1:200; H3K9me1:Millipore 07-450, 1:100; H3K27me3: Millipore 07-449, 1:100;H3K27me2: Millipore 07-452, 1:100; H3K27me1: Millipore 07-448, 1:100; H3K36me3: Abcam ab9050, 1:100; H3K36me2: Mil-lipore 07-274, 1:100; H3K36me1: Millipore 07-548, 1:100). AlexaFluor 488-conjugated goat anti-rabbit (1:200, Invitrogen) was usedas secondary antibody to determine the specific lysine modificationsite in vivo. After staining, nuclei were mounted by dispensing onedrop of VECTASHIELDMounting Medium with 4′, 6-diamidino-2-phenylindole (DAPI) (Vector Laboratories) onto each slide,then photographed under a fluorescent microscope (OlympusBX51). At least 50 pairs of transfected nuclei versus nontrans-fected nuclei were observed under the same field of view to getconsistent results. ImageJ (National Institutes of Health) softwarewas used for quantification of the immunolabeled nuclei.
Transcriptional Level Analysis. Total RNA was extracted by usingTRIzol Reagent (15596–026; Invitrogen) for reverse transcrip-tase-PCR (RT-PCR) and real-time quantitative PCR (qPCR)analysis. Real-time qPCR analysis were performed on a CFX96Real-Time PCR Instrument (Bio-Rad) by using SYBR Green(CWBIO, CW0760A). Primers used for transcriptional analysisare listed in Dataset S4.
ChIP-seq Data Analysis. ChIP was performed as described withminor modification (1). Briefly, 1 g of leaves of 7 d-after-germi-nation (DAG) seedlings grown under long day conditions werefixed with formaldehyde then immunoprecipitated with anti-H3K4me3 (Millipore; 07-473) and anti-H3 (Abcam; ab1791)antibodies. After decross-linking and proteinase K and RNase
treatment, the immunoprecipitated DNA was purified by phe-nol/chloroform extraction for the additional experiments in-cluding Illumina single end sequencing or qPCR. ChIPed DNAwas subjected to library preparation for sequencing on the Illu-mina GAII platform. In brief, Illumina single-end genome se-quencing adapters were ligated with ChIPed DNA and adapter-modified fragments of approximately 300 bp were gel purifiedand amplified by PCR before sequencing according to standardprotocols (single-end 36 cycles). Raw single-end reads of 36 nt inlength were aligned to TIGR 6.1 genome by using Bowtie al-lowing up to two mismatches (2). The MASC program was usedto shift the reads and convert the data to WIG format (3). TheIntegrated Genome Browser was used to visualize the WIG file(4). The ChIPDiff program was used for quantitative comparisonof H3K4me3 levels in wild type and jmj703 (5). Regions witha change of more than 1.5-fold were kept for downstreamanalysis. Reads with multiple genomic locations were also usedto avoid improper deletion of reads from transposon regions.Finally, the gene list in Dataset S1 was manually checked toavoid false positives caused by the 1-Kb window size used in theChIPDiff program.
RNA-seq Data Analysis.Rice genome sequences and annotated genemodels were downloaded from TIGR6.1 (http://rice.plantbiology.msu.edu). The single end reads were aligned to genome sequencesby using TopHat, allowing up to two mismatches (6). Splicejunction sequences required at least four bases on each side of thejunction. Reads mapping to multiple locations and uniquelymapped reads were used and compared with each other to avoidthe improper deletion of reads for subsequent analysis. Gene ex-pression levels were measured in reads per kilobase of exon modelper million mapped reads (RPKM), which indicated that the totalexons of a gene were detected when they met the criterion of morethan 3 RPKM (7). Differentially expressed genes were identifiedby using DEGsEq. (8). Genes with more than a 1.5-fold changeand P < 0.01 were regarded as differentially expressed. Primersused for qPCR analysis are listed in Dataset S4.
GO Analysis. The Rice Oligonucleotide Array Database was usedfor GO enrichment analysis (9), which identified significantlyenriched molecular functions and biological processes among theup-regulated genes in jmj703 mutants (P < 0.05).
Data Deposition. The ChIP-seq and RNA-seq data have beendeposited in the Gene Expression Omnibus (GEO) database(accession GSE41183).
1. Yin BL, et al. (2008) Integration of cytological features with molecular and epigeneticproperties of rice chromosome 4. Mol Plant 1(5):816–829.
2. Langmead B, Trapnell C, Pop M, Salzberg SL (2009) Ultrafast and memory-efficientalignment of short DNA sequences to the human genome. Genome Biol 10(3):R25.
3. Zhang Y, et al. (2008) Model-based analysis of ChIP-Seq (MACS). Genome Biol 9(9):R137.4. Nicol JW, Helt GA, Blanchard SG, Jr., Raja A, Loraine AE (2009) The Integrated Genome
Browser: Free software for distribution and exploration of genome-scale datasets.Bioinformatics 25(20):2730–2731.
5. Xu H, Wei CL, Lin F, Sung WK (2008) An HMM approach to genome-wide identificationof differential histone modification sites from ChIP-seq data. Bioinformatics 24(20):2344–2349.
6. Trapnell C, Pachter L, Salzberg SL (2009) TopHat: Discovering splice junctions with RNA-Seq. Bioinformatics 25(9):1105–1111.
7. Mortazavi A, Williams BA, McCue K, Schaeffer L, Wold B (2008) Mapping andquantifying mammalian transcriptomes by RNA-Seq. Nat Methods 5(7):621–628.
8. Wang L, Feng Z, Wang X, Wang X, Zhang X (2010) DEGseq: An R package foridentifying differentially expressed genes from RNA-seq data. Bioinformatics 26(1):136–138.
9. Jung KH, et al. (2008) Refinement of light-responsive transcript lists using riceoligonucleotide arrays: evaluation of gene-redundancy. PLoS ONE 3(10):e3337.
Cui et al. www.pnas.org/cgi/content/short/1217020110 1 of 9

H3K9me1
H3K9me2
H3K9me3
H3K27me1
H3K27me2
H3K27me3
H3K36me1
H3K36me2
H3K36me3
DAPIJMJ703mu -YFP-HA
Methylated Histone
H3K4me1
H3K4me2
H3K4me3
JMJ703mu-YFP-HAWT
H3K4m
e3
H3K4m
e2
H3K4m
e1
1.5
1.0
0.5
0.0
JMJ703mu cDNA-pEarleyGate101
JMJ703 H394A 35S Promoter YFP HA
JmjN JmjC Zinc finger FYRN FYRC
DAPI JMJ703-YFP-HA
Methylated Histone
A B
Rel
ativ
e In
tens
ity
Fig. S1. JMJ703 has no effect on histone H3K9me3/2/1, H3K27me3/2/1, and H3K36me3/2/1. (A) YFP-HA–tagged JMJ703 was transiently overexpressed intobacco cells, and the nuclei were isolated for immunolabeling. (Left) Nuclei transfected with JMJ703-YFP-HA were visualized by YFP signal. (Center) Im-munofluorescence with methylation-specific histone antibodies was used to analyze the substrate specificity of JMJ703. (Right) DAPI staining indicates thelocation of nuclei in each field. Cells expressing JMJ703 are marked by arrows. (Scale bars: 2 μm.) (B) Overexpression of JMJ703mu-YFP-HA, in which theconserved iron-binding residue His394 is mutated to Ala, abolishes demethylation of H3K4me3/2/1 in vivo.
Cui et al. www.pnas.org/cgi/content/short/1217020110 2 of 9
Vector alone JMJ703RNAi -1
Exp
ress
ion
leve
l JMJ703
JMJ703RNAi -2
JMJ703RNAi -3
Vector alone JMJ703RNAi -1
JMJ703RNAi -2
JMJ703RNAi -3
C
D
100aa
JmjN JmjC Zinc finger FYRN FYRC
RNAi Region
1238aa Actin1 Promoter RNAi Region RNAi RegionSpacer
A B
0.0
0.2
0.4
0.6
0.8
1.0
1.2
1.40.0
0.2
0.4
0.6
0.8
1.0
1.2
Exp
ress
ion
Leve
JMJ703
JMJ703 (36 Cycles)
eEF1α (22 Cycles)
RT (-)
jmj703
WT
jmj703
WT
T-DNA
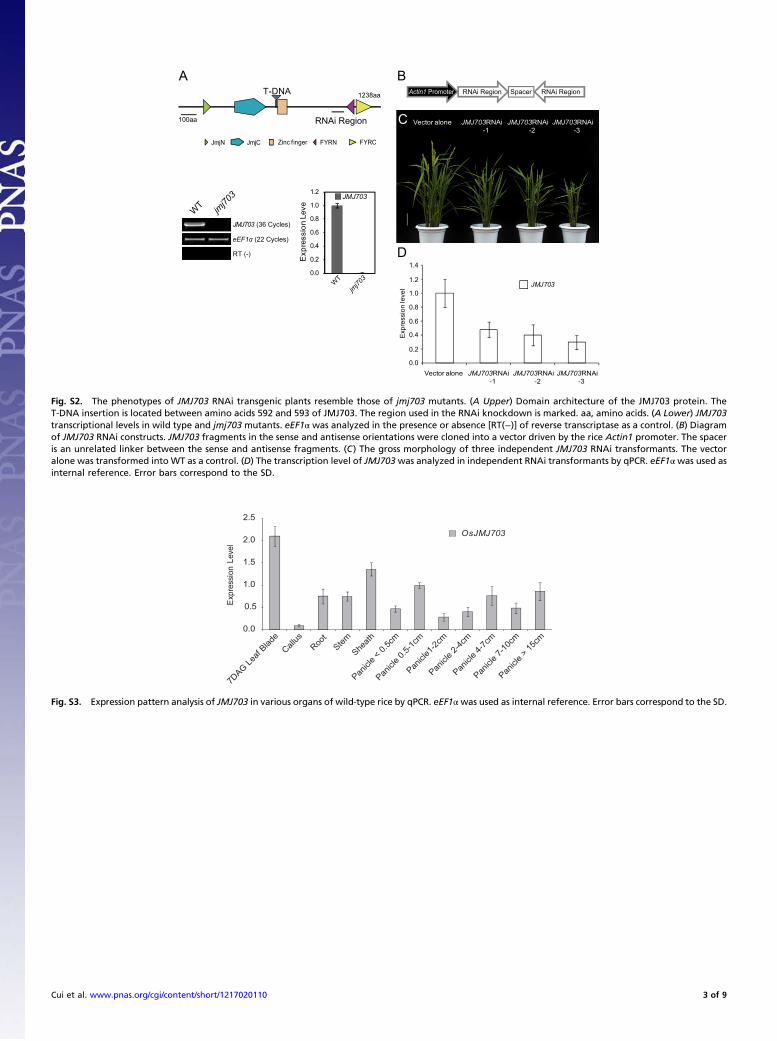
Fig. S2. The phenotypes of JMJ703 RNAi transgenic plants resemble those of jmj703 mutants. (A Upper) Domain architecture of the JMJ703 protein. TheT-DNA insertion is located between amino acids 592 and 593 of JMJ703. The region used in the RNAi knockdown is marked. aa, amino acids. (A Lower) JMJ703transcriptional levels in wild type and jmj703 mutants. eEF1α was analyzed in the presence or absence [RT(−)] of reverse transcriptase as a control. (B) Diagramof JMJ703 RNAi constructs. JMJ703 fragments in the sense and antisense orientations were cloned into a vector driven by the rice Actin1 promoter. The spaceris an unrelated linker between the sense and antisense fragments. (C) The gross morphology of three independent JMJ703 RNAi transformants. The vectoralone was transformed into WT as a control. (D) The transcription level of JMJ703was analyzed in independent RNAi transformants by qPCR. eEF1αwas used asinternal reference. Error bars correspond to the SD.
0.0
0.5
1.0
1.5
2.0
2.5
Expr
essi
on L
evel
OsJMJ703
7DAG Le
af Blad
eCall
usRoo
tStem
Sheath
Panicl
e < 0.
5cm
Panicl
e 0.5-
1cm
Panicl
e1-2c
m
Panicl
e 2-4c
m
Panicl
e 4-7c
m
Panicl
e 7-10
cm
Panicl
e > 15
cm
Fig. S3. Expression pattern analysis of JMJ703 in various organs of wild-type rice by qPCR. eEF1α was used as internal reference. Error bars correspond to the SD.
Cui et al. www.pnas.org/cgi/content/short/1217020110 3 of 9

H3K4me3 peaksin wild type
H3K4me3 peaks (He et al., 2010)
1608 12,814 6398
A
B
Transcription active in jmj703
H3K4me3hypermethylated in jmj703
1720 9 31
P = 2.06 x 10⁻⁶
C
(89%
WT
jmj703
+-
Os12g21940
R1
H
3K4m
e3Fo
ld E
nric
hmen
t
0.00.5
2.02.5
1.51.0
R1
WTjmj703
WTjmj703
Exp
ress
ion
Leve
l
0.0
2.0
4.0
6.0
Os12g21940
Anti-H3K4me3 ChIP-seq
Anti-H3K4me3 ChIP-seq
RNA-seq
RNA-seq
WT
jmj703
Os01g01350
R2 R1
+-
WT
jmj703
Anti-H3K4me3 ChIP-seq
Anti-H3K4me3 ChIP-seq
R1 R2
WTjmj703
WTjmj703
Exp
ress
ion
Leve
l
0.0
1.0
2.0
3.0
Os01g01350
H
3K4m
e3Fo
ld E
nric
hmen
t
0.0
2.0
3.0
1.0
RNA-seq
RNA-seq
WT
jmj703
R1 R2
WT
jmj703
WTjmj703
H
3K4m
e3Fo
ld E
nric
hmen
t
+-
Os01g01580
R2R1
Os01g01590
0.0
1.0
2.0
3.0Anti-H3K4me3 ChIP-seq
RNA-seq
Anti-H3K4me3 ChIP-seq
RNA-seq
WT
jmj703
WTjmj703
Exp
ress
ion
Leve
l
0.0
1.0
2.0
3.0
Os01g01580
CG CHG CHH CG CHG CHH
WTjmj703
WTjmj703
1020304050
0
1.0
2.0
3.0
4.0
0.0Met
hyla
tion
(%)
WT
jmj703
R2 R1
+-
Os02g52730
H
3K4m
e3Fo
ld E
nric
hmen
t
0.0
2.0
3.0
1.0
R1 R2
WTjmj703
WTjmj703
Exp
ress
ion
Leve
l
0.0
2.0
4.0
6.0
Os02g52730
Anti-H3K4me3 ChIP-seq
Anti-H3K4me3 ChIP-seq
RNA-seq
RNA-seq
WT
jmj703
CG CHG CHH
WTjmj703
20406080
0Met
hyla
tion
(%) 100
BS-1
WT
jmj703
+-
Os03g51600
R2R1
H
3K4m
e3Fo
ld E
nric
hmen
t
0.0
2.0
1.0
WTjmj703
R1 R2
3.0
4.0
WTjmj703
Exp
ress
ion
Leve
l
0.0
0.5
1.0
1.5
Os03g51600
Anti-H3K4me3 ChIP-seq
Anti-H3K4me3 ChIP-seq
RNA-seq
RNA-seq
WT
jmj703
CG CHG CHHCG CHG CHH
N.D
.20
40
60
0
2.0
4.0
6.0
0.0Met
hyla
tion
(%)
BS-1
WTjmj703
WTjmj703
WT
jmj703
+-
Os11g07980
R1R2
H
3K4m
e3Fo
ld E
nric
hmen
t
0.0
4.02.0
WTjmj703
6.0
10.0
R1 R2
8.0
WTjmj703
Exp
ress
ion
Leve
l
0.0
1.01.52.0
Os11g07980
0.5
Anti-H3K4me3 ChIP-seq
Anti-H3K4me3 ChIP-seq
RNA-seq
RNA-seq
WT
jmj703
0.5
0204060
0Met
hyla
tion
(%)
80100
1.0
2.0WTjmj703
WT jmj703
CG CHG CHHCG CHG CHH
N.D
.
BS-1 BS-2BS-1 BS-2 BS-1
BS-2
BS-1 BS-2
BS-1 BS-2
BS-1 BS-2
1.5
Fig. S4. ChIP-qPCR validation of several H3K4me3 hypermethylated genes in jmj703. (A) Diagram of overlap between H3K4me3 peaks from our ChIP-Seqdataset and He et al. (1). (B) ChIP- and RNA-seq data are shown in Left with the bisulfite sequencing data shown in Lower. CG, CHG, and CHH methylation wasanalyzed in WT and jmj703 mutants, respectively.“+” and “−” represent the sense and antisense DNA strands, respectively. ChIP-qPCR and qPCR validationdata are shown at Right. Anti-H3K4me3 ChIP was performed by using samples of the other biological replicate. Anti-H3 was used as an internal reference forChIP-qPCR. eEF1α was used as an internal reference for the qPCR assay. Error bars correspond to the SD. (C) Diagram of the significant overlap betweenup-regulated genes and H3K4me3 hypermethylated genes in jmj703 mutants.
1. He G, et al. (2010) Global epigenetic and transcriptional trends among two rice subspecies and their reciprocal hybrids. Plant Cell 22(1):17–33.
Cui et al. www.pnas.org/cgi/content/short/1217020110 4 of 9

Summary of High-throughput RNA Sequencing Analysis
jmj703
WT
OsJMJ703 (Os05g10770)
T-DNA
500 bp
ATG TGA
RNA-seq
RNA-seq
Library Total Reads(80nt)
Total match (%of total)a
Unique match (% of total
match)b
Multiple match (% of total match)c
Coverage of total genes
(RPKMd >3)e
WT 16,578,395 14,338,433 (86.5%)
8,456,043(51.0%)
5,882,390 (35.5%) 11,970
jmj703 14,319,280 12,021,958(84.0%)
7,335,815(51.2%)
4,686,143 (32.7%) 11,397
A
B
Fig. S5. Summary of high-throughput RNA sequencing analysis. (A) RNA-seq data showing that the T-DNA insertion disrupts transcription of JMJ703 in themutant. (B) Summary of RNA-seq analysis. a, number of reads that aligned to the rice genome; b, number of reads that aligned to a unique location of the TIGR6.1 reference genome; c, number of mapped reads which have more than one genomic location; d, RPKM represents reads per kilobase per million mappedreads; e, total number of genes covered by the unique reads (>3 RPKM).
fatty acid biosynthetic processstarch metabolic process
putrescine biosynthetic processripening
steroid biosynthetic processprotein folding
phenylpropanoid metabolic processcellulose biosynthetic process
apoptosissucrose metabolic process
cell adhesionmaltose metabolic process
N-terminal protein myristoylationorgan morphogenesis
silicate transportcarotene catabolic process
mannose biosynthetic processsphingolipid biosynthetic process
meristematic phase transitionglucan biosynthetic process
metal ion transportdrug transmembrane transport
malate metabolic processresponse to stimulus
auxin mediated signaling pathwaycarboxylic acid metabolic process
regulation of transcriptionphotosynthesis
f lavonoid biosynthetic processoxidation reduction
proteolysisRNA-dependent DNA replication
DNA integrationchromatin assembly or disassembly
0 2 4 6 8
-Log10(p-value)
coenzyme bindingN-acetyltransferase activity
catechol oxidase activityoxygen-dependent protoporphyrinogen oxidase activity
thiopurine S-methyltransferase activitymonodehydroascorbate reductase (NADH) activityf ructose 1,6-bisphosphate 1-phosphatase activity
cellulose synthase (UDP-forming) activityadenosine deaminase activity
glycogen (starch) synthase activityglycylpeptide N-tetradecanoyltransferase activity
phosphomannomutase activitythymidine kinase activity
silicate transmembrane transporter activityNDP-glucose-starch glucosyltransferase activity
9-cis-epoxycarotenoid dioxygenase activitybeta-amylase activity
antiporter activityATP binding
structural constituent of cell wallhydrolase activity
transcription regulator activitydrug transmembrane transporter activity
calmodulin bindingFAD or FADH2 binding
sucrose-phosphate synthase activitysignal transducer activity
electron carrier activityoxidoreductase activity
metal ion bindingribonuclease H activity
RNA-directed DNA polymerase activityRNA bindingDNA binding
0 2 4 6 8
-Log10(p-value)A BMolecular Function Biological Process
Fig. S6. Significantly enriched molecular functions (A) and biological processes (B) identified by Gene Ontology (GO) analysis of the up-regulated genes injmj703 mutants (P < 0.05).
Cui et al. www.pnas.org/cgi/content/short/1217020110 5 of 9

1 2 3
Progeny siblings
WTWT M1 M2
-4.0Kb
-3.0Kb
-5.0Kb
-2.0Kb
-6.1Kb
-1.6Kb
-9.5Kb6.4Kb6.2Kb
-3.0Kb
-1.0Kb
Karma
ORF1
Karma
ORF2
Tubulin
1 2 3
Fig. S7. Retrotranspositions inheritance of Karma. Genomic DNA isolated from WT or mutant plants (M1 and M2) and their respective self-pollinatedprogenies were digested with EcoRV and subsequently probed with Karma ORF1 (Top), ORF2 (Middle), and Tubulin8 (Bottom). Red arrowhead denotes theposition of de novo transposed Karma in the progeny.
Cui et al. www.pnas.org/cgi/content/short/1217020110 6 of 9

PstI
1KbChIP-qPCR
qPCR 2 1
PstI PstI
50Kb 50Kb
13,000,000 13,050,000 13,100,000 13,150,000 13,200,000 13,250,000
1MbChromosome 5B
LINE1WT
jmj703
jmj703
WT
jmj703
Anti-H3K4me3 ChIP-seq
RNA-seqWT
Anti-H3K4me3 ChIP-seq
RNA-seq
13,137,000 13,140,000
C D E
A
(213) (1800) (5416) (5588)
(820)(171) (5802) (9418) (9510)
1Kb
ORF1 ORF2
ORF1 ORF2
PstI PstI
PstI PstI
PstI PstI
PstI PstI
PstI
Probe2
4.98Kb1.58Kb
LINE1
Karma
Probe1
0
2
4
6
8
10 WTjmj703
ORF1 ORF2
Exp
ress
ion
Leve
l
R1R2R3R4
0.0
1.0
2.0
3.0
4.0 WTjmj703
H3K
4me3
Fol
d E
nric
hmen
t
CK R1 R2 R3 R4
** * * * * * * * **WT jmj703
Tubulin -7.1Kb-9.1Kb
LINE1ORF1
�
�**
*
**
***
*
**
* ** ***
***
*
-
-4.0Kb
-3.0Kb
-
-2.0Kb
-7.1Kb
1.6Kb
-1.0Kb
5.0Kb
**
****
***
*
**
* ** ***
***
-
-4.0Kb
-3.0Kb
-
-2.0Kb
-7.1Kb
1.6Kb
5.0Kb
Karma ORF1
*
-1.0Kb
ORF2 ORF1
Fig. S8. JMJ703 directly associates with LINE1. (A) Schematic representation and alignment of Karma and its 5′ truncated form LINE1. Vertical lines above theORFs show the sites of PstI cleavage. Probe 1 and probe 2 under the ORFs are marked with blue lines. (B) H3K4me3 status of the genomic regions 50 Kbupstream and downstream of LINE1. (C) Structure of LINE1. The regions for ChIP-qPCR assay (regions 1–4) and qPCR analysis (regions 1 and 2) are shown. Lowershows anti-H3K4me3 ChIP-seq and RNA-seq data for the LINE1 locus in WT and jmj703 mutants. (D) qPCR validation of ChIP- and RNA-seq for LINE1. (E)Retrotransposition analysis of Karma and LINE1. A blot of PstI-digested genomic DNA from WT or mutant was first probed with LINE (probe 2) then reprobedwith Karma (probe 1). Top and Middle show the retrotransposition analysis of LINE1 and Karma, respectively. Tubulin4 was used as a control for completedigestion of DNA by PstI. Black asterisks on top of the image represent independent individuals. Red asterisks denote the positions of newly transposed LINE1or Karma elements. In Top, PstI fragments derived from the original Karma and LINE1 elements are indicated by the upper and lower arrowheads, respectively.DNA ladders are shown on the right.
Cui et al. www.pnas.org/cgi/content/short/1217020110 7 of 9

50Kb 50Kb
WT
jmj703
15,200,000 15,250,000 15,300,000 15,350,000 15,400,000 15,450,000
B F1Kb
ORF
XbaI
ChIP-qPCRqPCR
Probe
0.0
0.5
1.0
1.5
2.0 WT jmj703
0.0
2.0
4.0
5.0
6.0
7.0 WT jmj703
Tos17A
WT
jmj703
Anti-H3K4me3 ChIP-seq
RNA-seq
Anti-H3K4me3 ChIP-seq
RNA-seq
15,350,00015,346,000
WT
jmj703
1MbA Chromosome 10
Tos17A
C
Tos17
Tubulin
*
Tos17
Tubulin
WT jmj7
03
* * * * * * * * *
*WT jm
j703
* * * * * * * * *
Callus
Seedling
9.1Kb
6.6Kb
- 4.0Kb
- 3.0Kb
- 6.1Kb
- 9.1Kb
-
6.6Kb
- 4.0Kb
- 3.0Kb
- 6.1Kb
-
-
D
Bisulfite-seq
H3K
4me3
Fol
d E
nric
hmen
tE
xpre
ssio
n Le
vel
E
CpG CHG CHH
WTjmj703
Met
hyla
tion
(%)
20
0
40
60
80
100
1 5 10 15 20 25 30 35 40 45 50 55 60 65 70 75
1 5 10 15 20 25 30 35 40 45 50 55 60 65 70 75
02040 60 80
100
CpG CHG CHHWT
jmj703
Met
hyla
tion
(%)
02040 60 80
100
Met
hyla
tion
(%)
R1 R2 R3
CK R1 R2 R3
1.0
3.0
Fig. S9. JMJ703 loss-of-function has no effects on Tos17 retrotransposon. (A) H3K4me3 status for the indicated upstream (50 Kb) and downstream (50 Kb)regions of Tos17A. (B) Structure of Tos17A. The vertical line above the ORF shows the site of XbaI cleavage. The regions for ChIP-qPCR assay (regions 1–3), qPCRanalysis, and DNA gel hybridization probes (blue line) are shown. B Lower shows anti-H3K4me3 ChIP-seq and RNA-seq data for the Tos17A. (C) qPCR validationof ChIP- and RNA-seq for Tos17A. Anti-H3 was used as an internal reference for ChIP-qPCR. Os04g22450, a gene with depleted H3K4me3 in a heterochromaticregion of chromosome 4, was used as a negative control (1). eEF1α was used as an internal reference for the qPCR assay. Error bars correspond to the SD. (D)DNA-methylation profile of the genomic region containing Tos17A (a 400-bp region as shown in B). The cytosine methylation status in WT and mutants areshown. The numbers on the x axis indicate the positions of cytosines, and the y axis indicates the methylation level. (E) The percentage of methylated cytosinein CpG, CHG, and CHH contexts in WT and mutant. (F) Retrotransposition analysis of Tos17 in cultivated calli and seedling leaves, respectively, from WT andjmj703 mutants. Tubulin4 was used as a control for complete digestion of DNA by XbaI. Black asterisks on top of the image represent independent individuals.DNA ladders are shown on the right.
1. Yin BL, et al. (2008) Integration of cytological features with molecular and epigenetic properties of rice chromosome 4. Mol Plant 1(5):816–829.
Cui et al. www.pnas.org/cgi/content/short/1217020110 8 of 9

T1 T2
Karma ORF1
Karma ORF2
Tubulin
-4.0Kb
-3.0Kb
-5.0Kb
-2.0Kb
-6.1Kb-7.1Kb-9.1Kb
-3.0Kb
-1.6Kb
-1.0Kb
-9.5Kb
6.4Kb6.2Kb
T1 T2
Tos17
Tubulin
-12.2Kb
-4.0Kb
-3.0Kb
-5.0Kb
-2.0Kb
-6.1Kb-7.1Kb-8.1Kb-9.1Kb
-6.6Kb
* * *
* *
A B
Contro
l
Contro
l
Fig. S10. Knock-down of SDG714 in rice activates retrotransposition of Tos17 but not Karma. (A) Retrotransposition analysis of Tos17 in SDG714IR trans-formants. Genomic DNA isolated from control plants (Nipponbare) or SDG714IR transformants [SDG714IR22(1-2) and SDG714IR22(3-3)] from generations T1 orT2 was digested with XbaI and subsequently probed with Tos17 (Upper) and Tubulin8 (Lower). Red asterisks denote the positions of newly transposed Tos17.(B) Retrotransposition analysis of Karma in SDG714IR transformants. The same genomic DNA was digested with EcoRV and hybridized with probes from KarmaORF1 and ORF2.
Other Supporting Information Files
Dataset S1Dataset S2Dataset S3Dataset S4
Cui et al. www.pnas.org/cgi/content/short/1217020110 9 of 9