Supporting Information Photocleavable DNA … Goat anti-Human IgG (Invitrogen) was used as the...
15
S1 Supporting Information Photocleavable DNA barcode-antibody conjugates allow sensitive and multiplexed protein analysis in single cells Sarit S. Agasti, †, § Monty Liong, †, § Vanessa M. Peterson, † Hakho Lee † and Ralph Weissleder †, ‡, * † Center for Systems Biology, Massachusetts General Hospital/Harvard Medical School, 185 Cambridge St, CPZN 5206, Boston, MA 02114 ‡ Department of Systems Biology, Harvard Medical School, 200 Longwood Ave, Boston, MA 02115 *e-mail: [email protected] § These authors contributed equally to this work. General Unless otherwise stated, all chemicals and solvents were purchased from commercial suppliers and used as received. 4-[4-(1-Hydroxyethyl)-2-methoxy-5-nitrophenoxy]butyric acid (1) and the other chemicals used for the synthesis of photocleavable bifunctional linker 3 (see Scheme S1) were purchased from Sigma-Aldrich. Bovine serum albumin (BSA), ethylene diaminetetraacetic acid (EDTA), sulfosuccinimidyl 4-(N-maleimidomethyl)cyclohexane-1-carboxylate (sulfo- SMCC), dithiothreitol (DTT), Zeba spin desalting column (7000 MWCO) were purchased from Thermo Fisher Scientific. Dulbecco's Phosphate-Buffered Saline (PBS, pH7.4) without calcium and magnesium, Novex 10% TBE (tris-borate-EDTA) polyacrylamide gel were purchased from life technologies. Molecular biology grade 10×TBE Buffer was purchased from Promega. Dulbecco’s Modified Eagle Medium (DMEM) and Trypsin/EDTA were purchased from
Transcript of Supporting Information Photocleavable DNA … Goat anti-Human IgG (Invitrogen) was used as the...

S1
Supporting Information
Photocleavable DNA barcode-antibody conjugates allow sensitive and multiplexed protein
analysis in single cells
Sarit S. Agasti,†, §
Monty Liong,†, §
Vanessa M. Peterson,† Hakho Lee
† and Ralph Weissleder
†, ‡, *
†Center for Systems Biology, Massachusetts General Hospital/Harvard Medical School, 185
Cambridge St, CPZN 5206, Boston, MA 02114
‡Department of Systems Biology, Harvard Medical School, 200 Longwood Ave, Boston, MA
02115
*e-mail: [email protected]
§These authors contributed equally to this work.
General
Unless otherwise stated, all chemicals and solvents were purchased from commercial suppliers
and used as received. 4-[4-(1-Hydroxyethyl)-2-methoxy-5-nitrophenoxy]butyric acid (1) and the
other chemicals used for the synthesis of photocleavable bifunctional linker 3 (see Scheme S1)
were purchased from Sigma-Aldrich. Bovine serum albumin (BSA), ethylene diaminetetraacetic
acid (EDTA), sulfosuccinimidyl 4-(N-maleimidomethyl)cyclohexane-1-carboxylate (sulfo-
SMCC), dithiothreitol (DTT), Zeba spin desalting column (7000 MWCO) were purchased from
Thermo Fisher Scientific. Dulbecco's Phosphate-Buffered Saline (PBS, pH7.4) without calcium
and magnesium, Novex 10% TBE (tris-borate-EDTA) polyacrylamide gel were purchased from
life technologies. Molecular biology grade 10×TBE Buffer was purchased from Promega.
Dulbecco’s Modified Eagle Medium (DMEM) and Trypsin/EDTA were purchased from
S2
Mediatech. Fetal bovine serum (FBS) was purchased from ISC BioExpress. The antibodies used
in the experiments were the followings: anti-HER2 antibodies (Trastuzumab; Genentech) for
HER2/neu markers, anti-EpCAM (Human EpCAM/TROP1 monoclonal antibody, Mouse IgG
2a/b; R&D Systems) for epithelial cell adhesion molecule (EpCAM) markers, anti-EGFR
(Cetuximab; ImClone Systems) for epidermal growth factor receptor (EGFR) markers. The
barcode DNA oligos and the fluorescent labelled DNA oligos were purchased from Integrated
DNA Technologies, Inc. 1H NMR spectra were recorded on a Varian 400 MHz spectrometer.
Purity of the compounds was tested using high performance liquid chromatography–mass
spectrometry (HPLC-MS), where HPLC-MS analysis was performed on a Waters (Milford, MA)
LC-MS system. In the LC-MS system, electrospray ionization (ESI) was used to obtain mass
spectrometry. A Waters XTerra C18 5 µm column was used for HPLC-MS analysis (eluents:
0.1% trifluoroacetic acid (v/v) in water and acetonitrile). UV-Vis spectra were recorded in a
TECAN microplate reader. A 6W hand held UV lamp (UVP, LLC) was used as the ~365 nm
light source for the photocleavage reaction.
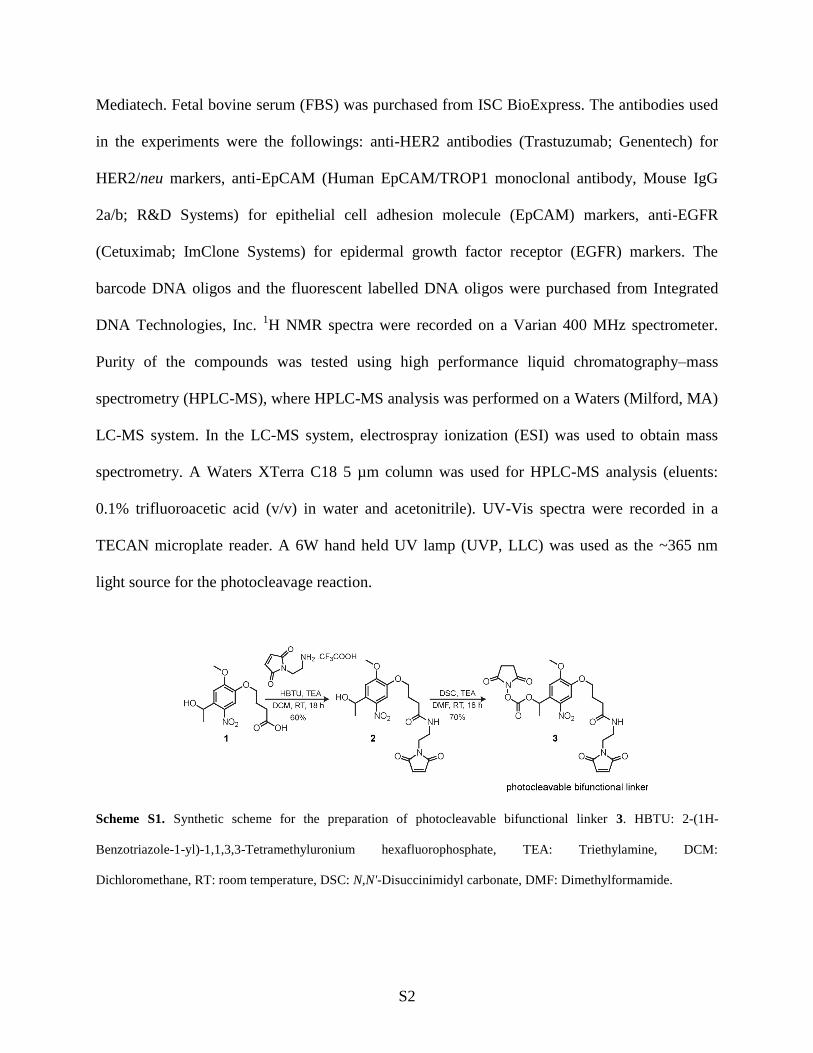
Scheme S1. Synthetic scheme for the preparation of photocleavable bifunctional linker 3. HBTU: 2-(1H-
Benzotriazole-1-yl)-1,1,3,3-Tetramethyluronium hexafluorophosphate, TEA: Triethylamine, DCM:
Dichloromethane, RT: room temperature, DSC: N,N'-Disuccinimidyl carbonate, DMF: Dimethylformamide.
S3
Methods
Synthesis of Compound 2. Compound 1 (0.100 g, 0.334 mmol) was dispersed in dry DCM (5
ml) in a round bottom flask under argon atmosphere. The flask was cooled to 0oC by placing it
on ice bath. HBTU (0.139 g, 0.368 mmol) and TEA (109 µl, 0.835 mmol) were added to the
solution. The reaction mixture was stirred at 0oC for 5 min and subsequently N-(2-
aminoethyl)maleimide trifluoroacetate salt (0.093 mg, 0.368 mmol) was added. After stirring at
0oC for 15 min, the reaction mixture was allowed to rise at room temperature and further stirred
for 18 h. After dilution of the reaction mixture with DCM (45 ml), the organic phase was washed
with water (2x), sat. NaCl solution (1x) and dried over sodium sulfate. The organic layer was
concentrated under reduced pressure and charged to SiO2 column (eluent: 100% DCM to 3%
methanol in DCM, v/v) for purification. Yield = 60%. 1H NMR (400 MHz, CD3OD): 7.58 (s,
1H), 7.37 (s, 1H), 6.77 (s, 2H), 5.44 (q, 4J = 6 Hz, 1H), 4.03 (t,
3J = 6.4 Hz, 2H), 3.94 (s, 3H),
3.61 (t, 3J = 5.6 Hz, 2H), 3.35 (t, 2H, overlapping with the solvent residual peak), 2.32 (t,
3J =
7.2 Hz, 2H), 2.05 (m, 3H), 1.46 (d, 2J = 6.4 Hz, 3H). MS (electrospray ionization mass
spectrometry: ESI-MS) calculated: 421.15, found: 466.18 [M+HCOO]−.
Synthesis of photocleavable bifunctional linker 3. Compound 2 (0.010 g, 0.024 mmol) was
dissolved in anhydrous DMF (1 ml). DSC (0.018 mg, 0.071 mmol) and TEA (12.5 µl, 0.096
mmol) were successively added to the solution. The reaction mixture was stirred at RT for 18 h.
The reaction mixture was directly loaded onto a C18 reverse phase column for purification
(eluent: 5% acetonitrile in water to 95% acetonitrile in water, v/v). Yield = 70%. 1H NMR (400
MHz, CDCl3): 7.63 (s, 1H), 7.05 (s, 1H), 6.67 (s, 2H), 6.48 (q, 4J = 6.4 Hz, 1H), 6.03 (br, 1H),
4.08 (t, 3J = 5.8 Hz, 2H), 4.02 (s, 3H), 3.68 (m, 2H), 3.45 (m, 2H), 2.79 (s, 4H), 2.36 (t,
3J = 7 Hz,

S4
2H), 2.15 (m, 3H), 1.75 (d, 2J = 6.4 Hz, 3H). MS (electrospray ionization mass spectrometry:
ESI-MS) calculated: 562.15, found: 607.22 [M+HCOO]−.
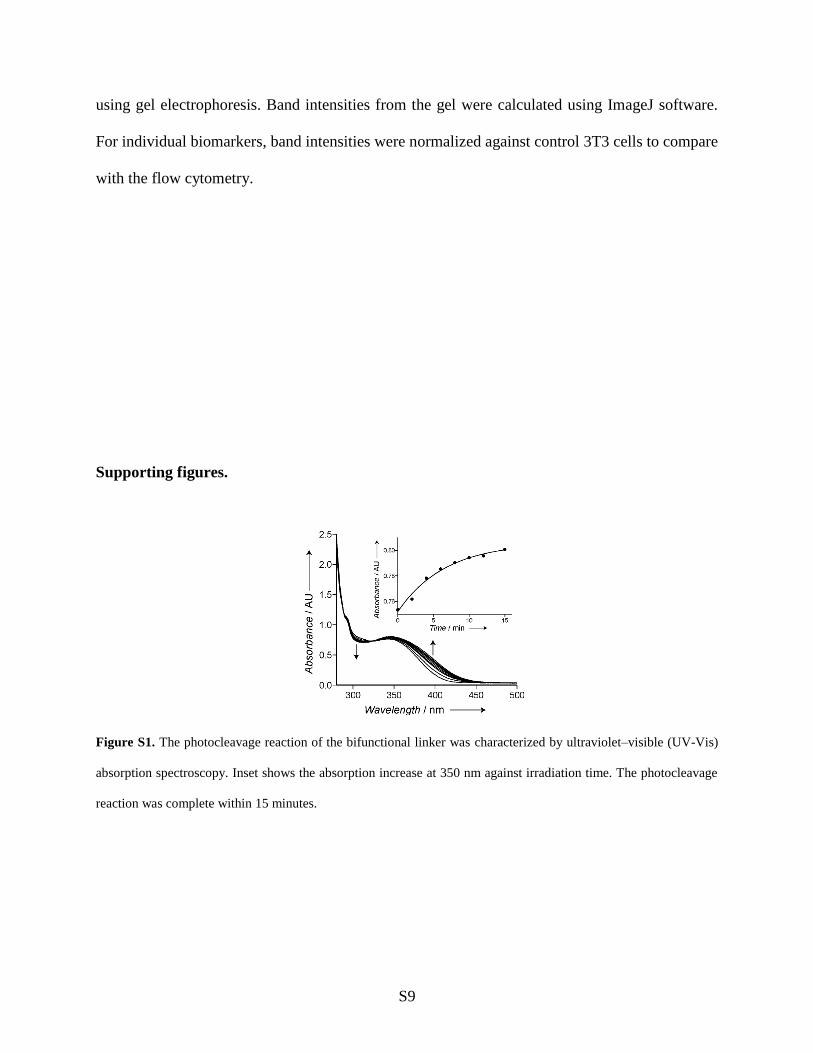
UV-Vis characterization of the photocleavage reaction of bifunctional linker 3. A 0.25 mM
solution of photocleavable bifunctional linker 3 in 1:1 (v/v) water:acetonitrile was used for the
UV-Vis spectroscopic characterization of the photocleavage reaction. 200 µl solution of 3 was
placed in a 96 well black clear bottom microplate and then the solution was irradiated at ~365
nm using a hand held UV lamp. After light exposure, UV-Vis spectra of the solution were
recorded in a TECAN microplate reader. Time course of the photocleavage reaction was
monitored by exposing the solution to ~365 nm light for different durations, and subsequently
recording the UV-Vis spectra of the solution. Prism 5 (GraphPad, La Jolla, CA) for Mac was
used to plot the data. As shown in Figure S1, irradiation with long wavelength UV light (~365
nm) led to an increase in absorbance at ~350-425 nm, as well as to a decrease in absorbance at
~320 nm; this has previously been shown to be characteristic of photolytic cleavage of the ONB
group.1
General procedure for conjugation of the DNA barcodes to the antibodies using
photocleavable bifunctional linker 3. Antibodies (0.25 mg) purchased from the commercial
sources were initially purified using a Zeba spin column (eluent: PBS). Antibodies were mixed
with 0.047 mg of photocleavable bifunctional linker 3 in 0.250 ml of PBS containing 5% DMF
(v/v) at RT for 1.5 h. Afterwards, excess reagents were removed from maleimide-activated
antibodies using Zeba spin column (eluent: PBS).
Thiol-modified DNA barcodes (20 nmol) were reduced using dithiothreitol (DTT, 1.23
mg) in 0.1 ml PBS (1mM EDTA, pH 8.0) for 2 h at RT. The reduced DNA barcodes were
purified using NAP-5 column (GE Healthcare), where deionized water was used as the eluent
S5
solution.
The maleimide-activated antibodies were mixed with the reduced form of their respective
barcode DNA barcodes in 1 ml PBS solution. The reaction was allowed to proceed for 12 h at
4℃. DNA barcode-antibody conjugates were initially purified using Zeba spin column with PBS
as the eluent buffer and then again purified and concentrated using Millipore 100,000 MWCO
centrifugal filter. Successful DNA barcode conjugation to the antibodies was verified using UV-
Vis spectroscopy.
General procedure for cell culture. Human cancer cells (SK-BR-3 and A431) and 3T3
fibroblasts were cultured in Dulbecco's Modified Eagle Medium (DMEM), supplemented with
fetal bovine serum (FBS; 10%), penicillin and streptomycin (1%), and L-glutamine (1%).
UWB1.289 cells were grown in 50% RPMI-1640 and 50% MEGM (made of MEBM basal
medium and SingleQuot additives) medium, supplemented with 3% FBS. MDA-MB-231 cells
were cultured in RPMI medium, supplemented with fetal bovine serum (FBS; 10%), penicillin
and streptomycin (1%), and L-glutamine (1%). Cell lines were maintained at 37oC in a
humidified atmosphere containing 5% CO2. Before experiments, cells were washed with PBS,
trypsinized and resuspended in PBS solution containing 2% FBS and 1% BSA.
Characterization of the binding efficiency of barcode-modified antibodies using secondary
antibody staining method. 250,000 cells (SK-BR-3, A431, UWB1.289 and 3T3) were
incubated with barcode-modified antibodies (10 µg/ml) in 400 µl PBS solution containing 2%
FBS and 1% BSA for 20 min. Following centrifugation (at 300 g, 3 min) and aspiration of the
antibody solution, cells were washed once with PBS solution containing 2% FBS and 1% BSA
and twice with PBS. Cells were then incubated with fluorescently labeled secondary antibodies
(10 µg/ml) in 400 µl PBS solution containing 2% FBS and 1% BSA for 20 min. FITC-labeled
S6
Goat anti-Human IgG (Invitrogen) was used as the secondary antibody for both HER2/neu and
EGFR. FITC-labeled Rat anti-Mouse IgG 2a/b (BD Biosciences) was used as the secondary
antibody for EpCAM. Following centrifugation (at 300 g, 3 min) and aspiration of the
secondary antibody solution, cells were washed once with PBS solution containing 2% FBS and
1% BSA and twice with PBS. Cells were finally suspended in PBS for flow cytometry analysis.
Experimental procedure to demonstrate barcode release upon light irradiation in intact
cells. SK-BR-3 and MDA-MB-231 cells (500,000 cells/experiment) were incubated with FAM
dye labeled DNA barcode conjugated anti-HER2 antibody (10 µg/ml) in 400 µl PBS solution
containing 2% FBS and 1% BSA for 20 min. Following centrifugation (at 300 g, 3 min) and
aspiration of the antibody solution, cells were washed once with PBS solution containing 2%
FBS and 1% BSA and twice with PBS.
For kinetic measurements SK-BR-3 cells suspended in PBS were divided into multiple
Eppendorf tubes. Tubes were exposed to ~365 nm light for different durations. Released
barcodes in the solution were separated from the cells after centrifugation (at 300 g, 3 min).
Flow cytometry analysis was performed to quantify the fluorescent signal from the cells.
Fluorescent microscopy images of the cells before and after photocleavage were acquired using a
DeltaVision microscope. For control experiment, anti-HER2 antibody conjugated with FAM dye
labeled DNA barcode through a non photocleavable sulfosuccinimidyl-4-(N-maleimidomethyl)
cyclohexane-1-carboxylate (Sulfo-SMCC) linker was used. The experimental procedure for cell
labeling and photocleavage was same as before.
General procedure for light-mediated cellular barcoding (LCMB) based protein detection.
250,000 cells were incubated with DNA barcode-conjugated antibodies (10 µg/ml) in 400 µl
PBS solution containing 2% FBS and 1% BSA for 20 min. Following centrifugation (at 300 g,

S7
3 min) and aspiration of the antibody solution, cells were washed once with PBS solution
containing 2% FBS and 1% BSA and twice with PBS. Finally, cells were suspended in PBS
solution containing 0.1% BSA. Eppendorf tubes containing different number of cells were
prepared by serial dilution method. Cells suspended in 100 µl PBS solution were exposed to
~365 nm light for 15 min. After centrifugation (at 300 g, 3 min), released barcodes in the
solution were separated from the cells. 25 µl of the barcode solution was diluted to 250 µl using
PCR grade water. We used 5 µl of this solution for PCR amplification. PCR amplification was
performed in a final volume of 50 µl using FastStart Taq DNA Polymerase (Roche Applied
Science). Primers used for the amplification process were: P1: 5'-GGCAGGAAGACAAACA-3'
and P2: 5'-ACAGCACCACAGACCA-3'. Initial activation of FastStart Taq DNA Polymerase
was performed at 94°C for 10 min. Amplification was performed using the following thermal
cycling conditions: 94°C for 10 s, 54°C for 15 s and 72°C for 35 s. SYBR green based
quantitative PCR was performed on a Applied Biosystems 7500 Real-Time PCR System using
FastStart Universal SYBR Green Master (Roche Applied Science). Relative (to the control 3T3
cells) expression levels were calculated from the threshold cycle (Ct) values. In Figure 2c of
qLMCB, we have compared Her2/neu expression in SK-BR-3 cells with Her2/neu expression in
3T3 cells. Her2/neu expression in SK-BR-3 cells relative to the 3T3 cells is plotted in the Figure
2c. Similarly, in Figure 2d of qLMCB, EGFR expression level in A431 cells relative to the 3T3
cells is plotted.
Analysis of single cell using LMCB method in digital format. SK-BR-3 and MDA-MB-231
cells (250,000 cells) were incubated with 85-base DNA barcode-conjugated anti-HER2
(85bDNA-HER2) antibody (10 µg/ml) in 400 µl PBS solution containing 2% FBS and 1% BSA
for 20 min. Following centrifugation (at 300 g, 3 min) and aspiration of the antibody solution,

S8
cells were washed once with PBS solution containing 2% FBS and 1% BSA and twice with PBS.
Cells were then suspended in PBS solution containing 0.1% BSA. From this cell suspension, a
50 cells/ml solution was prepared by dilution. One ml (containing ~50 cells) of the diluted cell
suspension was distributed among many wells (>50 wells) of a 384 well microplate. Wells were
imaged to find single cell containing wells. Wells were irradiated with light for 15 min. Released
barcodes were diluted 5 times with water before 25 cycles of PCR amplification. PCR products
were analyzed in gel electrophoresis.
General procedure for gel electrophoresis analysis of the PCR product. 10 µl of the PCR
product was mixed with 2 µl of the loading dye (New England Biolabs). 5 µl from this mixture
was loaded onto a Novex 10% TBE polyacrylamide gel (1.0 mm, 12 well, life technologies). 2 µl
DNA ladder (20 bp, Takara) was also loaded onto the gel to identify bands from different DNA
barcodes based on their molecular weight. Gel electrophoresis was performed at 200V for 30-40
min. 1× TBE buffer was used as running buffer. Afterwards, 3× GelRedTM
(Biotium) solution in
1× TBE buffer was used to stain the gel for ~30 min. Alphaimager 2200 gel doc (Alpha
Innotech) system was used to acquire the UV illuminated gel images. Images were processed
using ImageJ software.
Multiplexed detection of bimarkers from cancer cells using LMCB method. 200,000 cells
(SK-BR-3, A431, UWB1.289 and 3T3) were incubated with a cocktail of DNA barcode-
conjugated antibodies (concentration of each antibody 10 µg/ml) for respective target binding.
Barcodes were isolated using the procedure as described before. PCR amplification was done in
a final volume of 50 µl using High Fidelity PCR Polymerase-Advantage HF 2 PCR Kit
(Clontech). Amplification was performed using the following condition: 94℃ for 1 min then
thermal cycling conditions: 94°C for 20 s and 68°C for 3 min 20 s. PCR products were analyzed
S9
using gel electrophoresis. Band intensities from the gel were calculated using ImageJ software.
For individual biomarkers, band intensities were normalized against control 3T3 cells to compare
with the flow cytometry.
Supporting figures.
Figure S1. The photocleavage reaction of the bifunctional linker was characterized by ultraviolet–visible (UV-Vis)
absorption spectroscopy. Inset shows the absorption increase at 350 nm against irradiation time. The photocleavage
reaction was complete within 15 minutes.
S10
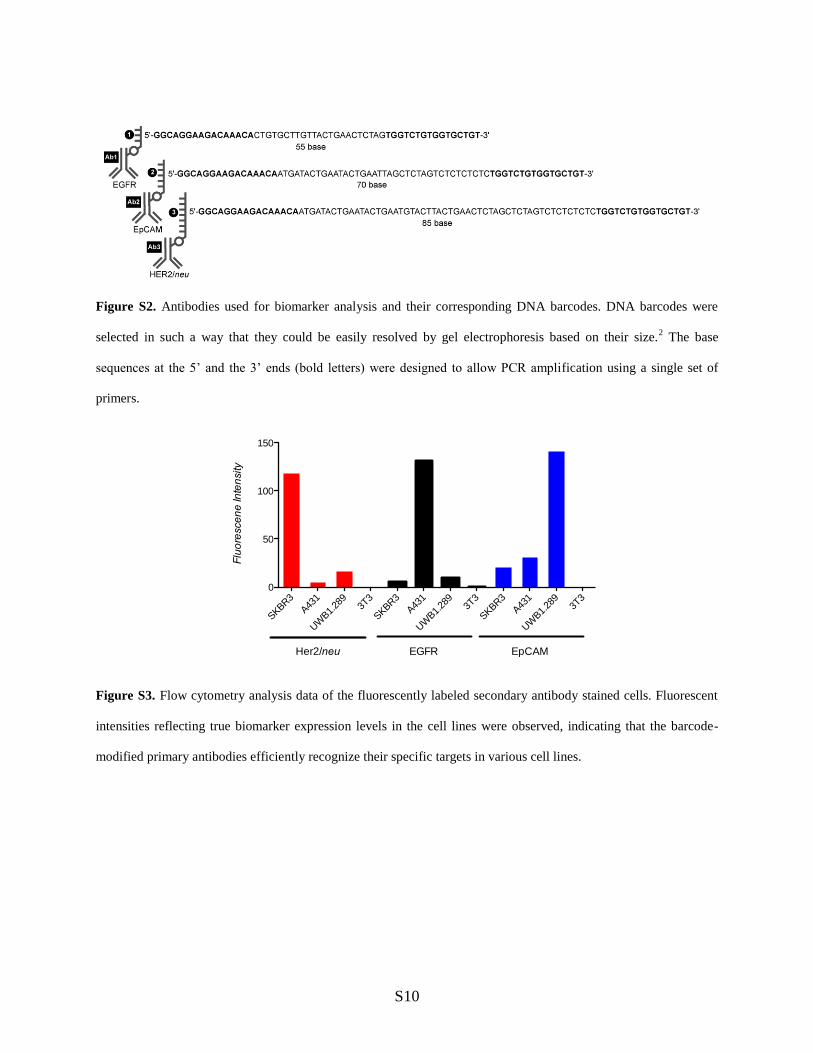
Figure S2. Antibodies used for biomarker analysis and their corresponding DNA barcodes. DNA barcodes were
selected in such a way that they could be easily resolved by gel electrophoresis based on their size.2 The base
sequences at the 5’ and the 3’ ends (bold letters) were designed to allow PCR amplification using a single set of
primers.
Figure S3. Flow cytometry analysis data of the fluorescently labeled secondary antibody stained cells. Fluorescent
intensities reflecting true biomarker expression levels in the cell lines were observed, indicating that the barcode-
modified primary antibodies efficiently recognize their specific targets in various cell lines.
SKBR3
A431
UW
B1.28
93T
3
SKBR3
A431
UW
B1.28
93T
3
SKBR3
A431
UW
B1.28
93T
30
50
100
150
Her2/neu EGFR EpCAM
Flu
ore
sce
ne
In
ten
sity
S11
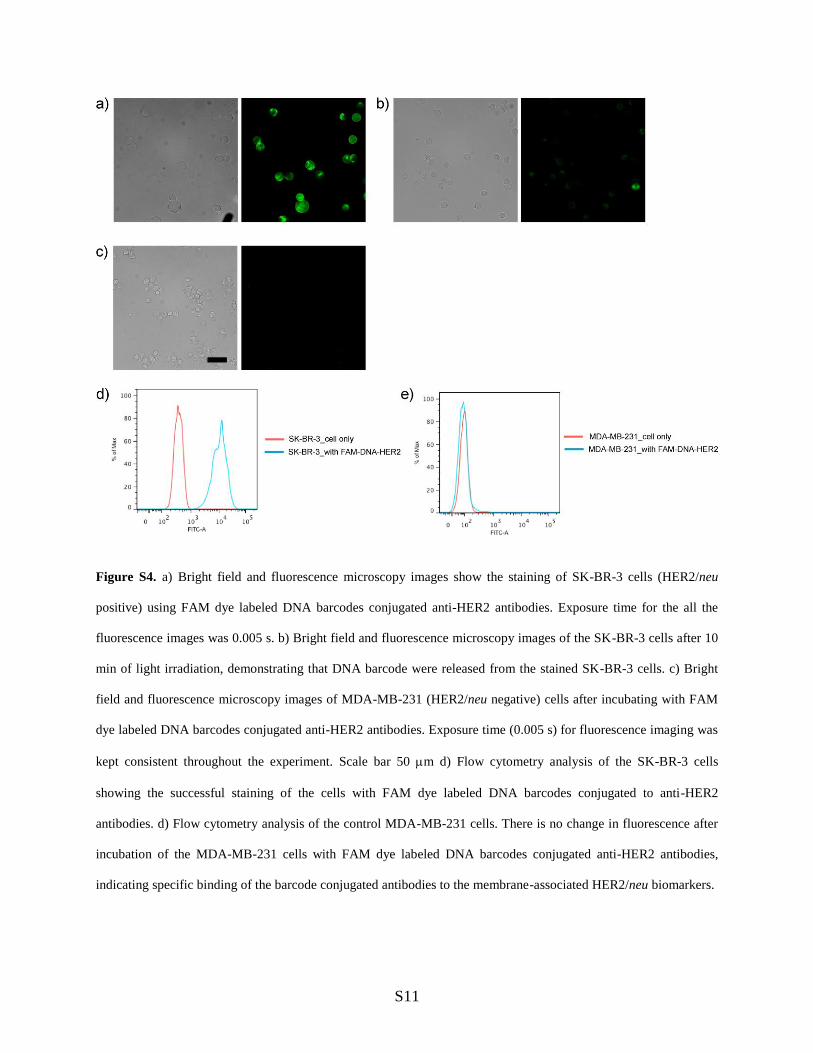
Figure S4. a) Bright field and fluorescence microscopy images show the staining of SK-BR-3 cells (HER2/neu
positive) using FAM dye labeled DNA barcodes conjugated anti-HER2 antibodies. Exposure time for the all the
fluorescence images was 0.005 s. b) Bright field and fluorescence microscopy images of the SK-BR-3 cells after 10
min of light irradiation, demonstrating that DNA barcode were released from the stained SK-BR-3 cells. c) Bright
field and fluorescence microscopy images of MDA-MB-231 (HER2/neu negative) cells after incubating with FAM
dye labeled DNA barcodes conjugated anti-HER2 antibodies. Exposure time (0.005 s) for fluorescence imaging was
kept consistent throughout the experiment. Scale bar 50 m d) Flow cytometry analysis of the SK-BR-3 cells
showing the successful staining of the cells with FAM dye labeled DNA barcodes conjugated to anti-HER2
antibodies. d) Flow cytometry analysis of the control MDA-MB-231 cells. There is no change in fluorescence after
incubation of the MDA-MB-231 cells with FAM dye labeled DNA barcodes conjugated anti-HER2 antibodies,
indicating specific binding of the barcode conjugated antibodies to the membrane-associated HER2/neu biomarkers.
S12
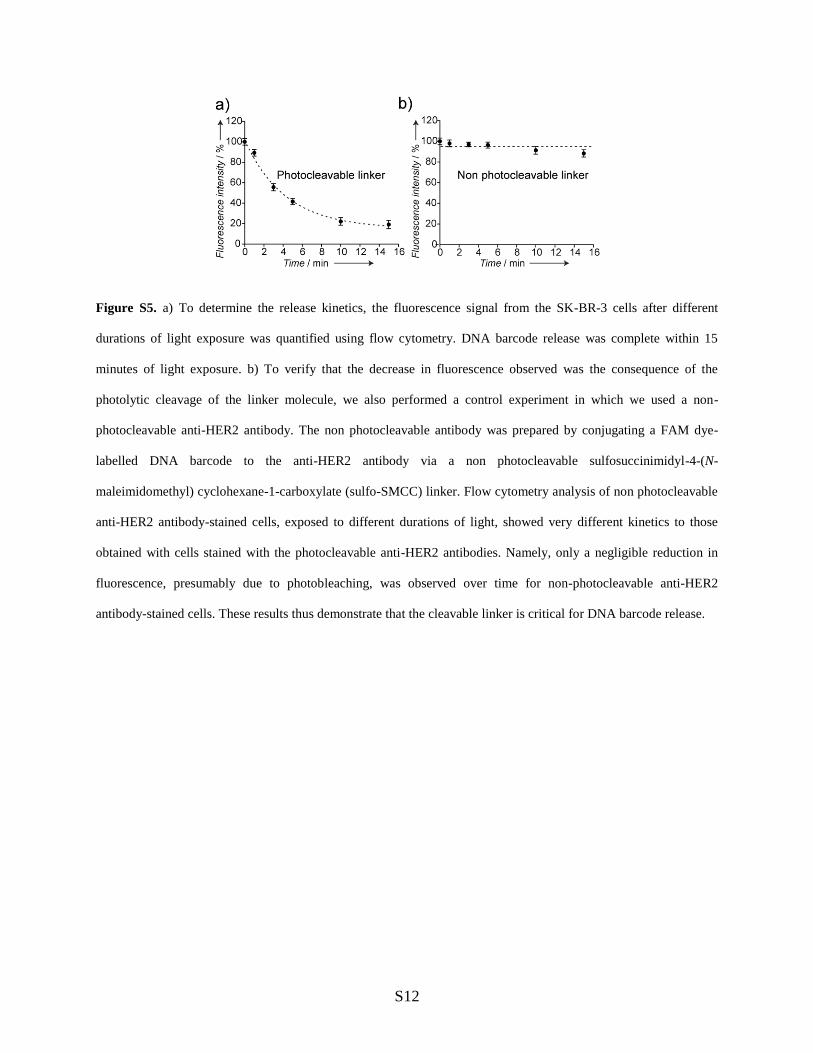
Figure S5. a) To determine the release kinetics, the fluorescence signal from the SK-BR-3 cells after different
durations of light exposure was quantified using flow cytometry. DNA barcode release was complete within 15
minutes of light exposure. b) To verify that the decrease in fluorescence observed was the consequence of the
photolytic cleavage of the linker molecule, we also performed a control experiment in which we used a non-
photocleavable anti-HER2 antibody. The non photocleavable antibody was prepared by conjugating a FAM dye-
labelled DNA barcode to the anti-HER2 antibody via a non photocleavable sulfosuccinimidyl-4-(N-
maleimidomethyl) cyclohexane-1-carboxylate (sulfo-SMCC) linker. Flow cytometry analysis of non photocleavable
anti-HER2 antibody-stained cells, exposed to different durations of light, showed very different kinetics to those
obtained with cells stained with the photocleavable anti-HER2 antibodies. Namely, only a negligible reduction in
fluorescence, presumably due to photobleaching, was observed over time for non-photocleavable anti-HER2
antibody-stained cells. These results thus demonstrate that the cleavable linker is critical for DNA barcode release.

S13
Figure S6. Analysis of HER2/neu in individual SK-BR-3 cells and MDA-MB-231 cells using digital format. Here
cells are targeted with 85-base DNA barcode-conjugated anti-HER2 (85bDNA-HER2) antibody. 85 base barcode
was detected from individual SK-BR-3 cells after PCR amplification, whereas MDA-MB-231 cells (HER2/neu
negative) failed to produce a significant band after 25 cycles of PCR amplification.
Figure S7. a) Analysis of seven individual SK-BR-3 cells using digital format of LMCB. b) Variation of band
intensities between the cells indicates heterogeneities of HER2/neu expression between SK-BR-3 cells (mean:
14,470; Std. Deviation: 3,557; median: 14,807).
S14
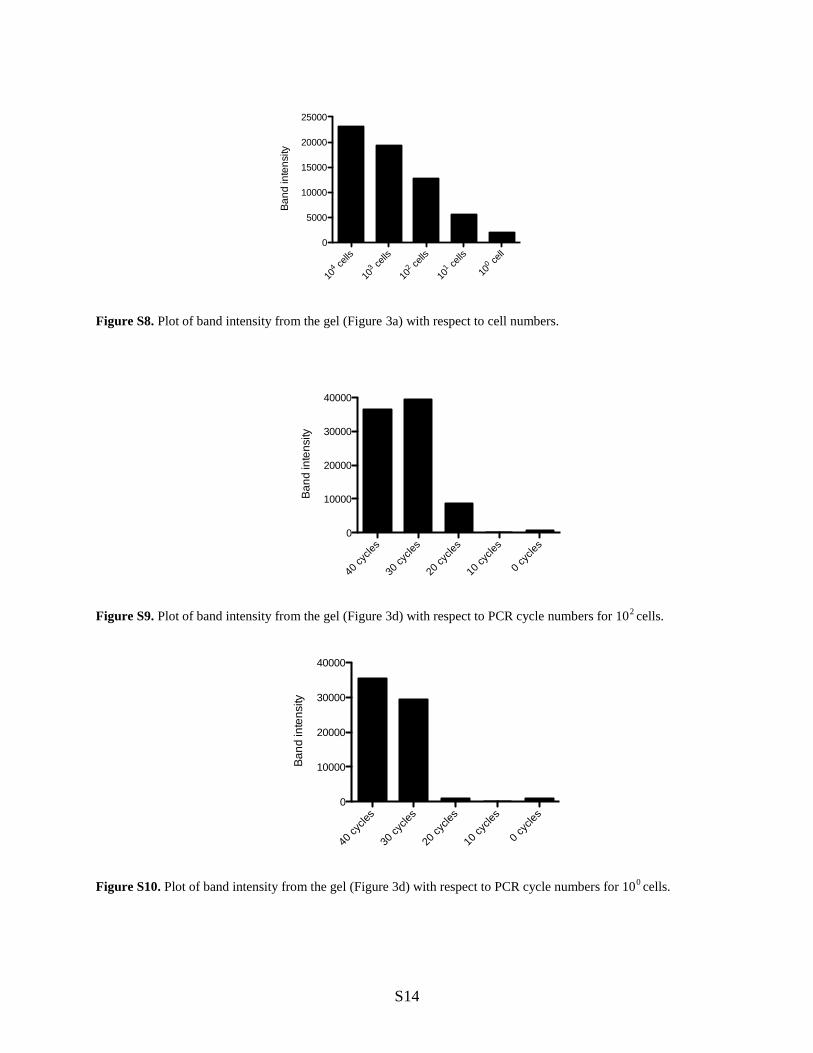
Figure S8. Plot of band intensity from the gel (Figure 3a) with respect to cell numbers.
Figure S9. Plot of band intensity from the gel (Figure 3d) with respect to PCR cycle numbers for 102 cells.
Figure S10. Plot of band intensity from the gel (Figure 3d) with respect to PCR cycle numbers for 100 cells.
104 c
ells
103 c
ells
102 c
ells
101 c
ells
100 c
ell
0
5000
10000
15000
20000
25000
Ba
nd
in
ten
sity
40 c
ycle
s
30 c
ycle
s
20 c
ycle
s
10 c
ycle
s
0 cy
cles
0
10000
20000
30000
40000
Ba
nd
inte
nsity
40 c
ycle
s
30 c
ycle
s
20 c
ycle
s
10 c
ycle
s
0 cy
cles
0
10000
20000
30000
40000
Ba
nd
inte
nsity
S15
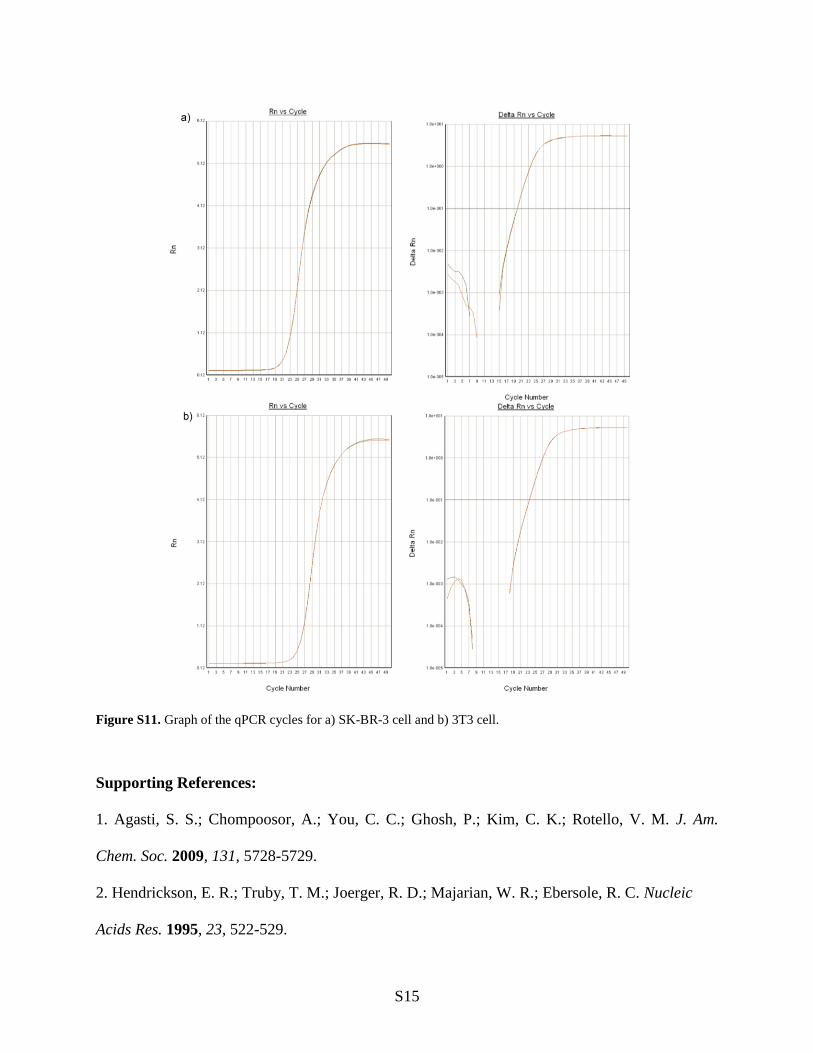
Figure S11. Graph of the qPCR cycles for a) SK-BR-3 cell and b) 3T3 cell.
Supporting References:
1. Agasti, S. S.; Chompoosor, A.; You, C. C.; Ghosh, P.; Kim, C. K.; Rotello, V. M. J. Am.
Chem. Soc. 2009, 131, 5728-5729.
2. Hendrickson, E. R.; Truby, T. M.; Joerger, R. D.; Majarian, W. R.; Ebersole, R. C. Nucleic
Acids Res. 1995, 23, 522-529.