Supporting Information - PNAS Information Okamoto et al. 10.1073/pnas ... media supplemented with 10...
10
Supporting Information Okamoto et al. 10.1073/pnas.1305919110 SI Methods Chemical Screening. We used a previously described yeast two- hybrid system (1) in high-throughput screens (HTSs) to identify abscisic acid (ABA) agonists. In this system, the agonist pro- moted receptor–PP2C interaction drives expression of a URA3 or HIS3 reporter gene and rescues uracil or histidine auxotrophy of parental strains (1, 2). HTSs were conducted using five dif- ferent reporter strains that express binding domain (BD) fusions to PYR1, PYL1, PYL2, PYL3, or PYL4; these were coexpressed with activation domain (AD) fusions to HAB1 (pACT-HAB1); the constructs used have been described previously (3). We used these strains in two separate screens. In the first screen, ∼45,000 compounds obtained from a variety of sources (Chembridge Sigma-Timtec and Microsource Discovery Systems) were assayed for agonist activity using a halo assay, essentially as described by Lokey et al. (4). In this method, yeast strains are embedded in selective agar, and compounds are pin transferred from 10 mM DMSO stock solutions onto assay plates; hits are evident by in- creased cell density in the vicinity of active compounds. Ex- periments using the halo assay used the yeast strain PJ69-4A and media supplemented with 10 mM 3-aminotriazole to improve selections. Halo screens were set up using a Biomek FX equip- ped with an automated microplate hotel (Thermo Cytomat) and a magnetically loaded 384-pin tool (V & P Scientific), which was used to spot compounds on to assay plates. Before each chemical transfer, the pins were washed in a 1:1 mixture of DMSO/water followed by a wash with 95% ethanol and dried. After chemical transfer, plates were incubated at 28 °C, and candidate agonists were evident by visual inspection of halo plates using trans- illumination. Although the halo screening method is powerful from the per- spective of throughput, we subsequently used a more conventional screening method for a second screen of a diverse 12,000-member library obtained from Life Chemicals (Ukraine). This change was motivated by a desire to better control the assay concentration. In our second screen, reporter constructs were expressed in the yeast strain MAV99, which enables uracil-based selections via a GAL1 promoter driven URA3 transgene (1). Screening compounds were added to selective uracil − media seeded with reporter strains in 96- well plate format at a final concentration of 25 μM; yeast growth was inspected manually after ∼3 d. Compounds were transferred to screening wells from 2.5 mM stock solutions using a Biomek FX 96- channel liquid handler. As a third screening approach, the Life Chemicals library was also screened for Arabidopsis germination inhibitors in solidified agar medium containing 0.5× Murashige and Skoog (MS) salts, 0.5% sucrose, and 25 μM test compound. Hits from the germination assay were subsequently tested in yeast two-hybrid assays. Hit compounds were restocked from their original vendors and used in secondary screens and compound characterization. Quina- bactin and its analogs were purchased from Life Chemicals. struc- ture data format (SDF) files for the libraries screened can be downloaded from http://chemminedb.ucr.edu/intro/data-sources/. Type II C Protein Phosphatase Activity Assay. HAB1 and PYL pro- teins were expressed and purified as described previously (3), with minor modifications. To obtain GST-HAB1, -ABI1, and -ABI2 fu- sion proteins, the HAB1 cDNA was cloned into pGex-2T, whereas ABI1 and ABI2 cDNAs were cloned into the vector pGex-4T-1. Expression was conducted in BL21[DE3]pLysS host cells. Trans- formed cells were precultured overnight, transferred to luria broth (LB) medium, and cultured at 30 °C to culture A 600 of ∼0.5. The culture was then cooled on ice, MnCl 2 was added to 4 mM, and isopropyl β-D-1 thiogalactopyranoside (IPTG) was added to 0.3 mM. After 16-h incubation at 15 °C, cells were harvested, and re- combinant proteins were purified on glutathione agarose as de- scribed previously (3). To obtain 6XHis-PYL receptor fusion proteins, receptor cDNAs for all 13 ABA receptors were cloned into the vector pET28 and expressed and purified as described previously (5); this yielded soluble and functional protein [assessed using receptor-mediated type II C protein phosphatase (PP2C) inhibition assays] for all receptors except PYL7, PYL11, and PYL12. These three receptors were therefore alternatively ex- pressed as maltose binding (MBP) fusion proteins using the vector pMAL-c; expression of these constructs was carried out in the BL21[DE3]pLysS host strain with the same induction conditions used for GST-HAB1. Recombinant MBP-PYL fusion proteins were purified from sonicated and cleared lysate using amylose resin (New England Biolabs) using the manufacturer’s purification in- structions. This effort yielded an active MBP-PYL11 fusion protein but failed for PYL7 and PYL12. PP2C activity assays using recombinant receptors and PP2Cs were carried out as follows. Purified proteins were preincubated in 80 μL assay buffer containing 12.5 mM MnCl 2 ,3 μg BSA, and 0.125% 2-mercaptoethanol with ABA or ABA agonist for 30 min at 22 °C. Reactions were started by adding 20 μL of a reaction solution containing 156 mM Tris-OAc, pH 7.9, 330 mM KOAc and 5 mM 4-methylumbelliferyl, after which fluorescence mea- surements were immediately collected using a n 355-nm excita- tion filter and a 460-nm emission filter on a Wallac plate reader. Reactions contained 50 nM PP2C and 100 nM PYR/PYL pro- teins, respectively. X-Ray Diffraction Analysis of the HAB1-Quinabactin-PYL2 Complex. PYL2 and ΔNHAB1 (residues 1–178 deleted) were expressed in Escherichia coli and purified as described previously (3, 6). Briefly, proteins were expressed in E. coli BL21(DE3), lysed using a French press, and purified by immobilized metal affinity chromatography (IMAC) chromatography. Affinity tags were proteolytically removed, and the proteins were further purified by gel filtration chromatography. PYL2 was concentrated to 20– 30 mg/mL and stored in a buffer containing 20 mM Tris, pH 7.6, 50 mM sodium chloride, and 2 mM DTT. Purified ΔNHAB1 was concentrated to 4 mg/mL and stored in 20 mM Tris, pH 7.5, 150 mM ammonium acetate, 5 mM DTT, 10 mM magnesium chlo- ride, and 10% (vol/vol) glycerol. All purified proteins were store at −20 °C. In preparation for crystallization, the PYL2-quinabactin- ΔNHAB1 ternary complex was prepared by mixing the purified protein components in a 1:1 molar ratio the presence of a 10-fold molar excess of quinabactin. The ternary complex was then con- centrated to 15 mg/mL, and crystallization conditions were identified using the UW192 screen developed by the Center for Eukaryotic Structural Genomics, and the JCSG+ screen (Mo- lecular Dimensions). Diffraction quality crystals were grown at 19 °C in a hanging drop vapor diffusion experiment from 160 mM magnesium chloride, 23% (wt/vol) PEG-8000, and 100 mM Tris, pH 8.5. Crystals were transferred to a well solution containing 20% (vol/vol) glycerol before freezing in liquid nitrogen. X-ray diffraction data were gathered for single crystals at the 21-ID-G beamline of the Advanced Photon Source at Argonne National Laboratories using a wavelength of 0.97856. All data were collected at 100 K, and the ternary complex diffracted to 1.98 Å. The observed reflections were indexed, integrated, and Okamoto et al. www.pnas.org/cgi/content/short/1305919110 1 of 10
Transcript of Supporting Information - PNAS Information Okamoto et al. 10.1073/pnas ... media supplemented with 10...

Supporting InformationOkamoto et al. 10.1073/pnas.1305919110SI MethodsChemical Screening. We used a previously described yeast two-hybrid system (1) in high-throughput screens (HTSs) to identifyabscisic acid (ABA) agonists. In this system, the agonist pro-moted receptor–PP2C interaction drives expression of a URA3or HIS3 reporter gene and rescues uracil or histidine auxotrophyof parental strains (1, 2). HTSs were conducted using five dif-ferent reporter strains that express binding domain (BD) fusionsto PYR1, PYL1, PYL2, PYL3, or PYL4; these were coexpressedwith activation domain (AD) fusions to HAB1 (pACT-HAB1);the constructs used have been described previously (3). We usedthese strains in two separate screens. In the first screen, ∼45,000compounds obtained from a variety of sources (ChembridgeSigma-Timtec and Microsource Discovery Systems) were assayedfor agonist activity using a halo assay, essentially as described byLokey et al. (4). In this method, yeast strains are embedded inselective agar, and compounds are pin transferred from 10 mMDMSO stock solutions onto assay plates; hits are evident by in-creased cell density in the vicinity of active compounds. Ex-periments using the halo assay used the yeast strain PJ69-4A andmedia supplemented with 10 mM 3-aminotriazole to improveselections. Halo screens were set up using a Biomek FX equip-ped with an automated microplate hotel (Thermo Cytomat) anda magnetically loaded 384-pin tool (V & P Scientific), which wasused to spot compounds on to assay plates. Before each chemicaltransfer, the pins were washed in a 1:1 mixture of DMSO/waterfollowed by a wash with 95% ethanol and dried. After chemicaltransfer, plates were incubated at 28 °C, and candidate agonistswere evident by visual inspection of halo plates using trans-illumination.Although the halo screening method is powerful from the per-
spective of throughput, we subsequently used a more conventionalscreening method for a second screen of a diverse 12,000-memberlibrary obtained from Life Chemicals (Ukraine). This change wasmotivated by a desire to better control the assay concentration. Inour second screen, reporter constructs were expressed in the yeaststrain MAV99, which enables uracil-based selections via a GAL1promoter driven URA3 transgene (1). Screening compounds wereadded to selective uracil−media seeded with reporter strains in 96-well plate format at a final concentration of 25 μM; yeast growthwas inspected manually after∼3 d. Compounds were transferred toscreening wells from 2.5mMstock solutions using a Biomek FX96-channel liquid handler.Asa thirdscreeningapproach, theLifeChemicals librarywasalso
screened for Arabidopsis germination inhibitors in solidified agarmedium containing 0.5× Murashige and Skoog (MS) salts, 0.5%sucrose, and 25 μM test compound. Hits from the germinationassay were subsequently tested in yeast two-hybrid assays.Hit compounds were restocked from their original vendors and
used in secondary screens and compound characterization. Quina-bactin and its analogs were purchased from Life Chemicals. struc-ture data format (SDF) files for the libraries screened can bedownloaded from http://chemminedb.ucr.edu/intro/data-sources/.
Type II C Protein Phosphatase Activity Assay. HAB1 and PYL pro-teins were expressed and purified as described previously (3), withminor modifications. To obtain GST-HAB1, -ABI1, and -ABI2 fu-sion proteins, the HAB1 cDNA was cloned into pGex-2T, whereasABI1 and ABI2 cDNAs were cloned into the vector pGex-4T-1.Expression was conducted in BL21[DE3]pLysS host cells. Trans-formed cells were precultured overnight, transferred to luria broth(LB) medium, and cultured at 30 °C to culture A600 of ∼0.5. The
culture was then cooled on ice, MnCl2 was added to 4 mM, andisopropyl β-D-1 thiogalactopyranoside (IPTG) was added to 0.3mM. After 16-h incubation at 15 °C, cells were harvested, and re-combinant proteins were purified on glutathione agarose as de-scribed previously (3). To obtain 6XHis-PYL receptor fusionproteins, receptor cDNAs for all 13 ABA receptors were clonedinto the vector pET28 and expressed and purified as describedpreviously (5); this yielded soluble and functional protein [assessedusing receptor-mediated type II C protein phosphatase (PP2C)inhibition assays] for all receptors except PYL7, PYL11, andPYL12. These three receptors were therefore alternatively ex-pressed as maltose binding (MBP) fusion proteins using the vectorpMAL-c; expression of these constructs was carried out in theBL21[DE3]pLysS host strain with the same induction conditionsused for GST-HAB1. Recombinant MBP-PYL fusion proteinswere purified from sonicated and cleared lysate using amylose resin(New England Biolabs) using the manufacturer’s purification in-structions. This effort yielded an activeMBP-PYL11 fusion proteinbut failed for PYL7 and PYL12.PP2C activity assays using recombinant receptors and PP2Cs
were carried out as follows. Purified proteins were preincubated in80 μL assay buffer containing 12.5 mM MnCl2, 3 μg BSA, and0.125% 2-mercaptoethanol with ABA or ABA agonist for 30 minat 22 °C. Reactions were started by adding 20 μL of a reactionsolution containing 156 mM Tris-OAc, pH 7.9, 330 mM KOAcand 5 mM 4-methylumbelliferyl, after which fluorescence mea-surements were immediately collected using a n 355-nm excita-tion filter and a 460-nm emission filter on a Wallac plate reader.Reactions contained 50 nM PP2C and 100 nM PYR/PYL pro-teins, respectively.
X-Ray Diffraction Analysis of the HAB1-Quinabactin-PYL2 Complex.PYL2 and ΔNHAB1 (residues 1–178 deleted) were expressedin Escherichia coli and purified as described previously (3, 6).Briefly, proteins were expressed in E. coli BL21(DE3), lysedusing a French press, and purified by immobilized metal affinitychromatography (IMAC) chromatography. Affinity tags wereproteolytically removed, and the proteins were further purifiedby gel filtration chromatography. PYL2 was concentrated to 20–30 mg/mL and stored in a buffer containing 20 mM Tris, pH 7.6,50 mM sodium chloride, and 2 mM DTT. Purified ΔNHAB1 wasconcentrated to 4 mg/mL and stored in 20 mM Tris, pH 7.5, 150mM ammonium acetate, 5 mM DTT, 10 mM magnesium chlo-ride, and 10% (vol/vol) glycerol. All purified proteins were storeat −20 °C.In preparation for crystallization, the PYL2-quinabactin-
ΔNHAB1 ternary complex was prepared by mixing the purifiedprotein components in a 1:1 molar ratio the presence of a 10-foldmolar excess of quinabactin. The ternary complex was then con-centrated to 15 mg/mL, and crystallization conditions wereidentified using the UW192 screen developed by the Center forEukaryotic Structural Genomics, and the JCSG+ screen (Mo-lecular Dimensions). Diffraction quality crystals were grown at19 °C in a hanging drop vapor diffusion experiment from 160 mMmagnesium chloride, 23% (wt/vol) PEG-8000, and 100 mM Tris,pH 8.5. Crystals were transferred to a well solution containing20% (vol/vol) glycerol before freezing in liquid nitrogen.X-ray diffraction data were gathered for single crystals at the
21-ID-G beamline of the Advanced Photon Source at ArgonneNational Laboratories using a wavelength of 0.97856. All datawere collected at 100 K, and the ternary complex diffracted to1.98 Å. The observed reflections were indexed, integrated, and
Okamoto et al. www.pnas.org/cgi/content/short/1305919110 1 of 10
internally scaled using HKL2000 (7). Molecular replacement wasused to evaluate the initial phases using the PYL2:ABA:HAB1complex (PDB code 3KB3) as the search model (8). Phenix.AutoMR solved the initial phases and automatically built in themajority of the amino acid residues for the ternary complex (9,10). Models were completed through iterative rounds of manualmodel building with Coot and refinement with phenix.refineusing translation libration screw-motion (TLS) and individualatomic displacement parameters (11). Selection of TLS groupswas facilitated using the TLSMD web server (http://skuld.bmsc.washington.edu/~tlsmd/) (12). Quinabactin was modeled usingthe ProgDrg server (1, 13). Geometry of the final structuralmodel was validated with Molprobity and Procheck (14, 15).Ramachandran statistics for the ternary complex were 98.3 and1.7 for the favored and additionally allowed regions of theRamachandran plot, respectively. Our data collection and re-finement statistics are provided in Table S1.
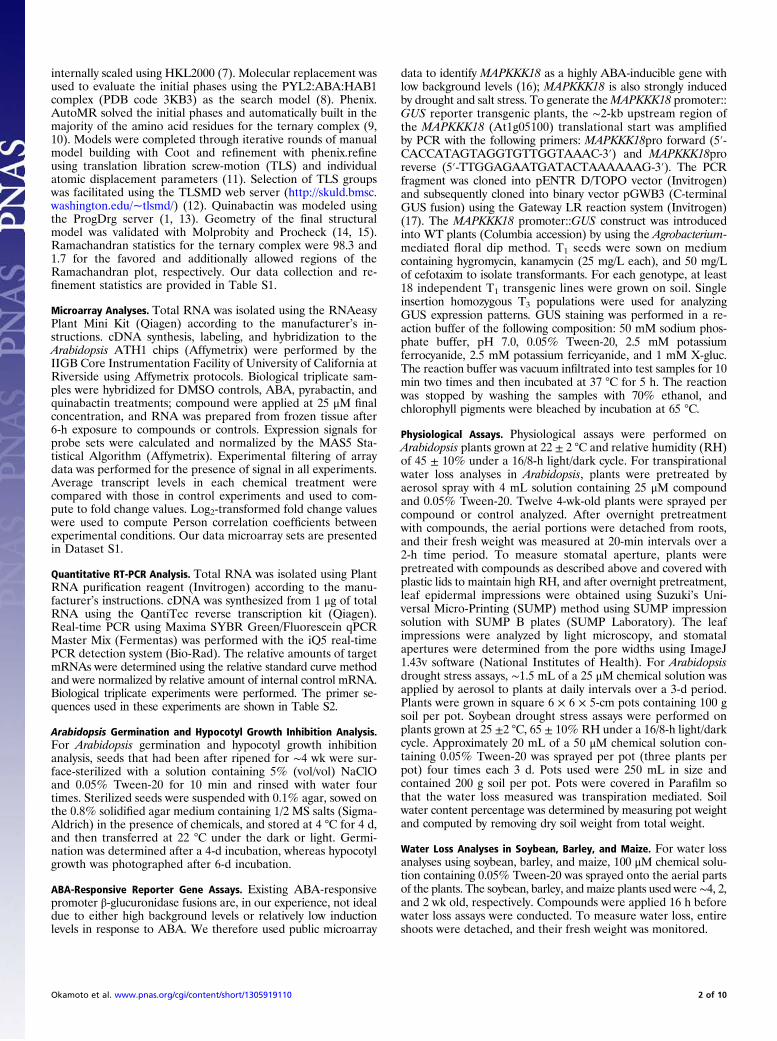
Microarray Analyses. Total RNA was isolated using the RNAeasyPlant Mini Kit (Qiagen) according to the manufacturer’s in-structions. cDNA synthesis, labeling, and hybridization to theArabidopsis ATH1 chips (Affymetrix) were performed by theIIGB Core Instrumentation Facility of University of California atRiverside using Affymetrix protocols. Biological triplicate sam-ples were hybridized for DMSO controls, ABA, pyrabactin, andquinabactin treatments; compound were applied at 25 μM finalconcentration, and RNA was prepared from frozen tissue after6-h exposure to compounds or controls. Expression signals forprobe sets were calculated and normalized by the MAS5 Sta-tistical Algorithm (Affymetrix). Experimental filtering of arraydata was performed for the presence of signal in all experiments.Average transcript levels in each chemical treatment werecompared with those in control experiments and used to com-pute to fold change values. Log2-transformed fold change valueswere used to compute Person correlation coefficients betweenexperimental conditions. Our data microarray sets are presentedin Dataset S1.
Quantitative RT-PCR Analysis. Total RNA was isolated using PlantRNA purification reagent (Invitrogen) according to the manu-facturer’s instructions. cDNA was synthesized from 1 μg of totalRNA using the QantiTec reverse transcription kit (Qiagen).Real-time PCR using Maxima SYBR Green/Fluorescein qPCRMaster Mix (Fermentas) was performed with the iQ5 real-timePCR detection system (Bio-Rad). The relative amounts of targetmRNAs were determined using the relative standard curve methodand were normalized by relative amount of internal control mRNA.Biological triplicate experiments were performed. The primer se-quences used in these experiments are shown in Table S2.
Arabidopsis Germination and Hypocotyl Growth Inhibition Analysis.For Arabidopsis germination and hypocotyl growth inhibitionanalysis, seeds that had been after ripened for ∼4 wk were sur-face-sterilized with a solution containing 5% (vol/vol) NaClOand 0.05% Tween-20 for 10 min and rinsed with water fourtimes. Sterilized seeds were suspended with 0.1% agar, sowed onthe 0.8% solidified agar medium containing 1/2 MS salts (Sigma-Aldrich) in the presence of chemicals, and stored at 4 °C for 4 d,and then transferred at 22 °C under the dark or light. Germi-nation was determined after a 4-d incubation, whereas hypocotylgrowth was photographed after 6-d incubation.
ABA-Responsive Reporter Gene Assays. Existing ABA-responsivepromoter β-glucuronidase fusions are, in our experience, not idealdue to either high background levels or relatively low inductionlevels in response to ABA. We therefore used public microarray
data to identify MAPKKK18 as a highly ABA-inducible gene withlow background levels (16); MAPKKK18 is also strongly inducedby drought and salt stress. To generate theMAPKKK18 promoter::GUS reporter transgenic plants, the ∼2-kb upstream region ofthe MAPKKK18 (At1g05100) translational start was amplifiedby PCR with the following primers: MAPKKK18pro forward (5′-CACCATAGTAGGTGTTGGTAAAC-3′) and MAPKKK18proreverse (5′-TTGGAGAATGATACTAAAAAAG-3′). The PCRfragment was cloned into pENTR D/TOPO vector (Invitrogen)and subsequently cloned into binary vector pGWB3 (C-terminalGUS fusion) using the Gateway LR reaction system (Invitrogen)(17). The MAPKKK18 promoter::GUS construct was introducedinto WT plants (Columbia accession) by using the Agrobacterium-mediated floral dip method. T1 seeds were sown on mediumcontaining hygromycin, kanamycin (25 mg/L each), and 50 mg/Lof cefotaxim to isolate transformants. For each genotype, at least18 independent T1 transgenic lines were grown on soil. Singleinsertion homozygous T3 populations were used for analyzingGUS expression patterns. GUS staining was performed in a re-action buffer of the following composition: 50 mM sodium phos-phate buffer, pH 7.0, 0.05% Tween-20, 2.5 mM potassiumferrocyanide, 2.5 mM potassium ferricyanide, and 1 mM X-gluc.The reaction buffer was vacuum infiltrated into test samples for 10min two times and then incubated at 37 °C for 5 h. The reactionwas stopped by washing the samples with 70% ethanol, andchlorophyll pigments were bleached by incubation at 65 °C.
Physiological Assays. Physiological assays were performed onArabidopsis plants grown at 22 ± 2 °C and relative humidity (RH)of 45 ± 10% under a 16/8-h light/dark cycle. For transpirationalwater loss analyses in Arabidopsis, plants were pretreated byaerosol spray with 4 mL solution containing 25 μM compoundand 0.05% Tween-20. Twelve 4-wk-old plants were sprayed percompound or control analyzed. After overnight pretreatmentwith compounds, the aerial portions were detached from roots,and their fresh weight was measured at 20-min intervals over a2-h time period. To measure stomatal aperture, plants werepretreated with compounds as described above and covered withplastic lids to maintain high RH, and after overnight pretreatment,leaf epidermal impressions were obtained using Suzuki’s Uni-versal Micro-Printing (SUMP) method using SUMP impressionsolution with SUMP B plates (SUMP Laboratory). The leafimpressions were analyzed by light microscopy, and stomatalapertures were determined from the pore widths using ImageJ1.43v software (National Institutes of Health). For Arabidopsisdrought stress assays, ∼1.5 mL of a 25 μM chemical solution wasapplied by aerosol to plants at daily intervals over a 3-d period.Plants were grown in square 6 × 6 × 5-cm pots containing 100 gsoil per pot. Soybean drought stress assays were performed onplants grown at 25 ±2 °C, 65 ± 10% RH under a 16/8-h light/darkcycle. Approximately 20 mL of a 50 μM chemical solution con-taining 0.05% Tween-20 was sprayed per pot (three plants perpot) four times each 3 d. Pots used were 250 mL in size andcontained 200 g soil per pot. Pots were covered in Parafilm sothat the water loss measured was transpiration mediated. Soilwater content percentage was determined by measuring pot weightand computed by removing dry soil weight from total weight.
Water Loss Analyses in Soybean, Barley, and Maize. For water lossanalyses using soybean, barley, and maize, 100 μM chemical solu-tion containing 0.05% Tween-20 was sprayed onto the aerial partsof the plants. The soybean, barley, and maize plants used were∼4, 2,and 2 wk old, respectively. Compounds were applied 16 h beforewater loss assays were conducted. To measure water loss, entireshoots were detached, and their fresh weight was monitored.
Okamoto et al. www.pnas.org/cgi/content/short/1305919110 2 of 10
1. Peterson FC, et al. (2010) Structural basis for selective activation of ABA receptors. NatStruct Mol Biol 17(9):1109–1113.
2. Vidal M, Brachmann RK, Fattaey A, Harlow E, Boeke JD (1996) Reverse two-hybrid andone-hybrid systems to detect dissociation of protein-protein and DNA-proteininteractions. Proc Natl Acad Sci USA 93(19):10315–10320.
3. Gassner NC, et al. (2007) Accelerating the discovery of biologically active smallmolecules using a high-throughput yeast halo assay. J Nat Prod 70(3):383–390.
4. Park SY, et al. (2009) Abscisic acid inhibits type 2C protein phosphatases via thePYR/PYL family of START proteins. Science 324(5930):1068–1071.
5. Mosquna A, et al. (2011) Potent and selective activation of abscisic acid receptors invivo by mutational stabilization of their agonist-bound conformation. Proc Natl AcadSci USA 108(51):20838–20843.
6. Santiago J, et al. (2009) Modulation of drought resistance by the abscisic acid receptorPYL5 through inhibition of clade A PP2Cs. Plant J 60(4):575–588.
7. Otwinowski Z, Minor W (1997) Processing of X-ray diffraction data collected inoscillation mode. Methods in Enzymology 276:307–326.
8. Melcher K, et al. (2009) A gate-latch-lock mechanism for hormone signalling byabscisic acid receptors. Nature 462(7273):602–608.
9. Frederick RO, et al. (2007) Small-scale, semi-automated purification of eukaryoticproteins for structure determination. J Struct Funct Genomics 8(4):153–166.
10. McCoy AJ, Grosse-Kunstleve RW, Storoni LC, Read RJ (2005) Likelihood-enhanced fasttranslation functions. Acta Crystallogr D Biol Crystallogr 61(Pt 4):458–464.
11. Emsley P, Cowtan K (2004) Coot: Model-building tools for molecular graphics. ActaCrystallogr D Biol Crystallogr 60(Pt 12 Pt 1):2126–2132.
12. Painter J, Merritt EA (2006) Optimal description of a protein structure in terms ofmultiple groups undergoing TLS motion. Acta Crystallogr D Biol Crystallogr 62(Pt 4):439–450.
13. Schüttelkopf AW, van Aalten DM (2004) PRODRG: A tool for high-throughputcrystallography of protein-ligand complexes. Acta Crystallogr D Biol Crystallogr60(Pt 8):1355–1363.
14. Davis IW, et al. (2007) MolProbity: All-atom contacts and structure validation forproteins and nucleic acids. Nucleic Acids Res 35(Web Server issue):W375–W383.
15. Laskowski RA, Macarthur MW, Moss DS, Thornton JM (1993) Procheck: A program tocheck the stereochemical quality of protein structures. J Appl Cryst 26(2):283–291.
16. Matsui A, et al. (2008) Arabidopsis transcriptome analysis under drought, cold, high-salinity and ABA treatment conditions using a tiling array. Plant Cell Physiol 49(8):1135–1149.
17. Nakagawa T, et al. (2007) Development of series of gateway binary vectors, pGWBs,for realizing efficient construction of fusion genes for plant transformation. J BiosciBioeng 104(1):34–41.
PYR1
PYL1
PYL2
PYL3
PYL4
1 µM
5 µM
25 µM DMSO Control
A B
DMSO
ABA
Quina
C
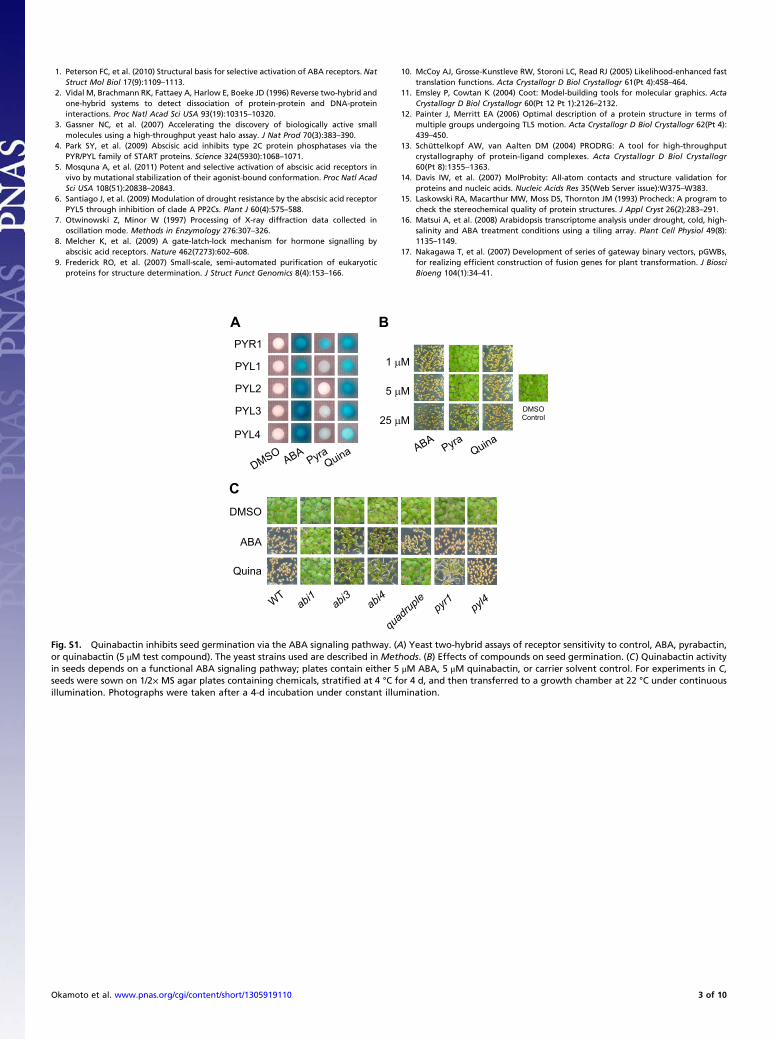
Fig. S1. Quinabactin inhibits seed germination via the ABA signaling pathway. (A) Yeast two-hybrid assays of receptor sensitivity to control, ABA, pyrabactin,or quinabactin (5 μM test compound). The yeast strains used are described in Methods. (B) Effects of compounds on seed germination. (C) Quinabactin activityin seeds depends on a functional ABA signaling pathway; plates contain either 5 μM ABA, 5 μM quinabactin, or carrier solvent control. For experiments in C,seeds were sown on 1/2× MS agar plates containing chemicals, stratified at 4 °C for 4 d, and then transferred to a growth chamber at 22 °C under continuousillumination. Photographs were taken after a 4-d incubation under constant illumination.
Okamoto et al. www.pnas.org/cgi/content/short/1305919110 3 of 10

A B
HO
N
HN
O
F
SSNH
O
O
Br
SN+ NH
O
O-O
O
NN+
NH
-O
O
S
O
OO
NNNH
SO
FF
F
NNH
O
OFF
F
Cl
NH
N
O N
Agonist A
Agonist E
Agonist CAgonist B Agonist D
Agonist F Agonist H
HN
O
NNS
O
S
Agonist G
C
WT abi1
DMSO Agonist A Agonist B Agonist C Agonist D
Agonist E Agonist F Agonist G Agonist H
5 mm
PYR1
PYL1
PYL2
PYL3
PYL4
D
E
WT abi1 WT abi1 WT abi1 WT abi1
WT abi1 WT abi1 WT abi1 WT abi1
DMSO ABA Agonist A Agonist B Agonist C
Agonist G Agonist H Agonist E Agonist F Agonist D
1 mm
DMSO ABA Agonist A Agonist B Agonist C
Agonist G Agonist H Agonist E Agonist F Agonist D
Fig. S2. Characterization of weak ABA agonists. (A) Chemical structures hit compounds. (B) Yeast two-hybrid assays of receptor sensitivity to 50 μM of testcompound. (C) Effects of compounds on hypocotyl cell expansion and modulation of their effects by abi1. (D) Effects of compounds on germination undercontinuous illumination. In C and D, seeds were sown on 1/2×MS agar plates stratified at 4 °C for 4 d and subsequently transferred to a growth chamber at 22 °Cunder darkness (C) or continuous illumination (D); photographs taken on day 6 (C) or day 4 (D). In C, chemicals were tested at the following concentrations: 5 μMfor agonist G; 25 μM for agonist B; 50 μM for agonists A, C, D, E, F, and H. In D, all compounds were tested at 50 μM. (E) Effects of compounds on the ABAtranscriptional reporter pMAPKKK18::GUS. Six-day-old marker line plants were treated with 50 μM chemical solutions for 6 h before histochemical staining.
Okamoto et al. www.pnas.org/cgi/content/short/1305919110 4 of 10
AB
I1 a
ctiv
ity %
A
BI2
act
ivity
%
HA
B1
act
ivity
%
0
20
40
60
80
100
120
0
20
40
60
80
100
120
0
20
40
60
80
100
120
-
-
-
DMSO
ABA
Pyrabactin
Quinabactin
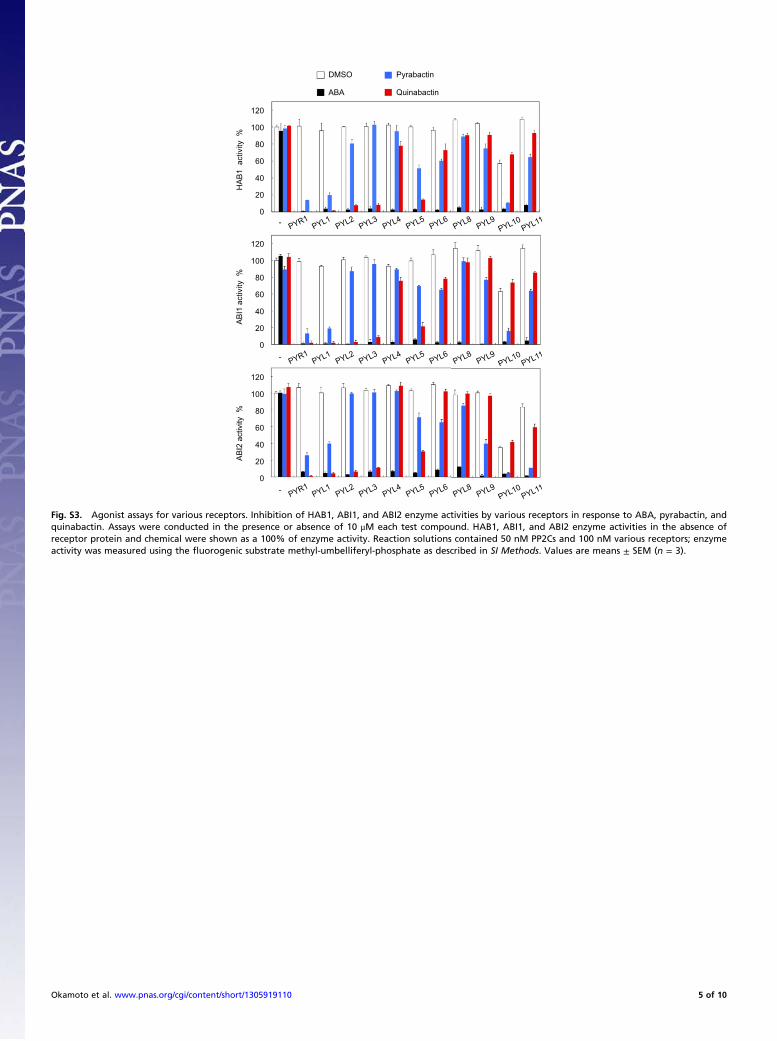
Fig. S3. Agonist assays for various receptors. Inhibition of HAB1, ABI1, and ABI2 enzyme activities by various receptors in response to ABA, pyrabactin, andquinabactin. Assays were conducted in the presence or absence of 10 μM each test compound. HAB1, ABI1, and ABI2 enzyme activities in the absence ofreceptor protein and chemical were shown as a 100% of enzyme activity. Reaction solutions contained 50 nM PP2Cs and 100 nM various receptors; enzymeactivity was measured using the fluorogenic substrate methyl-umbelliferyl-phosphate as described in SI Methods. Values are means ± SEM (n = 3).
Okamoto et al. www.pnas.org/cgi/content/short/1305919110 5 of 10

PYR1 PYL1 PYL2 PYL3
PYL4 PYL5 PYL6 PYL8
PYL9 PYL10 PYL11
HA
B1 activity %
H
AB
1 activity %
H
AB
1 activity %
Chemical concentration (nM)
ABA
Quinabactin
Pyrabactin
A
B
0
20
40
60
80
100
120
0
20
40
60
80
100
120
0
20
40
60
80
100
120
0
20
40
60
80
100
120
0 2000 4000 6000 8000 10000 0 2000 4000 6000 8000 10000 0 2000 4000 6000 8000 10000 0 2000 4000 6000 8000 10000
0
20
40
60
80
100
120
0
20
40
60
80
100
120
0
20
40
60
80
100
120
0
20
40
60
80
100
120
0 2000 4000 6000 8000 100000 2000 4000 6000 8000 100000 2000 4000 6000 8000 100000 2000 4000 6000 8000 10000
0
20
40
60
80
100
120
0
20
40
60
80
100
120
0
20
40
60
80
100
120
140
0 2000 4000 6000 8000 10000 0 2000 4000 6000 8000 10000 0 2000 4000 6000 8000 10000
IC50
(nM) PYR1 PYL1 PYL2 PYL3 PYL4 PYL5 PYL6 PYL8 PYL9 PYL10 PYL11
ABA 307 301 151 70 68 27 29 57 60 121 (*18) 64
Quina 103 250 267 724 >10uM 649 >10uM >10uM >10uM >10uM (*>10 M) >10uM
PyrA 656 1197 >10uM >10uM >10uM 5174 >10uM >10uM >10uM 1892 (*206) >10uM
IC50
(nM) PYR1 PYL1 PYL2 PYL3 PYL4 PYL5 PYL6 PYL8 PYL9 PYL10 PYL11
ABA 307 301 151 70 68 27 29 57 60 121 (*18) 64
Quina 103 250 267 724 >10uM 649 >10uM >10uM >10uM >10uM (*>10 M) >10uM
PyrA 656 1197 >10uM >10uM >10uM 5174 >10uM >10uM >10uM 1892 (*206) >10uM
Dimeric type Monomeric type
Fig. S4. Dose-dependent inhibition of PP2C activity by agonists. (A) Receptor-mediated inhibition of PP2C enzyme activity by ABA, pyrabactin, and quina-bactin. Chemicals were tested at 0, 10, 25, 50, 100, 500, 1,000, 5,000, and 10,000 nM. HAB1 activity in absence of chemical and presence of receptor is shownas 100% activity. Assays were conducted using the fluorogenic substrate methyl-umbelliferyl-phosphate as described in SI Methods. Values are means ± SEM(n = 3). (B) Observed compound IC50 values in enzymatic HAB1-based ABA-agonist assays. Asterisk is shown when compound IC50 values are calculated from100% of HAB1 activity in absence of PYL10.
Wild type abi1 quadruple
RD29B ABF3
D P Q A AQD AQD
12
8
4
12
8
4 Fold
incr
ease
0
30
20
10
40
D P Q A AQD AQDD P Q A AQD AQD
RD29A
Fig. S5. Expression of ABA-responsive genes by chemical treatments. Ten-day-old seedlings of WT, abi1, or pyr1pyl1ply2ply4 quadruple mutants were in-cubated in a solution containing 25 μM compound in 1/2× MS and 0.5% sucrose for 6 h. D, P, Q, and A indicate DMSO, pyrabactin, quinabactin, and ABAtreatments, respectively. RNA isolation and quantitative RT-PCR were conducted as described in Methods. Values are means ± SEM (n = 3).
Okamoto et al. www.pnas.org/cgi/content/short/1305919110 6 of 10
Soybean Barley Maize
D P Q A 10
15
20
25
30
6
8
10
12
4
5
6
7
8
Fold
incr
ease
ZmRab17
0
60
120
180
Wat
er l
oss
%
D P Q A D P Q A
HVA1 GmZIP1
D P Q A D P Q A D P Q A 0
1
2
3
4
5 7.5
5.0
2.5
0
A
B HVA1 VVHvDRF1
C
DMSO Pyra Quina ABA28/153 35/153 72/153 97/153
D P Q A 350 D
ry W
eigh
t (m
g) /
plan
t
375
400
425
450 D
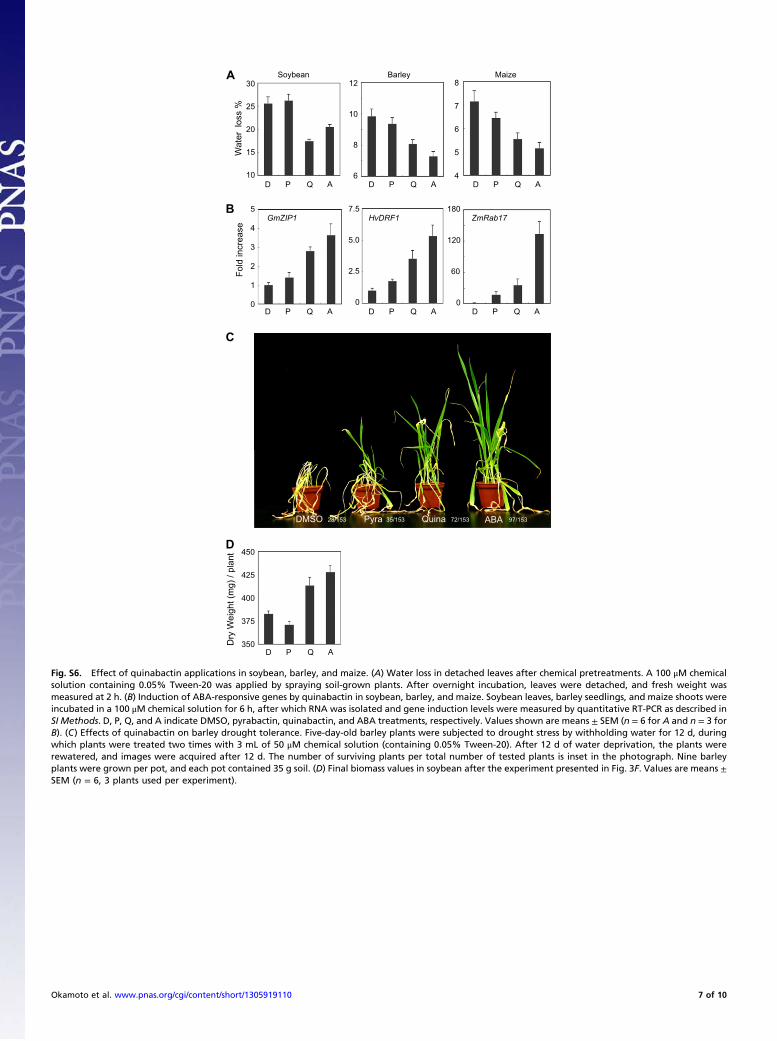
Fig. S6. Effect of quinabactin applications in soybean, barley, and maize. (A) Water loss in detached leaves after chemical pretreatments. A 100 μM chemicalsolution containing 0.05% Tween-20 was applied by spraying soil-grown plants. After overnight incubation, leaves were detached, and fresh weight wasmeasured at 2 h. (B) Induction of ABA-responsive genes by quinabactin in soybean, barley, and maize. Soybean leaves, barley seedlings, and maize shoots wereincubated in a 100 μM chemical solution for 6 h, after which RNA was isolated and gene induction levels were measured by quantitative RT-PCR as described inSI Methods. D, P, Q, and A indicate DMSO, pyrabactin, quinabactin, and ABA treatments, respectively. Values shown are means ± SEM (n = 6 for A and n = 3 forB). (C) Effects of quinabactin on barley drought tolerance. Five-day-old barley plants were subjected to drought stress by withholding water for 12 d, duringwhich plants were treated two times with 3 mL of 50 μM chemical solution (containing 0.05% Tween-20). After 12 d of water deprivation, the plants wererewatered, and images were acquired after 12 d. The number of surviving plants per total number of tested plants is inset in the photograph. Nine barleyplants were grown per pot, and each pot contained 35 g soil. (D) Final biomass values in soybean after the experiment presented in Fig. 3F. Values are means ±SEM (n = 6, 3 plants used per experiment).
Okamoto et al. www.pnas.org/cgi/content/short/1305919110 7 of 10

A
B
Wild type DMSO Pyra Quina ABA
aba2
Fres
h w
eigh
t (m
g)
0
100
200
300
Wild type DMSO Pyra Quina ABA
aba2
Fig. S7. Complementation of the aba2 growth defect by quinabactin. Chemical solutions (25 μM) containing 0.05% Tween-20 were applied to 14-d-old plantstwice over a 2-wk period, after which the plants were photographed (A), and aerial fresh weight was determined (B). Values are means ± SEM (n = 6).
Fig. S8. Unbiased electron density in the PYL2 binding pocket. (A) The Fo-Fc density present after several rounds of refinement of the PYL2:quinabactin:HAB1structural model in the absence of ligand. (B) The shape of the unbiased electron density allowed us to unambiguously place quinabactin into the structuralmodel. Correct placement of quinabactin is supported by a real space correlation coefficient of 0.91 between the unbiased electron density and the modeledquinabactin.
Okamoto et al. www.pnas.org/cgi/content/short/1305919110 8 of 10
PYL2:ABA:HAB1
PYL1:pyrabactin:ABI1
PYL2:quinabactin:HAB1
PY
L2
:q
uin
ab
ac
tin
HA
B1
A
B
C
D
E
F
G
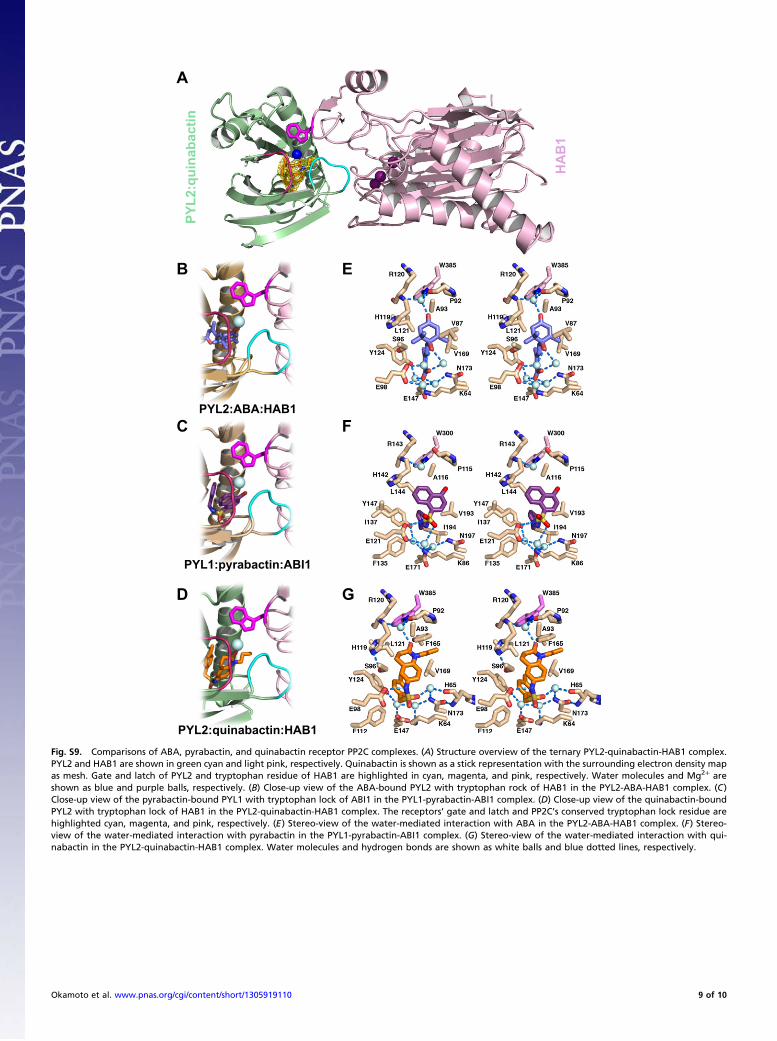
Fig. S9. Comparisons of ABA, pyrabactin, and quinabactin receptor PP2C complexes. (A) Structure overview of the ternary PYL2-quinabactin-HAB1 complex.PYL2 and HAB1 are shown in green cyan and light pink, respectively. Quinabactin is shown as a stick representation with the surrounding electron density mapas mesh. Gate and latch of PYL2 and tryptophan residue of HAB1 are highlighted in cyan, magenta, and pink, respectively. Water molecules and Mg2+ areshown as blue and purple balls, respectively. (B) Close-up view of the ABA-bound PYL2 with tryptophan rock of HAB1 in the PYL2-ABA-HAB1 complex. (C)Close-up view of the pyrabactin-bound PYL1 with tryptophan lock of ABI1 in the PYL1-pyrabactin-ABI1 complex. (D) Close-up view of the quinabactin-boundPYL2 with tryptophan lock of HAB1 in the PYL2-quinabactin-HAB1 complex. The receptors’ gate and latch and PP2C’s conserved tryptophan lock residue arehighlighted cyan, magenta, and pink, respectively. (E) Stereo-view of the water-mediated interaction with ABA in the PYL2-ABA-HAB1 complex. (F) Stereo-view of the water-mediated interaction with pyrabactin in the PYL1-pyrabactin-ABI1 complex. (G) Stereo-view of the water-mediated interaction with qui-nabactin in the PYL2-quinabactin-HAB1 complex. Water molecules and hydrogen bonds are shown as white balls and blue dotted lines, respectively.
Okamoto et al. www.pnas.org/cgi/content/short/1305919110 9 of 10

Table S1. X-ray data collection and refinement statistics
PYL2:quinabactin:HAB1 (refinement)
Data collectionSpace group P212121Cell dimensions
a, b, c (Å) 60.7, 66.8, 146.0α, β, γ (°) 90, 90, 90
Resolution (Å) 50–1.98 (2.01–1.98)Rmerge 0.088 (0.566)I/σI 20.4 (2.2)Completeness (%) 97.4 (86.0)Redundancy 7.1 (6.4)
RefinementResolution (Å) 29.7–1.98 (2.03–1.98)No. reflections 38,879Rwork/Rfree 0.199/0.225No. atoms 4,124Protein 3,760Ligand/ion 39Water 325B-factors
Protein 34.1Ligand/ion 35.2Water 38.2
r.m.s. deviationsBond lengths (Å) 0.007Bond angles (°) 0.906
Values in parentheses are for highest-resolution shell. A single crystal wasused for each structure determination.
Table S2. Primer sequences used for quantitative RT-PCR
AGI gene code Abbreviation Forward primer Reverse primer
ArabidopsisAT1G05100 MAPKKK18 AAGCGGCGCGTGGAGAGAGA GCTGTCCATCTCTCCGTCGCAT5G52310 RD29A TGAAGTGATCGATGCACCAGG GACACGACAGGAAACACCTTTGAT5G52300 RD29B TATGAATCCTCTGCCGTGAGAGGTG ACACCACTGAGATAATCCGATCCTAT4G34000 ABF3F GTTGATGGTGTGAGTGAGCAGC AACCCATTACTAGCTGTCCCAAGInternal control ACT2 CTCATGAAGATCCTTACAG CTTTCAGGTGGTGCAACGAC
SoybeanGmNAC4 ACGTCAGTTCCGCAAAAGAT GGACCCGTTGGTTTCTCACGmbZIP1 GGGAATGGGAATTTGGGTGAGAA CCTTCTGCCAGGGCTAGCATG
Internal control Gm18S CCTGCGGCTTAATTTGACTCAAC TAAGAACGGCCATGCACCABarley
HVA1 AACACGCTGGGCATGGGAG CGAACGACCAAACACGACTAAAHvDRF1 CGGGCGGCGCGATTGCGAGC ACGGAATTAGGGCCATCACG
Internal control Hvtubulin2 TCCATGATGGCCAAGTGTGA GACATCCCCACGGTACATGAGMaize
ZmLEA GCAGCAGGCAGGGGAGAA GCCGAGCGAGTTCATCATCInternal control ZmUbi TGCCGATGTGCCTGCGTCGTCTGGTGC TGAAAGACAGAACATAATGAGCACAG
Dataset S1. Arabidopsis ATH1 array data for DMSO, ABA, pyrabactin, and quinabactin treatments of Arabidopsis seedling
Dataset S1 (XLS)
Okamoto et al. www.pnas.org/cgi/content/short/1305919110 10 of 10