Supporting Information for - The Royal Society of Chemistry · Supplementary Information for...
28
Supplementary Information for Self-assembly and optical properties of porphyrin-based amphiphile Ruijiao Dong, a Yang Bo, b Gangsheng Tong, b Yongfeng Zhou, a Xinyuan Zhu* a and Yunfeng Lu* a,c a School of Chemistry and Chemical Engineering, State Key Laboratory of Metal Matrix Composites, Shanghai Jiao Tong University, 800 Dongchuan Road, Shanghai 200240, P. R. China b Instrumental Analysis Center, Shanghai Jiao Tong University, 800 Dongchuan Road, Shanghai 200240, P. R. China c Department of Chemical and Biomolecular Engineering, University of California, Los Angeles, California 90095, United States * To whom correspondence should be addressed. Tel.: +86-21-34203400; E-mail: [email protected]; [email protected] Contents 1. Materials 2. Instruments and Measurements 3. Synthesis Details 4. Self-Assemblies of Porphyrin-Based Nanoparticles 5. Supplemented Figures 6. References 1. Materials Electronic Supplementary Material (ESI) for Nanoscale. This journal is © The Royal Society of Chemistry 2014
Transcript of Supporting Information for - The Royal Society of Chemistry · Supplementary Information for...

Supplementary Information for
Self-assembly and optical properties of porphyrin-based amphiphile
Ruijiao Dong,a Yang Bo,b Gangsheng Tong,b Yongfeng Zhou,a Xinyuan Zhu*a and
Yunfeng Lu*a,c
a School of Chemistry and Chemical Engineering, State Key Laboratory of Metal Matrix
Composites, Shanghai Jiao Tong University, 800 Dongchuan Road, Shanghai 200240, P.
R. Chinab Instrumental Analysis Center, Shanghai Jiao Tong University, 800 Dongchuan Road,
Shanghai 200240, P. R. Chinac Department of Chemical and Biomolecular Engineering, University of California, Los
Angeles, California 90095, United States
* To whom correspondence should be addressed. Tel.: +86-21-34203400; E-mail:
[email protected]; [email protected]
Contents1. Materials
2. Instruments and Measurements
3. Synthesis Details
4. Self-Assemblies of Porphyrin-Based Nanoparticles
5. Supplemented Figures
6. References
1. Materials
Electronic Supplementary Material (ESI) for Nanoscale.This journal is © The Royal Society of Chemistry 2014

Pyridine-4-carboxaldehyde (97%, Alfa Aesar), pyrrole (≧98%, Alfa Aesar),
propanoic acid (PPA) (99%, Shanghai Sinopharm Chemical Reagent Co. Ltd.),
iodoethane (99%, Shanghai Aladdin Reagent Co. Ltd.), were used as received. 4-
Bromomethyl azobenzene was synthesized according to the reported synthesis
procedure,[1] and the detailed characterization data of this monomer was presented in our
previous work.[2] α-Cyclodextrin (α-CD) (Shanghai Sinopharm Chemical Reagent Co.
Ltd.) was dried for 48 h at 60 oC in vacuum oven before use. Dimethyl formamide (DMF)
from Shanghai Sinopharm Chemical Reagent Co. Ltd. was treated with calcium hydride
(CaH2) and distilled before use. Dimethyl sulphoxide (DMSO), methanol (MeOH),
ethanol (EtOH), acetone, diethyl ether from Shanghai Sinopharm Chemical Reagent Co.,
Ltd, and distilled water were used as received.
2. Instruments and MeasurementsNuclear Magnetic Resonance (NMR)
One-dimensional 1H-NMR spectra of the samples were recorded on a Varian
Mercury plus 400 NMR spectrometer (400 MHz) with deuterated chloroform (CDCl3),
deuterated dimethyl sulfoxide (DMSO-d6) and DMSO-d6/deuterium oxide (D2O) (v/v, 1/1)
as solvents at 293 K. The chemical shifts were referenced to residual peaks of deuterated
solvents: DMSO-d6 (2.48 ppm), D2O (4.80 ppm), CDCl3 (7.26 ppm).
Ultra Performance Liquid & Quadrupole-Time-of-Flight Mass
Spectrometer (UMS) (UPLC & Q-TOF-MS)UPLC & Q-TOF-MS spectra of the products (TPyP, TEtPyP and TAzoPyP) were
collected on a Waters-ACQUITYTM UPLC & Q-TOF-MS Premier (Waters Corporation,
USA) at room temperature with methanol as the solvent. After being separated through
UPLC columns, the samples were then analyzed by using Q-TOF-MS.
Fourier Transform Infrared Spectra (FTIR)
FTIR spectra of the products (TPyP, TEtPyP and TAzoPyP) were recorded on a
Paragon 1000 instrument by using the KBr sample holder method. The samples were
firstly dried for 30 min to eliminate the residual moisture before measurement.
Dynamic Light Scattering (DLS)DLS measurement was performed on a Malvern Zetasizer NanoS apparatus
equipped with a 4.0 mW laser operating at the wavelength of 633 nm. All sample
solutions were measured at a scattering angle of 90o at 25 oC. Before testing, the sample
solution was filtered to get rid of dust by using some absorbent cotton. The concentration
of sample solutions was 0.5 mg/mL. The sample solution was placed in the cell for at
least 10 min prior to the measurement to allow for thermal equilibration.
Atomic Force Microscopy (AFM)The morphology of TAzoPyP monomer in different solvents and TAzoPyP/α-CD
complex in water was visualized using an atomic force microscopy (AFM) system with
the Dimension 3100 model with a Nanoscope IIIa controller (Veeco, Santa Barbara, CA).
The sample solutions with a concentration of approximate 0.1 mg/mL were dropped onto
freshly cleaved mica sheets for 5 min, and then the excess solution was removed with a
piece of filter paper. After a subsequent air-drying in the dark for 48 h, the samples were
kept in the dark for AFM measurement. The samples were imaged using the tapping
mode with setting of 256×256 pixels. Image analysis was performed using Nanoscope
software after removing the background slope by flatting images.
Transmission Electron Microscopy (TEM)TEM measurement was carried out on a JEOL JEM-100CX-II instrument at a
voltage of 200 kV. The specimens were prepared by directly drop-casting the sample

solution onto a carbon-coated copper grid and then air-drying at room temperature for 48
h before measurement.
Ultraviolet-Visible Absorption Spectra (UV-Vis)The UV-Vis absorption spectra of the sample solutions were obtained on a Thermo
Electron-EV300 UV-Vis spectrophotometer at room temperature. The slit-width was set
as 1 nm, and scan speed was set as 480 nm/min.
Steady-State Fluorescence Emission SpectraThe fluorescence emission spectra were collected at room temperature on a PTI-
QM/TM/IM steady-state & time-resolved fluorescence spectrofluorometer, made by
USA/CAN Photon Technology International Int.. The excitation wavelength of the
sample solutions was set at 360 nm or 415 nm for TAzoPyP as well as 394 nm for TPP.
The slit-width was set as 2 nm or 4 nm, and the scan speed was set as 480 nm/min. The
sample solutions were maintained in the fluorescence cuvette for 10 min prior to the
measurement to allow for thermal equilibration.
Time-Resolved Fluorescence SpectraBy using the time-correlated single-photon counting (TCSPC) technique, the time-
resolved fluorescence spectra were recorded on a PTI-QM/TM/IM steady-state & time-
resolved fluorescence spectrofluorometer, made by USA/CAN Photon technology
international Int.. Utilizing the picosecond pulses from a doubled frequency, the time-
resolved fluorescence spectra of the sample solutions with the excitation wavelength of
415 nm were detected at an emission wavelength of 655 nm for TAzoPyP in DMSO or
MeOH and 700 nm for TAzoPyP or TAzoPyP/α-CD in water for lifetime measurements
with an emission polarizer and depolarizer.

Zeta Potential MeasurementThe zeta potentials (ζ) of TAzoPyP or TAzoPyP/α-CD complex in PBS buffer (pH =
7.4) were measured on a Malvern Zetasizer NanoS at 25 oC. The cuvette was filled with
the sample solution, and the measurement was performed in the ζ-model for a minimum
of 10 cycles and a maximum of 100 cycles.
Circular Dichroism Spectra (CD)CD spectra of TAzoPyP in different solvents were taken on a JASCO J-815
spectropolarimeter fitted with DRCD apparatus from 200 nm to 500 nm at room
temperature.
Wide-angle X-ray diffraction (WAXD)WAXD was performed on a D/max-2200/PC diffractometer at room temperature,
made by Japan Rigaku Corporation (Cu K radiation λ = 0.154 nm, U = 40 kV, I = 100
mA). The XRD patterns for all samples were collected in 2 range of 3o–50o. The
samples were prepared by directly casting the sample solution onto a clean glass slide and
then air-drying at room temperature for 48 h to form a sample film.
3. Synthesis Details3.1 Synthesis of 5,10,15,20-tetra-(4-pyridyl)-porphyrin (TPyP)

Scheme S1 Synthesis route of TPyP.
According to previous literature,[3] pyridine-4-carboxaldehyde (15.0 g, 140 mmol)
was dissolved in propionic acid (300 mL), pyrrole (9.4 g, 140 mmol) was added, and the
mixture was refluxed for 1 h in the dark. The solvent was evaporated and the residue was
dried under a vacuum. The crude product was taken in DMF (100 mL) and filtered. The
product was washed with DMF (2×50 mL) and diethyl ether (2×50 mL) and dried under a
vacuum at 80 oC. Yield: 2.75 g, purple solid (4.45 mmol, 19.2%).
1H-NMR (CDCl3, 400 MHz) (Fig. S1): δH (ppm) = -2.94 (s, -NH- on porphyrin group,
2H), 8.12-8.23 (m, -CH=CH-N= on Py-group, 8H), 8.87 (s, -CH=CH- on porphyrin
group, 8H), 9.03-9.12 (m, =CH-N=CH- (close to N) on Py-group, 8H). UPLC & Q-
TOF-MS of TPyP (Fig. S2): calculated for [C40H26N8+H]+: 619.2280, found m/z:
619.2365 [M+H]+. FTIR (KBr) (Fig. S3): ν (cm-1) = 536, 663, 726, 796 (C-H), 879, 973,
1072 (C-N), 1218, 1353, 1402, 1468, 1549, 1591 (C=C), 1664 (C=N), 2375, 3026, 3090,
3309/3419 (N-H).

Fig. S1 1H-NMR spectrum of TPyP in CDCl3.
Fig. S2 UPLC & Q-TOF-MS spectrum of TPyP.

Fig. S3 FTIR spectrum of TPyP.
3.2 Synthesis of 5,10,15,20-tetra-(4-N-ethylpyridyl)-porphyrin
tetraiodide (TEtPyP)
Scheme S2 Synthesis route of TEtPyP.
The synthesis procedure of TEtPyP is conducted as follows. TPyP (0.337 g, 0.545
mmol) was dissolved in DMF (60 mL) and excess iodoethane (6.4 mL, 80 mmol) was
added. The resulting solution was heated at 100 oC for 24 h. After being cooled to room
temperature, acetone (100 mL) was added into the solution, and the formed precipitate
was filtrated off, washed with diethyl ether and acetone for three times, collected and
dried at 80 oC in vacuum to yield a brown powder (1.13 g, 0.91 mmol, 91%).

1H-NMR (DMSO-d6, 400 MHz) (Fig. S4): δH (ppm) = -3.10 (s, NH on porphyrin group,
2H), 1.90 (t, J = 7.3 Hz, -CH2CH3, 12H), 5.01 (d, J = 7.2 Hz, -CH2CH3, 8H), 9.01 (d, J =
6.4 Hz, -CH=CH-N+= on Py-group, 8H), 9.24 (s, -CH=CH- on porphyrin group, 8H),
9.58 (d, J = 6.4 Hz, =CH-N+=CH- (close to N+) on Py-group, 8H). UPLC & Q-TOF-MS
of TEtPyP (minus four iodine anions) (Fig. S5): calculated for [C48H46N8]2+: 367.1911 or
[C48H46N8]3+: 244.7941, found m/z: 367.1840 [M]2+ or 244.7873 [M]3+. FTIR (KBr) (Fig.
S6): ν (cm-1) = 525, 720, 802, 872, 972, 1085, 1165 (C-N), 1225, 1352, 1393, 1452 (C-H
on ethyl), 1510, 1558 (C=C), 1633 (C=N+), 2375, 3026, 3318/3423 (N-H). UV-Vis
(MeOH) (Fig. S7): λA (nm) = 425 (Soret band of porphyrin), 516/552/591 (Q band of
porphyrin).
Fig. S4 1H-NMR spectrum of TEtPyP in DMSO-d6.

Fig. S5 UPLC & Q-TOF-MS spectrum of TEtPyP.
Fig. S6 FTIR spectrum of TEtPyP.

Fig. S7 UV-Vis spectrum of TEtPyP in MeOH. The concentration of sample solutions
was 1×10⁻⁵ M.
3.3 Synthesis of 5,10,15,20-tetra-(4-N-methyl-azobenzene-pyridyl)-
porphyrin tetrabromide (TAzoPyP)
Scheme S3 Synthesis route of TAzoPyP.
A solution of Azo-Br (1.2 g, 4.36 mmol) and TPyP (0.337 g, 0.545 mmol) in 50 mL

DMF was allowed to react at 100 oC for 24 h. After being cooled to room temperature,
the formed precipitate was filtrated and washed with ethyl ether and acetone for three
times, collected and dried at 80 oC in vacuum to yield a brown powder (0.825 g, 0.48
mmol, 88.05%).
1H-NMR (DMSO-d6, 400 MHz) (Fig. S8): δH (ppm) = -3.10 (s, NH on porphyrin group,
2H), 6.35 (s, N+(Py)-CH2-Ph, 8H), 7.63 (m, H on Azo group, 12H), 7.95 (m, H on Azo
group, 8H), 8.12 (s, H on Azo group, 16H), 9.07 (d, J = 6.43, -CH=CH-N+= on Py-group,
8H), 9.24 (s, -CH=CH- on porphyrin group, 8H), 9.73 (d, J = 6.40, =CH-N+=CH- (close
to N+) on Py-group, 8H). UPLC & Q-TOF-MS of TAzoPyP (minus four bromide anions)
(Fig. S9): calculated for [C92H70N16]2+: 699.2982, found m/z: 699.2883 [M]2+. FTIR
(KBr) (Fig. S10): ν (cm-1) = 552, 640, 689, 721, 799, 852, 972, 1008, 1155 (C-N), 1211,
1293, 1402, 1450 (C-H on ethyl), 1508, 1558 (C=C), 1632 (C=N+), 2375, 3038,
3316/3416 (N-H). UV-Vis (MeOH) (Fig. S11): λA (nm) = 322 (π-π* transition of trans-
Azo), 429 (Soret band of porphyrin), 519/554/592 (Q band of porphyrin).

Fig. S8 1H-NMR spectrum of TAzoPyP in DMSO-d6.
Fig. S9 UPLC & Q-TOF-MS spectrum of TAzoPyP.
Fig. S10 FTIR spectrum of TAzoPyP.

Fig. S11 UV-Vis spectrum of TAzoPyP in MeOH. The concentration of sample solutions
was 1×10⁻⁵ M.
4. Self-Assemblies of Porphyrin-Based NanoparticlesA) Self-assembly of TAzoPyP nanopartciles
The TAzoPyP nanoparticles were prepared according to the following procedures: 2
mL of DMSO solution containing 10 mg TAzoPyP was slowly added dropwise via a
syringe pump into 10 mL of deionized water for about 2 h under vigorous stirring. Then,
the resulting solution was left at room temperature with constant stirring for another 2 h
after the addition was completed. Subsequently, the self-assembled solution enclosed in a
dialysis membrane (MWCO = 2.0 kDa), was dialyzed against deionized water for 48 h to
remove DMF. Finally, the volume of the resulting aqueous solution was then made up to
20 mL to obtain an aggregate solution with a concentration of 0.5 mg/mL for further
experiments. Notes: The above experimental procedures were carried out in the dark.

B) Self-assembly of TAzoPyP/α-CD supramolecular nanopartcilesThe supramolecular nanoparticles were prepared according to the following
procedures: 10 mg of TAzoPyP (1 equiv.) and 24 mg of α-CD (4 equiv.) were firstly
dissolved in 2 mL DMSO with continuous stirring for 6 h to obtain TAzoPyP/α-CD4
complex. The above solution was then added dropwise via a syringe pump into 10 mL of
deionized water for about 2 h under vigorous stirring. After stirring another 2 h, the
resulting solution was followed by dialysis in a dialysis membrane (MWCO = 2.0 kDa)
against deionized water for 48 h to remove DMF. Finally, the volume of the resulting
aqueous solution was increased to 20 mL to obtain an aggregate solution with a
concentration of 0.5 mg/mL (for TAzoPyP only) for further experiments. Notes: The
above experimental procedures were carried out in the dark.
5. Supplemented Figures5.1. Determination of association constant for Azo/α-CD system
Fig.. S12 The UV absorption of azobenzene upon stepwise addition excess α-CD in
MeOH/H2O (v/v, 1/1). The concentration of azobenzene was 1×10⁻⁵ M.
As shown in Fig. S12, the association constant between azobenzene and α-CD in
MeOH/H2O (v/v, 1/1) was determined by following the UV absorptions at 381 nm. The

concentration of azobenzene was set at 1×10⁻⁵ M. With the addition of α-CD, the
absorption of azobenzene gradually enhanced. Since α-CD can exactly form a 1:1
inclusion complex with azobenzene, the inclusion complexation of α-CD (H) with
azobenzene (G) is expressed by the following equations, respectively:
We employed the usual double reciprocal plot according to the modified Hidebrand-
Benesi equation:
Where H, G, Ka represents guest (azobenzene), host (α-CD) and association
constant, respectively. ΔA denotes the absorbance difference before and after host
molecules are added. Δε, which denotes the difference of the molar extinction coefficient
between the host and host-guest complex at the same wavelength, is 4.38×10² M-1cm-1
for Azo/α-CD system. The association constant Ka is calculated by the equation:
Where k is the slope value of the line plot, and b is the intercept of the line plot.

5.2. TEM image of TAzoPyP/α-CD supramolecular nanoparticles
Fig. S13 Large-scale TEM image of TAzoPyP/α-CD supramolecular nanoparticles.
According to the TEM observation in Fig. S13, the TAzoPyP/α-CD supramolecular
complex in water exhibits well-defined spherical nanoparticles with uniform size and
dispersion. The statistic size of the obtained supramolecular nanoparticles based on the
TEM image is approximately 35 nm, which is in good agreement with the hydrodynamic
diameter of 46±1.4 nm determined by DLS.

5.3. Determination of zeta potentials of TAzoPyP-based nanoparticles
Fig. S14 Zeta potentials of TAzoPyP nanoparticles and TAzoPyP/α-CD supramolecular
nanoparticles in PBS buffer (pH = 7.4) with the same TAzoPyP concentration of 0.1
mg/mL.
5.4. UV-Vis spectra of TEtPyP in different solvents
Fig. S15 Normalized UV-Vis spectra of TEtPyP in DMSO and H2O at room temperature.

As shown in Fig. S15, the UV-Vis spectrum of TEtPyP in DMSO is characterized
by two main absorption bands for the Soret band of the porphyrin chromophore at ca. 425
nm along with the Q band of the porphyrin chromophore from 500 to 650 nm. We found
that no apparent aggregates could be observed when TEtPyP was dissolved in DMSO,
suggesting that TEtPyP remains predominantly unimolecular in DMSO. In addition, the
UV adsorption band (Soret band of the porphyrin) of TEtPyP in water shows a slight blue
shift compared with that in the good solvent of DMSO, indicating that TEtPyP adopts a
H-type aggregation in the aqueous medium. Since this blue shift of the Soret band of the
porphyrin chromophore is relatively small, it implies that the intermolecular π-π stacking
interaction of TEtPyP in water is very weak due to its high water-solublity.
5.5. Molecular Model of TAzoPyP
Fig. S16 Molecular model of TAzoPyP and its molecular size according to the Chem 3D
results.

5.6. XRD analyses for TAzoPyP and the resulting aggregates
Fig. S17 XRD patterns of TAzoPyP in DMSO, TAzoPyP in MeOH, TAzoPyP NPs and
TAzoPyP/α-CD NPs in 2θ range of 0o–50o. All samples were measured at room
temperature.
In order to get more insight into the phase in the material, wide-angle XRD was
performed for these TAzoPyP-based systems. In Fig. S17, the wide-angle XRD profile
for TAzoPyP in DMSO shows not only a broad peak at wide angle around 20.88°, but
also several sharp peaks at small angle (2θ = 3.4o, 6.8o and 10.2o), indicating that the
crystal exists in the casting film from unimolecular TAzoPyP. For TAzoPyP nanosheets
in MeOH, its wide-angle XRD pattern also shows a broad peak at wide angle around
20.88° and a sharp peak at small angle 4.78°. The peak at 2θ = 4.78° is a first-order
diffraction and indicates a lamellar structure, which is consistent with the results of AFM,
TEM and UV-Vis analyses. However, these wide-angle XRD patterns for TAzoPyP NPs
and TAzoPyP/α-CD NPs only exhibit a broad peak at wide angle around 20.88° and no
sharp peak can be observed at small angle, suggesting that no crystal exists in these
spherical nanoparticles. It might be concluded that the disordered stacking of TAzoPyP
molecules in these nanoparticles greatly restricts the formation of crystal.
5.7. Donor-acceptor pairs between azobenzene and porphyrin in
TAzoPyP
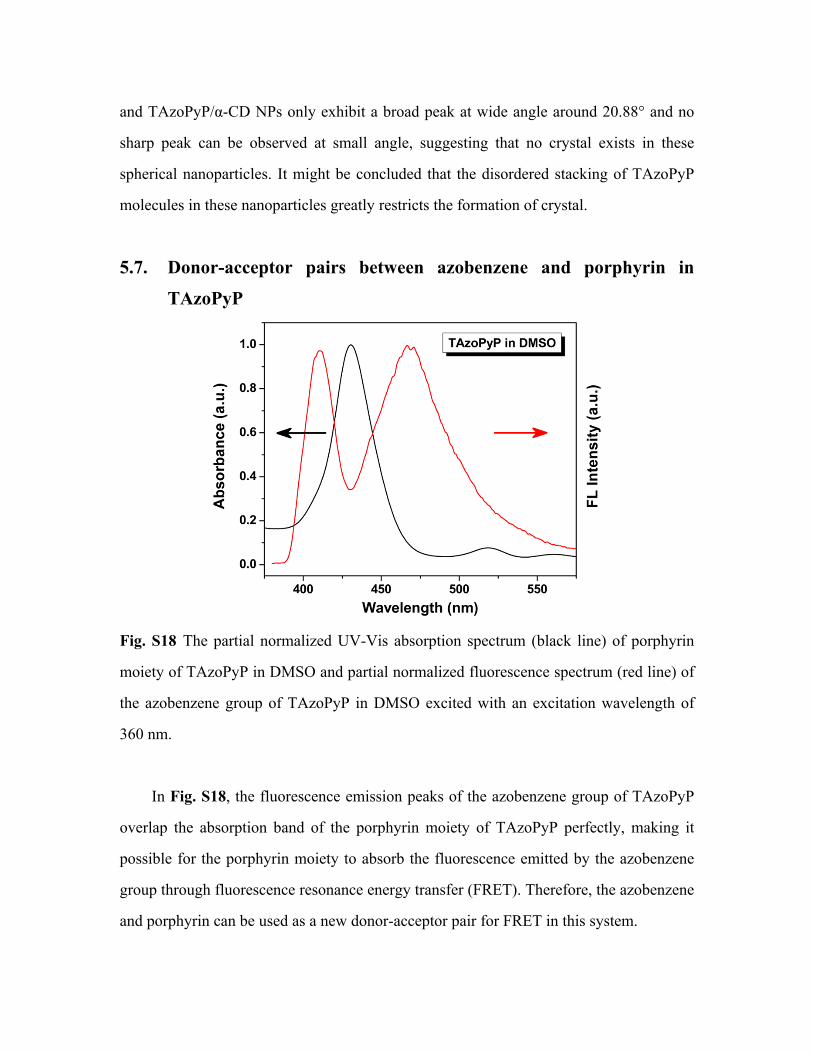
Fig. S18 The partial normalized UV-Vis absorption spectrum (black line) of porphyrin
moiety of TAzoPyP in DMSO and partial normalized fluorescence spectrum (red line) of
the azobenzene group of TAzoPyP in DMSO excited with an excitation wavelength of
360 nm.
In Fig. S18, the fluorescence emission peaks of the azobenzene group of TAzoPyP
overlap the absorption band of the porphyrin moiety of TAzoPyP perfectly, making it
possible for the porphyrin moiety to absorb the fluorescence emitted by the azobenzene
group through fluorescence resonance energy transfer (FRET). Therefore, the azobenzene
and porphyrin can be used as a new donor-acceptor pair for FRET in this system.

5.8. Fluorescence excitation spectra of TAzoPyP in MeOH
Fig. S19 Fluorescence excitation spectra of TAzoPyP in MeOH as well as its resulting
aggregates dispersed in H2O with an excitation wavelength of 415 nm at room
temperature. The concentration of the sample solutions was set as 1×10⁻⁵ M.
In Fig. S19, the appearance of a new excitation peak at ca. 440 nm demonstrates the
formation of a large number of aggregates for TAzoPyP in MeOH. When the resulting
lamellar aggregates were transferred from MeOH to the aqueous medium, the
intermolecular π-π stacking interactions of TAzoPyP in water further led to the formation
of a heirachical π-stacking aggregates. Accordingly, a weakening and broadening
excitation peak can be observed. In addition, it was found that the addition of α-CD into
the resulting aqueous solution hardly affected the aggregation behavior of TAzoPyP
lamellar structures.

5.9. Fluorescence emission spectra of TAzoPyP in MeOH
Fig. S20 Fluorescence emission spectra of TAzoPyP in MeOH as well as its resulting
aggregates dispersed in H2O with an excitation wavelength of 415 nm at room
temperature. The concentration of sample solutions was 1×10⁻⁵ M.
In Fig. S20, the steady-state fluorescence spectrum of TAzoPyP in MeOH upon
direct excitation of the porphyrin moiety at 415 nm just presents two diagnostic
fluorescence emission bands for the porphyrin moiety at 650 and 715 nm, while only a
single fluorescence emission peak can be observed for the aqueous solution of the
lamellar aggregates dispersed in water. In contrast to TAzoPyP in MeOH, the lamellar
aggregates dispersed in water show a fluorescence band red-shifting in position and
decreasing in intensity, which is mainly caused by the intermolecular π-π stacking
interaction of TAzoPyP in water. Besides, the addition of α-CD has little effect on the
fluorescent behavior of the aqueous solution of the lamellar aggregates.

5.10. Fluorescence excitation/emission spectra of TPP in THF
Fig. S21 Fluorescence excitation/emission spectra of TPP in THF excitated at 394 nm at
room temperature. The concentration of sample solutions was 1×10⁻⁵ M.
5.11. Fluorescence lifetime of TPP in THF
Fig. S22 Time-resolved fluorescence spectrum of TPP in THF with an excitation
wavelength of 394 nm. The concentration of sample solutions was 1×10⁻⁵ M.

As a control, the time resolved fluorescence spectrum of the THF solution of TPP
has been given in Fig. S22. Furthermore, TPP in THF with 394 nm excitation yields a
decay best fit to a single exponential decay with a long lifetime (τFl) component of 12.15
ns, which is very close to the lifetime value of 13.2 ns for TPP in toluene.[4]
5.12. TAzoPyP in DMSO by photo-irradiation
Fig. S23 UV-Vis spectra of TAzoPyP in DMSO at the initial state, after UV-365
irradiation for 5 min and after Vis-450 irradiation for 10 min. The concentration of the
sample solutions was 10 μM.
In Fig. S23, when the DMSO solution of TAzoPyP was irradiated by UV light for 5
min, a significant decrease in the absorption intensity for the azobenzene group at ca. 324
nm can be observed, which is indicative of the photoisomerization of azobenzene from
the trans-form to the cis-form. Meanwhile, the absorption peak for the porphyrin is
greatly reduced, which implies that the photobleaching behavior of porphyrin occurrs.[5]
Furthermore, by irradiation with Vis light at 450 nm for 10 min, the absorption band for

the azobenzene group at ca. 324 nm reverts back to the its initial intensity, indicating that
the azobenzene group of TAzoPyP undergoes a reversible photoisomerization from the
cis-form to the trans-form. In addition, the porphyrin moiety of TAzoPyP exhibits an
irreversible photobleaching upon alternating irradiation with UV and Vis light.
5.13. TAzoPyP in MeOH by photo-irradiation
Fig. S24 (a) UV-Vis spectra of TAzoPyP in MeOH (c = 10 μM) at the initial state, after
UV-365 irradiation for 5 min and after Vis-450 irradiation for 10 min. (b) The
hydrodynamic diameter variation of the aggregates for TAzoPyP in MeOH by UV-365 or
Vis-450 irradiation.
In Fig. S24a, the absorption intensity of TAzoPyP in MeOH remains constant upon
alternating UV and Vis irradiation, which indicates that the TAzoPyP nanosheets in
MeOH could hardly respond to UV and Vis light illumination. The photoisomerization of
azobenzene group and photobleaching of porphyrin moiety have been greatly suppressed
by the intermolecular π-π stacking interaction of TAzoPyP in MeOH. As shown in Fig.
S24b, we monitored the change in size of the lamellar aggregates dispersed in water
before and after UV irradiation by using the DLS. The hydrodynamic diameter of the
lamellar aggregates still remains constant at around 130 nm after UV irradiation. In
addition, the addition of α-CD slightly affects the photostability of the lamellar

aggregates.
5.14. TEtPyP in DMSO and H2O by photo-irradiation
Fig. S25 UV-Vis spectra of (a) TEtPyP in DMSO and (b) TEtPyP in H2O (c = 10 μM)
at the initial state, after UV-365 irradiation for 5 min and after Vis-450 irradiation for 10
min.
As shown in Fig. S25a, the absorption band (e.g., Soret band) of TEtPyP in DMSO
greatly decreases under UV and Vis irradiation, suggesting that the TEtPyP in DMSO can
respond mechanically to light illumination. In contrast, TEtPyP in water exhibits high
photostability, so that the absorption intensity of TEtPyP in water yet remains constant
upon alternating UV and Vis irradiation (Fig. S25b).
6. References[1] Z. Liu and M. Jiang, J. Mater. Chem., 2007, 17, 4249–4254.
[2] R. J. Dong, Y. Liu, Y. F. Zhou, D. Y. Yan and X. Y. Zhu, Polym. Chem., 2011, 2,
2771–2274.
[3] S. Sugata, S. Yamanouchi and Y. Matsushima, Chem. Pharm. Bull., 1977, 25, 884–
889.
[4] J.-P. Strachan, S. Gentemann, J. Seth, W. A. Kalsbeck, J. S. Lindsey, D. Holten and D.

F. Bocian, J. Am. Chem. Soc., 1997, 119, 11191–11201.
[5] (a) J. D. Spikes, Photochem Photobiol., 1984, 39, 797–808; (b) T. S. Mang, T. J.
Dougherty, W. R. Potter, D. G. Boyle, S. Somer and J. Moan, Photochem Photobiol.,
1987, 45, 501–506; (c) R. Bonnett, B. D. Djelal, P. A. Hamilton, G. Martinez and F.
Wierrani, J. Photochem. Photobiol. B, 1999, 53, 136–143.