Benzothiadiazole substituted aza‐BODIPY dyes: two‐photon ...

Supporting Information for
Visualization of Tyrosinase Activity in Melanoma Cells by a BODIPY-Based Fluorescent Probe
Tae-Il Kim,a Jihye Park,
a Seonwha Park,
b Yongdoo Choi*
b and Youngmi Kim*
a
a Department of Chemistry, Dankook University, 126 Jukjeon-dong, Yongin-si, Gyeonggi-do, 448-701, Korea
b Molecular Imaging & Therapy Branch, National Cancer Center, 323 Ilsan-ro, Goyang-si, Gyeonggi-do 410-769, Korea
Tel: +82 31-8005-3156
Fax: +82 31-8005-3148
Tel: +82 31-920-2512
Fax: +82 31-920-2529
Table of Contents:
1. Synthesis of compounds
2. Studies of photophysical properties
3. Stability studies
4. Enzymatic oxidation of probe by tyrosinase
5. Analysis of reaction product by LC-MS
6. Selectivity test
7. Cell studies
8. 1H-NMR and
13C-NMR Spectra
9. References
Electronic Supplementary Material (ESI) for Chemical CommunicationsThis journal is © The Royal Society of Chemistry 2011

Experimentals
Materials
All reagents were of the highest commercial quality and used as received without further purification. All
solvents were spectral grade unless otherwise noted. Anhydrous CH2Cl2 and THF were obtained
as a sure-seal bottle from Aldrich Co. Inc. (Milwaukee, WI). Silica gel (40 m) was obtained
from Merck Inc. Aqueous solutions were freshly prepared with deionized water from a water
purification system (Human Corp. Korea). 2,4-Dimethylpyrrole (2), 3,4-bisbenzyloxybenzaldehyde (3),
L-DOPA were purchased from Aldrich Co. Inc. (Milwaukee, WI). Tyrosinase (EC 1.14.18.1, 4276
U/mg) from mushroom and miconazole were purchased from Sigma. Kojic acid and anisaldehyde for
inhibition assay were purchased from TCI Co. Inc. (Tokyo), and benzaldehyde and benzoic acid were
purchased from Aldrich Co. Inc. (Milwaukee, WI), respectively.
General methods, instrumentation and measurements
Synthetic manipulations that required an inert atmosphere (where noted) were carried out under argon
using standard Schlenk techniques. NMR (1H,
13C) spectra were recorded on Bruker 400 MHz or 500
MHz spectrometers. The chemical shift data for each signal are given in uni ts of δ (ppm) relative to
tetramethylsilane (TMS) where δ (TMS) = 0, and referenced to the residual solvent resonances. Splitting
patterns are denoted as s (singlet), d (doublet), t (triplet), q (quartet), m (multiplet), and br (broad).
High-resolution FAB-MS or ESI-MS were obtained at national center for inter-university research
facilities. Absorption spectra were obtained on a Shimadzu UV-2501 spectrophotometer. Fluorescence
measurements were recorded on a Hitachi F-7000 fluorescence spectrophotometer using 10 mm quartz
cuvettes with a path length of 1 cm. Fluorescence quantum yields were determined by standard methods,
using fluorescein (ΦF = 0.95 in 0.1 N NaOH) as a standard. The reaction with tyrosinase was measured
by monitoring changes in fluorescence intensity using a Synergy Mx Microplate Reader (BioTek, USA).
1. Synthesis of compounds
Scheme S1. Synthetic scheme of probe 1 and 1-Q, Reagents and conditions a) i) TFA, THF, 6 h, r.t., ii)
DDQ, CH2Cl2, 5 h, r.t., iii) TEA, BF3∙OEt2, overnight, r.t., 49%; b) H2, Pd/C, MeOH/CHCl3, overnight, r.t.,
78%; c) FeCl3, MeOH, r.t., 45%.
8-[3,4-Bis(benzyloxy)phenyl]-1,3,5,7-tetramethyl-4,4-difluoro-4-bora-3a,4a-diaza-s-indacene (4)1
To a stirred mixture of 2,4-dimethylpyrrole (410 µL, 4.0 mmol) and 3,4-bisbenzyloxybenzaldehyde (640 mg,
2.0 mmol) in dry THF (250 mL) was added 2 drops of TFA under argon atmosphere. The reaction was
stirred at room temperature until TLC showed complete consumption of the 3,4-bisbenzyloxybenzaldehyde.
To the reaction solution was added DDQ (500 mg, 2.2 mmol) that was dissolved in dry CH2Cl2 (150 mL).
After the solution was stirred at room temperature for 6 h, triethylamine (4 mL, 23 mmol) and BF3∙OEt2 (3
mL, 24 mmol) were added sequentially to the reaction mixture via syringe, and the resulting solution was
stirred for overnight. After the reaction was completed, the reaction solution was evaporated under vacuum
and extracted with CH2Cl2. The separated organic fractions were dried with MgSO4, filtered, and evaporated
under vacuum to yield a black crude compound. The crude product was purified by column chromatography
on silica gel using progressively more polar 25:1 to 10:1 hexanes : ethyl acetate as the mobile phase to
afford 4 as a red solid (525 mg, 49%).; 1H-NMR (400 MHz, CDCl3): δ = 7.39-7.16 (m, 10H), 6.92 (d, 1H,
J = 8 Hz), 6.72 (s, 1H), 6.65 (d, 1H, J = 8 Hz), 5.85 (s, 2H), 5.14 (s, 2H), 5.08 (s, 2H), 2.45 (s, 6H), 1.22
(s, 6H); 13
C-NMR (100 MHz, CDCl3): δ = 155.1, 149.1, 143.0, 141.1, 136.5, 136.4, 131.4, 128.4, 128.3,
Electronic Supplementary Material (ESI) for Chemical CommunicationsThis journal is © The Royal Society of Chemistry 2011

127.8, 127.8, 127.7, 127.3, 127.1, 120.9, 120.8, 115.5, 114.6, 71.2, 70.8, 14.5, 14.2; HR-MS (ESI): calcd. for
C33H31BF2N2O2. [M+H]+ 537.2517, found 537.2525.
8-(3,4-Dihydroxyphenyl)-1,3,5,7-tetramethyl-4,4-difluoro-4-bora-3a,4a-diaza-s-indacene (1)1
A mixture of 4 (165 mg, 0.31 mmol) and 10% Pd/C (183 mg, 56 mol % Pd) in 50 mL of 2:3 CHCl3/MeOH
was stirred under a H2 atmosphere (1 atm) at room temperature for 24 h. The mixture was filtered through
Celite, and the filter cake was washed with MeOH and EtOAc. The dark-brown crude solid was purified by
column chromatography on silica gel using progressively more polar 3:1 to 1:1 hexanes : ethyl acetate as the
mobile phase to afford 1 as a red solid (86 mg, 78%).; 1H-NMR (500 MHz, CD3OD): δ = 6.93 (d, 1H, J =
4.0 Hz), 6.69 (s, 1H), 6.58 (dd, 1H, J = 2.0, 4.0 Hz), 6.04 (s, 2H), 2.47 (s, 6H), 1.55 (s, 6H); 13
C-NMR (125
MHz, CD3OD): δ = 154.9, 146.4, 143.5, 143.0, 131.8, 126.0, 120.8, 119.3, 116.0, 115.0, 13.5, 13.4; HR-MS
(FAB): calcd. for C19H19BF2N2O2. [M]+ 356.1507, found 356.1508.
8-(o-Quinone)-1,3,5,7-tetramethyl-4,4-difluoro-4-bora-3a,4adiaza-s-indacene (1-Q)1
A solution of 1 (40 mg, 122 µmol) was mixed with a solution of FeCl3 (911 mg, 5.61 mmol) in 10 mL of
MeOH and the resulting mixture was stirred at room temperature for 30 min. The mixture was diluted with
H2O (50 mL) and extracted with CHCl3, The combined organic layer was dried over MgSO4, filtered and
the solvent was evaporated under reduced pressure. The crude product was purified by column
chromatography on silica gel using progressively more polar 10:1 to 3:1 hexanes : ethyl acetate as the
mobile phase to afford 1-Q as a red-purple solid (18 mg, 45%).; 1H-NMR (400 MHz, CDCl3): δ = 6.91 (d,
1H, J = 10 Hz), 6.57 (d, 1H, J = 10 Hz), 6.45 (s, 1H), 6.03 (s, 2H), 2.49 (s, 6H), 2.13 (s, 6H); 13
C-NMR (100
MHz, CDCl3): δ = 178.7, 178.2, 157.8, 146.8, 141.5, 140.8, 134.2, 131.6, 130.3, 128.3, 122.2, 15.8, 14.8;.
HR-MS (ESI): calcd. for C19H17BF2N2O2. [M+Na]+ 377.1241, found 377.1247.
2. Studies of photophysical properties
Absorption and emission spectra of compounds
300 400 500 600 7000.0
0.1
0.2
0.3
0.4
0.5
Wavelength (nm)
Ab
so
rba
nc
e
Flu
ore
sc
en
ce
Inte
ns
ity (a
.u.)
Probe 1
300 400 500 600 7000.0
0.1
0.2
0.3
0.4
0.5
Compound 1-Q
Wavelength (nm)
Ab
so
rba
nc
e
Flu
ore
sc
en
ce
Inte
ns
ity (a
.u.)
Figure S1. Absorption (dashed lines) and emission spectra (solid lines) of probe 1 (left) and compound 1-Q
(right) in PBS buffer (50 mM, pH 6.3) containing 0.2% DMSO as a cosolvent at 25 ℃. Excited at 465 nm.
[1] = [1-Q] = 5 µM.
Table S1. Photophysical properties of probe 1 and compound 1-Qa
Compound λabs, max
[nm]
εb
[M-1
cm-1
]
λem, maxc
[nm]
ΦFLd
Probe 1 496 8.8 × 10⁴ 512 0.001
Compound 1-Q 498 7.5 × 10⁴ 515 0.018
aData were obtained in PBS buffer (50 mM, pH 6.3) containing 0.2% DMSO as a cosolvent at 25 ℃. bMeasured at each absorption maximum.
cExcited at 465 nm.
dQuantum yields vs. fluorescein in 0.1 N
NaOH (ΦF = 0.95).2
Electronic Supplementary Material (ESI) for Chemical CommunicationsThis journal is © The Royal Society of Chemistry 2011

3. Stability studies
Photostability test of probes 1 and compound 1-Q in aqueous solution
We have investigated photostabilities of 1 and 1-Q in PBS buffer (50 mM, pH 6.3, 0.2% DMSO, 25 ℃) in
the presence of oxygen. The photooxidation studies were performed by continuous UV irradiation of each
compound using a 150-W steady-state Xe lamp as the irradiation source. The photoinduced degradation
was quantified by monitoring the fluorescence intensity of each compound as a function of elapsed
photolysis time. Negligible changes in the fluorescence intensity of 1 and 1-Q were observed after 2.5
hours of irradiation at 465 nm.
0 1500 3000 4500 6000 7500 90000.0
0.2
0.4
0.6
0.8
1.0
1.2
Probe 1
Compound 1-Q
F/F
0
Time (sec)
Figure S2. Photostability of probe 1 and compound 1-Q in PBS buffer (50 mM, pH 6.3, 25 oC) containing
0.2% DMSO as a cosolvent. Fluorescence intensity was measured at 512 nm for probe 1 and at 515 nm for
compound 1-Q. Excited at 465 nm. [1] = [1-Q] = 5 µM.
Chemical stability test of probe 1 and compound 1-Q in aqueous solution
The chemical stabilities for probe 1 and compound 1-Q were examined by monitoring change of
fluorescence intensity of each compound in PBS buffer (50 mM, pH 6.3, 0.2% DMSO, 25 ℃) in the
presence of oxygen. As a result, negligible changes in the fluorescence intensity of 1 and 1-Q were observed
even after 5 hours. Therefore, background fluorescence due to competing non-enzymatic oxidation would be
minimal.
475 500 525 550 575 600 625 6500
9
18
27
36
45
0 50 100 150 200 250 3000.0
0.2
0.4
0.6
0.8
1.0
1.2
F/F
0
Time (min)
Flu
ore
sc
en
ce
In
ten
sit
y (
a.u
.)
Wavelength (nm)
Figure S3. Chemical stability of probe 1 (5 µM) in PBS buffer (50 mM, pH = 6.3, 0.2% DMSO, 25 oC) in
the presence of O2. The emission spectra were obtained every 0.5 hour (0 – 5 hour). Excited at 465 nm.
Inset shows the relative fluorescence intensity at 512 nm versus incubation time.
Electronic Supplementary Material (ESI) for Chemical CommunicationsThis journal is © The Royal Society of Chemistry 2011

475 500 525 550 575 600 625 6500
25
50
75
100
125
0 50 100 150 200 250 3000.0
0.2
0.4
0.6
0.8
1.0
1.2
F/F
0
Time (min)
Flu
ore
sc
en
ce
In
ten
sit
y (
a.u
.)
Wavelength (nm)
Figure S4. Chemical stability of 1-Q (5 µM) in PBS buffer (50 mM, pH = 6.3, 0.2% DMSO, 25 oC). The
spectra were obtained every 1 hour (0 – 5 hour). Excited at 465 nm. Inset shows the relative fluorescence
intensity at 515 nm versus incubation time.
Absorption and emission spectra of probe 1 and compound 1-Q as a function of pH
350 400 450 500 550 600 6500.0
0.1
0.2
0.3
0.4
0.5 pH 4.0
pH 5.0
pH 6.3
pH 7.0
pH 7.4
pH 8.0
Wavelength (nm)
Ab
so
rba
nc
e
475 500 525 550 575 600 625 6500
7
14
21
28
35 pH 4.0
pH 5.0
pH 6.3
pH 7.0
pH 7.4
pH 8.0
Flu
ore
sc
en
ce
In
ten
sit
y (
a.u
.)
Wavelength (nm)
Figure S5. Absorption (left) and emission spectra (right) of probe 1 (5 µM) in different pH buffer systems
containing 0.2% DMSO as a cosolvent at 25 oC. Excited at 465 nm.
4 5 6 7 80.0
0.1
0.2
0.3
0.4
0.5
Probe 1Ab
so
rba
nc
e
pH
4 5 6 7 80
15
30
45
60
75 Probe 1
Flu
ore
sc
en
ce
in
ten
sit
y (
a.u
.)
pH
Figure S6. Effect of pH on the absorbance (left) and fluorescence (right) intensities of probe 1 at 25 oC. [1]
= 5 µM. Absorbance at 496 nm and emission at 512 nm were recorded.
Electronic Supplementary Material (ESI) for Chemical CommunicationsThis journal is © The Royal Society of Chemistry 2011

350 400 450 500 550 600 6500.0
0.1
0.2
0.3
0.4
0.5 pH 4.0
pH 5.0
pH 6.3
pH 7.0
pH 7.4
pH 8.0
Wavelength (nm)
Ab
so
rba
nc
e
475 500 525 550 575 600 625 6500
25
50
75
100
125 pH 4.0
pH 5.0
pH 6.3
pH 7.0
pH 7.4
pH 8.0
Flu
ore
sc
en
ce
In
ten
sit
y (
a.u
.)
Wavelength (nm)
Figure S7. Absorption (left) and emission spectra (right) of probe 1-Q (5 µM) in different pH buffer
systems containing 0.2% DMSO as a cosolvent at 25 oC. Excited at 465 nm.
4 5 6 7 80.0
0.1
0.2
0.3
0.4
0.5
Compound 1-Q
Ab
so
rba
nc
e
pH4 5 6 7 8
0
25
50
75
100
125
Compound 1-Q
Flu
ore
sc
en
ce
in
ten
sit
y (
a.u
.)
pH
Figure S8. Effect of pH on the absorbance (left) and fluorescence (right) intensities of compound 1-Q at 25 oC. [1-Q] = 5 µM. Absorbance at 498 nm and emission at 515 nm were recorded.
0 1 2 3 4 50
12
24
36
48
60
pH 4.0
pH 5.0
pH 6.3
pH 7.0
pH 7.4
pH 8.0
Flu
ore
sc
en
ce
in
ten
sit
y (
a.u
.)
Time (hour)0 1 2 3 4 5
0
1
2
3
4
5 pH 4.0
pH 5.0
pH 6.3
pH 7.0
pH 7.4
pH 8.0
F/F
0
Time (hour)
Figure S9. Stability of probe 1 in different pH buffer systems containing 0.2% DMSO as a cosolvent at 25 oC. The spectra were obtained with excitation at 465 nm every 0.5 hour (0 – 5 hour). Fluorescence intensity
was measured at 512 nm. [1] = 5 µM.
Electronic Supplementary Material (ESI) for Chemical CommunicationsThis journal is © The Royal Society of Chemistry 2011

4. Enzymatic oxidation of probe by tyrosinase
4.1. Optimization conditions for tyrosinase assays
Enzyme assay with probe 1 in various buffer systems
In order to determine the optimal pH condition for the enzyme-catalyzed reaction, tyrosinase-mediated
oxidation of probe 1 was investigated in 50 mM phosphate-buffered solution at pH values of 6.3, 7.0, and
7.4. The maximum fluorescence response was observed at pH 6.3 (Figure S10). It was consistent with the
optium pH of tyrosinase activity reported in the literature.3
0 50 100 150 200 250 3000
5
10
15
20
25 pH 6.3
pH 7.0
pH 7.4
Without tyrosinase (pH 6.3)
F/F
0
Time (min)
Figure S10. Fluorescence response of probe 1 (1 µM) upon incubation with tyrosinase (90 nM)/O2 at 37 oC
in PBS buffer solution (50 mM, 0.2% DMSO) at various pH conditions. Excited at 465 nm. The spectra
were obtained every 30 min (0 – 300 min). Fluorescence intensity was measured at 515 nm.
Effect of O2 on the tyrosinase assay
0 50 100 150 200 250 3000
4
8
12
16
20 Tyrosinase + O2
Tyrosinase + Ar
Only O2 (no Tyrosinase)
F/F
0
Time (min)
Figure S11. Relative fluorescence response of probe 1 (1 µM) in PBS buffer (50 mM, pH 6.3, 37 oC)
containing 0.2% DMSO as a cosolvent upon incubation with tyrosinase (90 nM) in the presence of oxygen
(blue) and in the presence of argon but in the absence of oxygen (black). Each assay solution was prepared
by bubbling with oxygen or argon for 30 min, respectively. The spectra were obtained every 30 min (0 – 300
min) with excitation at 465 nm. Fluorescence intensity was measured at 515 nm. The bottom plot (red)
shows fluorescence response of probe 1 in the only presence of oxygen but the absence of tyrosinase.
Electronic Supplementary Material (ESI) for Chemical CommunicationsThis journal is © The Royal Society of Chemistry 2011

Enzyme assay with probe 1 at various concnetrations
0 50 100 150 200 250 3000
4
8
12
16
20 1 M Probe 1
5 M Probe 1
10 M Probe 1
Without tyrosinase
F/F
0
Time (min)
Figure S12. Relative fluorescence intensity (F/F0) of probe 1 at different concentrations (1, 5, 10 µM) upon
incubation with tyrosinase (90 nM)/O2 in PBS buffer (50 mM, pH 6.3, 37 oC) containing 0.2% DMSO as a
cosolvent. The spectra were obtained every 30 min (0 – 300 min). Fluorescence intensity was measured at
515 nm with excitation at 465 nm.
Enzyme assay with probe 1 as a function of concentration of tyrosinase
Tyrosinase was dissolved in PBS buffer (50 mM, pH 6.3) containing 0.2% DMSO as a cosolvent and
diluted with the buffer solution to make different tyrosinase concentrations. Tyrosinase solution (20 μL)
was mixed with the probe 1 (20 μL) solution in buffer solution (50 mM PBS, pH 6.3, 160 μL). Final
probe concentration in the solution was 1 μM, and the tyrosinase concentration was 0, 0.1, 0.5, 1.0, 5.0,
10, 22.5, 45, 67.5, 90 nM, respectively. Fluorescence intensity at 515 nm was recorded after incubation
for different time periods using a computer-controlled fluorescence plate reader.
0 10 20 30 40 50 60 70 80 900
2000
4000
6000
8000
10000
0.0 0.2 0.4 0.6 0.8 1.00
500
1000
1500
2000
2500
Flu
ore
scen
ce In
ten
sit
y (
a.u
.)
[Tyrosinase] (nM)
Flu
ore
sc
en
ce
In
ten
sit
y (
a.u
.)
[Tyrosinase] (nM)
Y = 76X + 1170
R2 = 0.998
Figure S13. Fluorescence response of 1 µM probe 1 upon (left) 60 min and (right) 300 min incubation with
different amounts of tyrosinase (from 0 to 90 nM) in PBS buffer (50 mM, pH 6.3, 37 oC) containing 0.2%
DMSO as a cosolvent. Excited at 465 nm. Fluorescence intensity was measured at 515 nm. Inset shows
fluorescence response of probe 1 upon incubation with low concentrations of tyrosinase (detection limit: 0.5
nM).
0 10 20 30 40 50 60 70 80 900
5000
10000
15000
20000
25000
Flu
ore
sc
en
ce
In
ten
sit
y (
a.u
.)
[Tyrosinase] (nM)
Y = 40X + 1649
R2 = 0.998
Electronic Supplementary Material (ESI) for Chemical CommunicationsThis journal is © The Royal Society of Chemistry 2011

Enzyme assay with probe 1 as a function of incubation time
475 500 525 550 575 600 625 6500
300
600
900
1200
1500
300 min
0 50 100 150 200 250 3000
5
10
15
20
25
F/F
0
Time (min)
Flu
ore
sc
en
ce
In
ten
sit
y (
a.u
.)
Wavelength (nm)
0 min
Figure S14. Fluorescence emission spectra of probe 1 (5 µM) upon incubation with tyrosinase (90 nM) for
different time periods in PBS buffer (50 mM, pH 6.3, 37 oC) containing 0.2% DMSO as a cosolvent. Excited
at 465 nm. Inset shows the increase of emission peak at 515 nm over 5 hours with error bars corresponding
to variations over three trials.
4.2. Kinetic studies of probes
To determine the kinetic constants, probe 1 at a series of the final concentrations (0.1–10 M) was
hydrolyzed by tyrosinase (90 nM) in the presence of O2. As standards, enzymatic reaction of L-DOPA,
commercially available tyrosinase substrate, was also measured under the similar conditions. The reaction
was monitored by measuring fluorescence change at 515 nm for probe 1 (excited at 465 nm), and
absorbance at 475 nm for L-DOPA at 37 oC. The initial velocity was calculated from the slope of the each
progress curve. The parameters such as KM and kcat with tyrosinase for probe 1 and L-DOPA were
determined by Lineweaver-Burk plot and listed in Table S2.
Determination of kinetic constants for probe 1
0 2 4 6 8 100
20000
40000
60000
80000
100000
0.0 0.2 0.4 0.6 0.8 1.00
6000
12000
18000
24000
30000
Flu
ore
sc
en
ce
In
ten
sit
y (
a.u
.)
[Probe 1] (M)
y = 25335x + 319
R2 = 0.998
Flu
ore
sc
en
ce
In
ten
sit
y (
a.u
.)
[Probe 1] (M)
Figure S15. Standard fluorescence curve of probe 1 at different concentrations upon incubation with excess
tyrosinase in PBS buffer (50 mM, pH 6.3, 37 oC) containing 0.2% DMSO as a cosolvent. Fluorescence
intensity at 515 nm was measured. [1] = 0–10 μM. Inset shows linear increase of fluorescence intensity of
probe 1 at low concentrations upon incubation with excess tyrosinase.
Electronic Supplementary Material (ESI) for Chemical CommunicationsThis journal is © The Royal Society of Chemistry 2011

0 50 100 150 200 250 3000
5000
10000
15000
20000
25000 0.10 M Probe
0.25 M Probe
0.50 M Probe
0.75 M Probe
1.00 M Probe
2.50 M Probe
5.00 M Probe
10.0 M Probe
Flu
ore
sc
en
ce
In
ten
sit
y (
a.u
.)
Time (min)
0 5 10 15 20 25 300
2000
4000
6000
8000
10000 0.10 M Probe
0.25 M Probe
0.50 M Probe
0.75 M Probe
1.00 M Probe
2.50 M Probe
5.00 M Probe
10.0 M Probe
Flu
ore
sc
en
ce
In
ten
sit
y (
a.u
.)
Time (min)
Figure S16. Fluorescence response of probe 1 by tyrosinase. Progress curves of oxidation of probe 1 at
various concentrations (0.1–10 μM) upon addition of tyrosinase (25 nM). The spectra were obtained every
30 min upto 300 min (left) and 30 min (right). The enzyme reactions were carried out in 50 mM PBS (pH
6.3) containing 0.2% DMSO as a cosolvent at 37 oC. Fluorescence intensity was measured at 515 nm with
excitation at 465 nm.
0 2 4 6 8 100.00000
0.00002
0.00004
0.00006
0.00008
0.00010
0 2 4 6 8 100
60000
120000
180000
240000
300000Y = 25391X + 4753
R2 = 0.997
1/V
0 (M
-1sec)
1/M
Ra
te (M
/se
c)
[Probe 1] (M)
Figure S17. A plot of the initial velocity v0 of the oxidation of probe 1 by tyrosinase (25 nM) versus
concentration of probe 1. Inset represents a double reciprocal (Lineweaver-Burk) plot.
Electronic Supplementary Material (ESI) for Chemical CommunicationsThis journal is © The Royal Society of Chemistry 2011

Determination of kinetic constants for L-DOPA
0 2 4 6 8 100.0
0.5
1.0
1.5
2.0
2.5
Ab
so
rba
nc
e
[L-DOPA] (M)
Y = 0.21x + 0.0057
R2 = 0.998
Figure S18. Standard absorbance curve of L-DOPA at different concentrations upon incubation with excess
tyrosinase in PBS buffer (50 mM, pH 6.3, 37 oC) containing 0.2% DMSO as a cosolvent. Absorption
intensity at 475 nm was measured. [L-DOPA] = 0–10 μM.
0 10 20 30 40 50 600.0
0.3
0.6
0.9
1.2
1.50.10 M L-DOPA
0.50 M L-DOPA
1.00 M L-DOPA
2.50 M L-DOPA
5.00 M L-DOPA
7.50 M L-DOPA
10.0 M L-DOPA
Ab
so
rba
nc
e
Time (min)
Figure S19. Absorbance response of L-DOPA by tyrosinase. Progress curves of oxidation of L-DOPA at
various concentrations (0.1–10 μM) upon addition of tyrosinase (25 nM). The spectra were obtained every 5
min upto 60 min. The enzyme reactions were carried out in 50 mM PBS (pH 6.3) containing 0.2% DMSO as
a cosolvent at 37 oC. Absorption intensity was measured at 475 nm. [Tyrosinase] = 90 nM.
Electronic Supplementary Material (ESI) for Chemical CommunicationsThis journal is © The Royal Society of Chemistry 2011
0 2 4 6 8 100.0000
0.0004
0.0008
0.0012
0.0016
0.0020
0 2 4 6 8 100
5000
10000
15000
20000
25000Y = 2148X + 1309
R2 = 0.986
1/V
0 (M
-1s
ec)
1/MR
ate
(M
/se
c)
[L-DOPA] (M)
Figure S20. A plot of the initial velocity v0 of the oxidation of L-DOPA by tyrosinase (90 nM) versus
concentration of L-DOPA. Inset represents a double reciprocal (Lineweaver-Burk) plot.
Table S2. Kinetic Data for substrates probe 1
Substrate Km (M) kcat (s-1
) kcat/Km (M-1
s-1
)
Probe 1
5.30
0.01
2.0 × 10³
L-DOPA 1.7 0.007 4.0 × 10³
Electronic Supplementary Material (ESI) for Chemical CommunicationsThis journal is © The Royal Society of Chemistry 2011

4.3. Inhibition assay of tyrosinase activity
For inhibition assay of enzyme activity, the final concentrations of mushroom tyrosinase and probe 1
were fixed to 90 nM and 1 μM, respectively. Mushroom tyrosinase inhibitors, kojic acid, benzaldehyde,
anisaldehyde, and benzoic acid were dissolved in PBS buffer (50 mM, pH 6.3, 0.2% DMSO), and then
mixed with 20 μL of tyrosinase solution in 140 μL PBS (50 mM, pH 6.3), respectively. Final
concentrations of kojic acid in the mixed solution were 0 ~ 3 mM, and final concentrations of
benzaldehyde, anisaldehyde, and benzoic acid in the mixed solution were 0 ~ 10 mM. The mixed
solutions were incubated at room temperature for 20 min to inhibit enzyme activity. To the inhibitor-
treated tyrosinase solution was then added 20 μL of probe 1 solution. Enzymatic reaction was performed
by incubating the solution as previously described. Fluorescence at 515 nm was recorded every 30 min
for 300 min at 37 oC using a computer-controlled fluorescence plate reader. IC50 value (the inhibitor
concentration required to reduce enzyme activity by 50%) was obtained from the plot of relative activity
versus inhibitor concentration at 300 min time point.
0 50 100 150 200 250 3000
5000
10000
15000
20000
25000
Flu
ore
sc
en
ce
In
ten
sit
y (
a.u
.)
Time (min)
[kojic acid]
0 50 100 150 200 250 3000
5000
10000
15000
20000
25000
Flu
ore
sc
en
ce
In
ten
sit
y(a
.u.)
Time (min)
[benzaldehyde]
0 50 100 150 200 250 3000
5000
10000
15000
20000
25000
Flu
ore
sc
en
ce
In
ten
sit
y (
a.u
.)
Time (min)
[Anisaldehyde]
0 50 100 150 200 250 3000
5000
10000
15000
20000
25000
Flu
ore
sc
en
ce
In
ten
sit
y (
a.u
.)
Time (min)
[benzoic acid]
Figure S21. Inhibition assay of tyrosinase activity using probe 1 (1 µM) in PBS buffer (50 mM, pH 6.3, 37 oC) containing 0.2% DMSO as a cosolvent. Kinetic profiles of probe 1 (1 µM) after addition of the
tyrosinase (90 nM) solution, which was pretreated with inhibitor kojic acid (top, left), benzaldehyde (top,
right), anisaldehyde (bottom, left), and benzoic acid (bottom, right) at different concentrations, respectively.
Excited at 465 nm.
Electronic Supplementary Material (ESI) for Chemical CommunicationsThis journal is © The Royal Society of Chemistry 2011

5. Analysis of reaction product by LC-MS
Figure S22. HPLC chromatograms of probe 1 without treatment of tyrosinase (top); with tyrosinase
treatment for 3 h at 37 oC (middle); 1-Q only (bottom). The samples were analyzed by LC-MS with a linear
gradient elution (from 0 to 80% B, A: deionized water, B: methanol, flow rate 0.3 mLmin-1
, UV: 340 nm).
The MW of the retention time at 3.1 min is 357.1, which corresponds to [M+H]+ for probe 1 and MW of the
retention time at 7.2 min is 355.1, which corresponds to [M+H]+ for compound 1-Q. [1] = [1-Q] = 10 M,
[tyrosinase] = 90 nM.
A B C
300 350 400 450 500 5500
20
40
60
80
100
m/z
Ab
un
da
nc
e (
%)
357.1 Probe 1
300 350 400 450 5000
20
40
60
80
100
Probe 1
with tyrosinase
m/z
Ab
un
da
nc
e (
%)
355.1
300 350 400 450 500 5500
20
40
60
80
100
1-Q
m/z
Ab
un
da
nc
e (
%)
355.1
Figure S23. ESI-MS spectra of probe 1 (a) without enzyme treatment, (b) after treating with tyrosinase for 3
h, (c) compound 1-Q. MW of the retention time at 3.1 min is 357.1, which corresponds to [M+H]+ for probe
1 and MW of the retention time at 7.2 min is 355.1, which corresponds to [M+H]+ for 1-Q. [1] = [1-Q] = 10
µM, [tyrosinase] = 90 nM
Electronic Supplementary Material (ESI) for Chemical CommunicationsThis journal is © The Royal Society of Chemistry 2011

6. Selectivity test
In order to investigate the selectivity of probe 1 with other oxidized enzyme, we tested fluorescence-turn-on
response of probe 1 with alcohol dehydrogenase (ADH), which is known to facilitate the inter-conversion
between alcohols and aldehyde or ketone, at various assay conditions in terms of pH of assay solution (pH
6.3 and 8.5) and concentrations of ADH (90 nM and 690 nM).
0 50 100 150 200 250 3000
5000
10000
15000
20000
25000 90 nM tyrosinase
90 nM ADH
690 nM ADH
without tyrosinase
Flu
ore
sc
en
ce
In
ten
sit
y (
a.u
.)
Time (min)
0 50 100 150 200 250 3000
3000
6000
9000
12000
15000 90 nM tyrosinase
90 nM ADH
690 nM ADH
without tyrosinase
Flu
ore
sc
en
ce
In
ten
sit
y (
a.u
.)
Time (min)
Figure S24. Fluorescence turn-on response of probe 1 upon incubation with tyrosinase (90 nM) and alcohol
dehydrogenase (ADH, 90 nM and 690 nM)) in (left) PBS buffer (50 mM, pH 6.3, 37 oC) containing 0.2%
DMSO as a cosolvent and (right) Tris buffer (50 mM, pH 8.5, 37 oC) containing 0.2% DMSO as a cosolvent,
respectively. The spectra were obtained every 30 min (0 – 300 min). Fluorescence intensity was measured at
515 nm with excitation at 465 nm.
7. Cell studies
Cell culture
General Cell Culture
B16F10 cells (mouse melanoma cell line) were obtained from the American Type Culture Collection
(ATCC, Rockville, MD). The cells were cultured in high glucose Dulbecco’s Modified Eagle’s Medium
(DMEM) supplemented with 10% heat-inactivated fetal bovine serum (FBS), 1% Antibiotic & Antimycotic,
in a humidified incubator containing 5% CO2 at 37 C.
Cell viability test
B16F10 melanoma cells were seeded in each well of 96-well plates at a density of 20,000 cells/well and
incubated for 24 h for cell attachment. The stock solution of probe 1 dissolved in dimethyl sufoxide (2.5
mM) was diluted with a cell culture medium containing 10% FBS to have a final concentration of 0, 0.5, 1,
2.5, and 5 μM. Existing culture medium was replaced with 200 µL of the fresh one containing probe 1, and
the cells were incubated for 24 h. After washing the cells twice, cell viability was measured using a cell
counting kit-8 (Dojindo Laboratories). Cell viability was calculated as a percentage compared to untreated
control cells. Data are expressed as a mean ± standard deviation. Statistical significance compared to the
untreated control cells was calculated by determining p values by using the t-test.
Confocal fluorescence imaging of tyrosinase activity in melanoma cells
B16F10 cells were plated at a density of 20,000 cells/well in a LabTek II chambered cover glass (Nalge
Nunc International Corp., Rochester, NY) and incubated for 24 h for cell attachment. The stock solution of
probe 1 dissolved in dimethyl sufoxide (2.5 mM) was diluted with a cell culture medium to have a final
concentration of 2.5 M. Cells were incubated in the absence or presence of 100 nM -MSH for 48 h to
observe the effect of -MSH on tyrosinase imaging. To evaluate effect of tyrosinase inhibitors on the
enzyme activity, the other sets of the cells were co-incubated with kojic acid (KA) or miconazole (MIC)
during -MSH for 48 h. Then the existing cell culture medium was replaced with fresh medium containing
Electronic Supplementary Material (ESI) for Chemical CommunicationsThis journal is © The Royal Society of Chemistry 2011

probe 1. After the cells were incubated with for 30 min, they were washed three times and a fresh cell
culture medium was used. Subsequently, fluorescence images (Ex. 488 nm, Em. 505~550 nm) were acquired
using a confocal laser scanning microscope (ZEISS LSM 510 META). For fluorescence imaging, we
randomly selected three different areas from each sample. All the data were acquired using identical settings
on the microscope in order to ensure reproducibility.
Western Blot analysis
Western blot analysis was performed to compare tyrosinase expression depending on the treatment
conditions. B16F10 cells were seeded in 175T flask and incubated for 24 h for cell attachment. Then cells
were incubated in the absence or presence of 100 nM -MSH for 48 h. The other sets of the cells were co-
incubated with kojic acid (100 M, 1 mM, and 5 mM) or miconazole (10 M and 30 M) during -MSH
for 48 h. Cell pellets were lysed in phosphate buffer (pH 6.3) containing 1% triton X-100, 2 mM PMSF and
protease inhibitor cocktail. The cellular extracts were clarified by centrifugation at 13000 rpm for 10 min at
4 C. Protein content was measured using the BCA assay kit (Pierce, Rockford, Ill., USA) with BSA as the
standard. Equal amounts of protein (40 g/lane) were separated on bis-tris gel (invitrogen, NuPAGE Novex)
and transferred to a nitrocellulose membrane (Amersham, U.K.). To minimize the nonspecific binding, the
membrane was incubated at room temperature for 30 min with blocking buffer (5% nonfat milk, 0.1%
Tween20 containing PBS). Primary anti--actin (Santa Cruz biotechnology) was diluted 1:10,000 and anti-
tyrosinase (sc-15341, Santa Cruz, U.S.A.) was diluted 1:200. The blot was incubated with each primary
antibody until the following day (overnight incubation at 4 C). The blot was washed three times with PBST
buffer for 10 minutes each. And it was incubated with a secondary antibody HRP (horseradish peroxidase)-
conjugated mouse immunoglobulin G (Santa Cruz biotechnology) for 1 h at room temperature. The blot was
again washed three times with PBST. After final washing, tyrosinase was visualized by enhanced
chemiluminescent substrate (supersignal west pico chemiluminescent substrate, Thermo Scientific).
Tyrosinase zymography
Tyrosinase activity was determined as previously described with minor modification.4 Briefly, cell lysates
were prepared using the same procedure as above. Cell supernatant was mixed with 2 protein sample buffer
without -mercaptoethanol. Protein samples were denatured with sodium dodecyl sulfate (SDS). 40 g of
total protein per lane was loaded onto a sodium-dodecyl-sulfate (SDS)-polyacrylamide gel. After
electrophoresis, gel was rinsed in 100 mM sodium phosphate buffer (pH 6.5 with oxygen bubbling) for 30
min at room temperature with gentle agitation. After repeating the rinse procedure two more times, the gel
was transferred into 200 mL of a staining solution containing the rinse buffer supplemented with 5 mM L-
DOPA, and incubated in the dark at 37 C. Tyrosinase activity was visualized in the gel as a dark melanin
containing bend.
Electronic Supplementary Material (ESI) for Chemical CommunicationsThis journal is © The Royal Society of Chemistry 2011

Figure S25. Confocal fluorescence microscope images of B16F10 melanoma cells under different
conditions with probe 1. (a) B16F10 melanoma cells were incubated with 2.5 M probe 1 for 30 min at
37 C and then imaged. (b) B16F10 melanoma cells were stimulated with 100 nM -MSH for 48 h, and
incubated with 2.5 M probe 1 for 30 min at 37 C and then imaged. Either kojic acid or miconazole at
various concentrations was co-incubated during -MSH stimulation while the other procedures were the
same. (top: fluorescence images, middle: brightfield images, bottom: merged images, Ex = 488 nm, Em =
505–550 nm)
Figure S26. Western blot analysis of tyrosinase protein expression in B16F10 melanoma. Beta-actin was
served as a loading control.
Figure S27. In vitro tyrosinase activity of B16F10. Tyrosinase activity was determined by L-DOPA
zymography.
Electronic Supplementary Material (ESI) for Chemical CommunicationsThis journal is © The Royal Society of Chemistry 2011
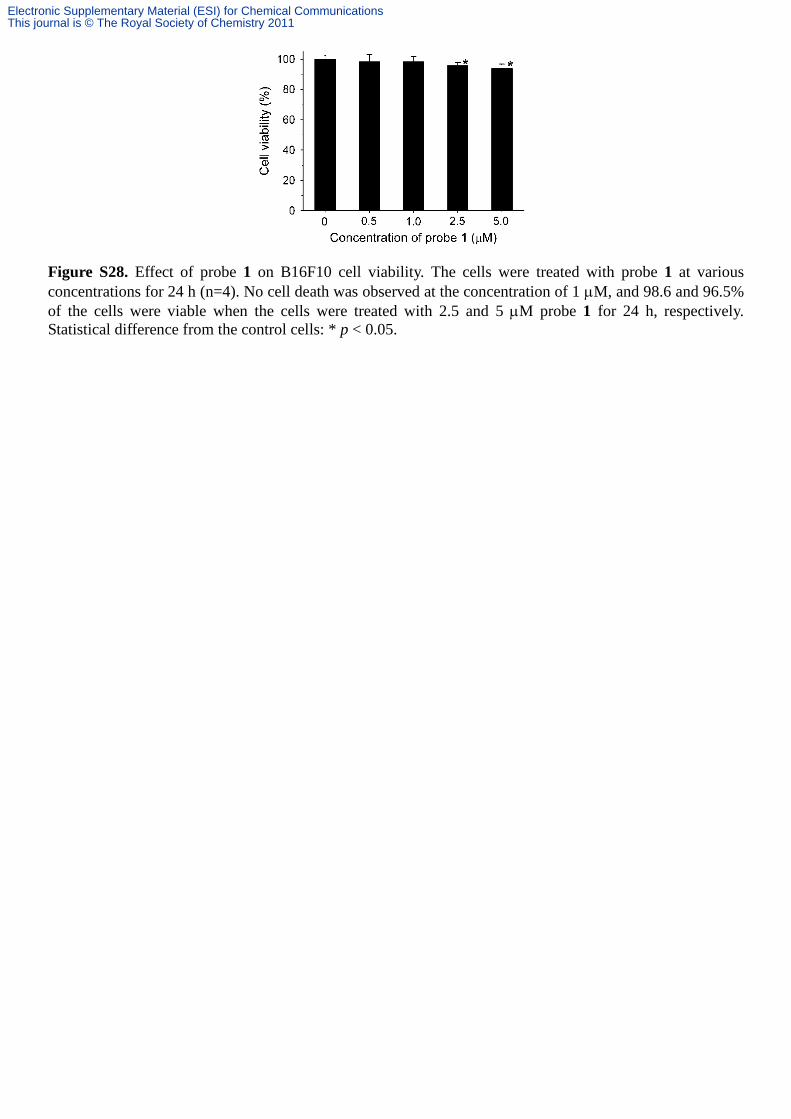
Figure S28. Effect of probe 1 on B16F10 cell viability. The cells were treated with probe 1 at various
concentrations for 24 h (n=4). No cell death was observed at the concentration of 1 M, and 98.6 and 96.5%
of the cells were viable when the cells were treated with 2.5 and 5 M probe 1 for 24 h, respectively.
Statistical difference from the control cells: * p < 0.05.
Electronic Supplementary Material (ESI) for Chemical CommunicationsThis journal is © The Royal Society of Chemistry 2011

8. 1H-NMR and
13C-NMR Spectra
1H-NMR Spectrum of 1 in CDCl3 (500 MHz):
13
C-NMR Spectrum of 1 in CDCl3 (125 MHz):
Electronic Supplementary Material (ESI) for Chemical CommunicationsThis journal is © The Royal Society of Chemistry 2011

1H-NMR Spectrum of 4 in CDCl3 (400 MHz):
13
C-NMR Spectrum of 4 in CDCl3 (100 MHz):
Electronic Supplementary Material (ESI) for Chemical CommunicationsThis journal is © The Royal Society of Chemistry 2011

1H-NMR Spectrum of 1-Q in CDCl3 (400 MHz):
13C-NMR Spectrum of 1-Q in CDCl3 (100 MHz):
Electronic Supplementary Material (ESI) for Chemical CommunicationsThis journal is © The Royal Society of Chemistry 2011

9. References
1 D. P. Kennedy, C. M. Kormos and S. C. Burdette, J. Am. Chem. Soc., 2009, 131, 8578.
2 A. T. R. Williams, S. A. Winfield and J. N. Miller, Analyst, 1983, 108, 1067.
3 F. Gauillard, F. Richard-Forget and J. Nicolas, Anal. Biochem., 1993, 215, 59.
4 Y. J. Shin, C.-S. Han, C. S. Lee, H.-S. Kim, S.-H. Ko, S. K. Hwang, S.-G. Ko, J. W. Shin, S.-K. Ye
and M.-H. Chung, Biol. Pharm. Bull., 2010, 33, 72.
Electronic Supplementary Material (ESI) for Chemical CommunicationsThis journal is © The Royal Society of Chemistry 2011